CHAPTER 5 PRESENTATION AND ANALYSIS OF …€” 96 — CHAPTER 5 PRESENTATION AND ANALYSIS OF...
28
— 96 — CHAPTER 5 PRESENTATION AND ANALYSIS OF QUANTITATIVE DATA 5.1 INTRODUCTION AND PURPOSE OF THIS CHAPTER The problem statement in this study indicates that the purpose of the research was to investigate the variables related to instructional leadership and their contribution to learner performance in the matriculation examination. Chapter 1 reiterated a number of assumptions which suggest that the practice of instructional leadership in schools, as a role enacted by principals, can bring about improvement in learner performance. The assumption that the instructional leadership role of principals is crucial for the improvement of learner performance has been a guiding compass for this study. Based on this assumption, I engaged in this study to investigate, as a first step, the different variables which are related to instructional leadership and their contribution to the improvement of learner performance in the matriculation examination. The investigation was conducted in the following ways: firstly, a literature review of instructional leadership was carried out, secondly, questionnaires were distributed to principals to collect their biographical information; and thirdly, separate questionnaires were distributed to deputy principals and Heads of Departments (HODs) to obtain their perceptions with regard to the role of principals as instructional leaders. Finally, a two- phased interview process was conducted with principals, starting with a focus group interview with sixty principals, followed by a one-on-one interview session with five principals. The purpose of this chapter is to present and analyze the data collected by means of the surveys of the principals, deputy principals and HODs. This chapter presents a justification for the quantitative method used for the first part of the study, discusses measures taken to ensure validity and reliability, and describes the ethical considerations in terms of the involvement of the respondents.
Transcript of CHAPTER 5 PRESENTATION AND ANALYSIS OF …€” 96 — CHAPTER 5 PRESENTATION AND ANALYSIS OF...

— 96 —
CHAPTER 5
PRESENTATION AND ANALYSIS OF QUANTITATIVE DATA
5.1 INTRODUCTION AND PURPOSE OF THIS CHAPTER
The problem statement in this study indicates that the purpose of the research was to
investigate the variables related to instructional leadership and their contribution to learner
performance in the matriculation examination. Chapter 1 reiterated a number of assumptions
which suggest that the practice of instructional leadership in schools, as a role enacted by
principals, can bring about improvement in learner performance.
The assumption that the instructional leadership role of principals is crucial for the
improvement of learner performance has been a guiding compass for this study. Based on
this assumption, I engaged in this study to investigate, as a first step, the different variables
which are related to instructional leadership and their contribution to the improvement of
learner performance in the matriculation examination.
The investigation was conducted in the following ways: firstly, a literature review of
instructional leadership was carried out, secondly, questionnaires were distributed to
principals to collect their biographical information; and thirdly, separate questionnaires were
distributed to deputy principals and Heads of Departments (HODs) to obtain their
perceptions with regard to the role of principals as instructional leaders. Finally, a two-
phased interview process was conducted with principals, starting with a focus group
interview with sixty principals, followed by a one-on-one interview session with five
principals.
The purpose of this chapter is to present and analyze the data collected by means of the
surveys of the principals, deputy principals and HODs. This chapter presents a justification
for the quantitative method used for the first part of the study, discusses measures taken to
ensure validity and reliability, and describes the ethical considerations in terms of the
involvement of the respondents.

— 97 —
5.2 FINDINGS FROM THE LITERATURE REVIEW
Before presenting and analyzing the quantitative data in this chapter and the qualitative data
in the following chapter (chapter 6), the following is a summary of the findings from the
literature review. The reason for this summary of the literature is that the questions for the
questionnaires and the structured interviews were informed by the arguments in the
literature. This presentation is twofold: I present the findings from the literature in general,
and then the findings from the two European countries (Norway and the UK), the two
African countries (Nigeria and South Africa) and the USA.
The literature review generally revealed that instructional leadership, since its conception in
the 1970s and the 1980s, has always been associated with concepts such as classroom
practice, managing teaching and learning, and improvement of learner performance. The
emergence of instructional leadership precipitated an evolutionary shift from managerial
leadership, thus requiring principals to have new skills and competencies. The literature
review also highlighted the fact that instructional leadership differs from other models of
leadership in that it focuses on how principals and teachers may improve teaching and
learning. Instructional leadership focuses on school goals, the curriculum, instruction, and
the school environment (Stewart, 2006:4).
With regard to instructional leadership (IL) in the two African countries (South Africa and
Nigeria), principals in Nigeria perform both instructional leadership and managerial
functions. They ranked academic and instructional activities, including curriculum
development, teaching and instructional supervision, second to staff and learner
management, and financial management, which were treated with much vigour. Mulkeen et
al. (2007) indicate that principals in most African countries do not regard instructional
leadership highly, and thus do not view it as part of their duties. Hoadley, Christie, Jacklin
and Ward (2007) and Bush and Oduro (2006) found that in South Africa, like in many other
African countries, principals have not received adequate training on IL. These researchers
therefore propose that there is a need for a theory of leadership relevant to the South African
context.
The European countries (Norway and the UK) show a different picture to that of the African
countries. In the UK, instructional leadership is not necessarily the responsibility of the
principals in relation to teachers. It extends to the role of teachers in relation to their
— 98 —
learners. In order to enhance the latter, teachers in the UK are expected to create powerful
cognitive and social tasks for their learners and teach them how to make productive use of
such tasks. The purpose of instructional leadership is therefore to facilitate this approach to
teaching and learning. Principals in Norway tend towards a more administrative style of
school leadership rather than an instructional style. The extent to which instructional
leadership is reported in Norway is relatively weak compared to other countries such as the
UK, USA, Nigeria, and South Africa.
The practice of instructional leadership in the USA is conceived as a role carried out by the
principals, with no reference made to teachers, HODs, or even deputy principals (Hallinger,
2005:3). Instructional leadership is not a shared responsibility as is the case in the UK.
Literature has shown that during the 1980s policymakers in the USA encouraged all
principals to assume this role in order to make their schools more effective. The literature
review also revealed that instructional leaders in the USA lead with a combination of
charisma and expertise, which implies that principals need to be trained for this leadership
model.
5.3 PRESENTATION AND INTERPRETATION OF THE QUESTIONNAIRE
RESULTS USING FREQUENCY TABLES
After completing the administration and initial analysis of the questionnaires using SAS, the
BMDP statistical software was used for statistical analysis of the data with the assistance of
the official statisticians at the University of Pretoria. In this chapter, I summarize and
present the results obtained from the completed questionnaires. The results from the focus
group and structured interviews are presented in chapter 6.
For the quantitative data, the analysis of variance (ANOVA), multivariate regression and
correlation analysis were used to compare the variables that emerged from both the
principals‘ and deputy principals‘ questionnaires. ANOVA was used to compare the
qualifications of the participating principals with the outcomes (results) of their schools.
Multivariate regression and correlation analysis were used to deal with the statistical
differences between the variables, ranging from the variables obtained from the biographical
information about the principals, to the four independent variables which were identified for
this study.

— 99 —
It is important at this stage to indicate that during the quantitative data analysis stage, the
three different types of variables (dependent variables, mediating or moderator variables,
and independent variables) were dealt with separately in order to explain whether or not
they influenced learner performance in some way. The following diagram represents the
different variables involved in this analysis:
FIGURE 5.1: Representation of the different variables involved in the analysis
r
Each of the above variables, with its related examples as presented in the figure above, is
explored in the following sections of this chapter.
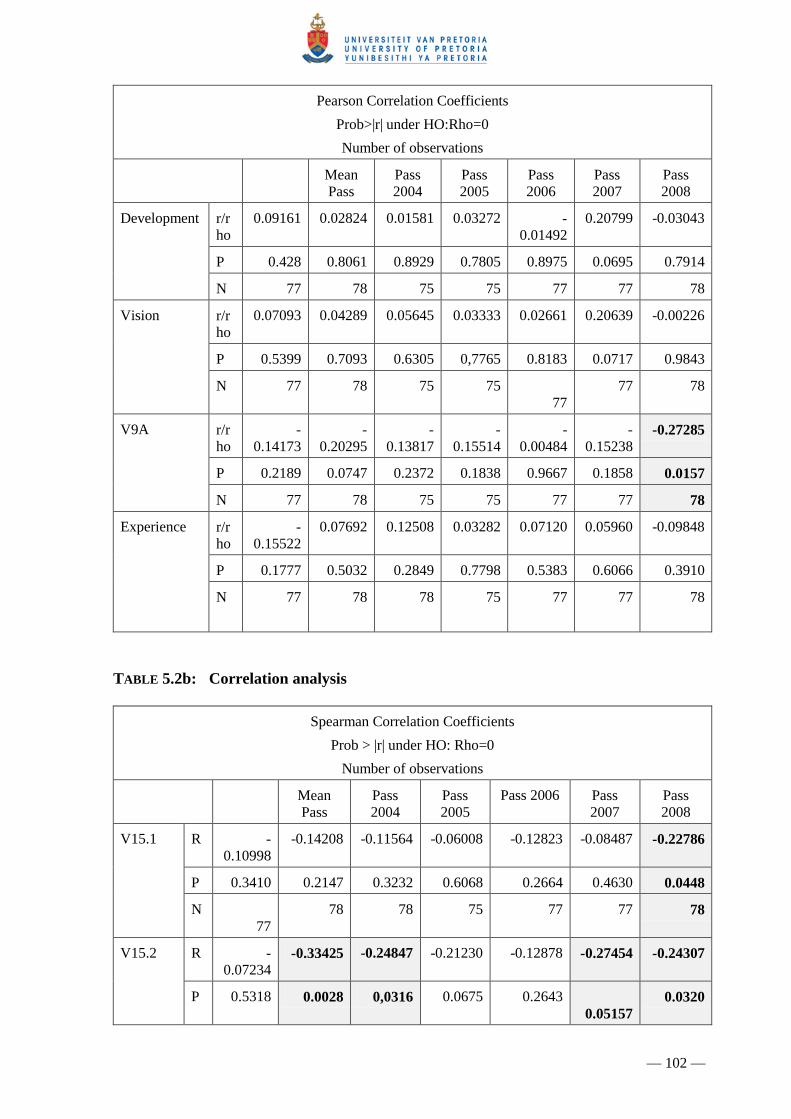
In order to explain the strength of the relationship between the variables, the Pearson
correlation and the Spearman correlation coefficients were used. A Pearson product moment
correlation shows the strength of the relationship between two continuous variables and it is
represented by [r]. The Pearson correlation coefficient is suitable when it can be assumed
that the variables are approximately normally distributed. A Spearman rank order
correlation is used for the same purpose as the Pearson product moment correlation, and it is
represented by [rho]. An r / rho of -1 represents a perfect negative correlation, an r / rho of 1
is a perfect positive correlation, and an r / rho of 0 means there is no correlation. The p value
indicates whether the correlation is statistically significant. Depending on the size of the
sample, even a very weak correlation can be statistically significant and if the sample is very
small, even a very strong correlation may not be statistically significant.
INSTRUCTIONAL
LEADERSHIP
Dependent variables
Pass rate from 2004-2008
Learner performance
Moderator/
Mediating variables
Qualifications and in-
service training; Age;
Gender; Experience
Independent variables
All the FOUR variables
identified for this study

— 100 —
5.4 DETERMINING THE RELIABILITY OF THE QUESTIONNAIRE
CONSTRUCTS USING THE CRONBACH ALPHA
The Cronbach alpha is the most commonly used indicator of internal consistency. It
provides reliability estimates from the consistency of item responses from a single
assessment. The generally agreed upon lower limit for Cronbach‘s alpha is 0.70 (Hair,
Anderson, Tatham & Black, 1998).
According to the exploratory factor analysis conducted by the statisticians to ensure
construct validity of the questionnaire, the 28 items in the deputy principals‘ and HODs‘
questionnaire measured one underlying construct, namely, instructional leadership, in as
much as the four variables identified for this study describe instructional leadership. The
Cronbach alpha value of the raw data was 0.971031, whereas for the standardized data
(when question 18 was removed) it was 0.971021. The Cronbach alpha coefficient for this
study exceeded 0.9, thus satisfying the internal consistency requirements. The following
table presents the qualitative description of the strength of the relationship between the
variables and the quantitative value of [r] and/or [rho].
TABLE 5.1: Qualitative description of the strength of variables
Value of [r] /
[rho]
Percentage
equivalent
Qualitative description of the
strength
-1 -100 Perfect negative
(-1, -0.75) -99 to -75 Strong negative
(-0.75, -0.5) -74 to -50 Moderate negative
(-0,5, -0.25) -49 to -25 Weak negative
(-0.25, 0.25) -24 to 25 No linear association
(0.25, 0.5) 25 to 49 Weak positive
(0.5, 0.75) 50 to 74 Moderate positive
(0.75, 1) 75 to 99 Strong positive
1 100 Perfect positive
The purpose of the above table is to indicate the statistical differences between the variables.
For a p-value of less than 5% (p ≤0.05), the findings are reported as being statistically
significant, whereas for a p-value higher than 5% (p ≥ 0.05), the findings are reported as
being statistically insignificant.

— 101 —
5.5 ANALYSIS OF PRINCIPALS’ QUESTIONNAIRES
This section focuses on the analysis of the questionnaires which were completed by the
principals who participated in this study, using frequency tables. The target sample of
principals who were expected to complete the questionnaire was 114 (n=114). The
questionnaires were packaged according to the number of schools in each of the 14 circuits.
Of the 114 questionnaires that were sent to the schools via the circuits, 78 (68.4%) were
returned and 36 (31.6%) were not returned. Several attempts were made to obtain more
responses, including issuing additional copies to the non-respondents, but still the
outstanding questionnaires were not returned.
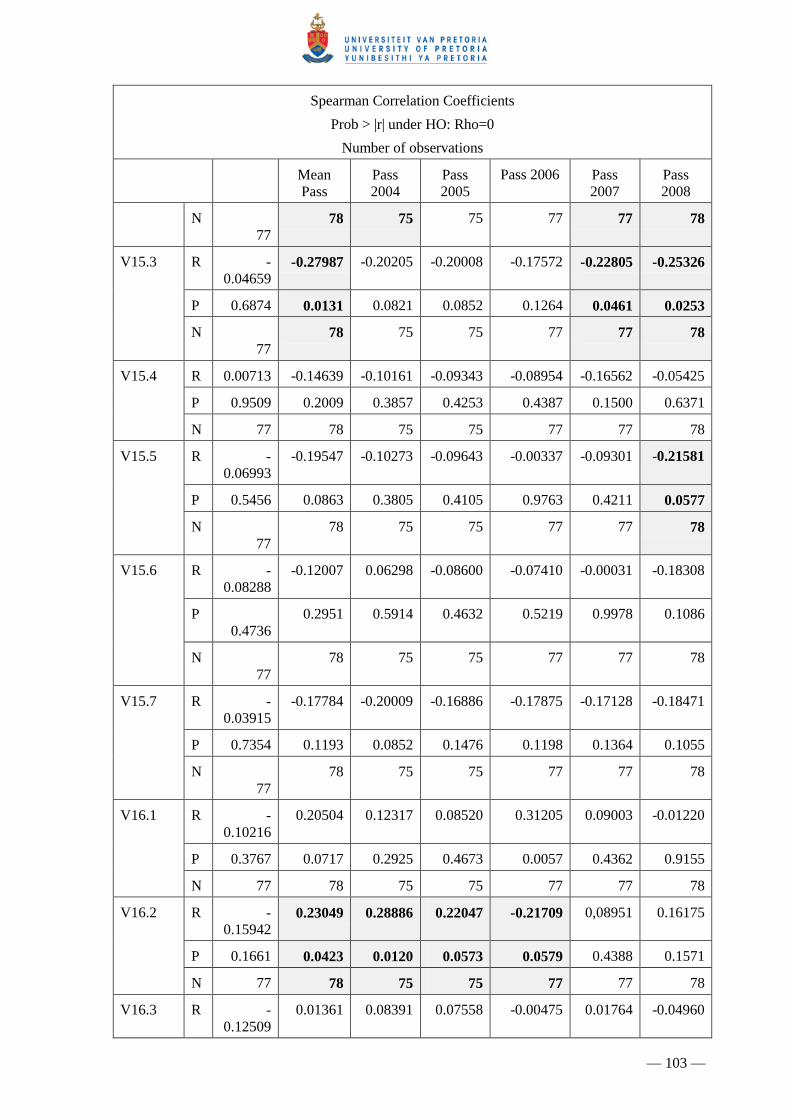
The following tables represent the descriptive statistics for the principals‘, deputy principals
and HODs‘ questionnaires. The two correlation analysis tables are designated as table 5.2(a)
and table 5.2(b) respectively.
TABLE 5.2(a): Correlation analysis
Pearson Correlation Coefficients
Prob>|r| under HO:Rho=0
Number of observations
Mean
Pass
Pass
2004
Pass
2005
Pass
2006
Pass
2007
Pass
2008
Instructional
leadership
r/r
ho
0.09938 0.03757 0.01375 0.03031 0.01535 0.21117 -0.00460
P 0.3898 0.7440 0.9068 0.7963 0.8946 0.0652 0.9681
N 77 78 75 75 77 77 78
Feedback
r/r
ho
0.12845 -
0.02264
-
0.08226
-
0.01791
-
0.01270
0.17029
-0.04432
P 0.265 0.8440 0.4829 0.8788 0.9127
0.1387
0.7000
N 77 78 75 75 77
77
78
Management r/r
ho
0.07282 0.10701 0.08093 0.07621 0.06765 0.20723 0.07356
P 0.5291 0.3511 0.4900 0.5158 0.5588 0.0706 0.0522
N 77 78 75 75 77 77 78
— 102 —
Pearson Correlation Coefficients
Prob>|r| under HO:Rho=0
Number of observations
Mean
Pass
Pass
2004
Pass
2005
Pass
2006
Pass
2007
Pass
2008
Development r/r
ho
0.09161 0.02824 0.01581 0.03272 -
0.01492
0.20799 -0.03043
P 0.428 0.8061 0.8929 0.7805 0.8975 0.0695 0.7914
N 77 78 75 75 77 77 78
Vision r/r
ho
0.07093 0.04289 0.05645 0.03333 0.02661 0.20639 -0.00226
P 0.5399 0.7093 0.6305 0,7765 0.8183 0.0717 0.9843
N 77 78 75 75
77
77 78
V9A r/r
ho
-
0.14173
-
0.20295
-
0.13817
-
0.15514
-
0.00484
-
0.15238 -0.27285
P 0.2189 0.0747 0.2372 0.1838 0.9667 0.1858 0.0157
N 77 78 75 75 77 77 78
Experience r/r
ho
-
0.15522
0.07692 0.12508 0.03282 0.07120 0.05960 -0.09848
P 0.1777 0.5032 0.2849 0.7798 0.5383 0.6066 0.3910
N 77 78 78 75 77 77
78
TABLE 5.2b: Correlation analysis
Spearman Correlation Coefficients
Prob > |r| under HO: Rho=0
Number of observations
Mean
Pass
Pass
2004
Pass
2005
Pass 2006 Pass
2007
Pass
2008
V15.1 R -
0.10998
-0.14208 -0.11564 -0.06008 -0.12823 -0.08487 -0.22786
P 0.3410 0.2147 0.3232 0.6068 0.2664 0.4630 0.0448
N
77
78 78 75 77 77 78
V15.2 R -
0.07234 -0.33425 -0.24847 -0.21230 -0.12878 -0.27454 -0.24307
P 0.5318 0.0028 0,0316 0.0675 0.2643
0.05157
0.0320
— 103 —
Spearman Correlation Coefficients
Prob > |r| under HO: Rho=0
Number of observations
Mean
Pass
Pass
2004
Pass
2005
Pass 2006 Pass
2007
Pass
2008
N
77 78 75 75 77 77 78
V15.3 R -
0.04659 -0.27987 -0.20205 -0.20008 -0.17572 -0.22805 -0.25326
P 0.6874 0.0131 0.0821 0.0852 0.1264 0.0461 0.0253
N
77 78 75 75 77 77 78
V15.4 R 0.00713 -0.14639 -0.10161 -0.09343 -0.08954 -0.16562 -0.05425
P 0.9509 0.2009 0.3857 0.4253 0.4387 0.1500 0.6371
N 77 78 75 75 77 77 78
V15.5 R -
0.06993
-0.19547 -0.10273 -0.09643 -0.00337 -0.09301 -0.21581
P 0.5456 0.0863 0.3805 0.4105 0.9763 0.4211 0.0577
N
77
78 75 75 77 77 78
V15.6 R -
0.08288
-0.12007 0.06298 -0.08600 -0.07410 -0.00031 -0.18308
P
0.4736
0.2951 0.5914 0.4632 0.5219 0.9978 0.1086
N
77
78 75 75 77 77 78
V15.7 R -
0.03915
-0.17784 -0.20009 -0.16886 -0.17875 -0.17128 -0.18471
P 0.7354 0.1193 0.0852 0.1476 0.1198 0.1364 0.1055
N
77
78 75 75 77 77 78
V16.1 R -
0.10216
0.20504 0.12317 0.08520 0.31205 0.09003 -0.01220
P 0.3767 0.0717 0.2925 0.4673 0.0057 0.4362 0.9155
N 77 78 75 75 77 77 78
V16.2 R -
0.15942 0.23049 0.28886 0.22047 -0.21709 0,08951 0.16175
P 0.1661 0.0423 0.0120 0.0573 0.0579 0.4388 0.1571
N 77 78 75 75 77 77 78
V16.3 R -
0.12509
0.01361 0.08391 0.07558 -0.00475 0.01764 -0.04960
— 104 —
Spearman Correlation Coefficients
Prob > |r| under HO: Rho=0
Number of observations
Mean
Pass
Pass
2004
Pass
2005
Pass 2006 Pass
2007
Pass
2008
P 0.2784 0.9059 0.4741 0.5193 0.9673 0.8789 0.6663
N
77
78 75 75 77 77 78
V16.4 -
0.03446
0.17316 0.10158 0.13320 0.15198 0.11803 0.07483
0.7660 0.1295 0.3858 0.2546 0.1870 0.3066 0.5150
77
78 75 75 77 77 78
Spearman Correlation Coefficients
Prob > |r| under Rho=0
Number of observations
Mean
Pass
Pass
2004
Pass
2005
Pass 2006 Pass 2007 Pass
2008
V16.5 R 0.00369 0.13601 0.09146 0.09904 0.07191 -0.03382 0.16103
P 0.9746 0.2351 0.4352 0.3979 0.5343 0.7703 0.1590
N 77 78 75 75 77 77 78
V17.1 R 0.11280 0.13257 -0.00737 0.08628 0.09409 0.07529 0.14136
P 0.3287 0.2473 0.9500 0.4617 0.4157 0.5152 0.2170
N 77 78 75 75 77 77 78
V17.2 R 0.06464 -
0.03195
-0.03933 -0.01658 -0.10945 -0.07697 0.05593
P 0.5765 0.7812 0.7376 0.8878 0.3434 0.5058 0.6267
N 77 78 75 75 77 77 78
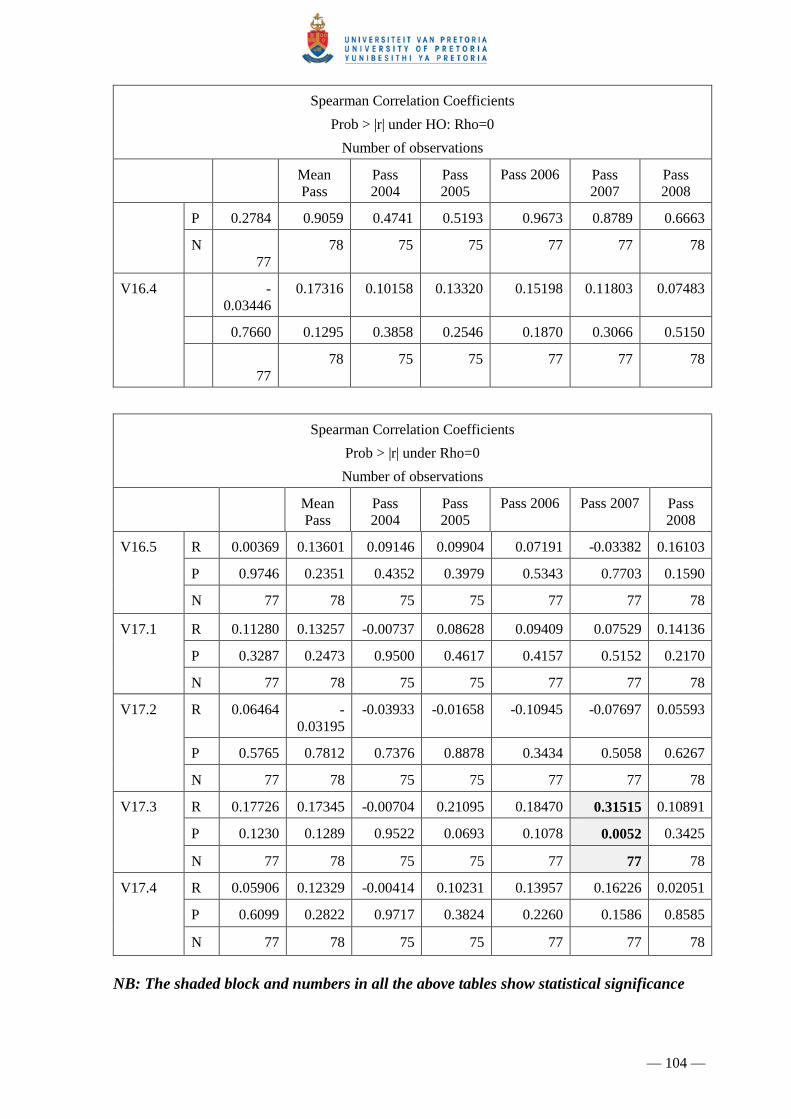
V17.3 R 0.17726 0.17345 -0.00704 0.21095 0.18470 0.31515 0.10891
P 0.1230 0.1289 0.9522 0.0693 0.1078 0.0052 0.3425
N 77 78 75 75 77 77 78
V17.4 R 0.05906 0.12329 -0.00414 0.10231 0.13957 0.16226 0.02051
P 0.6099 0.2822 0.9717 0.3824 0.2260 0.1586 0.8585
N 77 78 75 75 77 77 78
NB: The shaded block and numbers in all the above tables show statistical significance
— 105 —
The statistics captured in tables 5.2a and 5.2b were used for the analysis of the quantitative
data and the results are as follows:
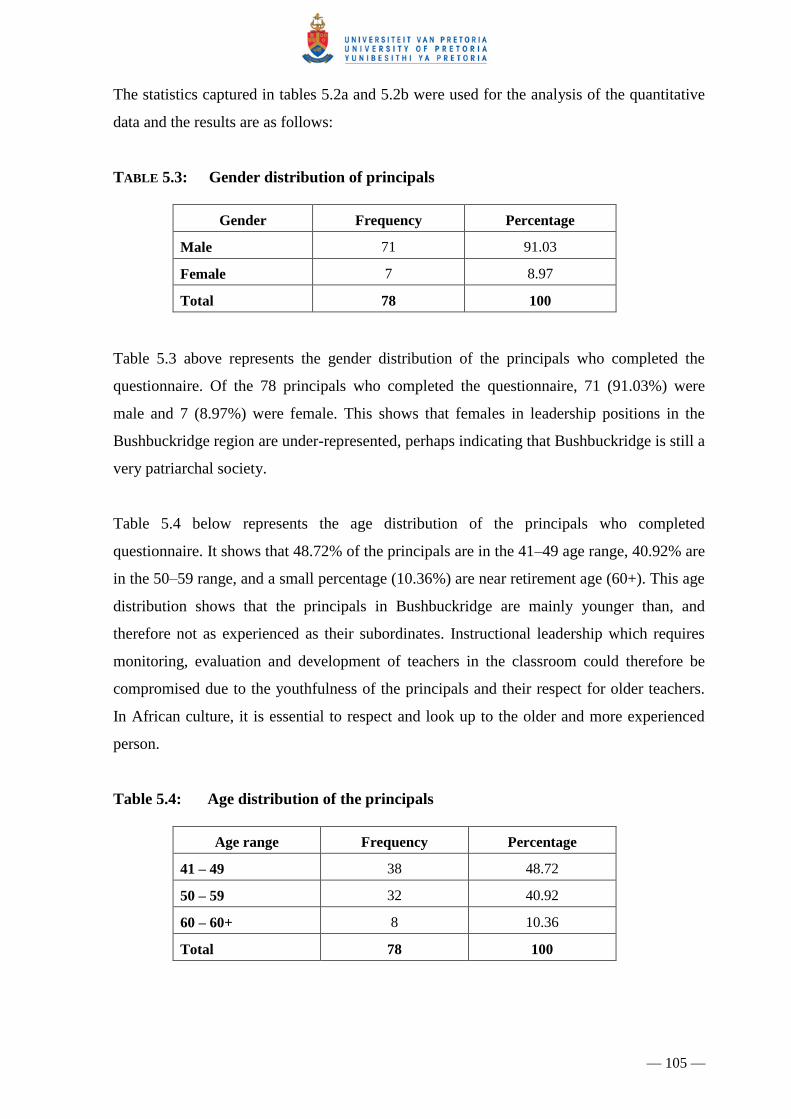
TABLE 5.3: Gender distribution of principals
Gender Frequency Percentage
Male 71 91.03
Female 7 8.97
Total 78 100
Table 5.3 above represents the gender distribution of the principals who completed the
questionnaire. Of the 78 principals who completed the questionnaire, 71 (91.03%) were
male and 7 (8.97%) were female. This shows that females in leadership positions in the
Bushbuckridge region are under-represented, perhaps indicating that Bushbuckridge is still a
very patriarchal society.
Table 5.4 below represents the age distribution of the principals who completed
questionnaire. It shows that 48.72% of the principals are in the 41–49 age range, 40.92% are
in the 50–59 range, and a small percentage (10.36%) are near retirement age (60+). This age
distribution shows that the principals in Bushbuckridge are mainly younger than, and
therefore not as experienced as their subordinates. Instructional leadership which requires
monitoring, evaluation and development of teachers in the classroom could therefore be
compromised due to the youthfulness of the principals and their respect for older teachers.
In African culture, it is essential to respect and look up to the older and more experienced
person.
Table 5.4: Age distribution of the principals
Age range Frequency Percentage
41 – 49 38 48.72
50 – 59 32 40.92
60 – 60+ 8 10.36
Total 78 100

— 106 —
Table 5.5 below indicates the qualifications of the principals, where 35.9% hold a teachers‘
diploma plus a bachelor‘s degree or other qualification, which may be a further diploma in
education. The highest percentage (50%) of the principals holds either a Bachelor of
Education degree, a Bachelor of Education Honours degree, or a Bachelor of Arts Honours
degree in addition to the teachers‘ diploma. The last group, which constitutes the smallest
percentage (14.1%) hold, in addition to the above qualifications, a Masters‘ or a Doctor‘s
degree. From this information about qualifications, it can be inferred from the high
qualifications of the last two groups of principals, that they are better skilled and that their
students would achieve good results in the matriculation examination.
TABLE 5.5: Distribution of the principals’ qualifications
Qualifications Frequency Percentage
Teachers’ diploma,
Bachelor’s degree, other
28 35.9
B.Ed., B.Ed. Honours,
B.A. Honours
39 50
Master’s degree, Doctor’s
degree
11 14.1
Total 78 100
During the analysis of the principals‘ questionnaire, it was necessary for the statisticians to
classify the different participating schools according to the qualifications held by the
principals. This was done to establish whether the type of qualifications that the principals
hold had any effect on the pass rate in their schools. The researcher used the analysis of
variance (ANOVA) to test for the significance of the differences among more than two
sample means (Levin & Rubin, 1998:591). This enabled me to draw inferences about
whether the different qualification levels of the principals drawn from the sample of
participating schools had an impact on the achievement levels of learners in their schools.
The following tables indicate the differences in the pass rate, with specific reference to the
qualification levels of the principals of the participating schools:

— 107 —
TABLE 5.6: Least square means for the pass rate from 2004 to 2008
Qualifications Pass 2004 Pass 2005 Pass 2006 Pass 2007 Pass 2008
Diploma, B.A. and
other
58.84 56.12 45.60 49.69 32.16
B.Ed.; B.Ed.
(Hons) and B.A.
(Hons)
65.33 54.50 50.47 57.42 40.99
M.A.; M.Ed.; PhD. 50.40 48.69 45.95 43.58 27.79
Table 5.6 represents the least square means for the pass rate from 2004 to 2008 showing that
the schools where the principals hold either a Bachelor of Education degree, a Bachelor of
Education Honours, or a Bachelor of Arts Honours degree achieved the best results across
the years, with 65.33% in 2004, 54.50% in 2005, 50.47% in 2006, 57.42% in 2007, and
40.99% in 2008, followed by the schools where the principals are the least qualified. The
pass percentage is the lowest, at 50.40% in 2004, 48.69% in 2005, 45.95% in 2006, 43.58%
in 2007, and 27.79% in 2008, in schools with the highest qualified principals – those with
either a Master‘s or a PhD degree.
The inference may be drawn from the analysis of variance shown in the above tables that
the qualifications of the principals do not always have an effect, or partially have an effect
on learner performance in their schools. This implies that learner performance in any school
is not entirely dependent on the qualifications of the principal. It can be further inferred that
other personal characteristics and attributes of the principal, rather than qualifications alone,
might be more significant in promoting learner performance. Glickman et al. (2005:6)
contend that what is crucial is not the person‘s title and qualifications, but rather his or her
responsibilities.
In the literature study, Jorgenson and Peal (2008:54) state that teachers appreciate principals
who occasionally offer to relieve a class, and take every opportunity to be guest teachers,
demonstrating their skills and engagement in classroom life. It seems as though in the case
of Bushbuckridge, these principals have little skill in classroom practice and do not take
over teaching to demonstrate their teaching skills. The second reason for this incompatibility
between the principals‘ qualifications and learner performance is that perhaps principals are
being sponsored by the department of education to improve their studies; and therefore
perhaps spend time doing their university work during working hours rather than reading
and implementing instructional leadership.

— 108 —
The following column diagram represents the fluctuating pass rate from 2004 to 2008
according to the different qualifications of the principals who completed the questionnaire.

— 109 —
COLUMN DIAGRAM 5.1: Representation of the pass rate from 2004 to 2008 according to
the qualifications of the principals
At the planning stage of the study, it was important to determine the number of years that
the principals had served as CS1, HOD, deputy principal, or as principal. The following
table shows the years of experience that the principals had served in these different job
categories:
TABLE 5.7: Years of experience in the different job categories CS1, HOD, deputy
principal and principal
V5.1 Years as CS1 Frequency Percentage
5 years and less 19 24.99
6 – 15 years 53 69.75
16 years and more 4 5.26
TOTAL 76 100
V5.2 Years as HOD
5 years and less 35 67.31
6 – 12 years 17 32.69
TOTAL 52 100
— 110 —
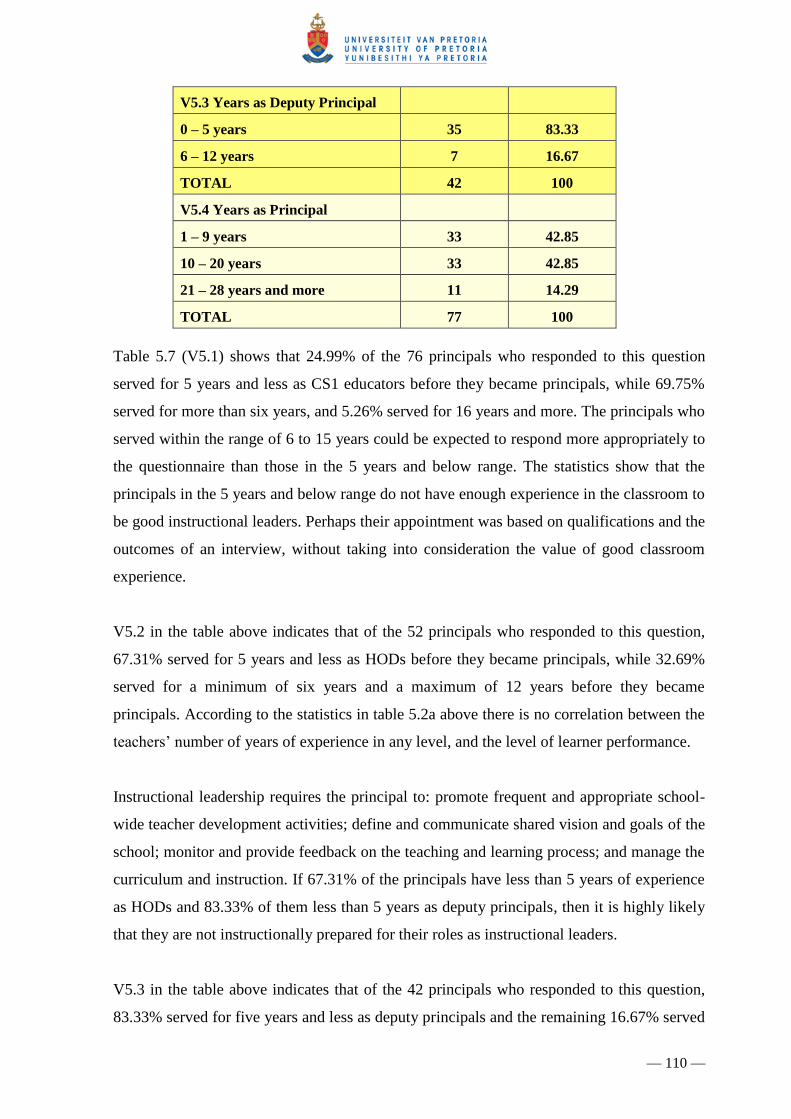
V5.3 Years as Deputy Principal
0 – 5 years 35 83.33
6 – 12 years 7 16.67
TOTAL 42 100
V5.4 Years as Principal
1 – 9 years 33 42.85
10 – 20 years 33 42.85
21 – 28 years and more 11 14.29
TOTAL 77 100
Table 5.7 (V5.1) shows that 24.99% of the 76 principals who responded to this question
served for 5 years and less as CS1 educators before they became principals, while 69.75%
served for more than six years, and 5.26% served for 16 years and more. The principals who
served within the range of 6 to 15 years could be expected to respond more appropriately to
the questionnaire than those in the 5 years and below range. The statistics show that the
principals in the 5 years and below range do not have enough experience in the classroom to
be good instructional leaders. Perhaps their appointment was based on qualifications and the
outcomes of an interview, without taking into consideration the value of good classroom
experience.
V5.2 in the table above indicates that of the 52 principals who responded to this question,
67.31% served for 5 years and less as HODs before they became principals, while 32.69%
served for a minimum of six years and a maximum of 12 years before they became
principals. According to the statistics in table 5.2a above there is no correlation between the
teachers‘ number of years of experience in any level, and the level of learner performance.
Instructional leadership requires the principal to: promote frequent and appropriate school-
wide teacher development activities; define and communicate shared vision and goals of the
school; monitor and provide feedback on the teaching and learning process; and manage the
curriculum and instruction. If 67.31% of the principals have less than 5 years of experience
as HODs and 83.33% of them less than 5 years as deputy principals, then it is highly likely
that they are not instructionally prepared for their roles as instructional leaders.
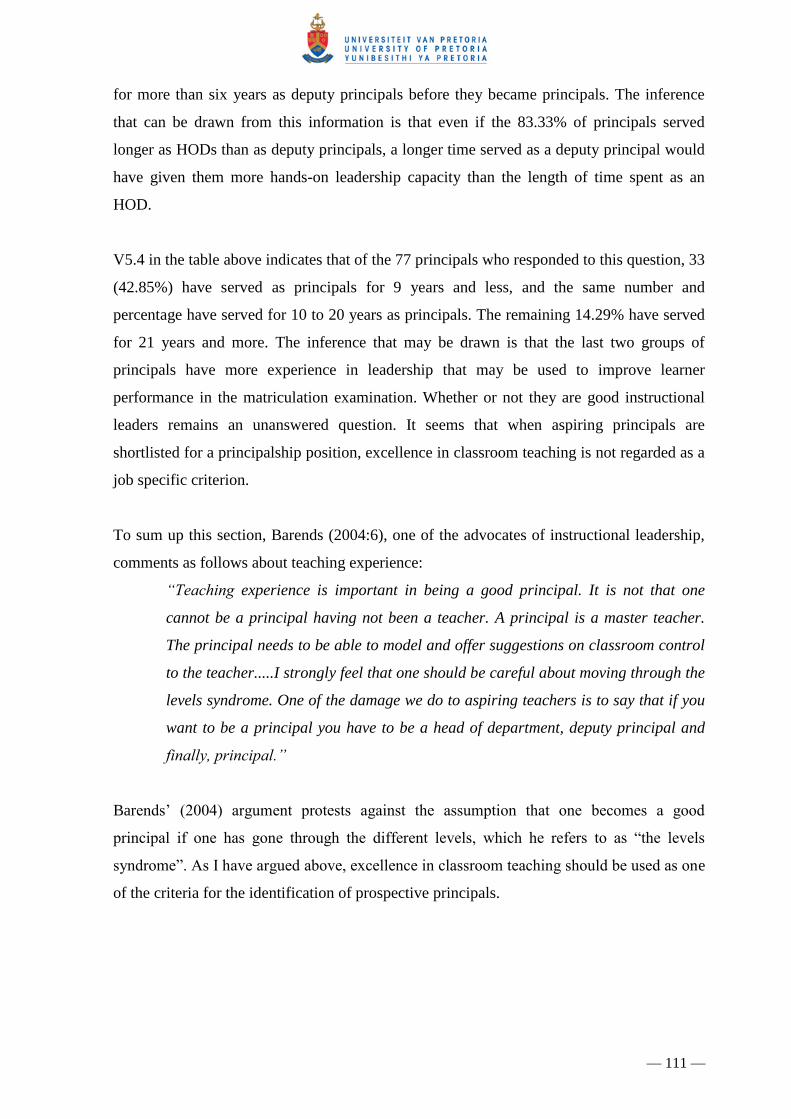
V5.3 in the table above indicates that of the 42 principals who responded to this question,
83.33% served for five years and less as deputy principals and the remaining 16.67% served
— 111 —
for more than six years as deputy principals before they became principals. The inference
that can be drawn from this information is that even if the 83.33% of principals served
longer as HODs than as deputy principals, a longer time served as a deputy principal would
have given them more hands-on leadership capacity than the length of time spent as an
HOD.
V5.4 in the table above indicates that of the 77 principals who responded to this question, 33
(42.85%) have served as principals for 9 years and less, and the same number and
percentage have served for 10 to 20 years as principals. The remaining 14.29% have served
for 21 years and more. The inference that may be drawn is that the last two groups of
principals have more experience in leadership that may be used to improve learner
performance in the matriculation examination. Whether or not they are good instructional
leaders remains an unanswered question. It seems that when aspiring principals are
shortlisted for a principalship position, excellence in classroom teaching is not regarded as a
job specific criterion.
To sum up this section, Barends (2004:6), one of the advocates of instructional leadership,
comments as follows about teaching experience:
“Teaching experience is important in being a good principal. It is not that one
cannot be a principal having not been a teacher. A principal is a master teacher.
The principal needs to be able to model and offer suggestions on classroom control
to the teacher.....I strongly feel that one should be careful about moving through the
levels syndrome. One of the damage we do to aspiring teachers is to say that if you
want to be a principal you have to be a head of department, deputy principal and
finally, principal.”
Barends‘ (2004) argument protests against the assumption that one becomes a good
principal if one has gone through the different levels, which he refers to as ―the levels
syndrome‖. As I have argued above, excellence in classroom teaching should be used as one
of the criteria for the identification of prospective principals.

— 112 —
TABLE 5.8: Distribution of the geographic locations of the schools
Assuming that the geographical background of the schools might have an impact on the
achievement levels of the learners and the performance of teachers, it was necessary to
determine in which areas the different participating schools are situated. Table 5.8 above
indicates that there is an uneven distribution of schools between the townships and the rural
areas. This situation is due to the fact that Bushbuckridge is historically a rural area, with a
few townships which started developing during the early 1990s. Today many learners and
teachers travel from the townships to attend school in the rural areas which makes it
inappropriate at this stage of the research to infer that the poor performance of learners is
due to the geographical background of their schools.
The poor performance of the learners may be attributed to other factors, such as lack of
interest on the part of the learners, or low morale on the part of the teachers, particularly
with regard to the implementation of the National Curriculum Statement (NCS). These
attitudinal variables could have led to inertia in the enactment of instructional leadership.
This view is pursued further in the following sections of the thesis.
The rural background of the majority of the schools, as indicated in the above table, can also
be associated with the affluence of the families from which the majority of the learners
come. The analysis of the data in relation to V9A (learners‘ backgrounds) shows a
statistically significant positive correlation in 2008 (p=0.015) between poor learner
performance and the economic conditions at home. Due to the fact that the pass percentage
was the lowest in 2008 (according to the statistics), it means that learners from
disadvantaged backgrounds performed poorly as compared to learners from affluent
backgrounds. It could also be true that in some cases learners from rural areas perform
better than learners from urban areas. The background of learners, therefore, may
significantly affect the improvement or decline in learner performance.
V7: School geographic background Frequency Percentage
Township 5 6.41
Rural area 73 93.59
Total 78 100

— 113 —
TABLE 5.9: Distribution of the number of learners enrolled for the matriculation
examination and their performance
Year Enrolment Pass Percentage Fail Percentage Frequency
2004 5182 2479 47.83 2703 52.16 75
2005 5918 2938 49.64 2980 50.35 75
2006 5428 2146 39.53 3282 60.46 77
2007 6373 3163 49.63 3210 50.36 77
2008 6735 2416 35.87 4319 64.12 78
Total 29636 13142 44.34 16494 55.65
Table 5.9 above indicates the number of learners who were enrolled for the matriculation
examination in each year from 2004 to 2008, the number and percentage of learners who
passed, and the number and percentage that failed. It is clear from the table that patterns of
learner performance in the schools that participated in this survey have been fluctuating over
the years. The data in the above table confirms the concern which prompted the researcher
to engage in this study to investigate the instructional leadership practices of principals, and
how these might lead to an improvement in the declining pass rate in the matriculation
examination.
TABLE 5.10: Distribution of the management qualifications of principals
V11: Management Qualification Frequency Percentage
YES 60 76.92
NO 18 23.08
TOTAL 78 100
Table 5.10 indicates that the majority (76.92%) of the participating principals have a/some
management qualification(s), while the minority (23.08%) have none. The inference that
can be drawn from this information is that with such a large number of principals having
management qualifications, the leadership and management of teaching and learning in the
schools in the Bushbuckridge Region in general, and the participating schools in particular,
should be above average, and learner performance in such schools could be expected to be
better. However, the management qualifications might be highly theoretical and it could be
— 114 —
inferred that the principals are not able to apply the theories professionally and
institutionally.
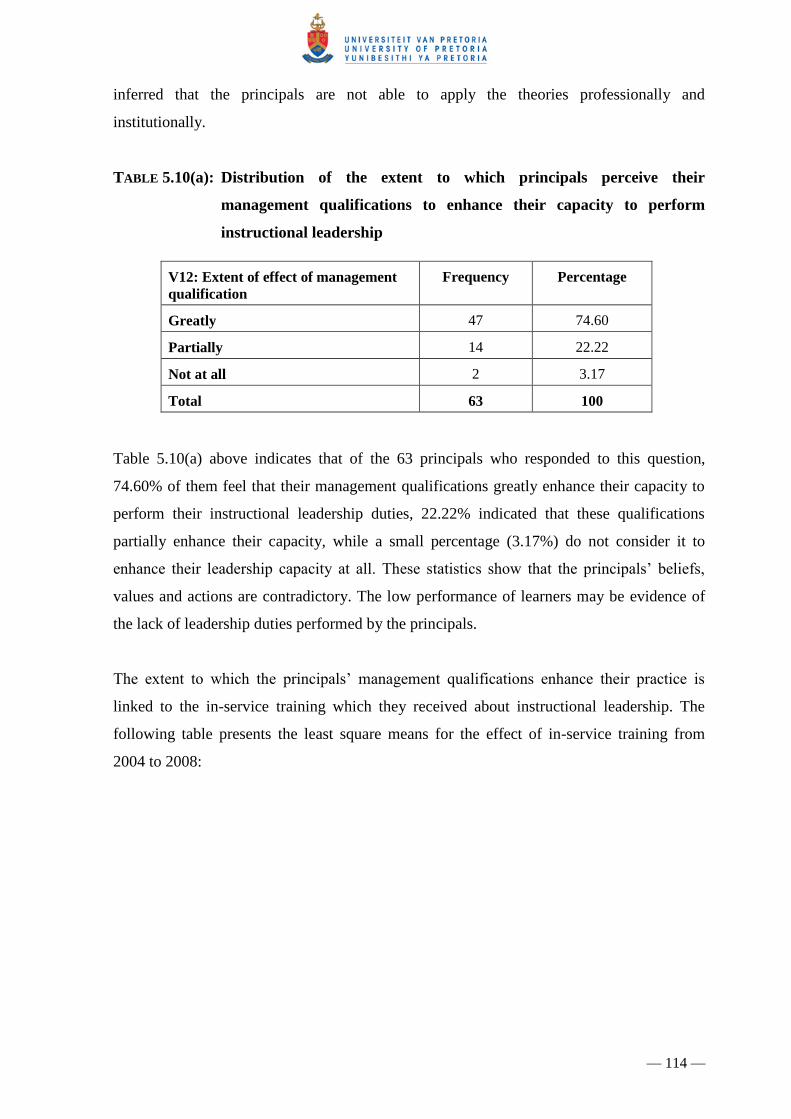
TABLE 5.10(a): Distribution of the extent to which principals perceive their
management qualifications to enhance their capacity to perform
instructional leadership
V12: Extent of effect of management
qualification
Frequency Percentage
Greatly 47 74.60
Partially 14 22.22
Not at all 2 3.17
Total 63 100
Table 5.10(a) above indicates that of the 63 principals who responded to this question,
74.60% of them feel that their management qualifications greatly enhance their capacity to
perform their instructional leadership duties, 22.22% indicated that these qualifications
partially enhance their capacity, while a small percentage (3.17%) do not consider it to
enhance their leadership capacity at all. These statistics show that the principals‘ beliefs,
values and actions are contradictory. The low performance of learners may be evidence of
the lack of leadership duties performed by the principals.
The extent to which the principals‘ management qualifications enhance their practice is
linked to the in-service training which they received about instructional leadership. The
following table presents the least square means for the effect of in-service training from
2004 to 2008:

— 115 —
TABLE 5.10(b): Least square means for the effect of in-service training of principals
on learner performance
Extent of the effect
of in-service
training
PASS MEANS
2004 2005 2006 `2007 2008
Greatly 64.4% 56.13% 50% 52.3% 37.49%
Partially 53.6% 50% 55.1% 55.1% 35.8%
Not at all 57% 52.8% 42.4% 52.3% 32%
P value 0.1648 0.6119 0.4126 0.9067 0.6180
Table 5.10(b) above explores the extent to which the in-service training of principals (V12)
has influenced their practice of instructional leadership which in turn, influences learner
performance. In all cases, the p value is greater than 0.05 (p>0.05), ranging from 0.16 in
2004; 0.61 in 2005; 0.41 in 2006; 0.9 in 2007 to 0.61 in 2008. The inference that can be
drawn from the statistics in the above table is that there is no significant relationship
between in-service training, instructional leadership, and learner performance.
In 2004, for example, 64.4% of the principals indicated that in-service training influences
their practice of instructional leadership greatly, 53% partially, and 57% not at all; but the
pass percentage (47%) shows no correlation with the fact that in-service training influences
their practice greatly. There is however, some level of compatibility between the pass
percentage in 2008 (35.8%) with the extent to which the principals indicated that in-service
training influences their practice of instructional leadership, with 37.49% saying that in-
service training influences their practice greatly, 35.8% partially, and 32% not at all.
TABLE 5.11: Distribution of instructional time in hours that principals devote to
instructional leadership activities per day
V13H: Instructional time in hours Frequency Percentage
3-5 hours 14 18.42
6-8 hours 62 81.58
Total 76 100
Table 5.11 above indicates that 18.42% of the participating principals spend 3 to 5 hours per
day on instructional leadership activities, while the larger percentage (81.58%) spend

— 116 —
between 6 and 8 hours of their working day on instructional leadership activities. The
inference that can be drawn from this data is that the more time the principals spend on
instructional leadership activities, such as motivating teachers and learners, engaging
teachers in development activities, monitoring and evaluating the work of the teachers, and
ensuring the realization of the school vision and goals, the better the performance of the
learners would be. Perhaps the principals are not aware of the instructional leadership duties
that they should perform.
TABLE 5.12: Distribution of the responses to V15.1; V15.2; V15.3; V16.1; V16.2 and
V17.3
Variables r/rho value p value years
V15.1: Teachers‘ job satisfaction -0.22786 0.0448 2008
V15.2: Teachers‘ understanding of the school‘s
curricular goals
-0.24847 0.0316 2004
-0.27454 0.0157 2007
-0.24307 0.0320 2008
V15.3: Teachers‘ degree of success in implementing
the school curriculum
-0.22805 0.0461 2007
-0.25326 0.0253 2008
V16.1: Teachers supporting the implementation of the
NCS
0.31205 0.0057 2006
V16.2: Teachers‘ involvement in designing and/or
supporting the school‘s improvement goals
0.28886 0.0120 2004
V17.3: Using learner achievement to evaluate the
practice of grade 12 educators
0.31515 0.0052 2007
NB: Only the statistically significant scores are displayed in the table above
Table 5.12 indicates the strength of different variables relating to the principals‘ opinions of
their own professional practice, how they view the practice of the teachers in their schools,
and how the activities of both the principals and teachers influence learner performance in
the matriculation examination. The different cases are reported below, which should be read
together with tables 5.2(a) and 5.2(b).
For variable V15.1 there is a statistically significant correlation between teachers‘ job
satisfaction and the pass rate in 2008, with the values of rho=0.22786 and p=0.0448.
Teachers‘ job satisfaction could be directly attributed to the principal‘s practice of
instructional leadership. If the principal provides the necessary and appropriate instructional

— 117 —
support to the teachers, resources to assist them in fulfilling their instructional obligations,
and incentives to reward good performance, the teachers will work hard to improve learner
performance. This correlation can be explained as a weak one, in the sense that the pass rate
in 2008 is the lowest (35.8%) when compared to the other years; it further suggests that
teacher job satisfaction was low during this year. This finding therefore suggests that the
lower the teachers‘ job satisfaction, the poorer the learner results will be.
Teachers’ understanding of the schools’ curricular goals (V15.2) shows a statistically
significant correlation with the pass rate in 2004 (rho=0.24847; p=0.0316); in 2007
(rho=0.27454; p=0.0157); and in 2008 (rho=-0.24307; p=0.0320). In 2004 and 2007, where
the pass rates are 47% and 49% respectively, there is a positive correlation between the
teachers‘ understanding of the schools‘ curricular goals and the improvement in learner
performance. In 2008, on the contrary, with a pass rate of 35.8%, there is a positive
correlation between poor learner performance and the teachers‘ understanding of the
schools‘ curricular goals. This implies that the principal should involve the entire staff in the
formulation of the school‘s curricular goals. The more the teachers participate in the
formulation of the school goals, the more they will declare ownership of such goals. This
will enable them to work hard towards achieving these goals, which in turn will have an
impact on the improvement of learner performance.
Teachers’ degree of success in implementing the school’s curricular goals (V15.3)
shows a statistically significant correlation with the pass rate in 2007 (rho=0.22805;
p=0.0461) and in 2008 (rho=0.25326; p=0.0253). The success of the teachers in
implementing the school‘s curricular goals depends on their understanding of the curricular
goals; the more they understand the curricular goals, the more they will succeed in
implementing them. This success is likely to have an impact on the improvement of learner
performance.
Parental support for learners’ achievement (V15.5): With the poor performance of the
learners in 2008 (35.8%), the p value of 0.0577 indicates that there is a positive correlation
between poor learner performance and the low level of parental support. From this, it can be
inferred that Bushbuckridge, being an area characterized by poverty and an acute level of
unemployment, probably has an illiterate parent community who do not participate in the
education of their children. It could also be that most of the parents work away from home,

— 118 —
causing a support gap between themselves and their children due to the long distances
travelled and time spent away from home.
Teachers supporting the implementation of the NCS (V16.1) shows a statistically
significant correlation with the pass rate in 2006 (rho=0.31205; p=0.0057). The National
Curriculum Statement is the written core curriculum in all South African schools. It is
imperative for the principal, as an instructional leader, to support the implementation of this
curriculum. In chapter 2, under the sub-heading of ‗Managing the curriculum and
instruction‘, it was indicated that the success of the principal in managing the curriculum
and instruction depends on his/her collaboration with staff and attending learning area
workshops with them. This will ensure that the principal is able to intervene and assist the
staff, and also provide the necessary resources.
Teachers’ involvement in designing and supporting the school’s improvement goals
(V16.2) shows a positive correlation with the mean pass rate. In 2004, 2005 and 2006 the
statistics show a positive correlation between learner performance and the level of the
teachers‘ involvement in designing and supporting the schools improvement goals, with p
values of 0.012; 0.0573; and 0.0579 respectively. Teachers will perform better and impact
on learner performance positively if they are involved in designing the school‘s
improvement goals. The teachers must be able to own the school‘s improvement goals and
once this becomes the norm in the school, the teachers will be more focused, and achieving
the school goals will become their primary focus.
Using learner achievement to evaluate the practice of grade 12 educators (V17.3)
shows a statistically significant correlation with the pass rate in 2007 (rho=0.31515;
p=0.0052). The principal, together with his/her teachers, must use the previous year‘s grade
12 results to build a ―winning team‖ for the school. Subject teachers whose learners
consistently perform well should be retained in that grade, and for those who consistently
underperform, the performance of their learners should be used as a means to develop their
skills. In this way, the school will be able to consolidate a winning team that will contribute
to improved learner performance.
The inferences that can be drawn from the correlation analysis above are the following:
Teachers need to have some degree of job satisfaction and this can be achieved by
recognition of good performance through incentives offered by the school. Poor

— 119 —
performance of learners could be attributed to a low level of teacher job satisfaction,
as is the case with the performance of learners in the 2008 matriculation examination
(pass rate of 35.87%), and in the 2006 matriculation examination (pass rate of
39.53%). It can also be inferred that in cases such as the 2004, 2005 and 2007 pass
rates (47.83%, 49.64% and 49.63% respectively), the teachers experienced some
degree of job satisfaction. This therefore means that learner performance increases
or improves with the improvement in teacher job satisfaction, and decreases or
declines with a decline in teacher job satisfaction.
The school‘s curriculum goals must be clear to all teachers and the principal must
ensure that agreed-upon implementation strategies are observed by all teachers in the
school. This implies that only clear learning and performance goals can guide the
development of effective teaching and learning which can result in measurable
improvements in learner performance. The fluctuation in the matriculation pass rate
between the different years under review (2004 to 2008) could be associated with
the different levels of understanding of the curricular goals by the teachers. These
differences in the levels of understanding could be attributed to several factors
which may include low morale on the part of teachers as a result of their temporary
appointment status (which is very common in Bushbuckridge); lack of appropriate
training on the new curriculum and its mode of delivery; and the extent to which the
principal initiates, controls and monitors the implementation of the school‘s
curricular goals.
The principal needs to create avenues for motivating teachers to support the
implementation of the National Curriculum Statement. School-based teacher
development activities can assist in this regard. Motivating and encouraging teachers
are two psychological variables that can have a marked impact on the improvement
of learner performance. Motivated and enthusiastic teachers will no doubt succeed in
empowering their learners to contribute towards their own improved performance.
The school‘s improvement goals should not be a product of only the office of the
principal or the SMT. Involving all the teachers in this enterprise will facilitate the
teachers‘ ownership of these goals, which will encourage them to work hard towards
achieving them.

— 120 —
The achievement of learners each year, particularly in the matriculation
examination, should be used as a tool to evaluate the practice of the teachers
concerned. In order to provide effective instruction that will result in improved
learner performance, teachers must be researchers who are able to use research-
based performance improvement strategies to plan their instruction. Intervention
strategies to improve performance can only be made from such an exercise.
TABLE 5.13: Distribution of the responses to V14.1 to V14.6: time spent by the
principal on different activities in the school
Variable Description Percentage
V14.1 Administrative duties 32.85
V14.2 Instructional leadership 22.88
V14.3 Supervising and evaluating teachers and other staff 25.46
V14.4 Teaching 17.31
V14.5 Public relations and fundraising 12.55
V14.6 Other 15.57
Table 5.13 above indicates the distribution of the responses of the principals to V14.1 to
V14.6 which relate to the time spent by the principal on different activities in the school.
The statistics in this table show that generally, the principals who responded to this question
spend the largest percentage of their time on administrative duties (32.85%), followed by
25.46% of their time being spent on the supervision and evaluation of teachers and other
staff. Instructional leadership, which is the focus of this study, was allocated 22.88% of their
time, followed by teaching (17.31%), other activities (15.57%), and public relations
receiving the lowest percentage at 12.55%.
The primary purpose of the above question was to establish the extent to which principals
spend their time on instructional leadership. The statistics show that they spend more time
on administrative duties, supervision and evaluation than on instructional leadership. The
poor performance of learners in the matriculation examination could be attributed to this
limited attention given to instructional leadership. In chapter 1 it was reported that Enueme
and Egwunyenga (2008:1) view instructional leadership as a blend of supervision, staff
development and curriculum development that facilitates school improvement. Given this
view, if the same principals who indicated that they spend time on instructional leadership
— 121 —
were also to spend time on supervision and evaluation, this could possibly contribute to
improved learner performance.
The quantitative data analysis presented above emanates from the data collected from the
principals‘ questionnaire. The following section focuses on the analysis of the deputy
principals‘ and HODs‘ questionnaire, the purpose of which was to obtain the perceptions of
the deputy principals and HODs with regard to the instructional leadership practices of their
principals. The questionnaire was structured according to the four variables which were
identified, for the purpose of this study, as being related to instructional leadership.
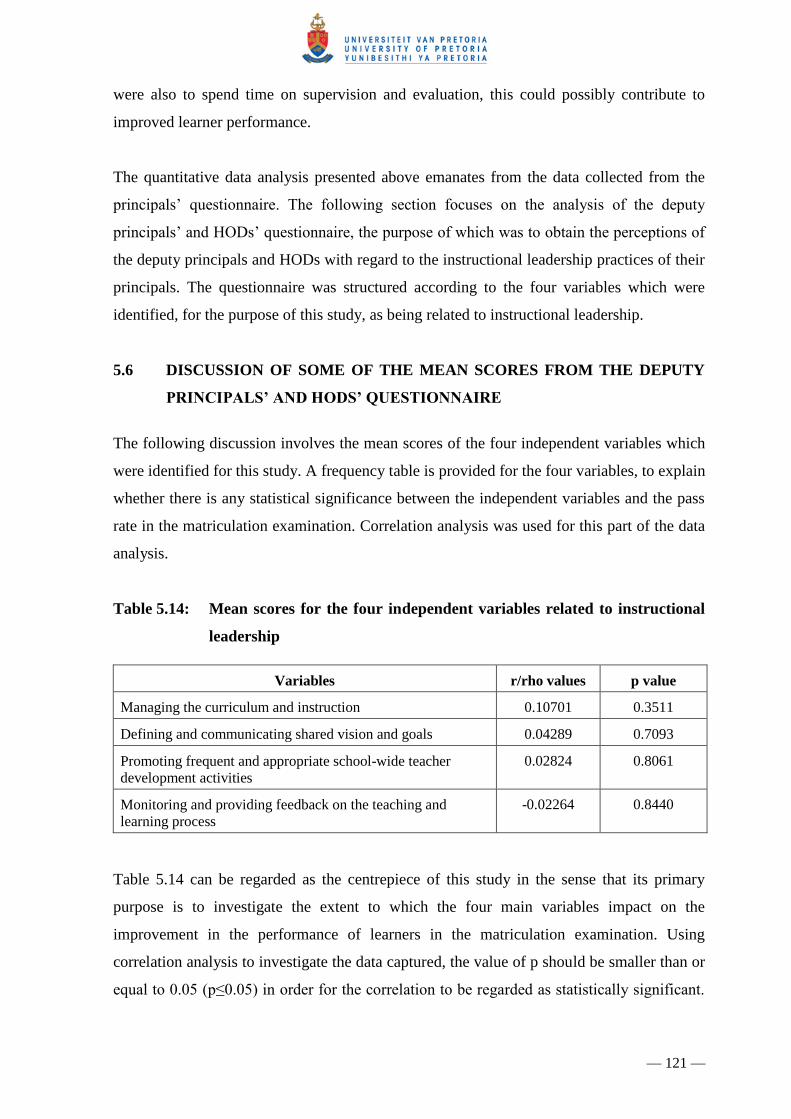
5.6 DISCUSSION OF SOME OF THE MEAN SCORES FROM THE DEPUTY
PRINCIPALS’ AND HODS’ QUESTIONNAIRE
The following discussion involves the mean scores of the four independent variables which
were identified for this study. A frequency table is provided for the four variables, to explain
whether there is any statistical significance between the independent variables and the pass
rate in the matriculation examination. Correlation analysis was used for this part of the data
analysis.
Table 5.14: Mean scores for the four independent variables related to instructional
leadership
Variables r/rho values p value
Managing the curriculum and instruction 0.10701 0.3511
Defining and communicating shared vision and goals 0.04289 0.7093
Promoting frequent and appropriate school-wide teacher
development activities
0.02824 0.8061
Monitoring and providing feedback on the teaching and
learning process
-0.02264 0.8440
Table 5.14 can be regarded as the centrepiece of this study in the sense that its primary
purpose is to investigate the extent to which the four main variables impact on the
improvement in the performance of learners in the matriculation examination. Using
correlation analysis to investigate the data captured, the value of p should be smaller than or
equal to 0.05 (p≤0.05) in order for the correlation to be regarded as statistically significant.

— 122 —
In all the cases in the table above, p>0.05 which indicates that the correlation is not
statistically significant.
The conclusion that can be drawn from the findings in the above table is that the four
variables, which were identified as characteristics of instructional leadership, do not have
any effect on the pass rate. From this conclusion, it can be inferred that the enactment of the
above functions by the principal may not bring any improvement in learner performance.
This therefore implies that there are other activities in which principals should engage in
order to bring about improvement in learner performance in the matriculation examination.
Noticeably the variable ‗managing the curriculum and instruction‘, has a p-value of 0.3511
which is considerably lower than the other three variables; this is therefore the most
important variable of the four. Research (see section 2.5.7.4) has shown that instructional
leaders need to have up-to-date knowledge of three areas of education: curriculum,
instruction and assessment (Jenkins, 2009:34). The principal also needs to keep abreast of
new developments with regard to curriculum by attending curriculum workshops with his
teachers, as this will assist him/her to provide the necessary support to the teachers with
regard to the implementation of the curriculum. The importance of this variable to learner
performance is supported by Mednick‘s view (2003) that when principals teach in the
classroom, they are enabled to obtain instructional resources and professional development
opportunities that improve teaching, learning and assessment practices for teachers.
The literature that was reviewed to provide secondary data for this research, from both
African and western sources, revealed that the four variables indicated above are among
many other variables that are related to instructional leadership. Some of the literature also
refers to such variables as ―functions‖ of the principal. Any research findings that contradict
the above conclusions regarding the four variables may indicate that further investigation of
instructional leadership and its relevance to the improvement of learner performance is
necessary. Such findings also call for deeper questioning as to whether instructional
leadership is a prerequisite for appointment as a principal, and whether principals
themselves view instructional leadership as a key to the improvement of learner
performance.
The quantitative data analyzed in this chapter emanates from the responses of the principals
to the questionnaire which was specifically designed to collect their biographic and other
— 123 —
information related to their practice as instructional leaders. The data collected from the
deputy principals‘ and HODs‘ questionnaire, which was designed to solicit information
regarding their perceptions about the role of their principals as instructional leaders, has also
been presented and discussed. The following chapter reports on the findings from the
interviews which were conducted with principals. Two qualitative research reports are
provided in chapter 6: firstly, the findings from the focus group interview, and secondly, the
findings from the structured interview.