CHAPTER 5 OVERVIEW - College of Agriculture & Natural ... · 126 First, the NREM database can be...
127
122 CHAPTER 5 QUANTITATIVE INFORMATION INTEGRATION MODEL WITH A WORKING EXAMPLE 5.1 OVERVIEW In Chapter 4, the quantitative data sources, National Residential Efficiency Measures (NREM) Database (NREL 2010), and Building Energy Optimization (BEopt) (NREL 2012) were individually analyzed before being integrated into the intelligent Decision Support System. The quantitative data sources were examined from an integrational point-of-view, with a discussion of which parts of the data sources can be connected to the DSS. This chapter begins with an explanation of the overall integration procedure. Since the expert system shell program, Exsys Corvid (Exsys 2012), is the core of this integration model, its structure needed to be built first, and then the structure has been applied to the Decision Support System Framework developed by the Task 6.3 research team (Samuel 2011). Based on the Exsys structure and the framework, a working example of the integration model will be developed. 5.1.1 Overall Procedure The main purpose of this research is to implement an integrated intelligent Decision Support System, combining quantitative cost information and energy simulation information, and to suggest expert knowledge to the users in order to improve the existing residential energy efficiency.
Transcript of CHAPTER 5 OVERVIEW - College of Agriculture & Natural ... · 126 First, the NREM database can be...

122
CHAPTER 5
QUANTITATIVE INFORMATION INTEGRATION MODEL
WITH A WORKING EXAMPLE
5.1 OVERVIEW
In Chapter 4, the quantitative data sources, National Residential Efficiency Measures (NREM)
Database (NREL 2010), and Building Energy Optimization (BEopt) (NREL 2012) were
individually analyzed before being integrated into the intelligent Decision Support System. The
quantitative data sources were examined from an integrational point-of-view, with a discussion
of which parts of the data sources can be connected to the DSS.
This chapter begins with an explanation of the overall integration procedure. Since the expert
system shell program, Exsys Corvid (Exsys 2012), is the core of this integration model, its
structure needed to be built first, and then the structure has been applied to the Decision Support
System Framework developed by the Task 6.3 research team (Samuel 2011). Based on the Exsys
structure and the framework, a working example of the integration model will be developed.
5.1.1 Overall Procedure
The main purpose of this research is to implement an integrated intelligent Decision Support
System, combining quantitative cost information and energy simulation information, and to
suggest expert knowledge to the users in order to improve the existing residential energy
efficiency.

123
This procedure starts by asking questions of the users, such as homeowners, about their current
residential buildings. In order to properly identify the retrofit measures to be improved, the
questions should be organized with a logical hierarchy, also called a logic tree. According to this
logic tree organization, Exsys asks questions of the users, and selects the retrofit measures to be
improved based on their answers. The current retrofit measure components and the suggested
improvements become the input options for BEopt, which runs the energy simulation in order to
calculate the annual energy saving costs using the input options. This BEopt output cost
information goes back to Exsys, and Exsys derives the average cost for improving the retrofit
measure from the NREM database. The cost information is then utilized to prioritize the
measures. Finally, the prioritized measures and cost information are provided to the users, with
additional expert knowledge, by means of text files, images and web links.
In this process, two different software applications, Exsys and BEopt, interchange their input and
output information by writing output files and reading the files. For example, the BEopt energy
simulation program provides the annual energy cost information. This can be exported as a form
of text file. Exsys reads the BEopt output file, and the cost information becomes the input from
Exsys for further calculation (see Figure 5.1).

124
Figure 5.1: Overall Procedure and Limitation
5.1.2 Technical Limitation: Manual Work (BEopt)
Currently, there are technical limitations to simultaneously integrating the Exsys expert system
software, BEopt energy simulation software and the NREM XML database.
The first limitation is related to the Exsys running environment settings. While Exsys Corvid
must be “run as applet” when it uses the external XML database, it must be “run as application”
when it calls the external programs; these two different running environment settings cannot be

125
compatible. This limitation will be improved when Exsys releases the next version of its Corvid
software.
The second limitation is in BEopt. It is related to importing external information and then setting
it as an input option. Though BEopt does not provide such a function in the current version,
similar tasks will be available in the next version upgrade, which BEopt plans to release in the
summer of 2012.
With these current technical limitations, an amended development strategy has been employed in
“further steps,” by operating BEopt energy simulation manually and importing the BEopt output
file into Exsys Corvid. However, a separate BEopt calling example has been developed as well
for future development after the limitations are solved.
5.2 STRUCTURAL ANALYSIS
5.2.1 Linking Exsys Corvid Components and Quantitative Data Sources
The core of the integration model is Exsys Corvid, the expert system shell software, with other
external quantitative data sources integrated into this core. Therefore, the first step in developing
the integration model is to have a comprehensive understanding of the Exsys Corvid system
structure.
The basic components of Exsys Corvid are Variable Block, Logic Block, Command Block, and
the Result setting in Command Block. As explained in Chapter 3, each component plays a role in
incorporating the external data sources, which is a key to implementing the integration model.
126
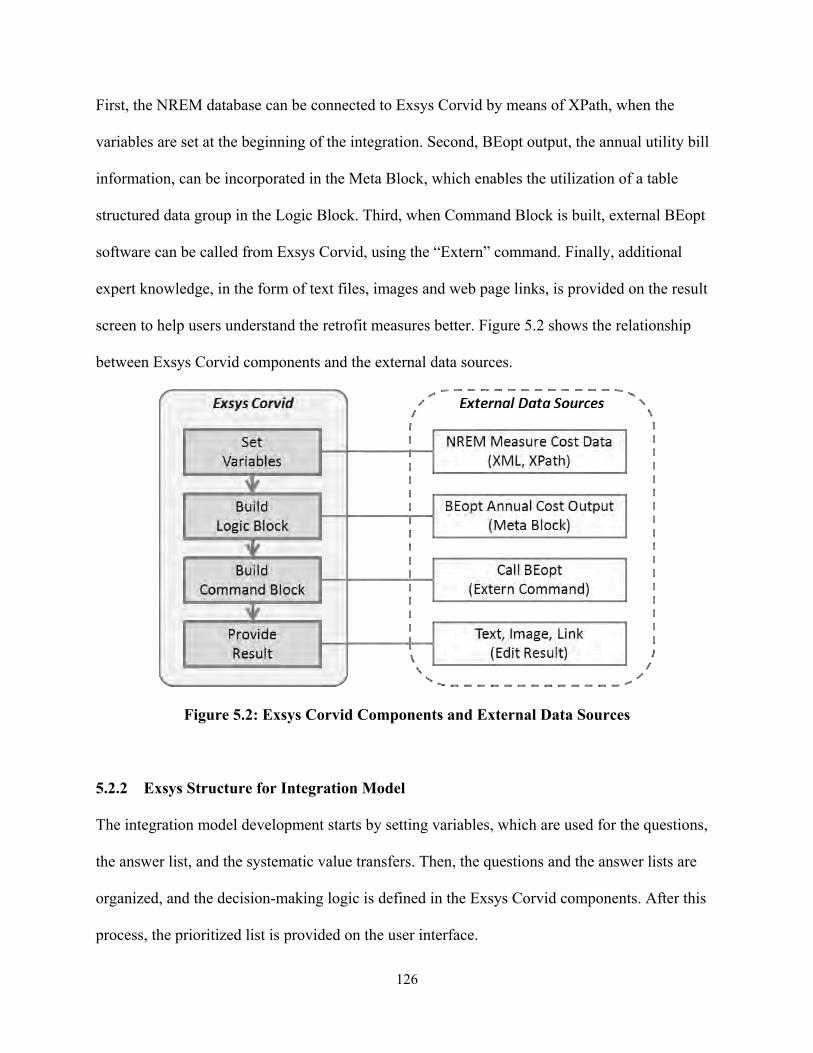
First, the NREM database can be connected to Exsys Corvid by means of XPath, when the
variables are set at the beginning of the integration. Second, BEopt output, the annual utility bill
information, can be incorporated in the Meta Block, which enables the utilization of a table
structured data group in the Logic Block. Third, when Command Block is built, external BEopt
software can be called from Exsys Corvid, using the “Extern” command. Finally, additional
expert knowledge, in the form of text files, images and web page links, is provided on the result
screen to help users understand the retrofit measures better. Figure 5.2 shows the relationship
between Exsys Corvid components and the external data sources.
Figure 5.2: Exsys Corvid Components and External Data Sources
5.2.2 Exsys Structure for Integration Model
The integration model development starts by setting variables, which are used for the questions,
the answer list, and the systematic value transfers. Then, the questions and the answer lists are
organized, and the decision-making logic is defined in the Exsys Corvid components. After this
process, the prioritized list is provided on the user interface.

127
Figure 5.3 explains this process within the Exsys Corvid structure. First, Logic Block deals with
general questions about the house and the retrofit measure information, in order to diagnose the
current energy efficiency of the user’s house, and the immediate needs. Based on the answers,
the Decision Support System selects retrofit measures to be improved. The information about the
selected measures is used as the input of a second Logic Block, which derives more specific
measure names found in the NREM database, by means of backward chaining. In a third Logic
Block, the cost information from the external data sources, such as BEopt and the NREM
database, forms a Meta Block, and this Meta Block is utilized in the decision support process and
the remaining budget calculation. According to the process, the retrofit measures are prioritized,
and the remaining budget and other information are displayed on the user interface. The
Command Block manages the whole sequence of the system process, controlling which
information will be shown and how it will be displayed on the result screen.
Figure 5.3: Exsys Corvid Developing Structure
128
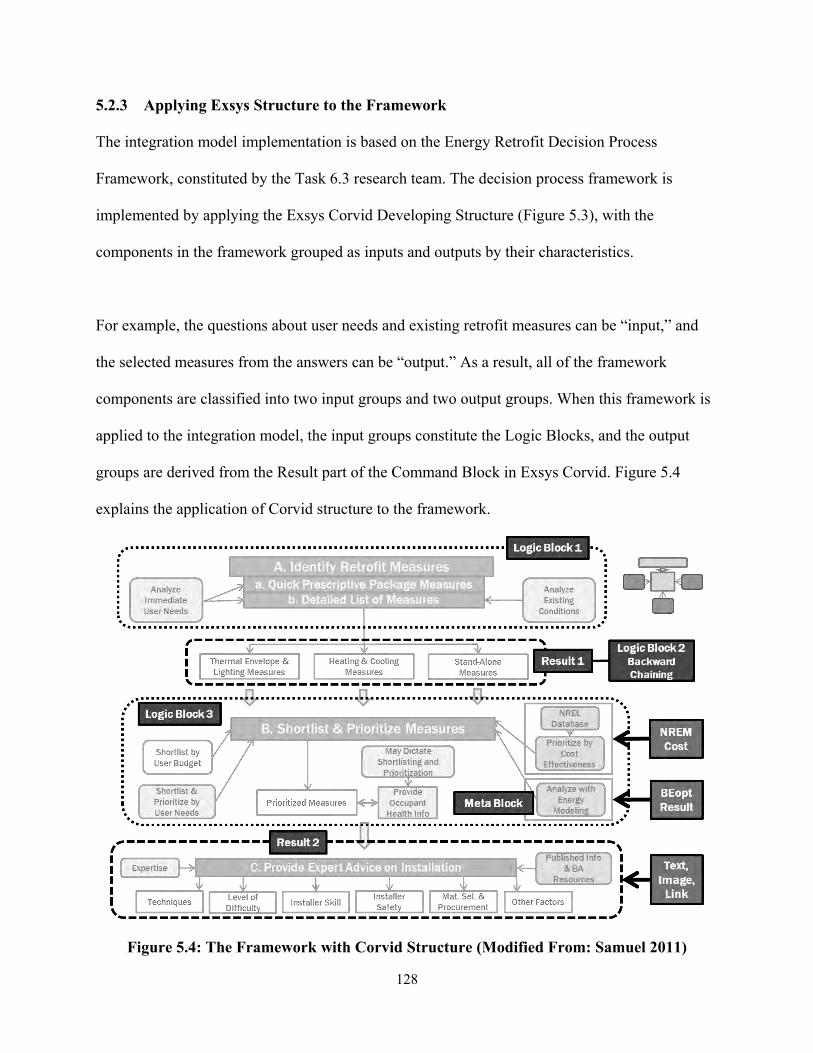
5.2.3 Applying Exsys Structure to the Framework
The integration model implementation is based on the Energy Retrofit Decision Process
Framework, constituted by the Task 6.3 research team. The decision process framework is
implemented by applying the Exsys Corvid Developing Structure (Figure 5.3), with the
components in the framework grouped as inputs and outputs by their characteristics.
For example, the questions about user needs and existing retrofit measures can be “input,” and
the selected measures from the answers can be “output.” As a result, all of the framework
components are classified into two input groups and two output groups. When this framework is
applied to the integration model, the input groups constitute the Logic Blocks, and the output
groups are derived from the Result part of the Command Block in Exsys Corvid. Figure 5.4
explains the application of Corvid structure to the framework.
Figure 5.4: The Framework with Corvid Structure (Modified From: Samuel 2011)
129
5.3 INTEGRATING EXTERNAL QUANTITATIVE INFORMATION
Information flow between Exsys Corvid and other external quantitative data sources is
fundamental to the integration model. The information flow can be divided into three steps, as
shown in Figure 5.5. The first step is selecting measure information in Exsys Corvid. This
information flows into the external data sources. In the next step, the information from Step1 is
processed in the different applications, BEopt (Step2A), the NREM database (Step2B), and
others (Step2C). Then, the outputs from Step2 go back to Exsys Corvid, where they are utilized
as the inputs for the next process.
In this integration model, the information processing methods differentiate according to
integration feasibility. While the information flow between Exsys Corvid and the NREM
database can be fully integrated, the flow between Exsys Corvid and BEopt is combined with
manual standalone work, due to the current technical limitations. Besides the NREM database
and BEopt information, annual loan payment and incentive amount information is manually
incorporated from other sources, such as DSIRE, in order to calculate the energy efficiency costs.
This section consists of three main parts. Section 5.3.1 explains the integration of the NREM
XML database. Section 5.3.2 provides an explanation of how the BEopt running output – the
annual utility bill cost information – is incorporated into Exsys Corvid. Section 5.3.3 accounts for
how additional text, image and web link information are provided on the result screen. Figure 5.5
demonstrates the information flow among Exsys Corvid and the external data sources.

130
Figure 5.5: Information Flow
5.3.1 Integrating the NREM XML Database
The NREM database delivers the cost information for implementing the retrofit measure
improvements from the before-components to the after-components. The NREM XML database
can be called from Exsys Corvid, usually during the variable-setting stage. When the external
XML database is called from Exsys Corvid, specific XPath query syntax is used to select the
target information from the XML node. In this process, the XML file must be located in the same
folder as the Exsys Corvid system files. The file name must be in quotes in the Xpath syntax in
order to be utilized.

131
Figure 5.6: Variable Option Setting
Figure 5.7: XML File Location

132
5.3.2 Integrating BEopt Information
After selecting the measures to be improved, the current retrofit measure information and its
improvements are set as the inputs for the BEopt energy simulation program. BEopt simulates
the energy efficiency and derives the annual utility bills for each measure application.
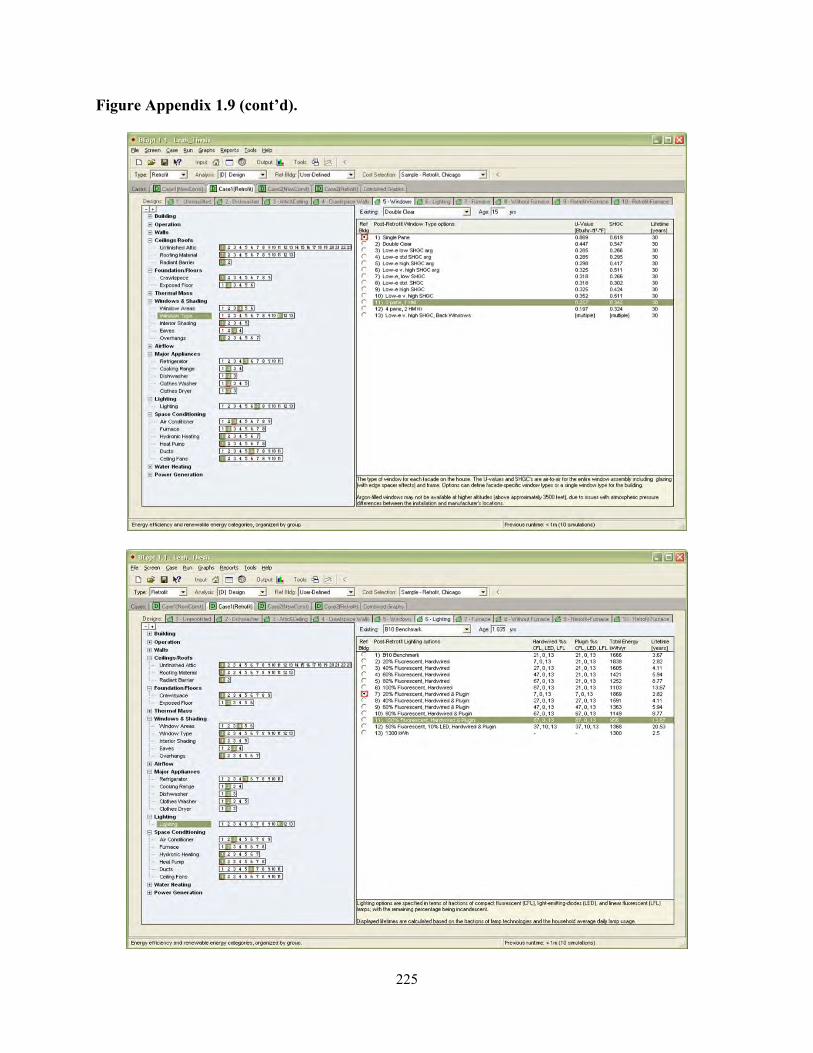
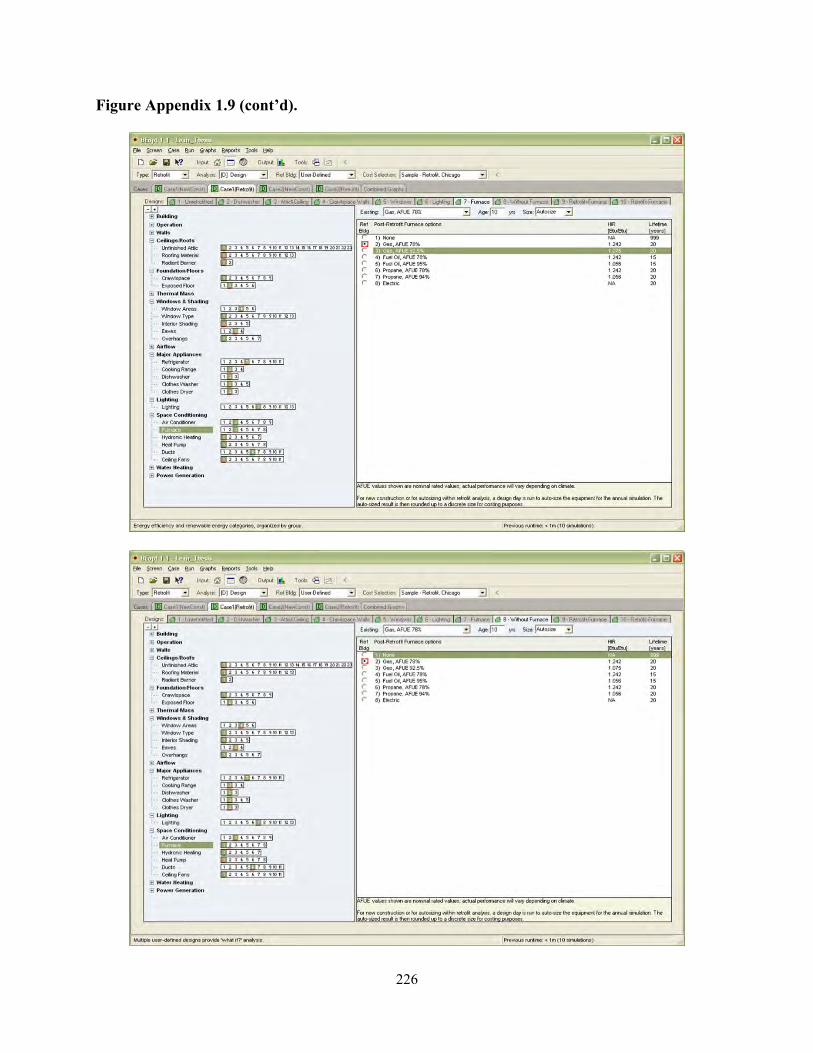
Figure 5.8: BEopt Input Screen
BEopt provides the annualized energy cost, which can be exported as output data in the form of
an Excel file. However, this BEopt output file must be modified in order to be utilized in Exsys
Corvid more easily.
133
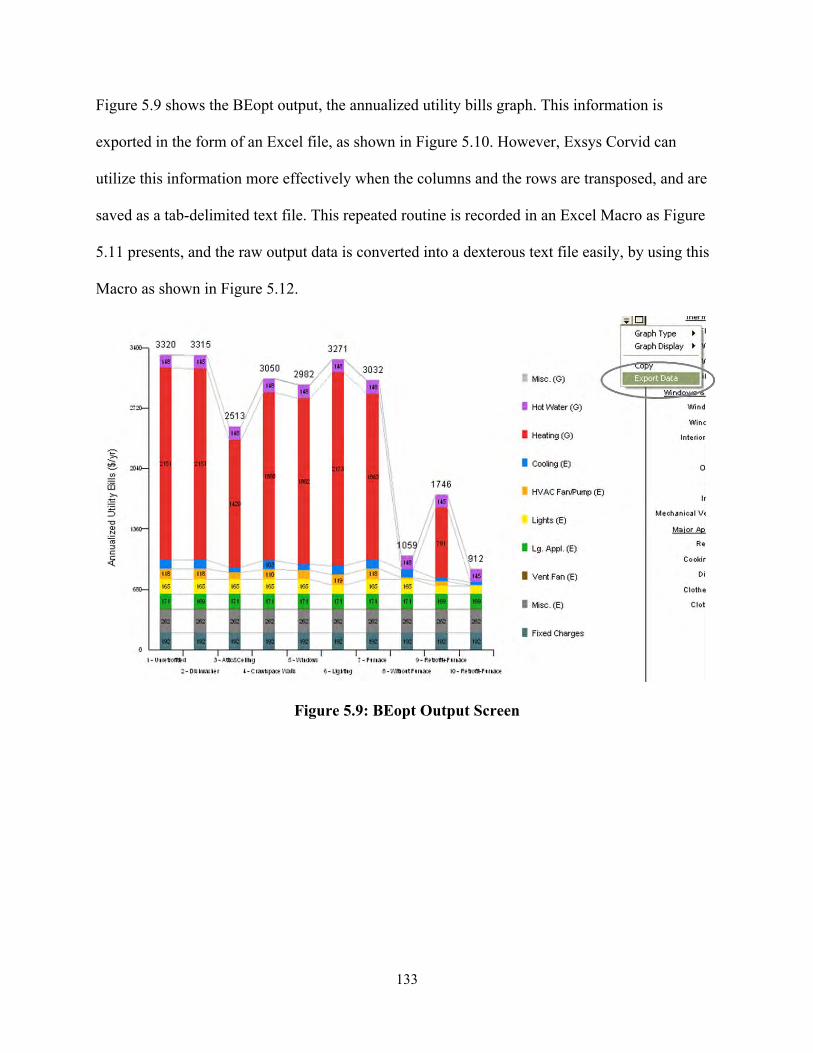
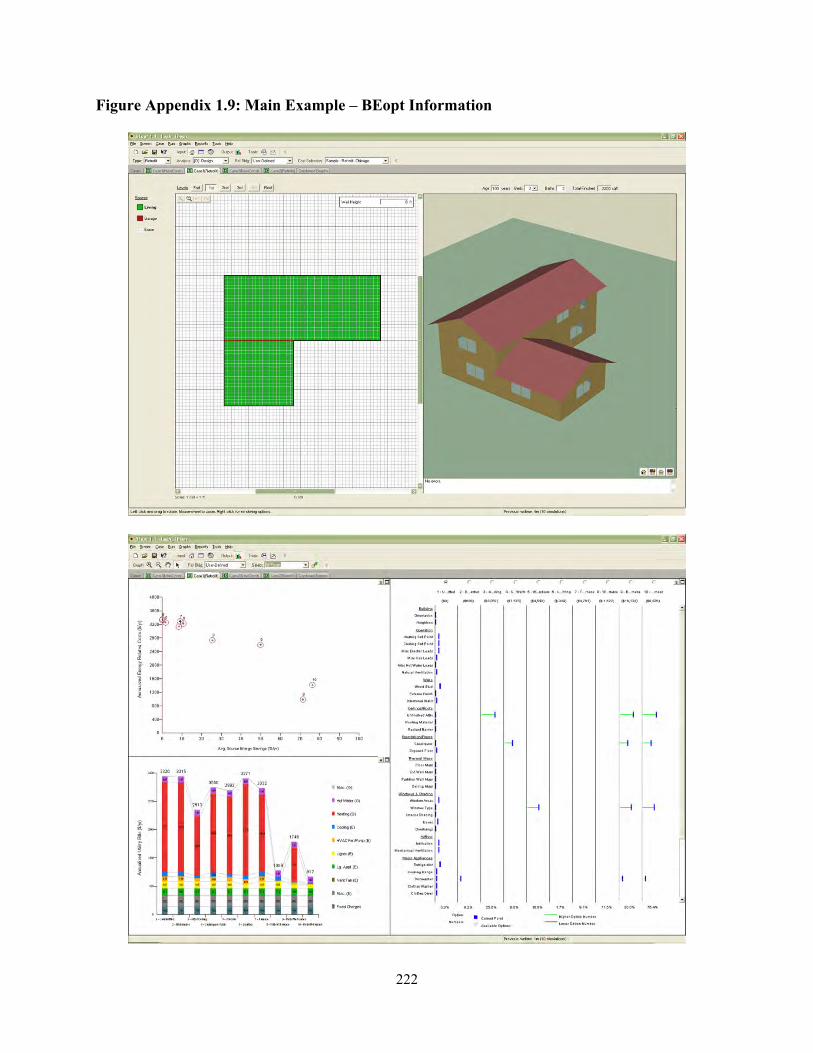
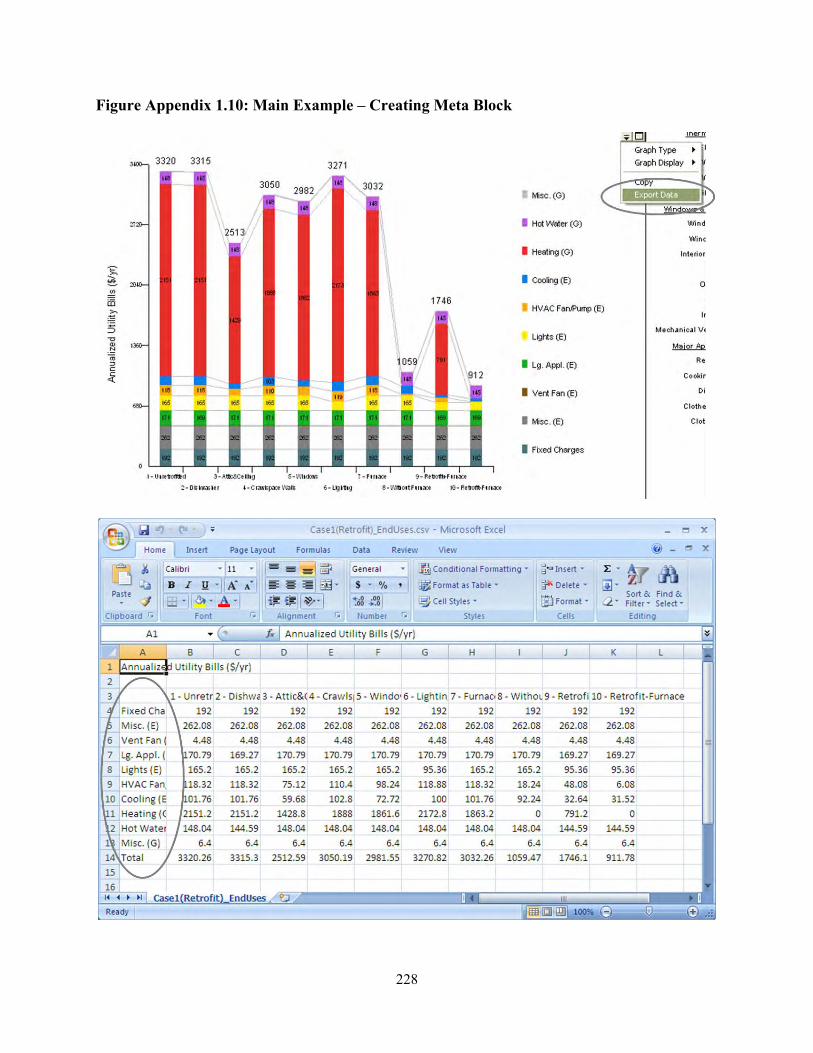
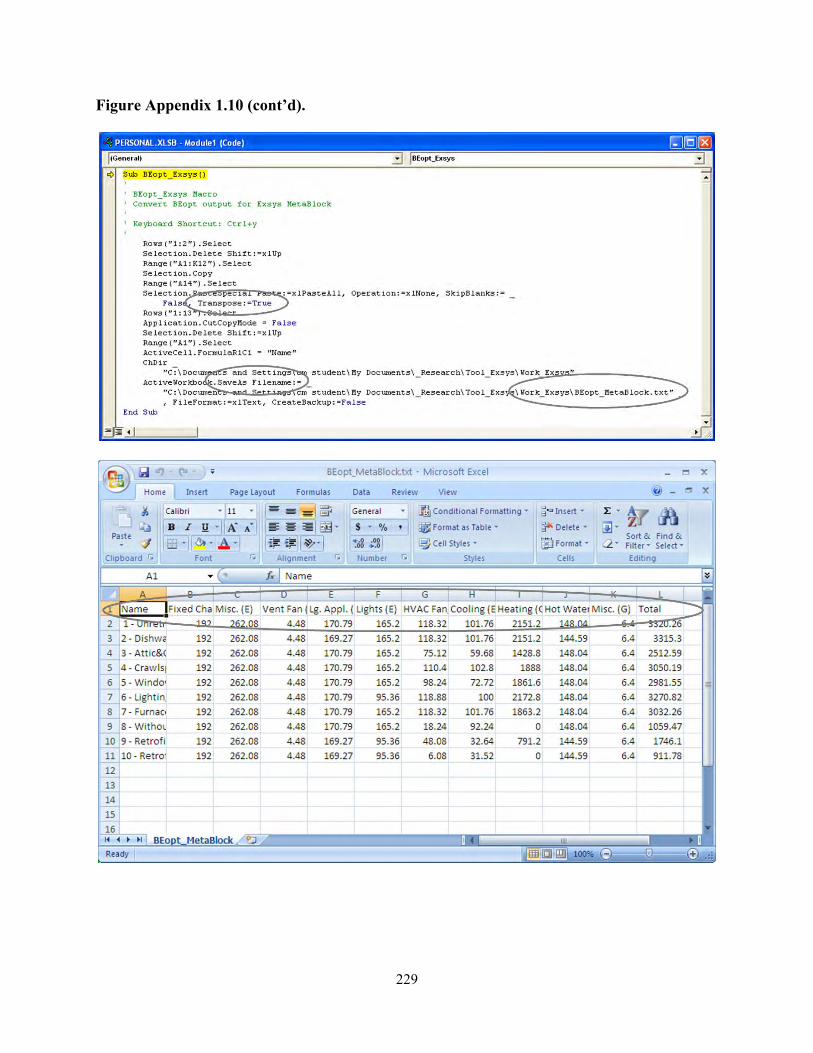
Figure 5.9 shows the BEopt output, the annualized utility bills graph. This information is
exported in the form of an Excel file, as shown in Figure 5.10. However, Exsys Corvid can
utilize this information more effectively when the columns and the rows are transposed, and are
saved as a tab-delimited text file. This repeated routine is recorded in an Excel Macro as Figure
5.11 presents, and the raw output data is converted into a dexterous text file easily, by using this
Macro as shown in Figure 5.12.
Figure 5.9: BEopt Output Screen

134
Figure 5.10: Exported BEopt Output Data (Raw File)
Figure 5.11: Converting File Using Excel Macro

135
Figure 5.12: Converted BEopt Output Data
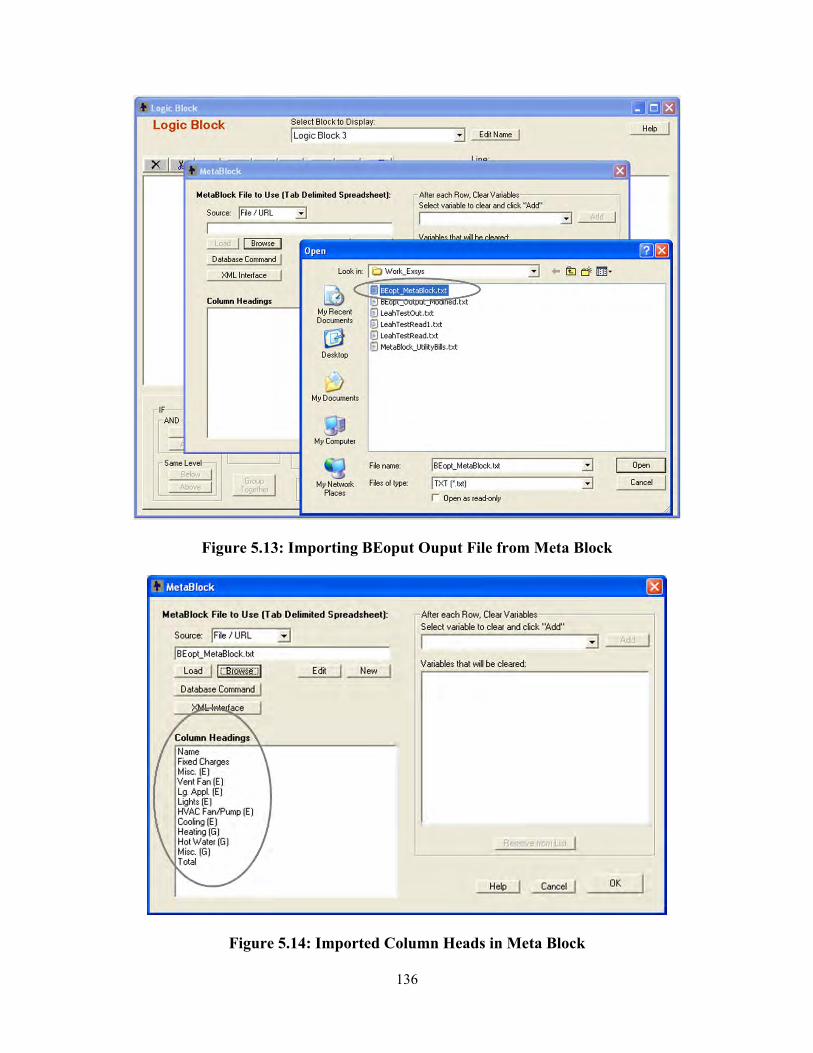
This converted BEopt output file can be imported into the Exsys Corvid Meta Block, to be used
for the process of further-prioritizing (see Figure 5.13). When this file is open from the Meta
Block section in the Logic Block, the column names and data are automatically placed inside the
data block with the columns and the rows (see Figure 5.14). The column headings and the data
can be used in Exsys Corvid, in the same ways as the other variables.
136
Figure 5.13: Importing BEoput Ouput File from Meta Block
Figure 5.14: Imported Column Heads in Meta Block

137
Figure 5.15: Imported Data in Meta Block
5.3.3 Integrating Text, Image and Link Information
At the end of the integration model running process, additional information is provided in the
form of text files, images and web links, in order to help users to understand the retrofit measures,
installation techniques and so on. This explanatory information can be delivered in different
ways in Exsys Corvid, according to its purpose and the location of the information display.
The first method is to use the Meta Block, which is extensible by adding new columns and new
data (see Figure 5.15). In this integration model, the Meta Block method is used to provide the
text files, the images and the web links. The file names of the images and the documents
specified in the Meta Block can be displayed on the result screen, combined with the program
logic and commands. The text and image files must be located in the same folder as the Exsys
Corvid system files in order to be referenced by just the file name.

138
Figure 5.16: Text, Image, Link Information in Meta Block
The second method is to specify the file information in the collection variables, which can
demonstrate the process information in the form of a report at the end of process-running (see
Figure 5.16). This method provides the same result as the Meta Block method. While the Meta
Block method is more useful when the text and image information are needed for every measure,
the Logic Block method is useful when only some of the measures need the text and image
information.
The last method is to use the Result setting in Command Block. This method is appropriate for
general information rather than specific measure-related information. In this integration model,
this method is used to explain the meaning of Effective Return and Effective Cost at the
beginning of the result screen.

139
5.4 INTEGRATION MODEL DEVELOPING PROCESS
In this chapter, the integration model is explained, following the sequence of system
development. The forepart of the integration modeling is related to the interaction with users,
which includes the steps for organizing the questions for users, compositing the answer list for
each question, and arranging the result display. The latter part deals more with Exsys Corvid
system-related development, which include the steps to set variables, to build logic blocks, and
to build command blocks. Each step will be explained in detail.
5.4.1 Organization of Questions
The first thing the integration model must decide is what to ask to users, in order to elicit the
current retrofit measure information for their residential buildings. In addition to understanding
the general information about residential retrofit measures, the NREM database measures and
BEopt input options must also be analyzed. Since the retrofit measure information must be
compatible between the NREM database and BEopt for the system integration, the questions
must be designed by the measure components that exist in both the NREM database and BEopt.
It is also essential to understand the NREM database measure structure, since the sub-questions
for a retrofit measure follow the NREM measure structure. For example, questions about
“dishwasher” start by asking about the users’ current dishwasher type – “standard” or “energy
star” – and ask about the quantity of the measure as well. This current dishwasher type matches
with the “before-component” in the NREM measure structure. Then, the integration model
provides possible improvements for the current measure, which match with the “after-component”
in the NREM measure structure. Based on the selected “before-component” and “after-

140
component,” the “average unit cost” for implementing the improvement is derived from the
NREM database. Since the “average unit cost” needs to be multiplied by the quantity fed by
users, to calculate the total NREM measure cost, the quantity question must use the same unit as
the NREM database. Figure 5.17 explains the M:N relationship between before-component and
after-components.
Figure 5.17: Selecting Possible Measure Improvements from NREM Database
5.4.2 Composition of Answer List
After deciding what to ask users, the multiple choice answer list under each question needs to be
composited. Each answer choice on the list is a measure component of the NREM database, but
the components must be also compatible with the BEopt input options, to interchange the retrofit
information between them.

141
This work is intricate, since the NREM database measure components and the BEopt input
options are quite different, even though they share same measure data information to some
degree. While some measures, such as attic insulation and furnaces, are fairly compatible with
each other, other measures, such as lighting types and window area, are nearly incompatible due
to the totally different approach each system uses to manage the measure information. Even in
some compatible measures, the measure components on the answer list are restricted to those
that exist in the BEopt input options, since the NREM database usually contains many more
measure components than BEopt.
Figure 5.18 shows an example using the compatible measure components between the NREM
database and BEopt, and Figure 5.19 shows the opposite example.
Figure 5.18: Compatible Measure Example between NREM Database and BEopt

142
Figure 5.19: Incompatible Measure Example between NREM Database and BEopt
5.4.3 Output Result Arrangement
The next step is to decide which information will be illustrated on the result screen, and in which
way. In this integration model, the result screen begins with an explanation about some of the
variables, such as Effective Return, Effective Cost and Payback Year. The core information – the
prioritized measure list – is then displayed, ordered by the values of the Effective Return variable,
with additional images, text, and web link information for each measure. At the end of the list,
the remaining budget is provided, calculated with the initial user’s budget and the effective cost
of each measure.
After deciding the user-interface-related process, the integration model development moves on to
building the Exsys Corvid system elements.

143
5.4.4 Variable Setting
Variable setting is the first step in converting the questions, the answer lists and the prioritizing
procedure to the Exsys Corvid system language. According to the properties of the questions and
the answer list, variable types are decided upon, and certain variable types are used to perform
specialized functions. In this research, Dynamic List Variables, Confidence Variables and
Collection Variables play significant roles in the implementation of the integration model. When
the variables are set, the external NREM database can also be called.
1) Selecting Variable Types
Dynamic List Variables are used to derive and demonstrate the possible measure improvement
list in this model. Dynamic List Variable values can be set at runtime, which means that the
values are from the reaction to the prior action. For example, the user chooses one answer from
among the several current measure components (before-components), and the chosen current
measure component derives its possible improvements (after-components) from the NREM
database. The possible after-component values vary, depending on which before-component is
selected during the runtime, so they cannot be pre-set during system development.
Confidence Variables are utilized to calculate Effective Return values, Effective Cost values,
Payback Year values, and Remaining Budget values. Confidence Variable values are calculated
using various rules, which are defined in the Logic Block. According to the formula specified in
the logic, the Confidence Variable values can be derived during the runtime. The confidence
value can be initialized for each measure or can be cumulated throughout the entire runtime. For
example, Effective Return, Effective Cost, and Payback Year values are initialized whenever the

144
system derives values for a measure component, to assign the calculated value to each
component. On the other hand, Remaining Budget values are cumulative, beginning with the
user’s initial budget, and continuously subtracting the Effective Cost of each measure.
Collection Variables are used to provide the prioritized list on the result screen. Collection
Variables can save the processing values during the runtime. The saved values can be displayed
on the result screen; this can be also used to debug logic errors during the system development.
Collection Variables can be displayed on the result screen, ordered by a specific variable value,
which is one of the key elements to prioritizing the retrofit measures. For example, in this
integration model, the prioritized measure list is ordered by Effective Return values, which
means that as the retrofit measure displays higher, it has a higher Effective Return value.
Since variable types are directly related to the attributes of measure components, both the
measure components and the Exsys Corvid variable types must be understood simultaneously in
the developing process.
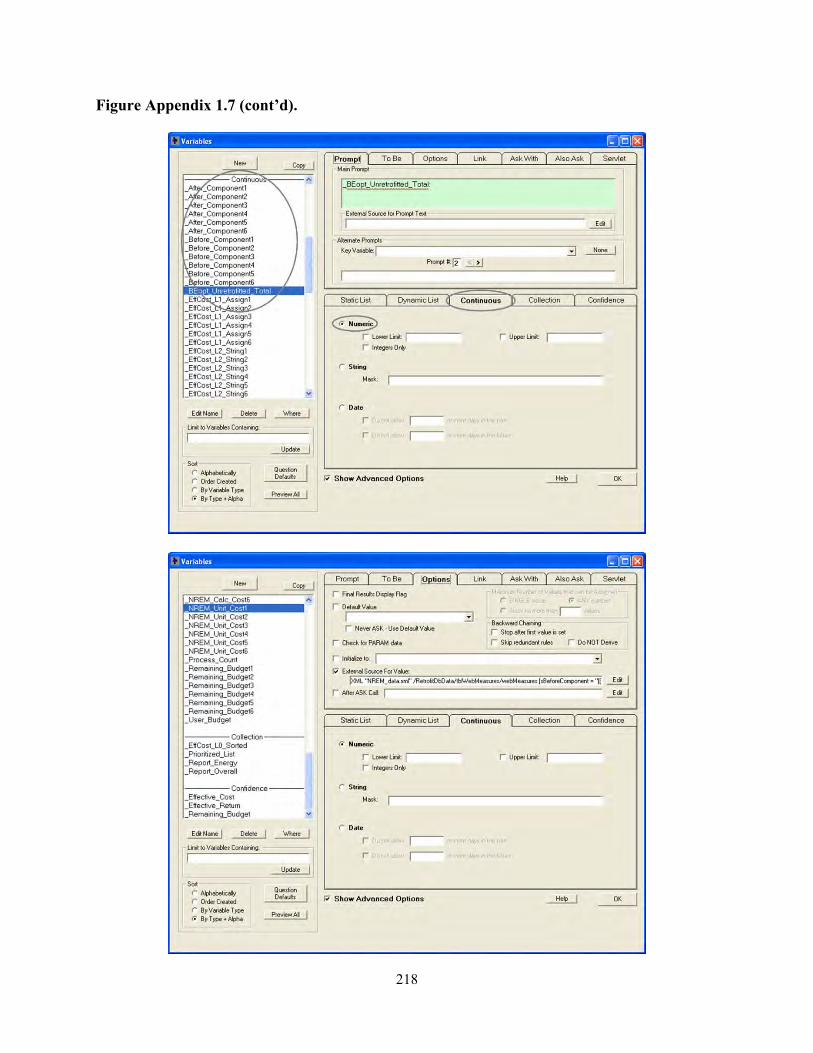
2) Calling External NREM XML Database
As explained in Section 5.3.1, the external database can be called when the variables are set, in
order to derive variable values from the database. In this integration model, the NREM database
is used to derive the possible measure improvement list, and its cost reference list. It is also used
to select the average cost to improve a specific current retrofit measure (before-component) to
another energy efficient measure (after-component). The XML database can be handled using
XPath. The main XPath query examples used in this integration model are shown below. In
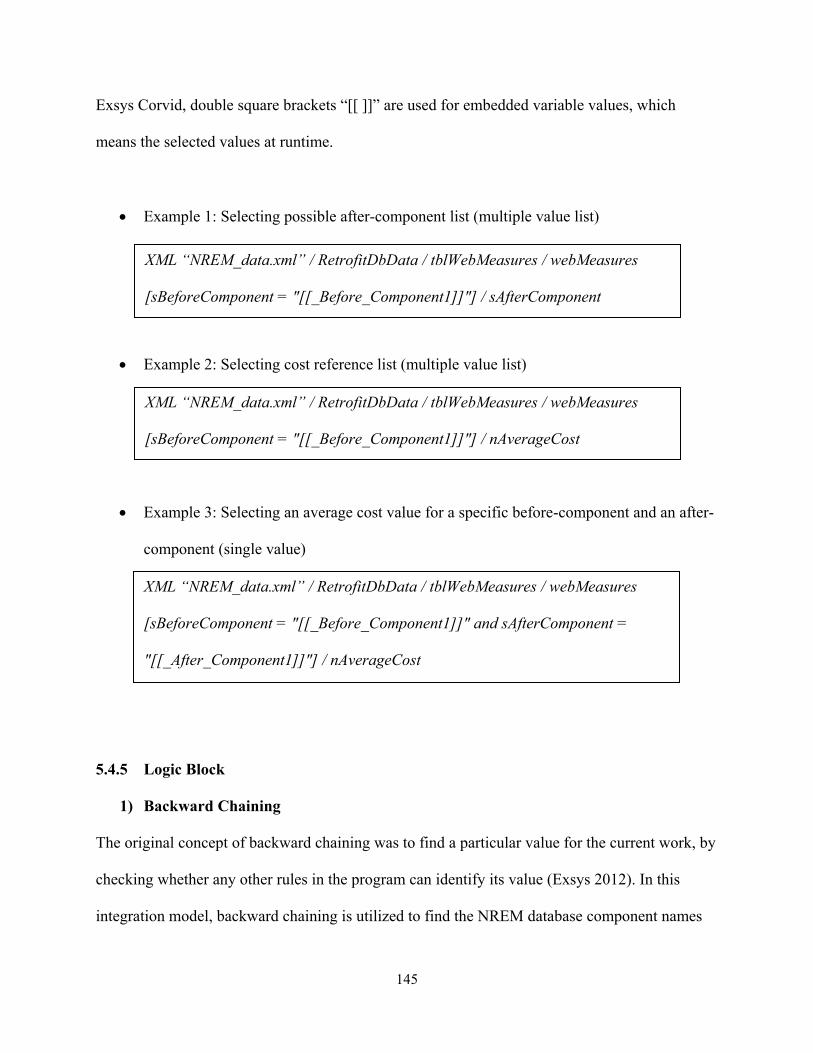
145
Exsys Corvid, double square brackets “[[ ]]” are used for embedded variable values, which
means the selected values at runtime.
Example 1: Selecting possible after-component list (multiple value list)
Example 2: Selecting cost reference list (multiple value list)
Example 3: Selecting an average cost value for a specific before-component and an after-
component (single value)
5.4.5 Logic Block
1) Backward Chaining
The original concept of backward chaining was to find a particular value for the current work, by
checking whether any other rules in the program can identify its value (Exsys 2012). In this
integration model, backward chaining is utilized to find the NREM database component names
XML “NREM_data.xml” / RetrofitDbData / tblWebMeasures / webMeasures
[sBeforeComponent = "[[_Before_Component1]]" and sAfterComponent =
"[[_After_Component1]]"] / nAverageCost
XML “NREM_data.xml” / RetrofitDbData / tblWebMeasures / webMeasures
[sBeforeComponent = "[[_Before_Component1]]"] / sAfterComponent
XML “NREM_data.xml” / RetrofitDbData / tblWebMeasures / webMeasures
[sBeforeComponent = "[[_Before_Component1]]"] / nAverageCost

146
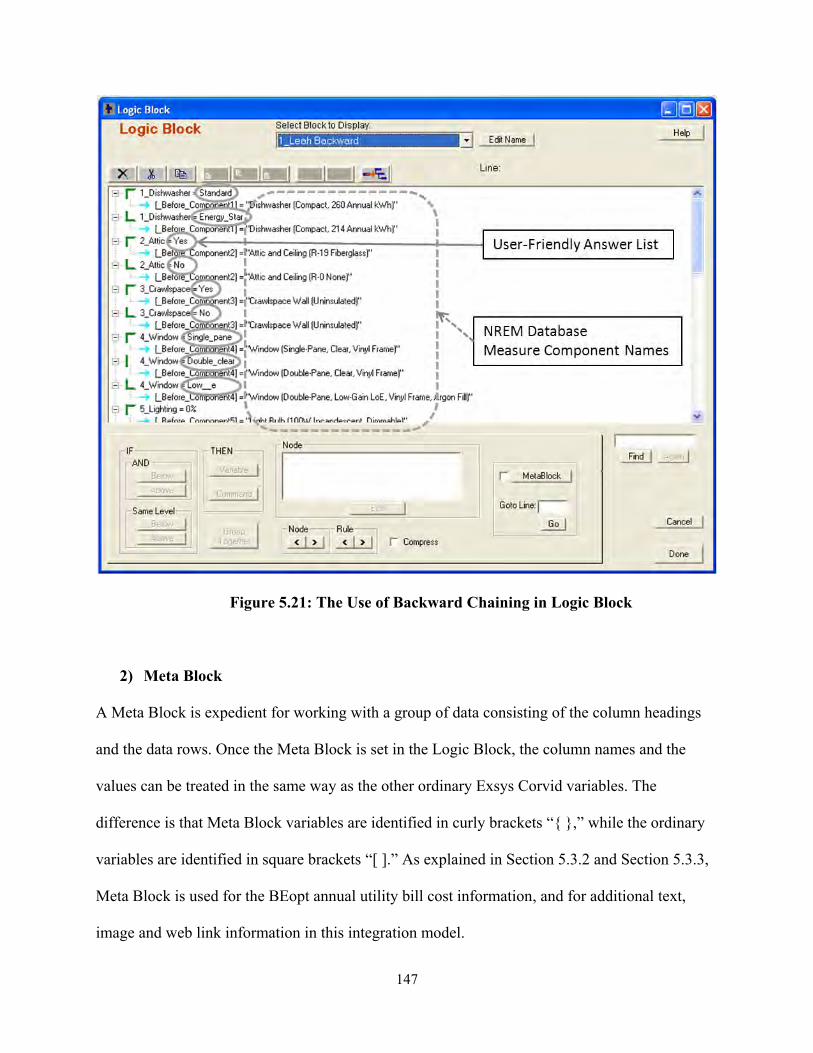
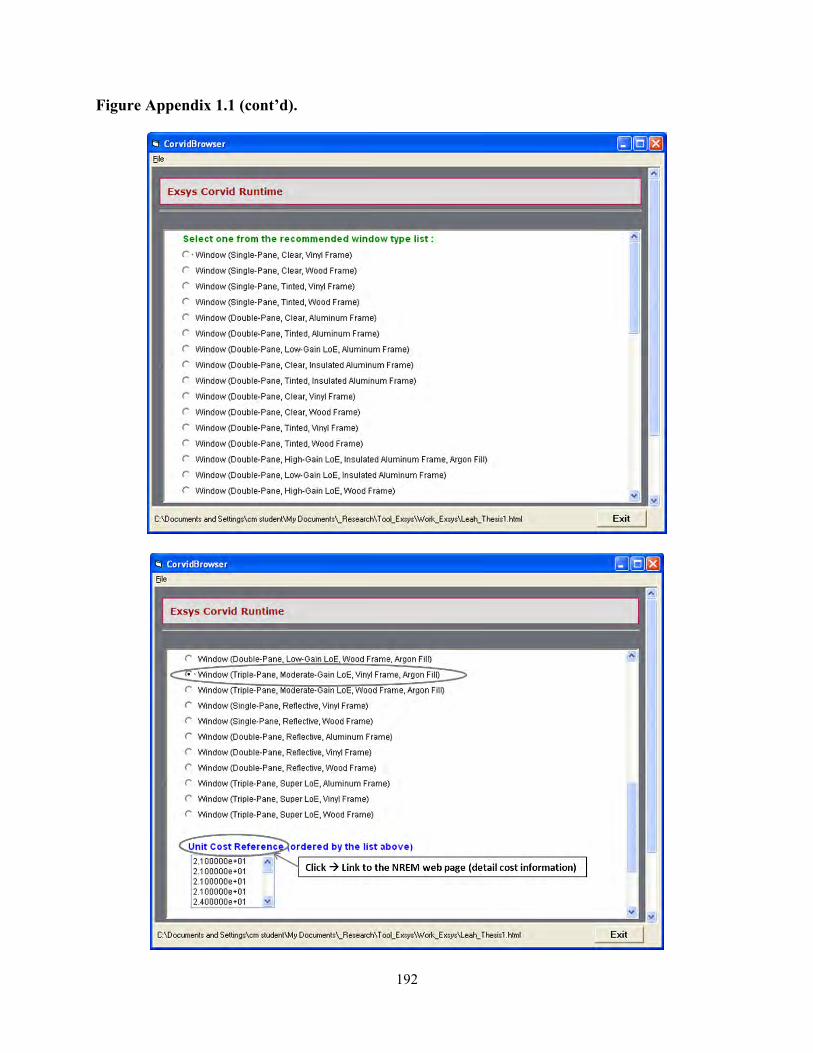
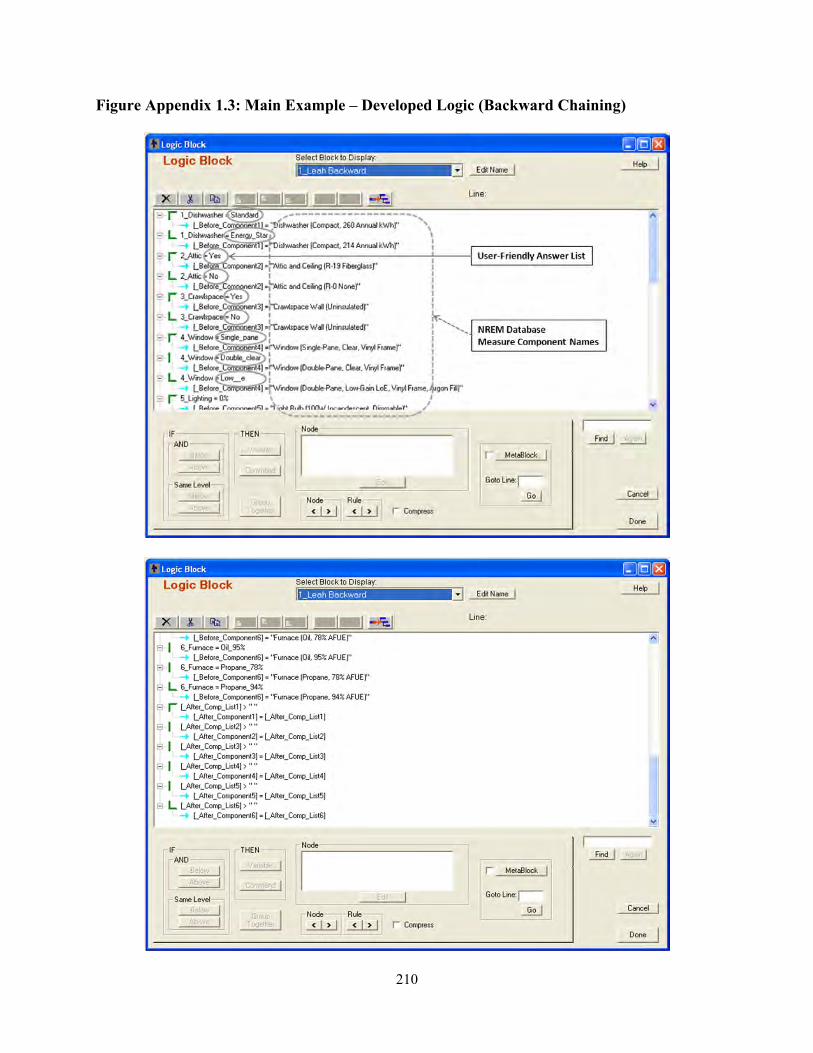
for the user-selected measure names. For example, when the integration model asks about a
window measure, the user can select the values from among “Single Pane”, “Double Pane” and
“Low-e”. However, these user-friendly simple names must be converted to the component names
of the NREM database to derive values from the database. A Logic Block specifies this
corresponding rule, and backward chaining helps to match “Single Pane” to “Window (Single-
Pane, Clear, Vinyl Frame)” for the NREM database’s use. Figure 5.20 explains the concept of
backward chaining and Figure 5.21 demonstrates the use of backward chaining in the integration
model.
Figure 5.20: The Concept of Backward Chaining
147
Figure 5.21: The Use of Backward Chaining in Logic Block
2) Meta Block
A Meta Block is expedient for working with a group of data consisting of the column headings
and the data rows. Once the Meta Block is set in the Logic Block, the column names and the
values can be treated in the same way as the other ordinary Exsys Corvid variables. The
difference is that Meta Block variables are identified in curly brackets “{ },” while the ordinary
variables are identified in square brackets “[ ].” As explained in Section 5.3.2 and Section 5.3.3,
Meta Block is used for the BEopt annual utility bill cost information, and for additional text,
image and web link information in this integration model.
148
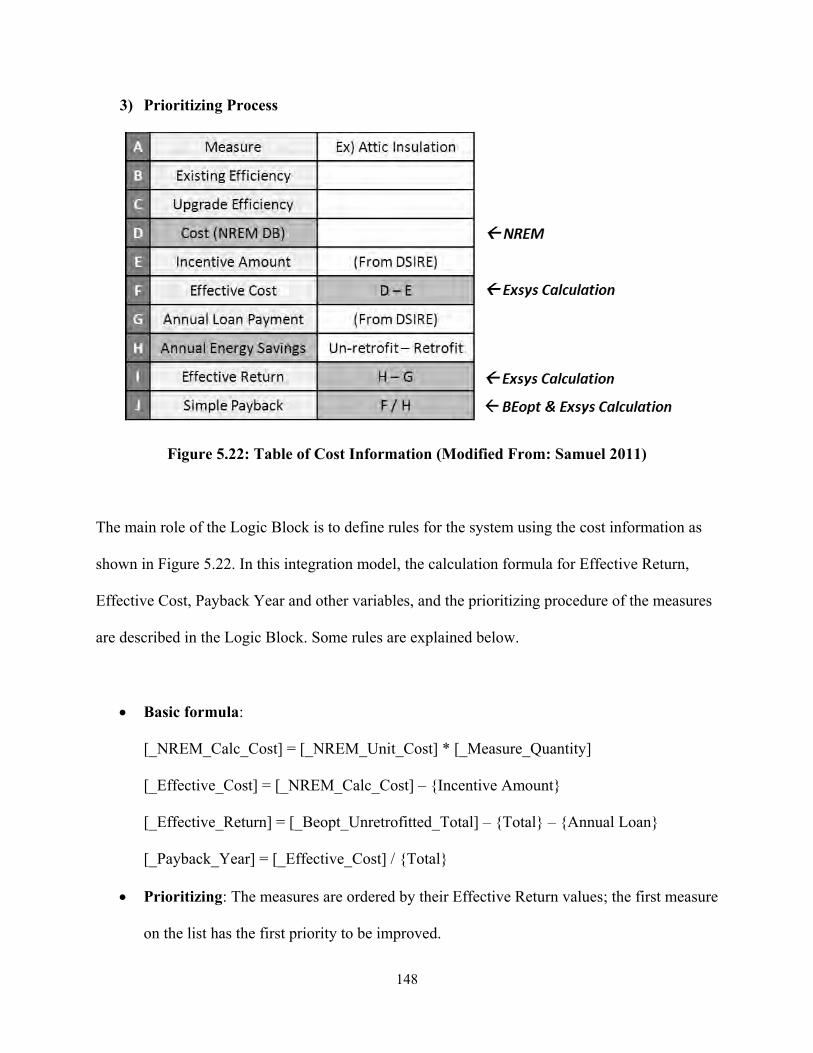
3) Prioritizing Process
Figure 5.22: Table of Cost Information (Modified From: Samuel 2011)
The main role of the Logic Block is to define rules for the system using the cost information as
shown in Figure 5.22. In this integration model, the calculation formula for Effective Return,
Effective Cost, Payback Year and other variables, and the prioritizing procedure of the measures
are described in the Logic Block. Some rules are explained below.
Basic formula:
[_NREM_Calc_Cost] = [_NREM_Unit_Cost] * [_Measure_Quantity]
[_Effective_Cost] = [_NREM_Calc_Cost] – {Incentive Amount}
[_Effective_Return] = [_Beopt_Unretrofitted_Total] – {Total} – {Annual Loan}
[_Payback_Year] = [_Effective_Cost] / {Total}
Prioritizing: The measures are ordered by their Effective Return values; the first measure
on the list has the first priority to be improved.

149
Immediate User Need: Effective Return values are usually calculated by the basic
formula, as explained above. If the measure is selected as the user’s immediate need at
the beginning of the questions, a pre-defined sufficiently big number (9999999) overrides
the calculated Effective Return value in order to give the selected measure the first
priority.
Payback Year: If the Payback Year value of the selected measure is greater than the
number of years the user intends to live at the home, 5000000 is subtracted from the
calculated Effective Return value, to give the selected measure less of a priority.
“0” value of the quantity: When the user inputs “0” for the quantity of a retrofit measure,
it returns “0” to both Effective Return and Effective Cost.
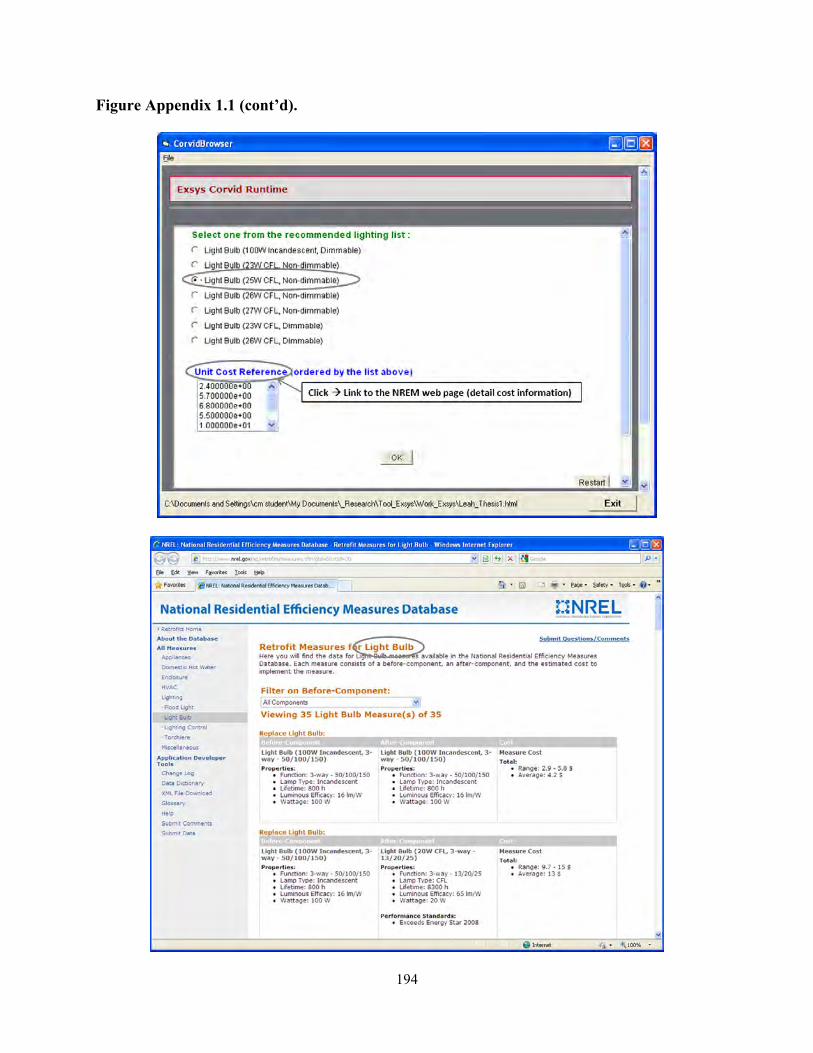
Lighting Measure: As explained in Section 5.4.2, due to the dissimilar measure
structures of lighting components in the NREM database and BEopt, a modified formula
is used to derive “_NREM_Calc_Cost” (the NREM measure cost for the selected
measure times the input quantity) for lighting. Since the lighting measure question asks
the current percentage of Compact Fluorescent Lights (CFL) installed in the user’s
residential building, the measure quantity needed for the improvement is [ (100% –
Current CFL %) * unit cost of a bulb * number of bulbs installed ]. For example, when
the current percentage of CFL is 40%, the number of bulbs installed in the house is 30,
and the unit cost of a CFL bulb is $6.80, the NREM measure cost for lighting becomes
[ (100% – 40%) * $ 6.8 * 30 ea. = $122.4 ].
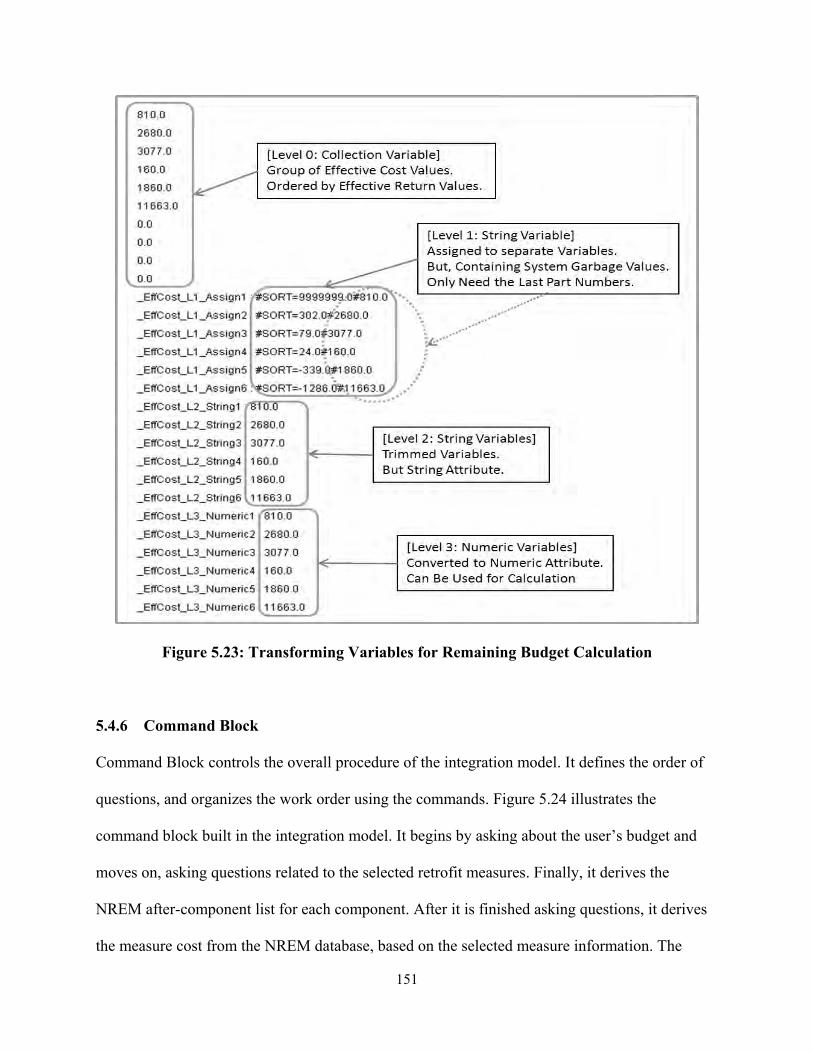
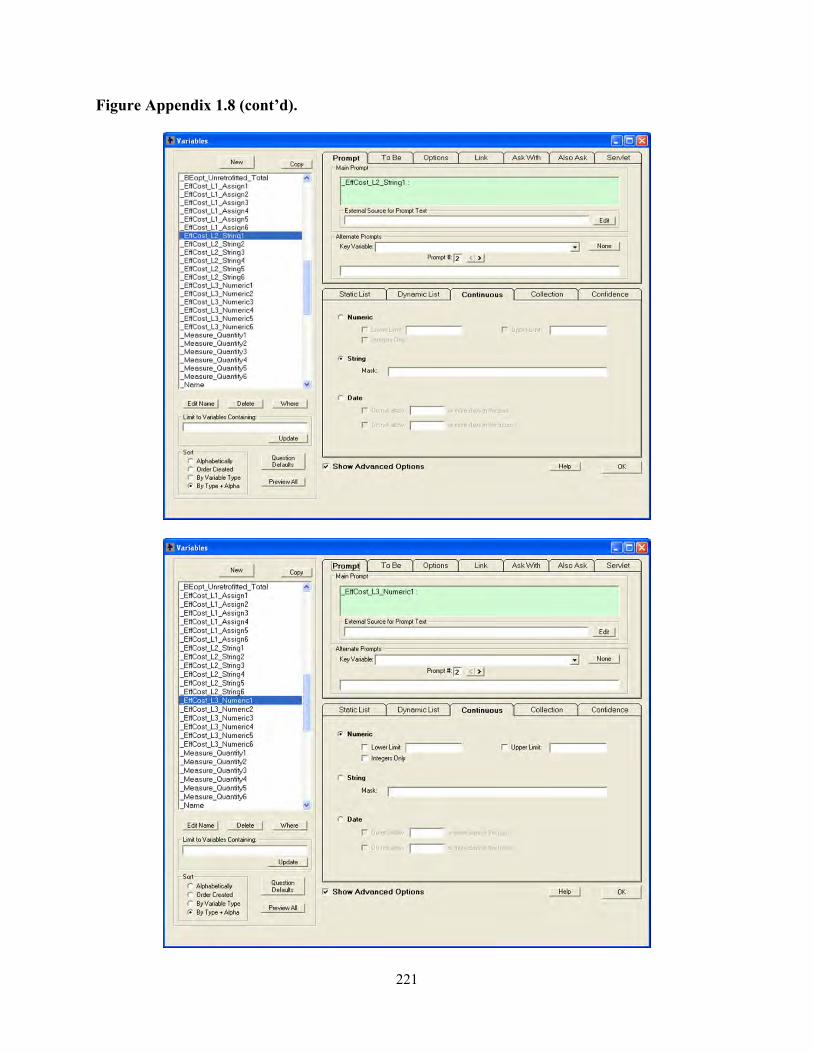
Calculating Remaining Budget: As Figure 5.23 illustrates, Remaining Budget can be
calculated after the measures and their Effective Cost values are ordered by Effective
Return values. The order of the Effective Cost of the measures is saved in Collection

150
Variables as one group of values [Level 0, raw data group]. At this level, the Effective
Cost values cannot be used for any calculation, therefore each value must be assigned to a
separate variable to keep the order [Level 1, separately assigned values]. However, when
the group of values is divided into each separate variable, they carry systematic garbage
values, which need to be trimmed [Level 2, trimmed values, string attribute]. Since
Collection Variables deal with the variable values as a string attribute, the variable
attribute must be changed to a numeric attribute in order to be used in calculation [Level
3, numeric values]. Each numeric Effective Cost value ordered by Effective Return can
then be calculated to get Remaining Budget. As the next measure cost is applied, the
Remaining Budget value is negatively accumulated.
[_Remaining_Budget] =
[_User_Budget] – [_EffCost_L3_Numeric1] Remaining Budget with 1st measure
– [_EffCost_L3_Numeric2] Remaining Budget with 2nd measure
– [_EffCost_L3_Numeric3] Remaining Budget with 3rd measure
– [_EffCost_L3_Numeric4] Remaining Budget with 4th measure
– [_EffCost_L3_Numeric5] Remaining Budget with 5th measure
– [_EffCost_L3_Numeric6] Remaining Budget with 6th measure
151
Figure 5.23: Transforming Variables for Remaining Budget Calculation
5.4.6 Command Block
Command Block controls the overall procedure of the integration model. It defines the order of
questions, and organizes the work order using the commands. Figure 5.24 illustrates the
command block built in the integration model. It begins by asking about the user’s budget and
moves on, asking questions related to the selected retrofit measures. Finally, it derives the
NREM after-component list for each component. After it is finished asking questions, it derives
the measure cost from the NREM database, based on the selected measure information. The

152
command block then employs the Logic Block, which contains the prioritizing logic. At the end
of the command block, it specifies the result setting for the user interface.
Figure 5.24: Command Block in Integration Model
The result screen can be handled in the Command Block. Figure 5.25 shows the screen setting
for the integration model. The title and the explanation of the concept of Effective Cost and
Effective Return are shown at the top. The prioritized list saved in “Report_Overall,” a
Collection Variable, is displayed with an additional image, text, and web-link information.
Finally, the calculated Remaining Budget values are provided to the users.

153
Figure 5.25: Result Setting in Command Block
5.5 WORKING EXAMPLE
In this section, the integration model is demonstrated using a working example, and the running
process is explained with the help of selected screen captures of the system. All of the screen
captures of the running process are provided in the Appendix.
5.5.1 Basic Questioning Process
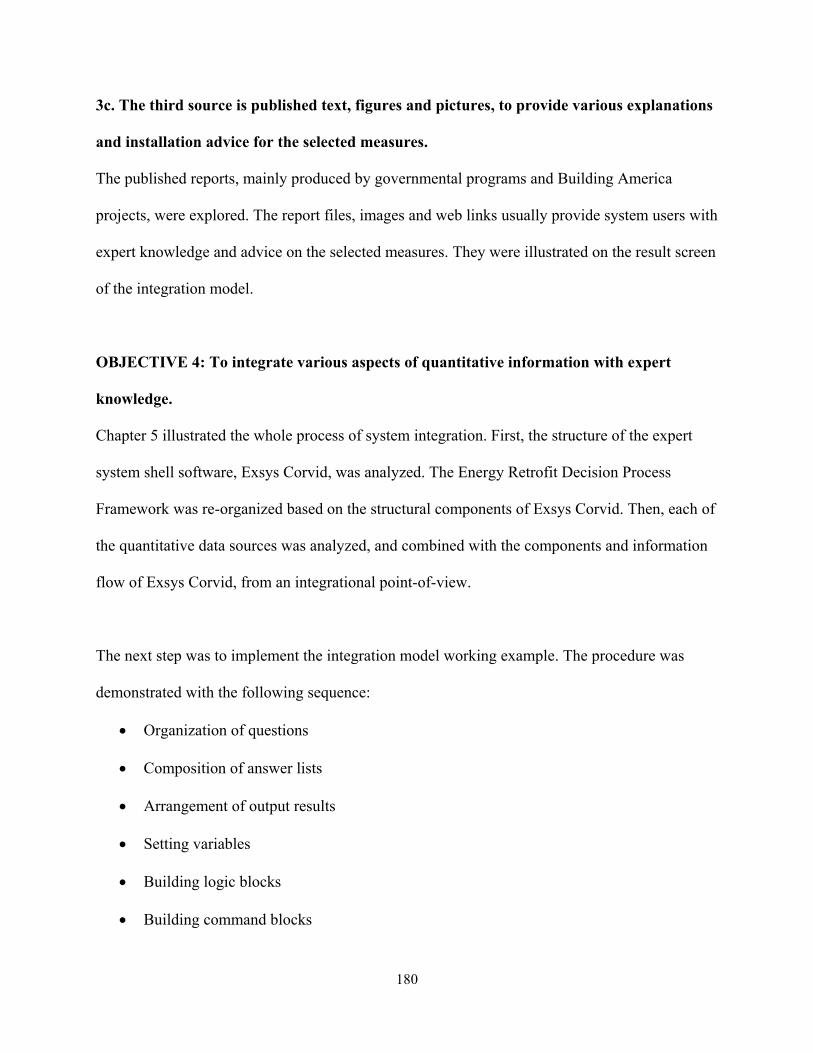
The running process begins with questions about the user’s budget, the year the home was built,
the number of years the user intends to live at the home, and the retrofit measure the user needs

154
immediately. If a measure is selected as the user’s immediate need, it has first priority for being
improved. In this case, the initial user budget is 8,000 dollars, and the user needs to change the
current dishwasher immediately.
Figure 5.26: Initial Questions in the Running Process
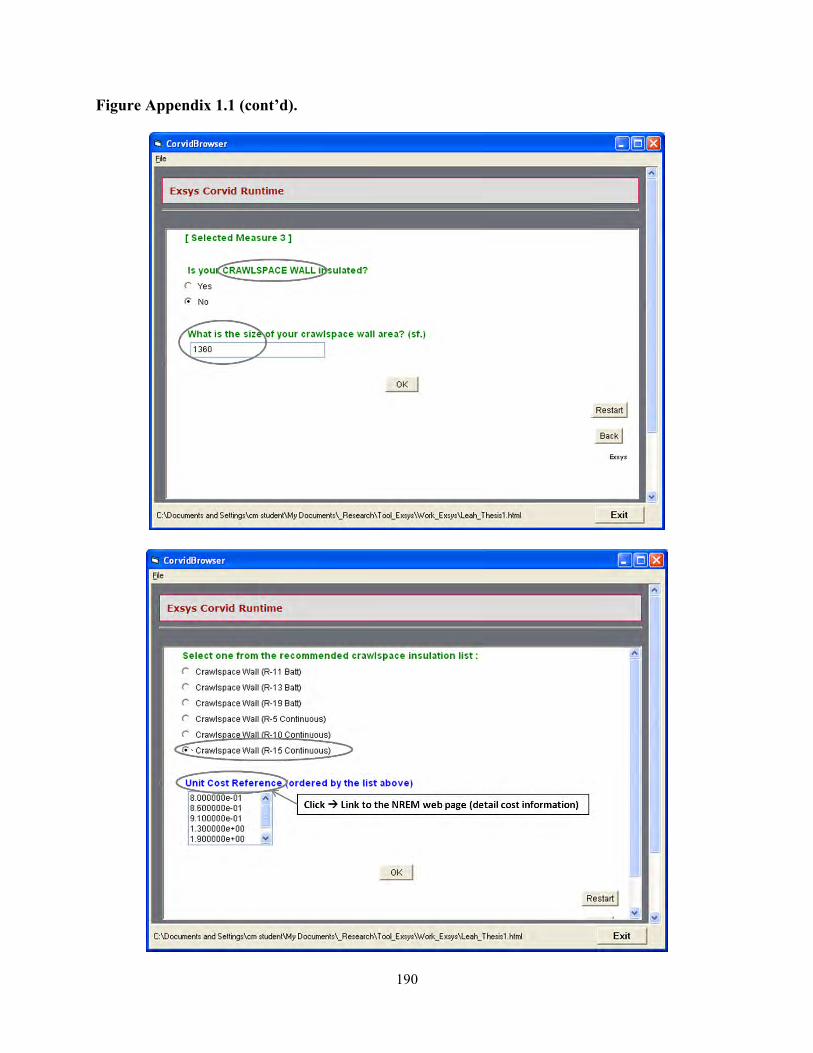
The system then asks about all of the selected measures. In this working example, 6 retrofit
measures are selected, including the dishwasher, attic insulation, crawlspace wall insulation,
windows, lighting and furnace.
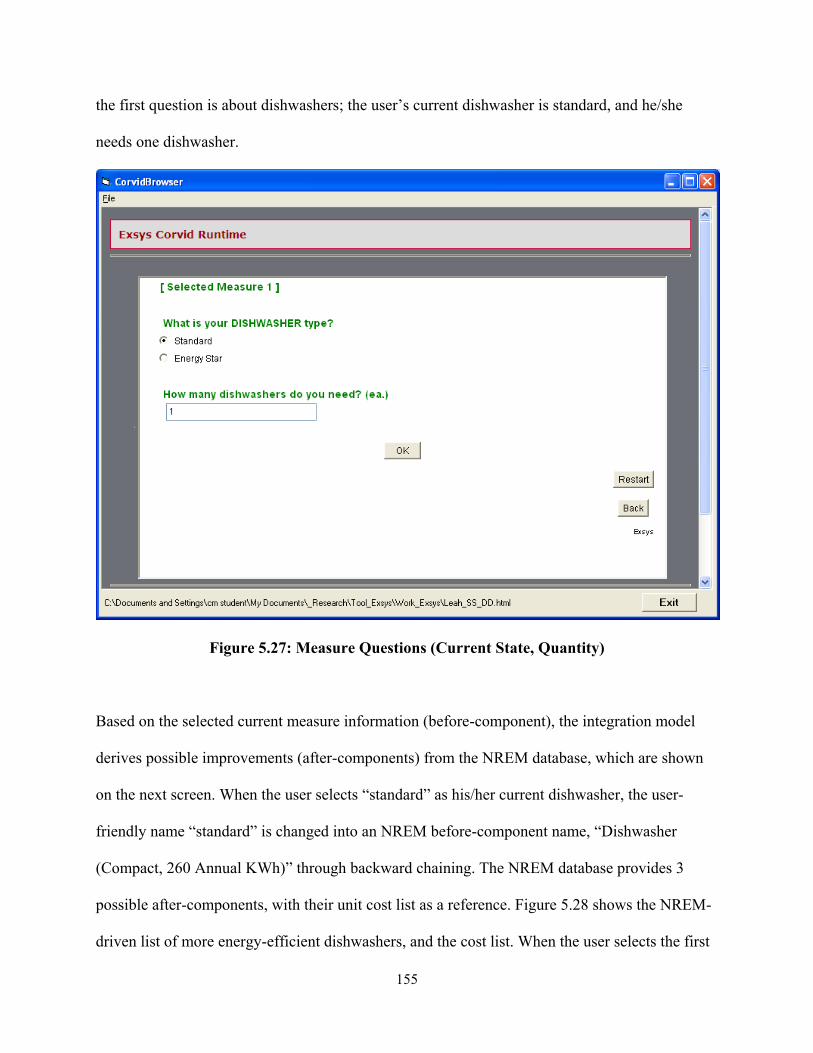
The questions for one retrofit measure consist of the current measure state, the quantity needed,
the list of possible improvements and the reference list of the measure unit costs. In Figure 5.27
155
the first question is about dishwashers; the user’s current dishwasher is standard, and he/she
needs one dishwasher.
Figure 5.27: Measure Questions (Current State, Quantity)
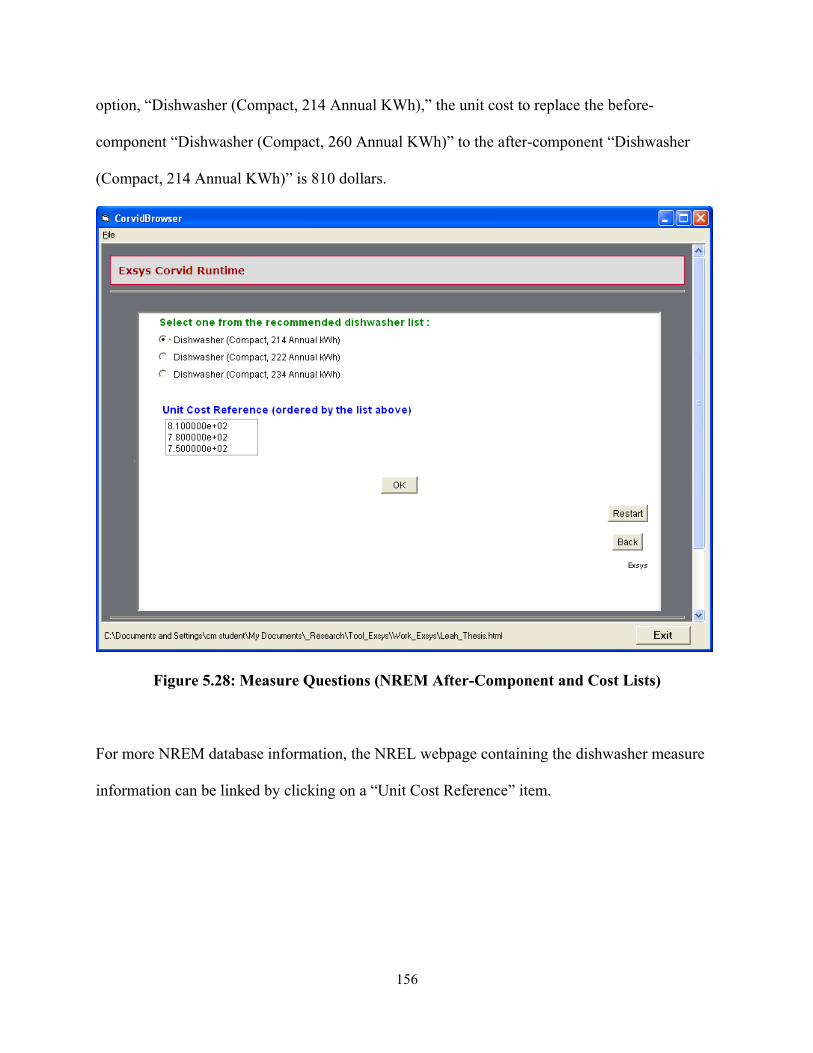
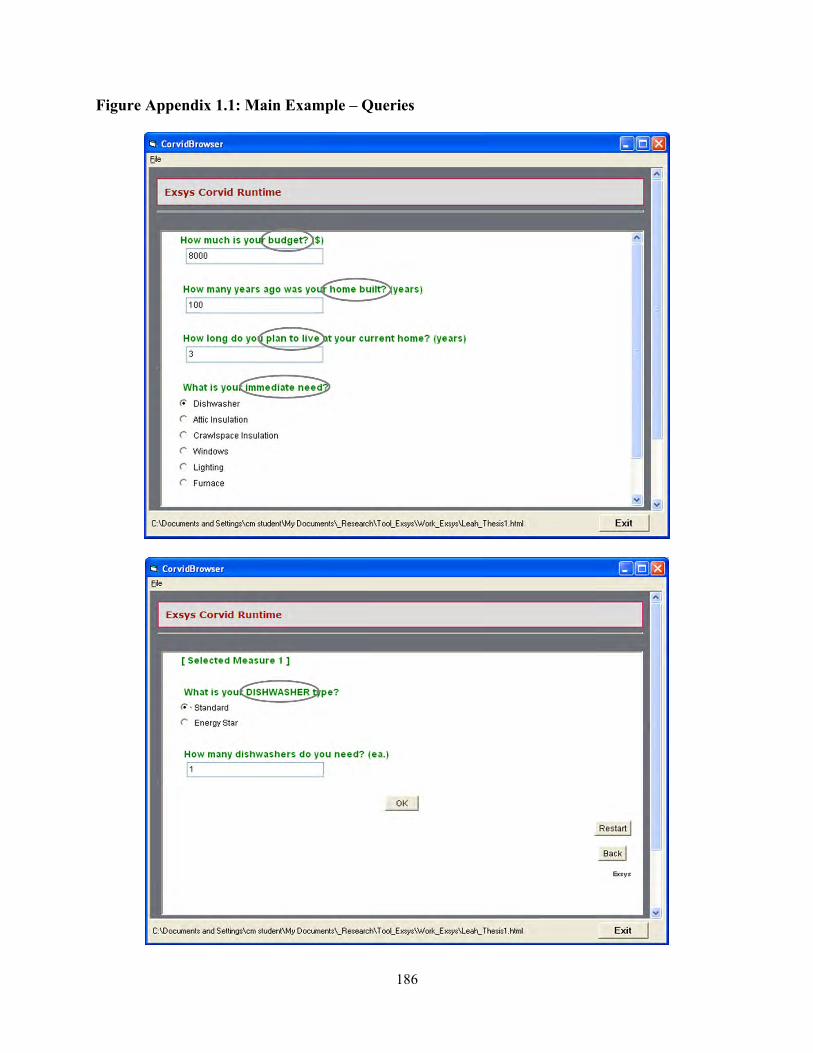
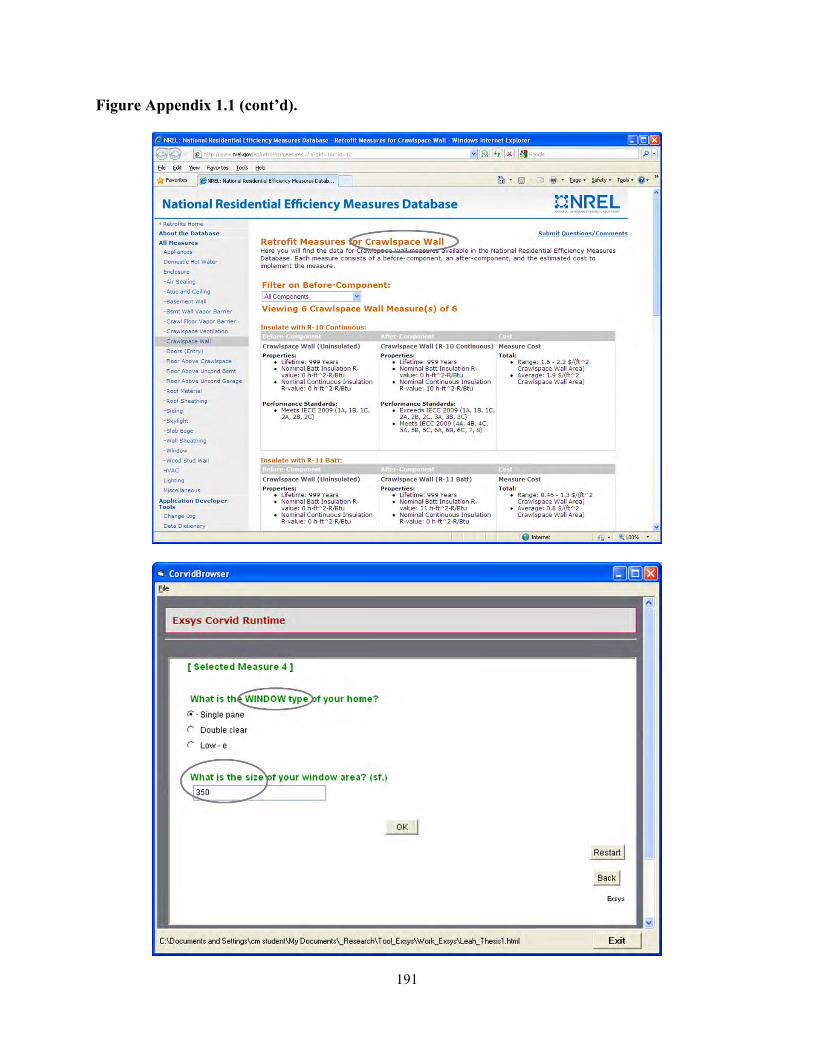
Based on the selected current measure information (before-component), the integration model
derives possible improvements (after-components) from the NREM database, which are shown
on the next screen. When the user selects “standard” as his/her current dishwasher, the user-
friendly name “standard” is changed into an NREM before-component name, “Dishwasher
(Compact, 260 Annual KWh)” through backward chaining. The NREM database provides 3
possible after-components, with their unit cost list as a reference. Figure 5.28 shows the NREM-
driven list of more energy-efficient dishwashers, and the cost list. When the user selects the first
156
option, “Dishwasher (Compact, 214 Annual KWh),” the unit cost to replace the before-
component “Dishwasher (Compact, 260 Annual KWh)” to the after-component “Dishwasher
(Compact, 214 Annual KWh)” is 810 dollars.
Figure 5.28: Measure Questions (NREM After-Component and Cost Lists)
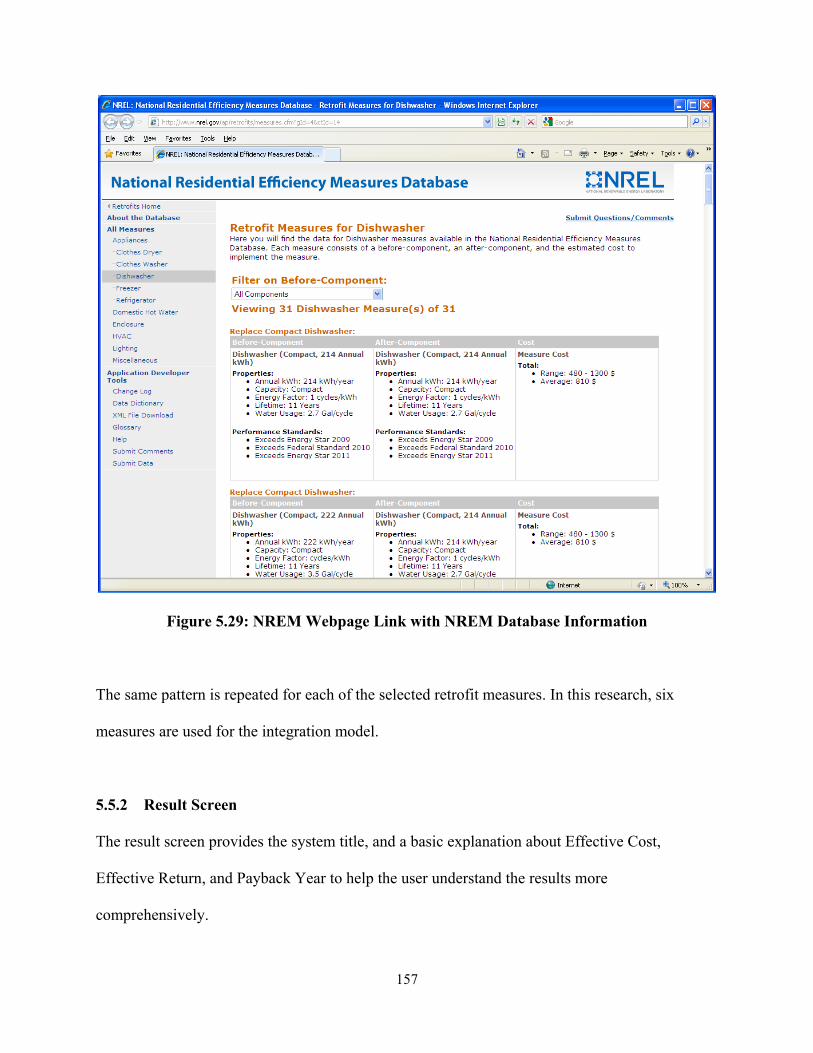
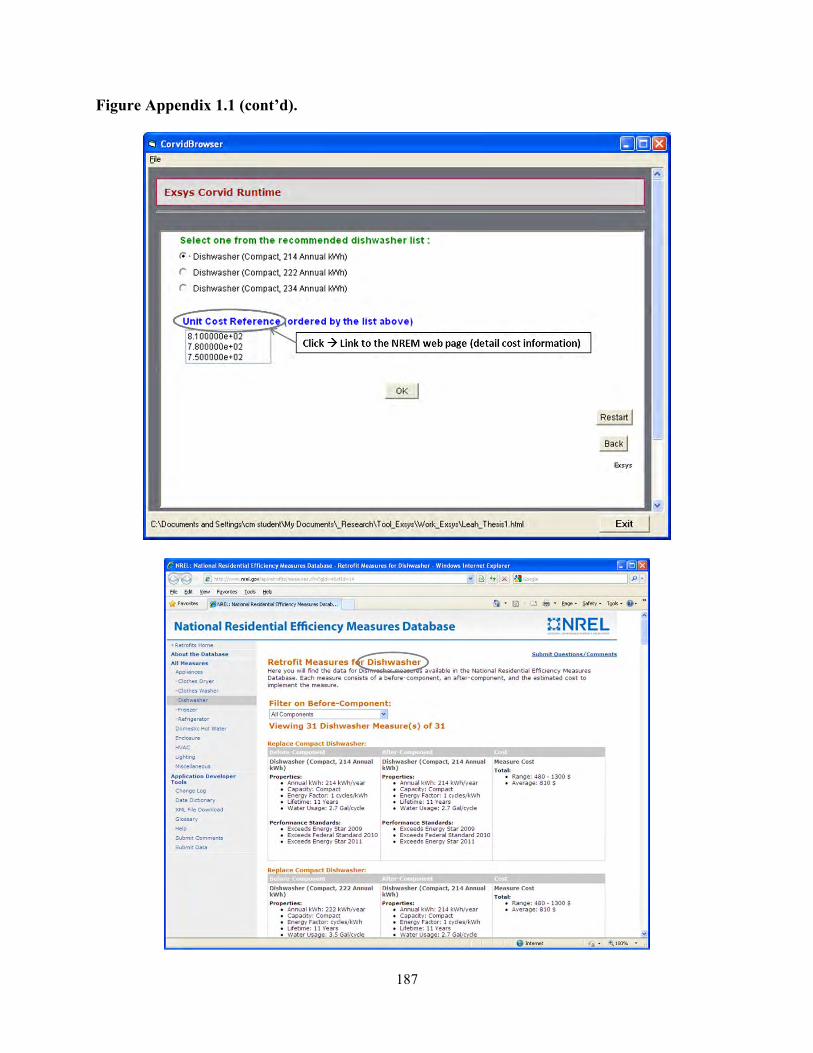
For more NREM database information, the NREL webpage containing the dishwasher measure
information can be linked by clicking on a “Unit Cost Reference” item.
157
Figure 5.29: NREM Webpage Link with NREM Database Information
The same pattern is repeated for each of the selected retrofit measures. In this research, six
measures are used for the integration model.
5.5.2 Result Screen
The result screen provides the system title, and a basic explanation about Effective Cost,
Effective Return, and Payback Year to help the user understand the results more
comprehensively.

158
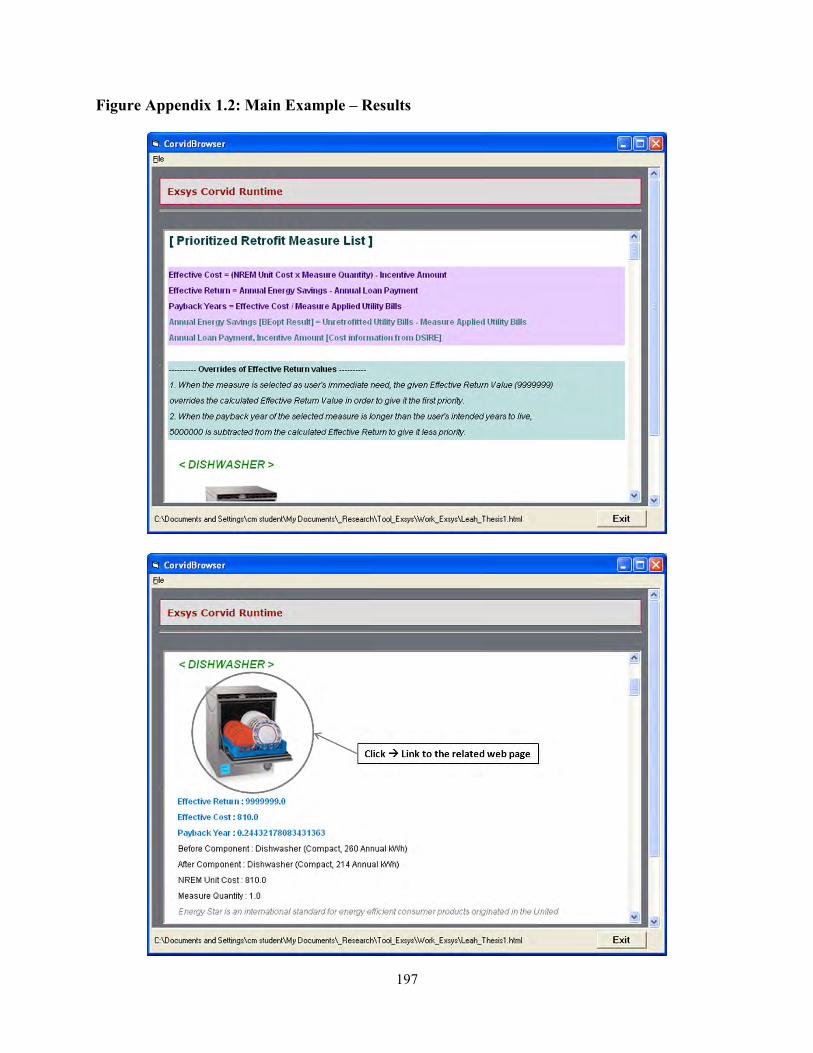
Figure 5.30: The Beginning Part of the Result Screen
In this case, the user selected the dishwasher as his/her immediate need; thus it is shown at the
top of the list as the first priority. Since it is the user’s immediate need, the pre-defined large
value ‘9999999’ overrides the calculated Effective Return value. The result screen also shows
which before and after components are selected at runtime, the input quantity and the unit cost of
the dishwasher derived from the NREM database. Additional images and text explanation are
also provided on the result screen.

159
Figure 5.31: Information on the Result Screen
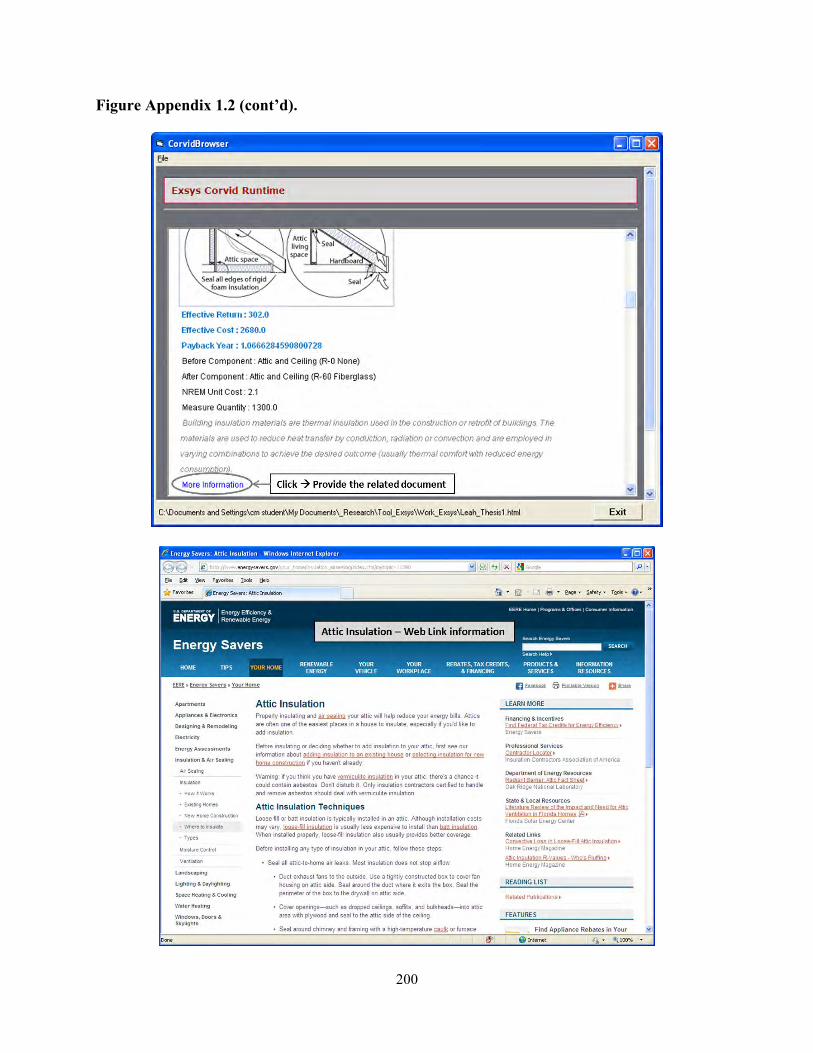
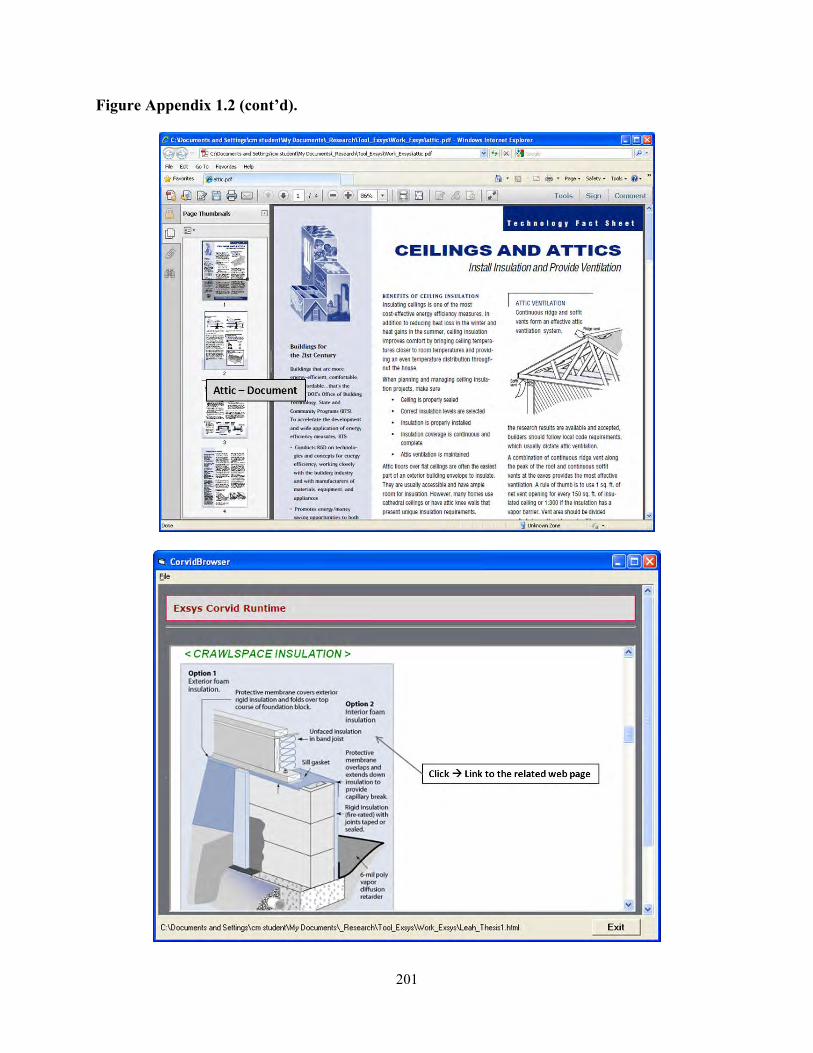
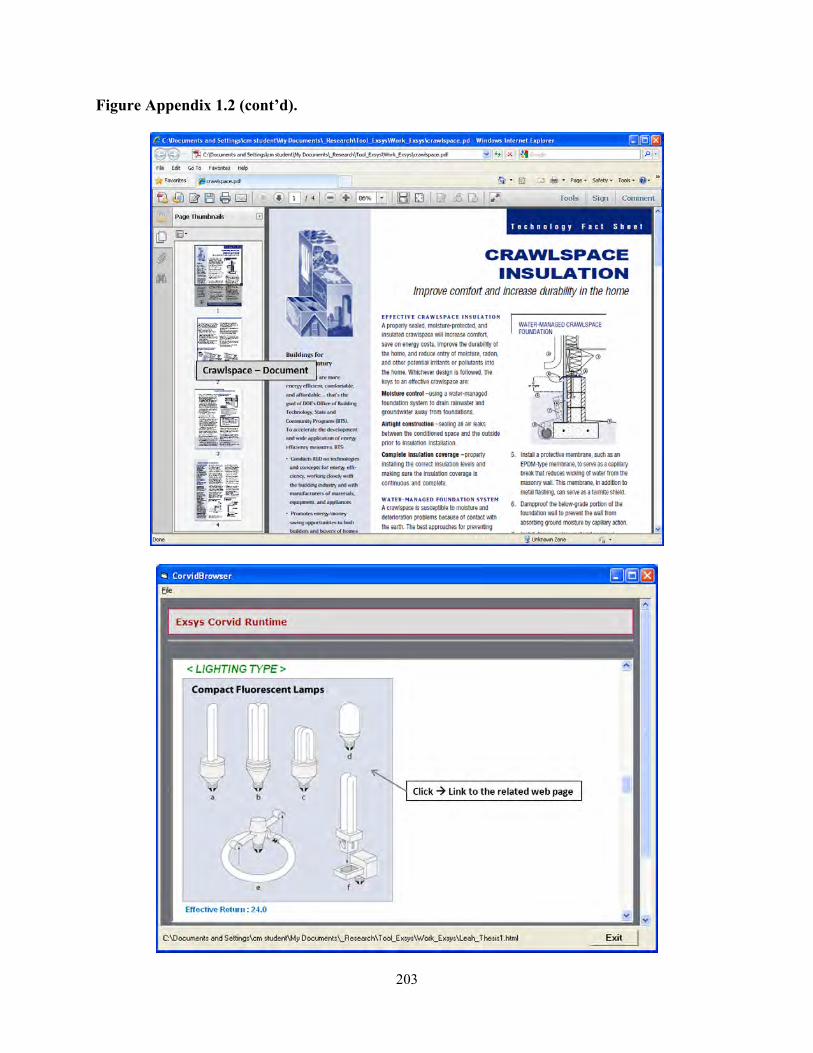
When the user clicks on the image of a dishwasher, as shown in Figure 5.31, the integration
model links to a web page related to the selected retrofit measure, which gives further
information. Additional documents providing expert knowledge are provided by clicking on
“More Information” as shown in Figure 5.31.

160
Figure 5.32: Web Link from the Result Screen
Figure 5.33: Additional Document from the Result Screen

161
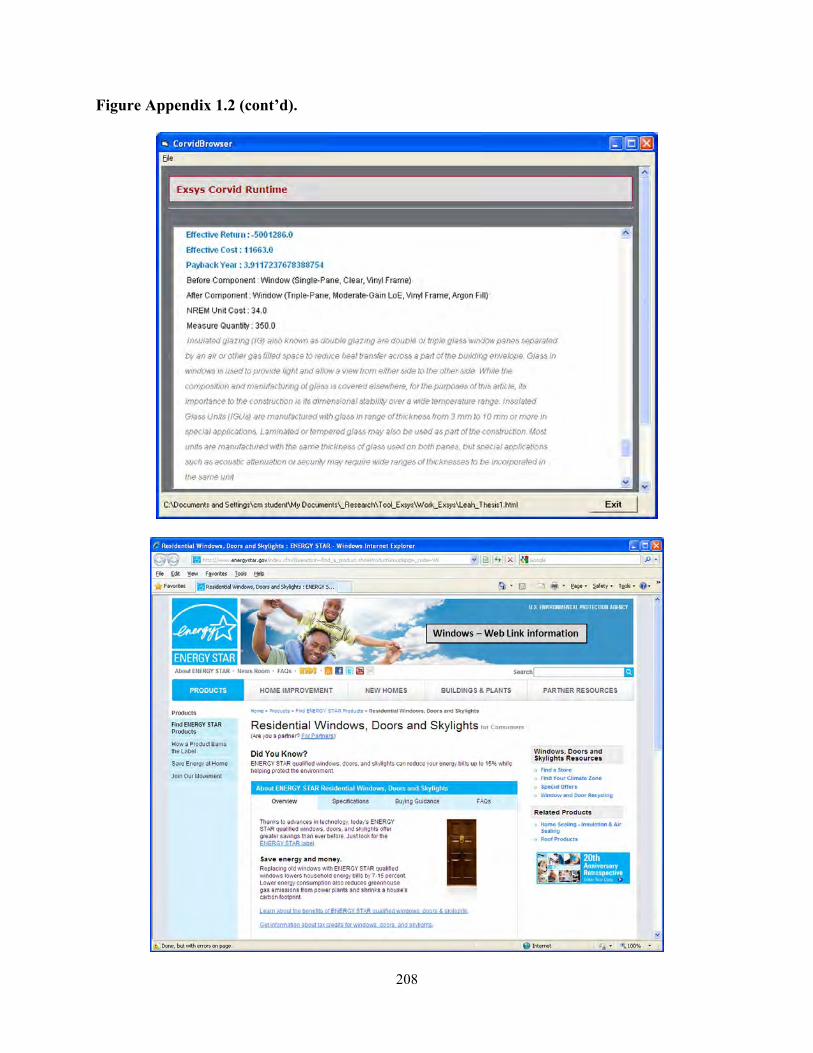
Since the Payback Year value of a windows-type measure, 3.91 years, is larger than the number
of years the user intends to live in the current house, 3 years, 5000000 is subtracted from the
calculated Effective Return value -1286, in order to give less priority to the retrofit measure.
Finally, the Effective Return value of the windows is -5001286, which is the lowest value among
the retrofit measures.
Figure 5.34: Effect of Payback Year Information
5.5.3 Remaining Budget
The prioritized measure list of this working example is as follows:
Initial User Budget: $ 8000
Age of the House: 100 years old

162
Number of Years User Intends to Live in Home: 3 years
1st measure: Dishwasher
- Effective Return: $ 9999999
- Effective Cost: $ 810
- Payback Year: 0.2443
- Remaining Budget: 8000 – 810 = $ 7190
2nd measure: Attic Insulation
- Effective Return: $ 302
- Effective Cost: $ 2680
- Payback Year: 1.0666
- Remaining Budget: 7190 – 2680 = $ 4510
3rd measure: Crawlspace Wall Insulation
- Effective Return: $ 79
- Effective Cost: $ 3077
- Payback Year: 1.0088
- Remaining Budget: 4510 – 3077 = $ 1433
4th measure: Lighting
- Effective Return: $ 24
- Effective Cost: $ 160
- Payback Year: 0.0489
- Remaining Budget: 1433 – 160 = $ 1273

163
5th measure: Furnace
- Effective Return: $ – 339
- Effective Cost: $ 1860
- Payback Year: 0.6134
- Remaining Budget: 1273 – 1860 = $ – 587
6th measure: Windows
- Effective Return: $ – 5001286
- Effective Cost: $ 11663
- Payback Year: 3.9117
- Remaining Budget: – 587 – 1860 = $ – 12250
This order is decided by the Effective Return values. The Remaining Budget is calculated by
subtracting the cumulative Effective Cost values from the initial user budget, following the
descending order of Effective Return values. Figure 5.35 shows the calculated Remaining
Budget. The negative value of the Remaining Budget means the cost of the total measures is in
excess of the user’s initial budget. The user can decide whether to stop applying the retrofit
measures before the remaining budget becomes negative, or to expand the budget to apply the
next measure, depending on the cost.

164
Figure 5.35: Calculated Remaining Budget
5.5.4 Result Values Validation
At the end of the system development, the result values must be validated by comparing the
values in the integration model with the raw database sources. In this example, the result is
validated by checking the result of the XPath query using BaseX software, and by comparing the
NREM XML database source code. For example, the Effective Cost of Attic Insulation is 2680,
which is calculated by multiplying the NREM unit cost and measure quantity, and subtracting
the incentive amount [ 2.1 * 1300 – 50 = 2680 ].
165
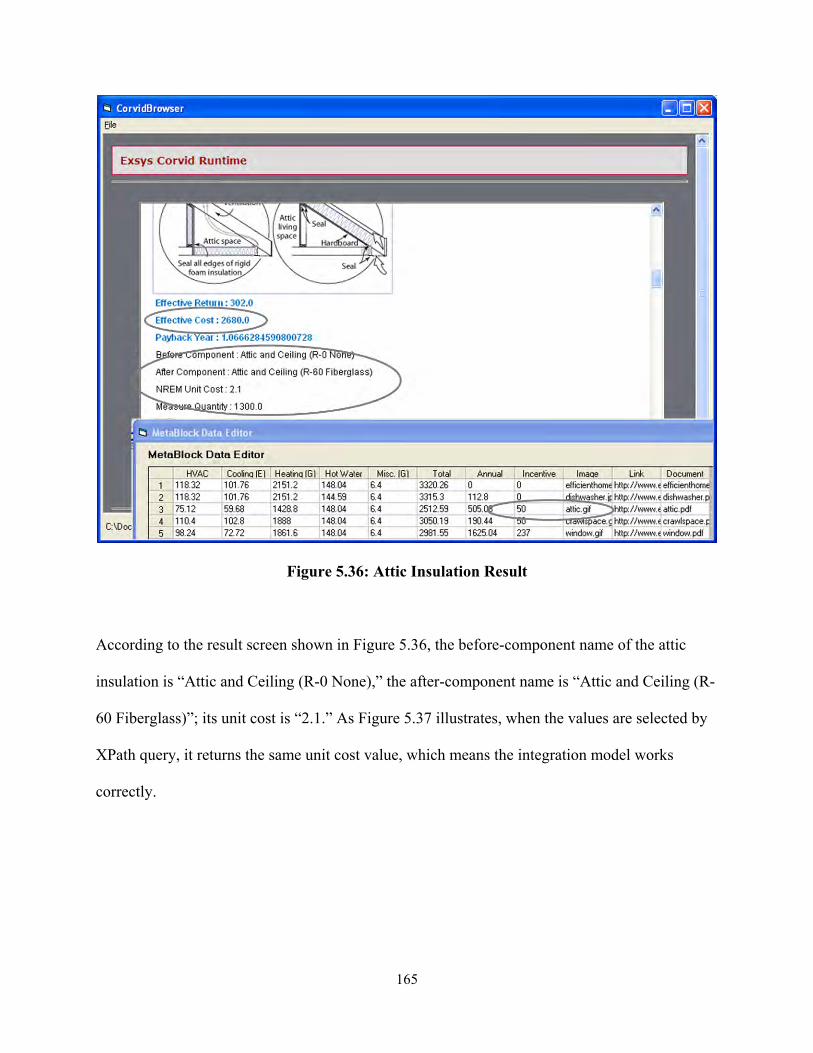
Figure 5.36: Attic Insulation Result
According to the result screen shown in Figure 5.36, the before-component name of the attic
insulation is “Attic and Ceiling (R-0 None),” the after-component name is “Attic and Ceiling (R-
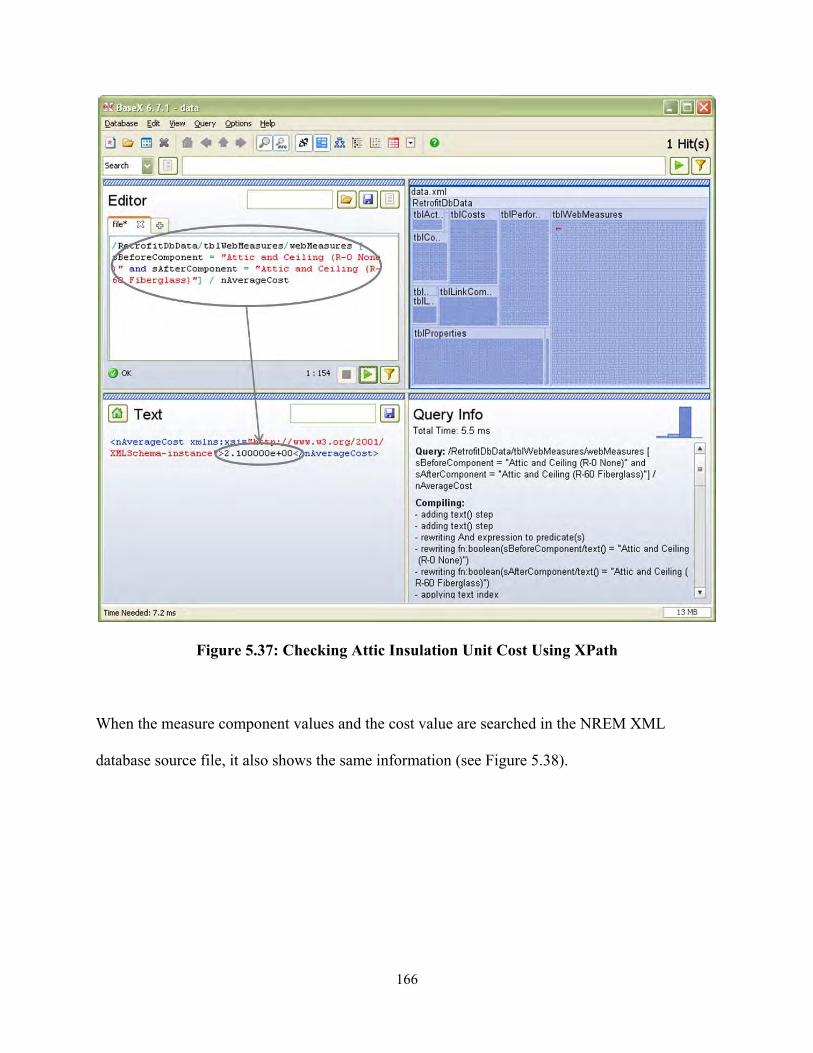
60 Fiberglass)”; its unit cost is “2.1.” As Figure 5.37 illustrates, when the values are selected by
XPath query, it returns the same unit cost value, which means the integration model works
correctly.
166
Figure 5.37: Checking Attic Insulation Unit Cost Using XPath
When the measure component values and the cost value are searched in the NREM XML
database source file, it also shows the same information (see Figure 5.38).

167
Figure 5.38: Checking Attic Insulation Unit Cost in the NREM XML Source File
5.6 ADDITIONAL EXAMPLE
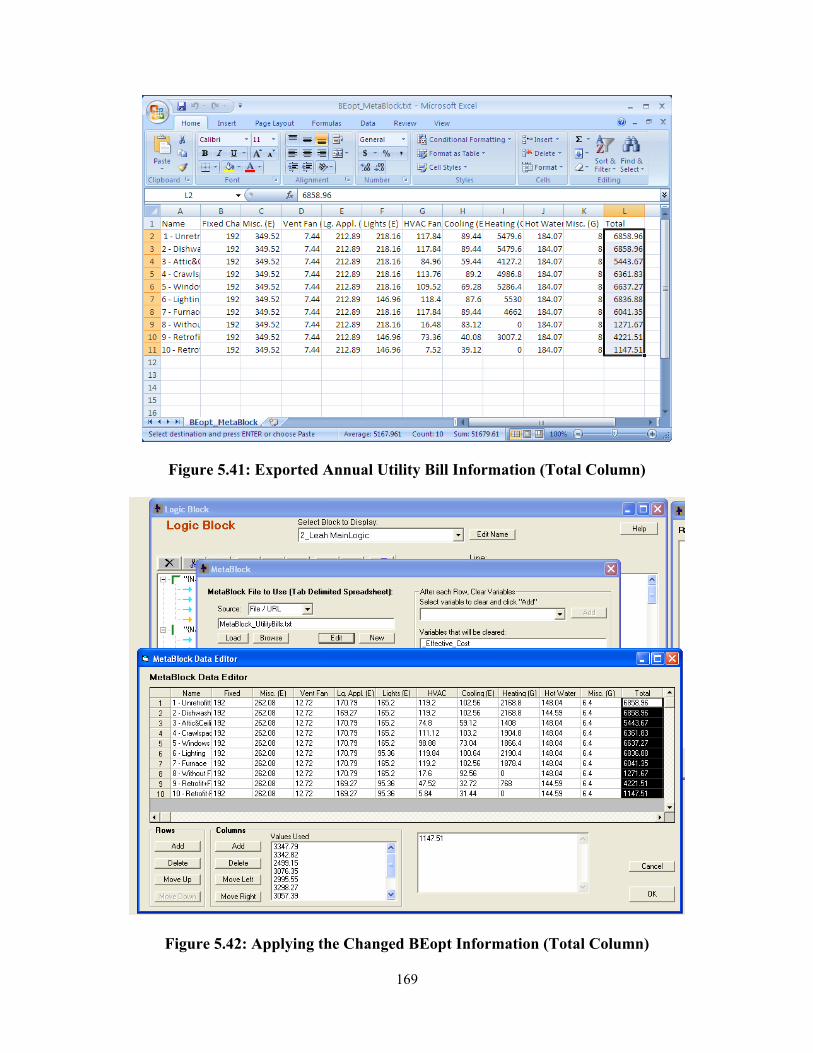
As mentioned at the beginning of this chapter, BEopt information can only be integrated into this
model manually. Therefore, when the user examines different measure options (see Figure 5.39),
a separate BEopt model needs to be run in order to derive the annual utility bill cost, based on the
changed measure options (see Figure 5.40). Since the use of the “total” annual utility bill cost
information is substantial in the integration model, among the other cost columns in BEopt
output, only the cells under the “total” column need to be copied from the BEopt output Excel
file (see Figure 5.41), and pasted into the “total” column in the Meta Block of the integration
model, in order to apply the changed annual cost (see Figure 5.42). This new BEopt annual
utility bill cost is used to calculate the Effective Return, Effective Cost, and Payback Year values
for this example.

168
Figure 5.39: Another Example of User’s Retrofit Measures
Figure 5.40: Annual Utility Bill Graph
169
Figure 5.41: Exported Annual Utility Bill Information (Total Column)
Figure 5.42: Applying the Changed BEopt Information (Total Column)

170
5.7 BEOPT CALLING EXAMPLE (SEPARATE MODEL)
In this research, the integration model is “run as applet” in order to use the NREM database.
Exsys Corvid, however, must be “run as application” in order to call the external program, BEopt.
Even though the BEopt calling process and the NREM database integration process cannot be
combined due to their incompatible running environment settings, another working example for
calling BEopt is being developed separately for future research. This example will be useable in
the upcoming version of BEopt. Figure 5.43 demonstrates the setting of Test Run type.
Figure 5.43: Setting Run as Application
As shown in Figure 5.44, this BEopt calling model uses WRITE, READ commands, which can
be used for the information exchange between Exsys Corvid and BEopt by means of input and
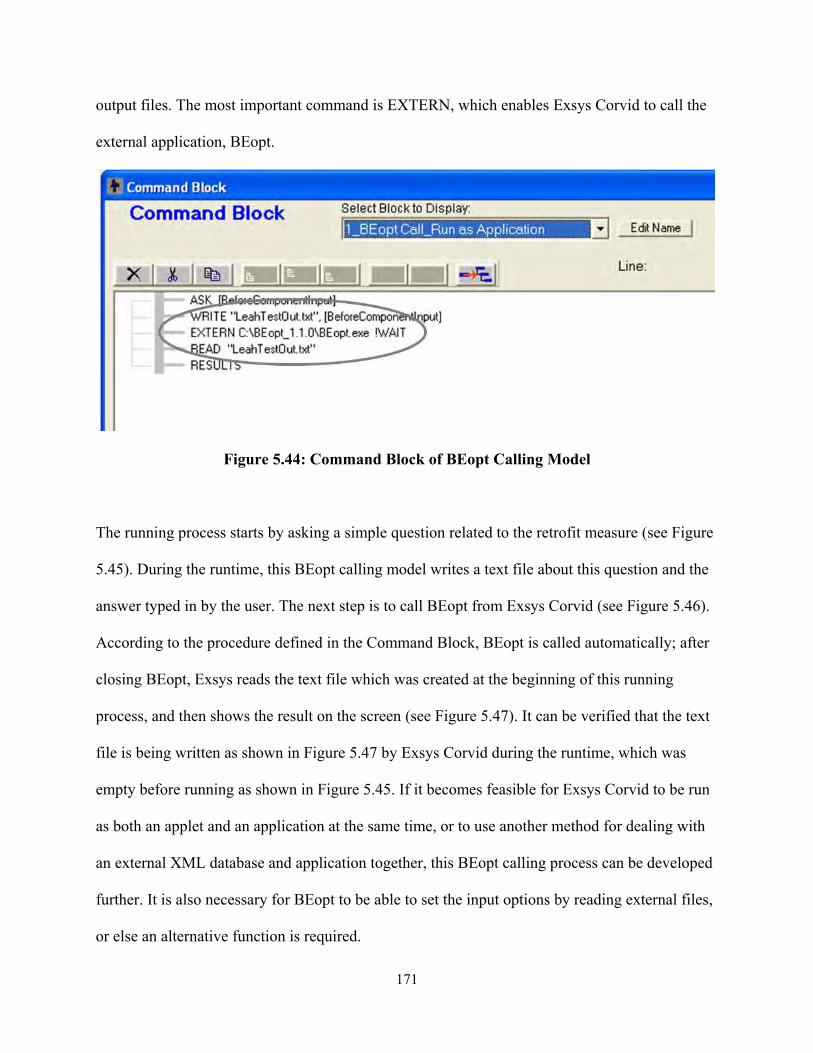
171
output files. The most important command is EXTERN, which enables Exsys Corvid to call the
external application, BEopt.
Figure 5.44: Command Block of BEopt Calling Model
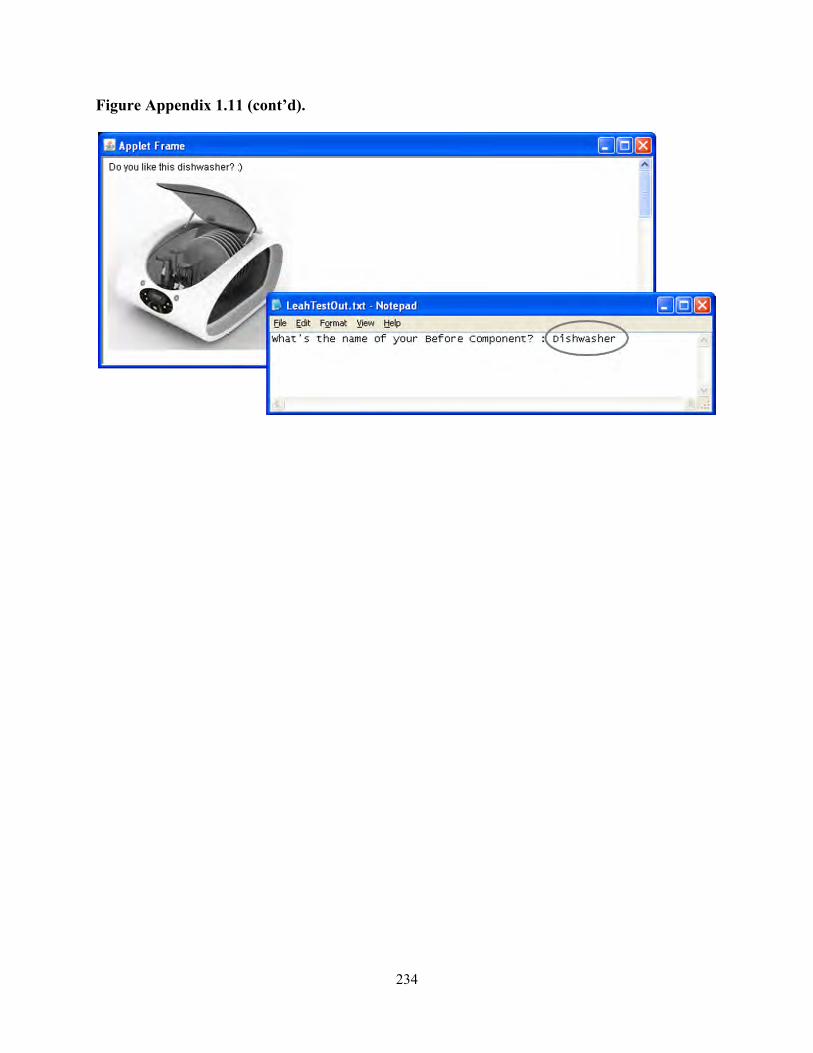
The running process starts by asking a simple question related to the retrofit measure (see Figure
5.45). During the runtime, this BEopt calling model writes a text file about this question and the
answer typed in by the user. The next step is to call BEopt from Exsys Corvid (see Figure 5.46).
According to the procedure defined in the Command Block, BEopt is called automatically; after
closing BEopt, Exsys reads the text file which was created at the beginning of this running
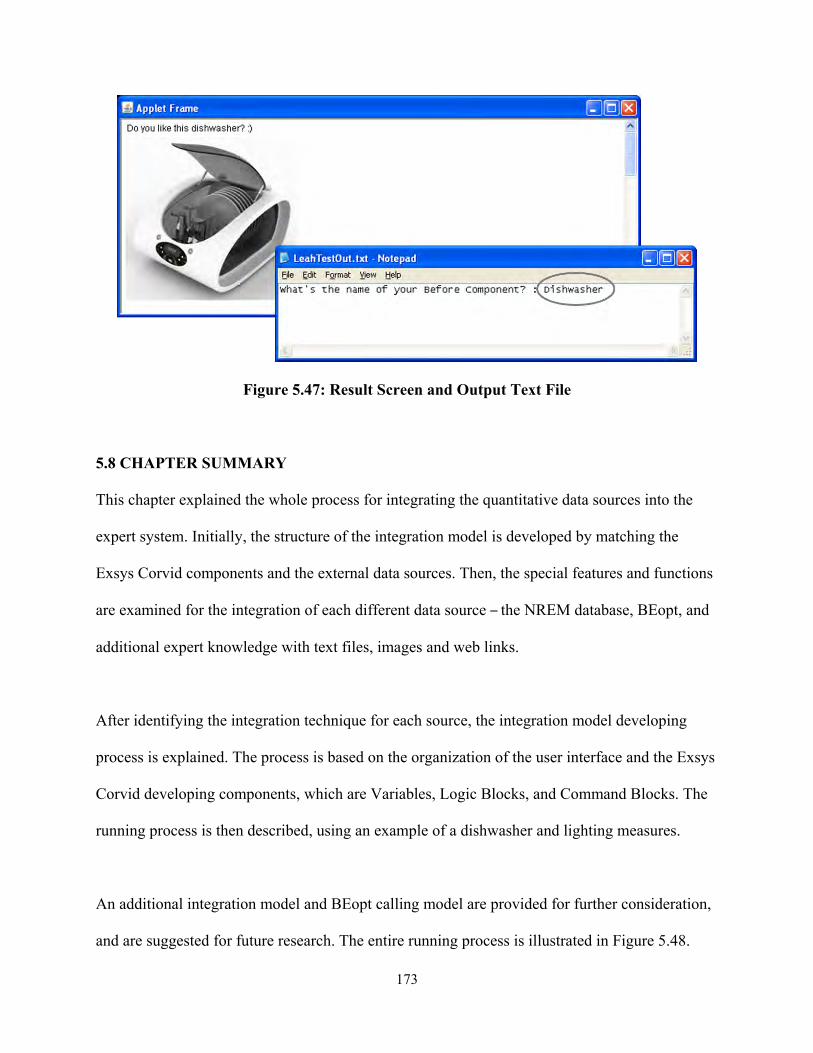
process, and then shows the result on the screen (see Figure 5.47). It can be verified that the text
file is being written as shown in Figure 5.47 by Exsys Corvid during the runtime, which was
empty before running as shown in Figure 5.45. If it becomes feasible for Exsys Corvid to be run
as both an applet and an application at the same time, or to use another method for dealing with
an external XML database and application together, this BEopt calling process can be developed
further. It is also necessary for BEopt to be able to set the input options by reading external files,
or else an alternative function is required.

172
Figure 5.45: Command Block of BEopt Calling Model
Figure 5.46: Opening BEopt Application within Exsys Corvid
173
Figure 5.47: Result Screen and Output Text File
5.8 CHAPTER SUMMARY
This chapter explained the whole process for integrating the quantitative data sources into the
expert system. Initially, the structure of the integration model is developed by matching the
Exsys Corvid components and the external data sources. Then, the special features and functions
are examined for the integration of each different data source – the NREM database, BEopt, and
additional expert knowledge with text files, images and web links.
After identifying the integration technique for each source, the integration model developing
process is explained. The process is based on the organization of the user interface and the Exsys
Corvid developing components, which are Variables, Logic Blocks, and Command Blocks. The
running process is then described, using an example of a dishwasher and lighting measures.
An additional integration model and BEopt calling model are provided for further consideration,
and are suggested for future research. The entire running process is illustrated in Figure 5.48.

174
Figure 5.48: Summary of Running Process

175
CHAPTER 6
SUMMARY AND CONCLUSIONS
6.1 OVERVIEW
This chapter provides a summary of this research and presents areas for future research. First, a
summary of the research will be presented. A review of the objectives and achievements of this
research will follow. Finally, areas for potential future research will be explored.
The main goal of this research was to implement an integrated query-based intelligent decision
support system, in which quantitative external data sources were integrated into the decision
support system. To achieve this goal, the Energy Retrofit Decision Process Framework described
in a preceding study was analyzed, together with an examination of the quantitative data sources
available and required technical skills for implementing the working example. Expert system
shell software, a retrofit measure cost database, and energy simulation software were needed for
developing the DSS; Exsys Corvid, the NREM database and BEopt were utilized for
implementing the integration model working example.
Chapter 1 provided the needs, goals, objectives, methodologies, scope and limitations of this
research. In Chapter 2, the background of energy retrofit decision-making, AI, DSS, ES and
some examples were examined. Chapter 3 reviewed the Energy Retrofit Decision Process
Framework and analyzed its working example to computerize the framework and the process.
Chapter 4 scrutinized the quantitative data sources, the NREM database and BEopt, from an

176
integrational point-of-view. Finally, Chapter 5 illustrated the development procedure for the
integration model working example.
6.2 SUMMARY OF THE OBJECTIVES
The overall goal of this research is to implement an integrated query-based intelligent decision
support system for existing residential homes. It is being developed to help homeowners,
contractors and other stakeholders acquire appropriate information on energy efficient measures
and retrofitting costs. At the beginning of this thesis, research objectives were demonstrated to
support this overall goal, and this section evaluates the work performed to achieve the research
objectives.
OBJECTIVE 1: To understand the energy retrofit decision process framework
The Energy Retrofit Decision Process Framework was the foundation of the integrated query-
based intelligent decision support system developed in this research. Therefore, Chapter 3
analyzed the framework and its working example before developing the integration model. The
decision process of the framework, cost sources and formula for the prioritization of retrofit
measures were thoroughly explained, and were applied to the computerized integration model
working example. The decision process of the framework and the cost formula of its working
example are summarized as follows:
Decision Process of the Framework
1) Identify retrofit measures to be improved.
2) Shortlist and prioritize measures based on user needs and retrofit effectiveness, which
is derived from an energy efficiency simulation and quantitative cost data sources.

177
3) Provide expert advice on installation with the results of the running process, in the
form of images, text files and web links.
Cost Formula for Prioritization
Effective Cost = NREM Cost – Incentive Amount
Effective Return = BEopt Annual Energy Savings – Annual Loan Payment
Remaining Budget = Initial user’s budget
– Effective Cost (of Highest Effective Return)
– Effective Cost (of Next Highest Effective Return)
– Effective Cost (of Next Highest Effective Return)
… (Iterate this process until the user’s budget becomes zero)
The original framework (see Figure 3.1) contained the overall working process, and both
qualitative and quantitative information sources. This framework was simplified for the
computerized integration model to focus on quantitative data, as shown in Figure 3.3. The
original framework was also analyzed based on the Corvid structure shown in Figure 5.4, which
demonstrated that, in substance, the framework was well-structured for the integration model.
OBJECTIVE 2: To understand the background of energy retrofit decision-making and the
use of expert knowledge by means of AI/ES/DSS.
Chapter 2 discussed a literature-based study of the background of energy retrofit decision-
making, and an introduction of AI/ES/DSS. The use of expert knowledge by means of
AI/ES/DSS was reviewed.

178
The literature review began with an explanation of the need for energy savings in existing
buildings and the barriers to residential energy retrofits. There were some retrofit methods
suggested, with a discussion of governmental policies and energy retrofit programs that support
the energy retrofitting.
Subsequently, Artificial Intelligence (AI), Expert Systems (ES), and Decision Support Systems
(DSS) were introduced as tools that utilize expert knowledge. Following the definition of AI, ES
and DSS, the similarities and differences between ES and DSS were explored. The components
of ES and DSS were then demonstrated. The uses of database and simulation software in ES
were also studied to acquire information on integrated expert systems.
In addition, the application of ES and DSS in the construction management field and in energy
retrofits was examined. The uses of ES in construction management, such as estimating,
scheduling, site planning, and so forth, were introduced, and the uses of DSS in energy retrofits
were explored. Then, the components and structures of some existing DSSs and ESs were
demonstrated, as references for the integration model in this research. The National Renewable
Energy Laboratory’s (NREL) methodology for accessing and improving the accuracy of the
energy analysis for residential buildings was also explained.
OBJECTIVE 3: To identify and explain various aspects of quantitative information
Measure cost information, energy simulation software and published expert knowledge were
integrated into the query-based intelligent decision support system, and each quantitative data
source was explored before implementing the integration model in Chapter 4.

179
3a. The first data source for objective 3 is the NREM database, for the acquisition of the
cost-related information on energy retrofits.
The National Residential Efficiency Measures (NREM) database was the main source of cost
information for the integration model. First, the structure and basic objects of the database were
analyzed:
Database Structure: Group > Category > Component Type > Component
Database Objects: Measures, Components, Properties, Actions, Costs, and References.
Data configuration, measure construction, overview of actions and cost sources were then
explained. Since the NREM database was developed using XML, the basic concept of XML,
XSD and XPath were also explored, to assist in the analysis of the various aspects of the NREM
XML database. In addition, software applications used for implementing the integration model
were introduced.
3b. The second data source is BEopt energy simulation software for prioritizing the retrofit
measures initially selected, based on homeowners’ need.
Building Energy Optimization (BEopt) was utilized to simulate the energy efficiency of the
upgraded retrofit measures; it provided the annualized utility cost information. At the beginning
of the BEopt introduction, the concept of Zero Net Energy Homes was explained to convey the
general idea of BEopt. Afterward, the BEopt running process, input option settings, energy
simulation output information, and report creation methods were demonstrated. Since both the
NREM database and BEopt were developed by the National Renewable Energy Laboratory
(NREL), and share the same cost information sources to some degree, the cost information
sources for BEopt were also demonstrated.
180
3c. The third source is published text, figures and pictures, to provide various explanations
and installation advice for the selected measures.
The published reports, mainly produced by governmental programs and Building America
projects, were explored. The report files, images and web links usually provide system users with
expert knowledge and advice on the selected measures. They were illustrated on the result screen
of the integration model.
OBJECTIVE 4: To integrate various aspects of quantitative information with expert
knowledge.
Chapter 5 illustrated the whole process of system integration. First, the structure of the expert
system shell software, Exsys Corvid, was analyzed. The Energy Retrofit Decision Process
Framework was re-organized based on the structural components of Exsys Corvid. Then, each of
the quantitative data sources was analyzed, and combined with the components and information
flow of Exsys Corvid, from an integrational point-of-view.
The next step was to implement the integration model working example. The procedure was
demonstrated with the following sequence:
Organization of questions
Composition of answer lists
Arrangement of output results
Setting variables
Building logic blocks
Building command blocks

181
The running process of the integration model working example was illustrated with two
examples. The working example began with queries about basic information, such as the user’s
budget and immediate needs, and moved on to questions about the selected retrofit measures. On
the result screen, the integration model provided the prioritized measures with their cost
information, expert knowledge, and the remaining budget. Another Corvid working example
related to calling BEopt was introduced for future research.
6.3 CONCLUDING OBSERVATIONS AND LIMITATIONS
In this research, the integration model was implemented by integrating the quantitative data
sources into the decision support system. The components of this integration model were:
Decision support system shell: Exsys Corvid software
Database: NREM database
Energy simulation: BEopt software
Expert knowledge: Text files, images and web links
This integration model suggested the holistic function of a residential energy retrofit system for
existing homes, by providing a prioritized list of retrofit measures with cost information, energy
simulation and expert advice. The users, such as homeowners and energy auditors, can acquire
all of the necessary retrofit information in this unified system without having to explore several
separate systems.
The integration model plays the role of a prototype for the finalized intelligent decision support
system. Although this model handled a limited number of retrofit measures, it implemented all of

182
the necessary functions for the finalized DSS, including integration of the database, energy
simulation and expert knowledge.
Some limitations were recognized while developing the integration model. First, the information
in the cost database and the energy simulation are not fully compatible. At the beginning of this
research, several energy simulation software applications were examined, and BEopt was
selected because the retrofit measure components were relatively similar to the ones in the
NREM database. Although both the NREM database and BEopt were developed by the NREL,
the structures and expressions of the retrofit measures and the measure components are quite
different from each other. It was very challenging to match their different measure components
under one retrofit measure, such as lighting, as explained in Chapter 5. It was suggested that, in
order to be completely integrated, both a fully compatible retrofit measure cost database and
energy simulation software using the same measure components be developed.
Second, the unified standard cost database does not contain enough measure information. The
development of a national standard cost database is in the beginning step, and the sources of the
cost information were fairly limited, and the number of each measure was skewed. In order to
provide more reliable cost data sources, the NREM database should collect more comprehensive
cost information. RS Means data can be a model, although the characteristics of the data are
different. Moreover, the updated NREM database should be applied to the energy simulation
software for the synthetic use of retrofit information.

183
Third, the integration model does not automatically reflect updates to the NREM database. This
integration model is a stand-alone application that is not directly connected to the NREM XML
database on the Web. Thus, when the NREL updates the NREM database, the newer version of
the XML files need to be manually retrieved for the model. To improve this issue, a way to link
the integration model to the up-to-date NREM database should be also considered.
Finally, the existing published information is scattered, making it difficult to select the best
augmenting information. If the existing reports and visualized information were compiled in a
specific database, based on the types of retrofit measures and the components of the NREM
database, then users and researchers would be able to utilize them more easily.
6.4 PLANS FOR FUTURE RESEARCH
This integration model is a prototype of a fully functional intelligent decision support system that
will be developed in the near future. This research was completed in the middle part of a larger
research task, and connects the preceding and subsequent research. The plans for future research
are as follows:
Overcoming the limitations of BEopt: Though the current version of BEopt has a
limitation in reading information from external files and setting them as input options,
similar tasks will be available in the next version upgrade, which BEopt plans to release
in the summer of 2012.
Overcoming the limitations of Exsys Corvid: External XML databases and applications
cannot currently be utilized at the same time. This limitation will be improved when

184
Exsys releases the next version of its Corvid software, and BEopt will be able to be
integrated into the DSS automatically, rather than manually.
Eliciting the actual expert knowledge: Following the application of the results of other
tasks, the system will begin to elicit actual knowledge from experts. This knowledge will
form the knowledge base of the finalized DSS.
Developing the finalized decision support system: A fully functional intelligent DSS
will be developed based on this prototype, the results of other tasks, and the knowledge
base. Both quantitative and qualitative data will be integrated into the finalized DSS. It
will be released on the web, after training, education, and demonstrations of the system
are completed.
6.5 CHAPTER SUMMARY
This chapter summarized the overall process and achievements of this research for implementing
the integration model. The main goal and objectives were reviewed, and their achievements were
summarized. Then, the conclusion and role of the integration model were examined, and the
limitations and suggestions for system integration were demonstrated. Finally, the list of relevant
future research was outlined.

185
APPENDICES 1
Integration Model Working Example Full Process
186
Figure Appendix 1.1: Main Example – Queries
187
Figure Appendix 1.1 (cont’d).

188
Figure Appendix 1.1 (cont’d).

189
Figure Appendix 1.1 (cont’d).
190
Figure Appendix 1.1 (cont’d).
191
Figure Appendix 1.1 (cont’d).
192
Figure Appendix 1.1 (cont’d).

193
Figure Appendix 1.1 (cont’d).
194
Figure Appendix 1.1 (cont’d).

195
Figure Appendix 1.1 (cont’d).

196
Figure Appendix 1.1 (cont’d).
197
Figure Appendix 1.2: Main Example – Results

198
Figure Appendix 1.2 (cont’d).

199
Figure Appendix 1.2 (cont’d).
200
Figure Appendix 1.2 (cont’d).
201
Figure Appendix 1.2 (cont’d).

202
Figure Appendix 1.2 (cont’d).
203
Figure Appendix 1.2 (cont’d).

204
Figure Appendix 1.2 (cont’d).

205
Figure Appendix 1.2 (cont’d).

206
Figure Appendix 1.2 (cont’d).

207
Figure Appendix 1.2 (cont’d).
208
Figure Appendix 1.2 (cont’d).

209
Figure Appendix 1.2 (cont’d).
210
Figure Appendix 1.3: Main Example – Developed Logic (Backward Chaining)

211
Figure Appendix 1.4: Main Example – Developed Logic (Logic Block)

212
Figure Appendix 1.4 (cont’d).

213
Figure Appendix 1.4 (cont’d).

214
Figure Appendix 1.5: Main Example – Developed Logic (Meta Block)

215
Figure Appendix 1.6: Main Example – Command Block

216
Figure Appendix 1.7: Main Example – Variables

217
Figure Appendix 1.7 (cont’d).
218
Figure Appendix 1.7 (cont’d).

219
Figure Appendix 1.7 (cont’d).

220
Figure Appendix 1.8: Main Example – Budget Calculation Related Variables
221
Figure Appendix 1.8 (cont’d).
222
Figure Appendix 1.9: Main Example – BEopt Information

223
Figure Appendix 1.9 (cont’d).

224
Figure Appendix 1.9 (cont’d).
225
Figure Appendix 1.9 (cont’d).
226
Figure Appendix 1.9 (cont’d).

227
Figure Appendix 1.9 (cont’d).
228
Figure Appendix 1.10: Main Example – Creating Meta Block
229
Figure Appendix 1.10 (cont’d).

230
Figure Appendix 1.10 (cont’d).

231
Figure Appendix 1.10 (cont’d).

232
Figure Appendix 1.11: BEopt Calling Example

233
Figure Appendix 1.11 (cont’d).
234
Figure Appendix 1.11 (cont’d).

235
Appendix 1.12: Images, Documents, and Web Link Sources for the Integration Model (Ordered by Images, Documents, and Web Link Sources, Retrieved on 5/23/2012) Dishwasher http://www.energystar.gov/index.cfm?fuseaction=find_a_product.showProductGroup&pg
w_code=COH http://www.nrel.gov/docs/fy10osti/48284.pdf http://www.energystar.gov/index.cfm?fuseaction=dishwash.search_dishwashers
Attic & Ceiling Insulation http://www.energysavers.gov/your_home/insulation_airsealing/index.cfm/mytopic=11420 http://www.ornl.gov/sci/roofs+walls/insulation/fact%20sheets/attic%20floors.pdf http://www.energysavers.gov/your_home/insulation_airsealing/index.cfm/mytopic=11390
Crawlspace Wall Insulation http://www.energysavers.gov/your_home/insulation_airsealing/index.cfm/mytopic=11480 http://www.ornl.gov/sci/roofs+walls/insulation/fact%20sheets/crawlspace%20insulation%2
0technology.pdf http://www.energysavers.gov/your_home/insulation_airsealing/index.cfm/mytopic=11480
Window Type http://www.energysavers.gov/your_home/windows_doors_skylights/index.cfm/mytopic=1
3370 http://www.energysavers.gov/pdfs/guide_to_energy_efficient_windows.pdf http://www.energystar.gov/index.cfm?fuseaction=find_a_product.showProductGroup&pg
w_code=WI
Lighting http://www.energysavers.gov/your_home/lighting_daylighting/index.cfm/mytopic=12050 http://www1.eere.energy.gov/buildings/openhouse/pdfs/lighting_factsheet29.pdf http://www.energysavers.gov/your_home/lighting_daylighting/index.cfm/mytopic=11980
Furnace http://www.epa.gov/iaq/pubs/airduct.html http://www1.eere.energy.gov/manufacturing/tech_deployment/pdfs/35876.pdf http://www.energystar.gov/index.cfm?c=most_efficient.me_furnaces

236
APPENDICES 2
Emails about Technical Limitations and Software

237
Figure Appendix 2.1: Email from BEopt

238
Figure Appendix 2.2: Email from Exsys

239
Figure Appendix 2.3: Email about Software

240
REFERENCES

241
REFERENCES Al-Tabtabai, H., Kartam, N., Flood, I., & Alex, A. P. (1997). Construction project control using
artificial neural networks. Artificial Intelligence for Engineering, Design, Analysis and Manufacturing, 11(1), 45-57. Retrieved June 27, 2012, from http://journals.cambridge.org/action/displayAbstract?fromPage=online&aid=4197240
Altova. (2012). Altova XML, Database, UML, and Web Services Tools. In Altova. Retrieved
April 26, 2012, from http://www.altova.com/products.html Arnott, D. (2004). Decision support systems evolution: Framework, case study and research
agenda. European Journal of Information Systems, 13(4), 247-259. Retrieved November 15, 2011, from http://ezproxy.msu.edu/login?url=http://search.proquest.com/docview/218782031?accountid=12598
Avgelis, A., & Papadopoulos, A. M. (2010). On the evaluation of heating, ventilating and air
conditioning systems. Advances in Building Energy Research (ABER), 4(1), 23-44. Retrieved December 20, 2011, from http://ezproxy.msu.edu/login?url=http://search.proquest.com/docview/613414229?accountid=12598
Baldwin, A.N. & Oteifa S.A. (1993) The development of knowledge-based systems for
contractors' resource-based estimating: A role for protocol analysis. Computing Systems in Engineering, 4(2), 193-200. Retriedved June 27, 2012, from http://www.sciencedirect.com/science/article/pii/095605219390044W
BaseX. (2012). BaseX: The XML Database. In BaseX. Retrieved April 26, 2012, from
http://basex.org/ BEopt: Building Energy Optimization (Version 1.1) [Computer Software]. What is BEopt?.
Golden, CO: National Renewable Energy Laboratory Berry, L. G., Brown, M. A., Kinney, L. F. (1997). Progress Report of the National
Weatherization Assistance Program. Oak Ridge National laboratory, Oak Ridge, TN. Retrived December 20, 2011, from http://weatherization.ornl.gov/pdfs/ORNL_CON-450.pdf
Bidgoli, H. (1993). Integration of technologies: An ultimate decision-making aid. Industrial
Management + Data Systems, 93(1), 10-10. Retrieved December 20, 2011, from http://ezproxy.msu.edu/login?url=http://search.proquest.com/docview/234925306?accountid=12598

242
California Center for Sustainable Energy. (2012). BetterBuildings Neighborhood Program, Retrieved June 27, 2012, from http://energycenter.org/index.php/incentive-programs/energy-upgrade-california/better-buildings
Cooperman, A., Dieckmann, J., & Brodrick, J. (2011a). Home envelope retrofits. ASHRAE
Journal, 53(6), 82-85. Retrieved January 30, 2012 from http://ezproxy.msu.edu/login?url=http://search.proquest.com/docview/888057374?accountid=12598
Cooperman, A., Dieckmann, J., & Brodrick, J. (2011b). Superinsulated homes. ASHRAE
Journal, 53(8), 66-68,70,72. Retrieved December 13 from http://ezproxy.msu.edu/login?url=http://search.proquest.com/docview/888183957?accountid=12598
Database of State Incentives for Renewables and Efficiency. (2011). Michigan Incentives /
Policies for Renewables & Efficiency. In DSIRE. Retrieved May 4, 2012, from http://www.dsireusa.org/incentives/index.cfm?getRE=1?re=undefined&ee=1&spv=0&st=0&srp=1&state=MI
Dawood, N., Marasini, R. (2001). Stockyard layout planning and management for the precast
concrete products industry, Logistics Information Management, 14(5/6), 328-337. Retrieved June 27, 2012, from http://www.emeraldinsight.com.proxy2.cl.msu.edu/journals.htm?articleid=852169&show=abstract
Dernbach, J. C., McKinstry, R. B., & Lowder, D. (2011). Energy efficiency and conservation:
New legal tools and opportunities. Natural Resources & Environment, 25(4), 7-11. Retrieved December 22, 2011 from http://ezproxy.msu.edu/login?url=http://search.proquest.com/docview/875099947?accountid=12598
Doukidis, G.I. (1988). Decision support system concepts in expert systems: An empirical study. Decision Support Systems, 4(3), 345-354. Retrieved December 23, 2011, from http://www.sciencedirect.com.proxy2.cl.msu.edu/science/article/pii/0167923688900218
Dounis, A.I. (2010). Artificial intelligence for energy conservation in buildings. Advances in
Building Energy Research (ABER), 4(1), 267-299. Retrieved December 23, 2011, from http://ezproxy.msu.edu/login?url=http://search.proquest.com/docview/613424722?accountid=12598
Doukas, H., Nychtis, C., Psarras, J. (2009). Assessing energy-saving measures in buildings
through an intelligent decision support model, Building and Environment,44(2), 290-298. Retrieved December 23, 2011, from http://www.sciencedirect.com/science/article/pii/S0360132308000425

243
Duan, Y., & Burrell, P. (1995). A hybrid system for strategic marketing planning. Marketing Intelligence & Planning, 13(11), 5-5. Retrieved December 10, 2011, from http://ezproxy.msu.edu/login?url=http://search.proquest.com/docview/213119045?accountid=12598
Energy Efficiency and Renewable Energy. (2010). 2009 Buildings Energy Data Book.
U.S. Department of Energy. Retrieved December 13, 2011, from http://buildingsdatabook.eere.energy.gov/
Expert System. (2011). In Merriam-Webster Dictionary. Retrieved December 30, 2011, from
http://www.merriam-webster.com/dictionary/expert%20system
Exsys. (2011). Exsys Corvid Manual. In Exsys. Retrieved January 29, 2012, from
http://www.exsys.com/Corvid_v53/CorvidManual.pdf Ford, F.N. (1985). Decision support systems and expert systems: a comparison.
Information & Management, 8(1), 21-26. Retrieved December 15, 2011, from http://www.sciencedirect.com/science/article/pii/0378720685900667
Gardner, G. T., & Stern, P. C. (2008). The short list: The most effective actions U.S. households
can take to curb climate change. Environment, 50(5), 12-24. Retrieved December 12, 2011, from http://ezproxy.msu.edu/login?url=http://search.proquest.com/docview/224026611?accountid=12598
Golove, W. H., & Eto, J. H. (1996). Market Barriers to Energy Efficiency: A Critical
Reappraisal of the Rationale for Public Policies to Promote Energy Efficiency. Energy and Environmental Division, Lawrence Berkeley National laboratory, University of California Berkeley, CA. Retrieved November 27, 2012, from http://eetd.lbl.gov/ea/emp/reports/38059.pdf
Harvey, L. D., & D. (2009). Reducing energy use in the buildings sector: Measures, costs, and
examples. Energy Efficiency, 2(2), 139-163. doi:10.1007/s12053-009-9041-2 Retrieved December 12, 2011, from http://search.proquest.com.proxy2.cl.msu.edu.proxy1.cl.msu.edu/docview/220438808/1340AE73BA3409CD014/3?accountid=12598
Holness, G. (2008). Improving energy efficiency in existing buildings. ASHRAE
Journal, 50(1), 12-14,17-18,20,23-24,26. Retrieved December 12, 2011, from http://ezproxy.msu.edu/login?url=http://search.proquest.com/docview/220458816?accountid=12598
Home Performance Resource Center. (2010). Best Practices for Energy Retrofit Design:
Financing and Incentives Recommendations. Washington, DC. Retrieved May 4, 2012, from http://www.hprcenter.org/sites/default/files/ec_pro/hprcenter/best_practices_financing_and_incentives.pdf

244
International Energy Agency. (2008). Towards a Sustainable Energy Future, International Energy Agency. Retrieved December 12, 2011, from http://www.iea.org/g8/2008/G8_Towards_Sustainable_Future.pdf
Jaffe, A. B., & Stavins, R. N. (1994). The energy paradox and the diffusion of conservation
technology. Resource and Energy Economics, 16(2), 91-91. Retrieved December 12, 2011, from http://ezproxy.msu.edu/login?url=http://search.proquest.com/docview/198467121?accountid=12598
Joint Center For Housing Studies. (2009). The Remodeling Market in Transition, Improving
America‘s Housing. Retrieved December 12, 2011, from Joint Center for Housing Studies of Harvard University website: http://www.jchs.harvard.edu/sites/jchs.harvard.edu/files/r09-1.pdf
Jones, P. H., Taylor, N. W., & Knowles, H. S. (2010). Quantifying household energy
performance using annual community baselines. International Journal of Energy Sector Management, 4(4), 593-613. doi:10.1108/17506221011092797. Retrieved December 22, 2011 from http://search.proquest.com.proxy2.cl.msu.edu.proxy1.cl.msu.edu/docview/814804136/fulltextPDF/1340B07D8E935BD2F3D/46?accountid=12598
Juan, Y., Kim, J., Roper, K., & Castro-Lacouture, D. (2009). GA-based decision support
system for housing condition assessment and refurbishment strategies. Automation in Construction, 18(4), 394-401. Retrieved December 20, 2011, from http://www.sciencedirect.com/science/article/pii/S0926580508001593
Kaklauskas, A., Zavadskas, E.K., Trinkunas, V. (2007). A multiple criteria decision support on-
line system for construction, Engineering Applications of Artificial Intelligence, 20(2), 163-175. Retreived December 23, 2011, from http://www.sciencedirect.com/science/article/pii/S0952197606001175
Kolokotsa, D., Diakaki, C., Grigoroudis, E., Stavrakakis, G., & Kalaitzakis, K. (2009). Decision
support methodologies on the energy efficiency and energy management in buildings. Advances in Building Energy Research (ABER), 3(1), 121-146. Retrieved December 12, 2011, from http://ezproxy.msu.edu/login?url=http://search.proquest.com/docview/214140642?accountid=12598
Liao, S. (2005). Expert system methodologies and applications – a decade review from 1995 to
2004. Expert Systems with Applications, 28(1), 93-103, ISSN 0957-4174. Retrieved December 15, 2011, from http://www.sciencedirect.com/science/article/pii/S0957417404000934

245
Microsoft Corporation. (2012). Access 2010. In Microsoft Office. Retrieved April 26, 2012, from http://office.microsoft.com/en-us/access/what-is-microsoft-access-database-software-and-applications-FX102473444.aspx
National Renewable Energy Laboratory. (2010). National Residential Efficiency
Measures Database Development Document, v2.0.0. Retrieved June 2, 2011, from http://www.nrel.gov/ap/retrofits/pdfs/development_document.pdf
National Renewable Energy Laboratory. (2012). BEopt. In NREL. Retrieved April 30,
2012, from https://beopt.nrel.gov/home Palmer, K., Walls, M., Gordon, H., & Gerarden, T. (2012). Assessing the energy-efficiency
information gap: Results from a survey of home energy auditors. Rochester, Rochester: doi:10.2139/ssrn.1979804. Retrieved May 4, 2012, from http://search.proquest.com.proxy1.cl.msu.edu/docview/919441135/abstract/1374E0873D57D347C1A/5?accountid=12598
Palmquist, R.A. (1996). AI and Expert Systems. Retrieved December 12, 2011,
from Graduate School of Library & Information Science, The University of Texas at Austin website: http://www.ischool.utexas.edu/~palmquis/courses/ai96.htm
Partnership for Advancing Technology in Housing. (2002). Technology Roadmap: Energy
Efficiency in Existing Homes Vol.2: Strategies Defined. Retrieved September 15, 2011, from http://www.huduser.org/Publications/PDF/3836_energyvolume2.pdf
Polly, B., Kruis, N., & Roberts, D. (2011). Assessing and Improving the Accuracy of
Energy Analysis for Residential Buildings (2011). In NREL. Retrieved December 10, 2011, from http://apps1.eere.energy.gov/buildings/publications/pdfs/building_america/energy_analysis_resbldgs.pdf
Power, D.J. (2003) A Brief History of Decision Support Systems. DSSResources. Retrieved
September 15, 2011, from http://DSSResources.COM/history/dsshistory.html Residential Energy Services Network. (2010). Market Barriers to Residential Energy Efficiency.
Retrieved September 7, 2011, from http://www.resnet.us/ratings/HP03 Rolston, D. W. (1989). Principles of Artificial Intelligence and Expert Systems Development.
Santa Barbara, CA: McGraw-Hill. Romero, R. (2011). 10 tips to avoid energy-efficiency scams. Arizona Local News.
Retrieved January 27, 2012, from http://www.azcentral.com/style/hfe/decor/articles/2011/04/04/20110404avoid-energy-efficiency-scams.htm

246
Samuel, S. (2011). Information Framework for Residential Energy Retrofit (Master's Thesis). Construction Management Program, School of Planning, Design and Construction, Michigan State University, East Lansing, MI.
Samuel, S., Duah, D., & Syal, M. (2011). Framework for Decision Support and Expert Advice
System for Residential Energy Retrofit. Unpublished manuscript, Construction Management Program, School of Planning, Design and Construction, Michigan State University, East Lansing, MI.
Schmidt, C. W. (2008). Bringing green homes within reach: Healthier housing for more
people. Environmental Health Perspectives, 116(1), A24-31. Retrieved December 20, 2011, from http://ezproxy.msu.edu/login?url=http://search.proquest.com/docview/222648641?accountid=12598
Sharples, M., Hogg, D., Hutchison, C., Torrance, S., & Young, D. (1994). Computers and
Thought: A Practical Introduction to Artificial Intelligence. Cambridge, MA: A Bradford Book, The MIT Press
Son, D. T. (2005). Optimisation of tower crane usage in planning of precast construction
projects (Master's Thesis). Civil Engineering Department, National University of Singapore, Singapore. Retriedved June 27, 2012, from http://scholarbank.nus.edu/bitstream/handle/10635/17090/SonDT.pdf?sequence=1
Steven Winter Associates, Inc. (2010). Building America Condensing Boiler Meeting
Identifies Best Practices, Gaps. Retrieved December 20, 2011, from http://www.carb-swa.com/articles/in%20the%20news/EDU_Dec2010.pdf
Syal, M. (2012). CMP 817 (Construction Project Management and Information Systems) [Class].
Construction Management Program, School of Planning, Design and Construction, Michigan State University, East Lansing MI.
Torcellini, P., Pless, S., Deru, M., & Crawley, D. (2006). Zero Energy Buildings: A
Critical Look at the Definition. National Renewable Energy Laboratory. Retrieved April 26, 2012, from http://www.nrel.gov/docs/fy06osti/39833.pdf
Turban, E., Aronson, J. E., & Liang, T. (2004). Decision Support Systems and Intelligent Systems
(7th ed.). Upper Saddle River, NJ: Prentice Hall. Turban, E., & Watkins, P. R. (1986). Integrating expert systems and decision support
systems. MIS Quarterly, 10(2), 121-136. Retrieved December 10, 2011, from http://search.proquest.com.proxy1.cl.msu.edu/docview/218113925?accountid=12598
U.S. Department of Energy. (2008). 2005 Residential Energy Consumption Survey (RECS):
Housing Unit Characteristics and Energy Usage Indicators. Washington, DC: Energy Information Administration.

247
U.S. Department of Energy, Office of Energy Efficiency and Renewable Energy, Building Technologies Program, Building America. (2010a). Multi Year Residential Goals: Building America Residential Integration Program. Retrieved November 20, 2011, from http://apps1.eere.energy.gov/buildings/publications/pdfs/building_america/ns/plenary_5_multiyear_goals.pdf
U.S. Department of Energy, Office of Energy Efficiency and Renewable Energy, Building
Technologies Program, Building America. (2010b). Gaps and Barriers Summary: 2010 Residential Buildings Energy Efficiency Meeting. Retrieved November 20, 2011, from http://apps1.eere.energy.gov/buildings/publications/pdfs/building_america/49162.pdf
U.S. Department of Energy, Office of Energy Efficiency and Renewable Energy, Building
Technologies Program, Building America. (2011). Summary of Prioritized Research Opportunities. Retrieved May 2, 2012, from http://apps1.eere.energy.gov/buildings/publications/pdfs/building_america/meeting_summary_50675.pdf
U.S. Department of Housing and Urban Development. (2011). American Housing Survey For
The United States 2009. Retrieved December 20, 2011, from http://www.census.gov/prod/2011pubs/h150-09.pdf
U.S. Environmental Protection Agency (2010). Home Improvement: Improve Your Home's
Energy Efficiency with ENERGY STAR, Retrived December 20, 2011, from http://www.energystar.gov/index.cfm?c=home_improvement.hm_improvement_index
W3C. (1999). XML Path Language (XPath). In W3C. Retrieved April 30, 2012, from
http://www.w3.org/TR/xpath/
W3C. (2011). XML Schema. In W3C. Retrieved April 30, 2012, from http://www.w3.org/XML/Schema
W3C. (2012). Extensible Markup Language (XML). In W3C. Retrieved April 30, 2012, from http://www.w3.org/XML/
Wai, K. S., Abdul Rahman, A. B., Zaiyadi, M. F., & Aziz, A. A. (2005). Expert System
in Real World Applications. generation5. Retrieved December 10, 2011, from http://www.generation5.org/content/2005/Expert_System.asp
Waikar, A., Helms, M. M., Graves, G., & Cappell, S. (1993). A framework for an AI-based
hybrid simulation system. The Industrial Robot, 20(3), 20-20. Retrieved November 15, 2011, from http://ezproxy.msu.edu/login?url=http://search.proquest.com/docview/217015218?accountid=12598

248
Warszawski, A. (1985). Decision models and expert systems in construction management, Building and Environment, 20(4), 201-210. Retrieved May 5, 2012, from http://www.sciencedirect.com/science/article/pii/0360132385900356
Yang, J., Lie, H., & Skitmore, M. R. (1996). Expert Systems in Construction Management: Is the
Hype Over? QUT. Retrieved December 10, 2011, from http://eprints.qut.edu.au/4546/1/4546.pdf
Zavadskas, E., Kaklauskas, A., Vainiunas, P., Dubakiene, R., Gulbinas, A., Krutinis, M., Cyras,
P., & Rimkus, L. (2006). A Building’s Refurbishment Knowledge and Device Based Decision Support System. Computer Sience, 41(1), 287-294. Retrieved December 20, 2011, from http://www.springerlink.com/content/3827868668881158/references/