
Chapter 5. Origin and evolution of the insular shelf of Faial · Origin and evolution of the...
44
Chapter 5. Origin and evolution of the insular shelf of Faial 5.1. Introduction Although the modern continental margin is a product of many millions of years of sediment deposition and erosion and over this time the environments have changed dramatically, many present margin shapes seem to reflect recent and ongoing geological processes. Furthermore, seismic patterns for most margins show that changes to the overall shape of a margin through time tend to be incremental, cumulative, and slow. Therefore, unless the rates of deposition or erosion on the continental slope are extremely high, some portion of the modern morphology must be inherited from the previous underlying form (O'Grady et al., 2000). Consequently, it is expected that the abrasional processes responsible for the development of the insular shelf of Faial have left an imprint on the present- day morphology. That imprint is probably well preserved on the more remarkable morphological features of the shelf, namely the shelf width and the shelf break. The aim of this chapter is to discuss these features and to assess which were the processes that have conditioned the final morphology of the shelf. One of the processes addressed is the shelf widening rates and for that reason the sources of sand and gravel are once again discussed based on the new rates presented. Finally, an evolutionary model of the shelf is proposed with basis on the previous discussions. 5.2. Shelf width As already stated in Chapters 1 and 4, Menard (1983) put forward the idea that the shelves of volcanic islands evolved by competition between constructional and erosional processes. The effects of sea-level variation, tectonic subsidence 181
Transcript of Chapter 5. Origin and evolution of the insular shelf of Faial · Origin and evolution of the...

Chapter 5. Origin and evolution of the insular shelf of Faial
5.1. Introduction
Although the modern continental margin is a product of many millions of
years of sediment deposition and erosion and over this time the environments
have changed dramatically, many present margin shapes seem to reflect recent
and ongoing geological processes. Furthermore, seismic patterns for most
margins show that changes to the overall shape of a margin through time tend to
be incremental, cumulative, and slow. Therefore, unless the rates of deposition or
erosion on the continental slope are extremely high, some portion of the modern
morphology must be inherited from the previous underlying form (O'Grady et al.,
2000). Consequently, it is expected that the abrasional processes responsible for
the development of the insular shelf of Faial have left an imprint on the present-
day morphology. That imprint is probably well preserved on the more remarkable
morphological features of the shelf, namely the shelf width and the shelf break.
The aim of this chapter is to discuss these features and to assess which
were the processes that have conditioned the final morphology of the shelf. One of
the processes addressed is the shelf widening rates and for that reason the
sources of sand and gravel are once again discussed based on the new rates
presented. Finally, an evolutionary model of the shelf is proposed with basis on the
previous discussions.
5.2. Shelf width
As already stated in Chapters 1 and 4, Menard (1983) put forward the idea
that the shelves of volcanic islands evolved by competition between constructional
and erosional processes. The effects of sea-level variation, tectonic subsidence
181
The insular shelf of Faial: Morphological and sedimentary evolution
or uplift and isostasy of the island will of course complicate the simplicity of this
model. When the volcanic activity becomes less frequent, the island cools and
subsides. Meanwhile, erosion starts and subsidence can be opposed by isostatitc
compensation due to unloading of the eroded material. On the other hand,
renewed volcanism can promote subsidence due to increase of crustal loading. At
the same time, eustatic changes in sea level can cause relative emergence or
submergence in a range of few hundred meters.
Despite the complexity of the subject, Menard (1983) compiled data from
several volcanic islands and compared the age of the coastal sectors against the
respective shelf width. Taking into account the numerous uncertainties that this
type of analysis may be affected by, he found a linear erosion rate of 0.6 mm/year
for the Canary Islands, 1.1 mm/year for the reefless Hawaiian Islands and 1.7
mm/year for Marquesas Islands. More recently, Dickson (2004) studying the
development of talus slopes around the Lord Howe Island referred to a 10 km wide
platform which has been volcanically inactive for the last 6 Ma. Applying Menard’s
simple calculations (1983), Lord Howe Island shelf has been eroding with a rate of
1.7 mm/year.
These figures suggest that many island shelves around the globe have
erosion rates between 0.6 and 1.7 mm/year, simply by comparing their shelf width
against the age of the adjacent coastal terrains. This is assuming that the present-
day shelf break is somehow inherited from the previous underlying form, created
after the main volcanic activity has stopped, thus giving rise to the initial
development of an erosional shelf. The existence of this concordant coastal retreat
rates for oceanic islands so diverse, poses the following question: Should one
expect similar values for the Azorean Islands? Or the similarity between these
figures is just a mere coincidence?
There is however some difficulty in developing an accurate uncertainty
analysis for the calculation of the erosion rates. The difficulty remains in knowing
the precise time that the erosional shelves have begun to develop. To overcome
this difficulty four main assumptions have been taken into account:
1. The older ages of the diverse coastal sectors referred in the bibliography
182

Chapter 5. Origin and evolution of the insular shelf of Faial
correspond to the time when the main volcanism has ceased and the shelves
have begun to form.
2. The K-Ar datings are accurate enough to make this analysis. That might not be
true as discussed in the section of Chapter 2.1.2.
3. The present-day shelf break is inherited from the previous underlying form
created in the initial development of the erosional shelf (i.e. no major
modification has occurred).
4. There has not been any volcanic episode strong enough to reset the abrasion
platforms after their creation.
5.2.1. Relationship between shelf width and shelf age
In chapter 2, a review of the emerged geology of the Faial Island showed
that the present day island is composed by four different geomorphological regions
that correspond to different stages of volcanism. Following Menard’s view (1983)
that older islands would have wider shelves, the width of the shelf was measured
and compared with the age of the adjacent coastline in the four geomorphological
regions. It is assumed that a shelf sector that is adjacent to a determined
geomorphological region has the same age of the oldest rock dating found in the
region. The shelf edge mapping was presented in Chapter 3 (see red line in Figure
141) and the values presented in Figure 141 and Table 7 are the minimum and
maximum distances of the shelf edge to the coastline for each sector. As already
mentioned in Chapter 3 the shelf edge was not entirely mapped in some sectors,
therefore for these unmapped sectors the shelf width might even be higher. In
some of the unmapped areas of the shelf, the shelf edge was well represented by
the slope changes in the slope map derived from the hydrographic chart of the
Instituto Hidrográfico (see Figure 40 in Chapter 2 and green line in Figure 141)
and those shelf widths were also taken into account in Table 7.
The older emerged terrain is the Pedro Miguel Graben region which has
on its base the remnants of the older Ribeirinha shield volcano which begun its
subaerial formation around 800 Ka (Madeira and Brum da Silveira, 2003).
Assuming an age of 800 Ka and a width between 2000 to 3000 m for the abrasion
platform, an erosion rate of 2.5 to 3.8 mm/year is obtained. The sector E lies on
183
The insular shelf of Faial: Morphological and sedimentary evolution
the Channel Faial-Pico and for that reason this kind of analysis cannot be made
since there is no shelf break of erosional origin in the Channel.
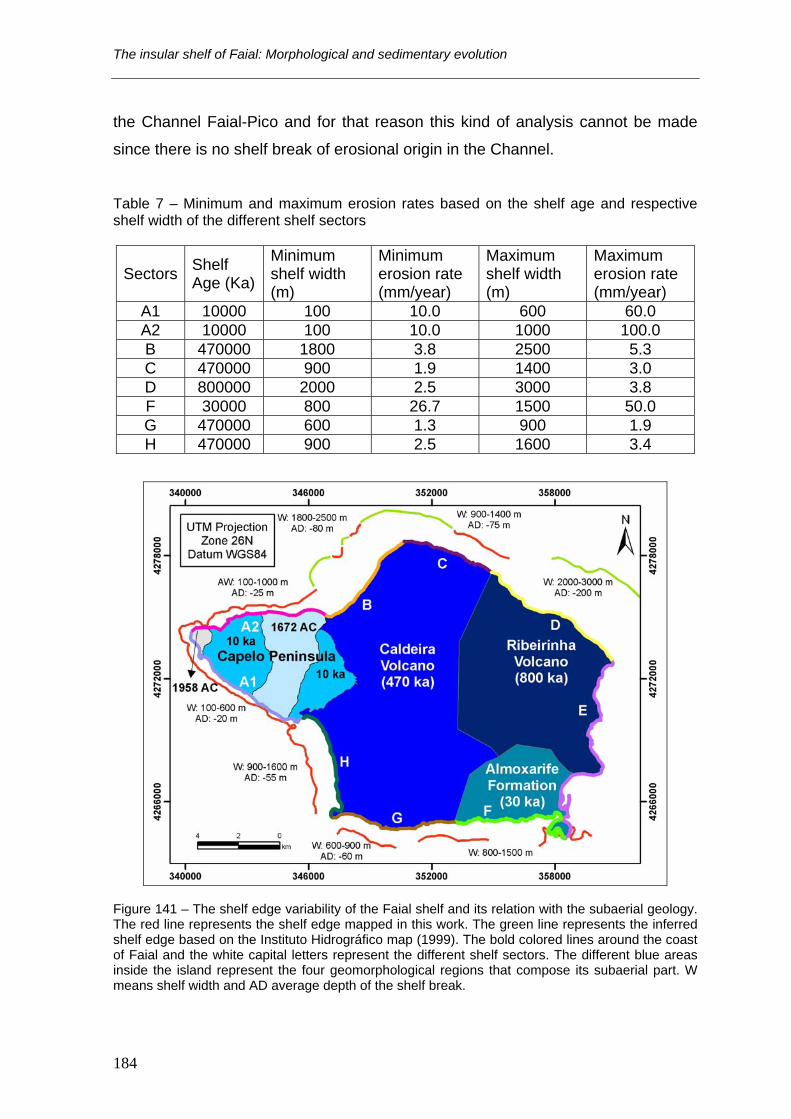
Table 7 – Minimum and maximum erosion rates based on the shelf age and respective shelf width of the different shelf sectors
Sectors Shelf Age (Ka)
Minimum shelf width (m)
Minimum erosion rate (mm/year)
Maximum shelf width (m)
Maximum erosion rate (mm/year)
A1 10000 100 10.0 600 60.0 A2 10000 100 10.0 1000 100.0 B 470000 1800 3.8 2500 5.3 C 470000 900 1.9 1400 3.0 D 800000 2000 2.5 3000 3.8 F 30000 800 26.7 1500 50.0 G 470000 600 1.3 900 1.9 H 470000 900 2.5 1600 3.4
Figure 141 – The shelf edge variability of the Faial shelf and its relation with the subaerial geology. The red line represents the shelf edge mapped in this work. The green line represents the inferred shelf edge based on the Instituto Hidrográfico map (1999). The bold colored lines around the coast of Faial and the white capital letters represent the different shelf sectors. The different blue areas inside the island represent the four geomorphological regions that compose its subaerial part. W means shelf width and AD average depth of the shelf break.
184

Chapter 5. Origin and evolution of the insular shelf of Faial
The second older emerged terrain, the Caldeira Volcano is at least 470 Ka
and has a shelf width of 1800 to 2500 m at the sector B, a shelf width of 900 to
1400 m at the sector C, a shelf width of 600 to 900 m in the sector G and a shelf
width of 1200 to 1600 m at sector H. Assuming an age of 470 Ka and the shelf
widths of the abrasion platforms for the respective sectors, an erosion rate of 3.8
to 5.3 mm/year is found for sector B, 1.9 to 3.0 mm/year for sector C, 1.3 to 1.9
mm/year for sector G and 2.5 to 3.4 mm/year for sector H.
The third older emerged terrain is the Horta-Flamengos-Feteira region
with an age of 30±20 Ka. Assuming an age of 30 Ka and a width of the abrasion
platform between 800 to 1500 m, an erosion rate of 26.7 to 50 mm/year can be
found.
The younger emerged terrain is the Capelo Peninsula whose age is less
than 10 Ka and has several historic eruptions. The shelf width ranges from 100 to
600 m for sector A1 and from 100 to 1000 m for sector A2. Assuming an age of 10
Ka and the shelf widths of the abrasion platform for the respective sectors, an
erosion rate of 10 to 60 mm/year is obtained for sector A1 and 10 to 100 mm/year
for sector A2.
Although Menard’s observations that older volcanic terrains tend to have
wider shelves is generally confirmed for the Faial shelf (Figure 142), all the shelf
sectors show exceptions to this rule. For example, Horta-Flamengos-Feteira
region has a wider shelf than the shelf sector G, although it is younger. The same
happens for almost all the shelf sectors, there are shelf sectors whose maximum
width is bigger than the minimum width of older sectors (see Table 7). There also
some shelf sectors that show erosion rates much higher (10 to 100 mm/year for
the shelf sectors A1 and A2 and 26.7 to 50 mm/year for the shelf sector F) than
those calculated from Menard (1983). Another singularity that was found was the
remarkable difference in the shelf widths for sectors of the same age (e.g. the
differences found between sectors B, C, G and H - see Table 7). If one considers
that the sectors that share the same age have had synchronous volcanism, the
differences found on the shelf width have to be explained by other processes that
have played a more significant role on the widening of these platforms. Finally, the
average rate of shelf widening of the volcanic islands (0.6 - 1.7 mm/year) compiled
185

The insular shelf of Faial: Morphological and sedimentary evolution
by Menard (1983) is smaller than the one measured in the older shelf sectors (B,
C, D, G and H) of the Faial Island (1.9 - 5.3 mm/year). The reasons for these
differences may be explained by the youth of the Faial Island (just 800 Ka old)
when compared with the islands that Menard used in his study (most had more
than 1 Ma, up to 16 Ma). According to Menard (1986), as the shelf increases in
age (and consequently in width), the rate of the shelf widening decreases with time
because the wave attenuation is higher and consequently less energy reaches the
coastline.
Figure 142 – Relation between shelf width and age of the shelf sectors in the Faial Island. Each different symbol represents the minimum and maximum width of the shelf sectors that share the same age.
The shelf widening erosion rates are the result of three distinct processes
acting on the coastal cliffs: they include marine erosion, cliff sub-aerial erosion and
river erosion, which may of course have varied for the different sectors. There are
however two important factors that Menard (1983) showed to account for
considerable differences in the shelf width. The windward sides of the islands
normally show higher erosion rates, due to increased surf and subaerial erosion.
The windward side is also more prone to rainfall, and hence increasing river
erosion. The higher intensity of subaerial erosion produces deeper valleys on the
186
Chapter 5. Origin and evolution of the insular shelf of Faial
windward side and waves can erode headlands between valleys to cut a broad
shelf much faster than they would in the continuous high cliffs of the lee side
(Menard, 1983). Sunamura (1977) has also shown a positive relationship between
wave-induced cliff erosion and the erosive force of the waves.
5.2.2. Relationship between shelf width and shelf energy
In chapter 2, a review of the wave conditions in the Azores central
archipelago has shown the direction and height of the predominant waves and the
Directional Annual Wave Frequency (DAWF) and the Directional Annual Maximum
Wave Height (DAMWH) were calculated (see Figure 53 and Tables 4 and 5 in
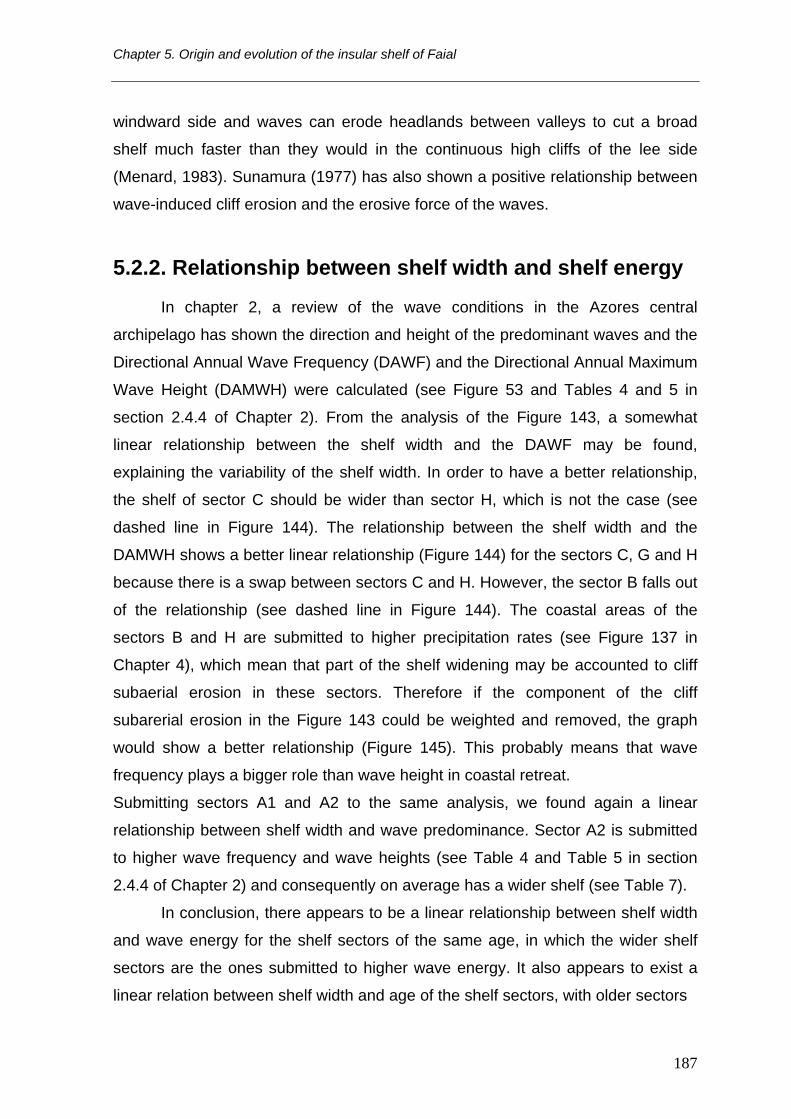
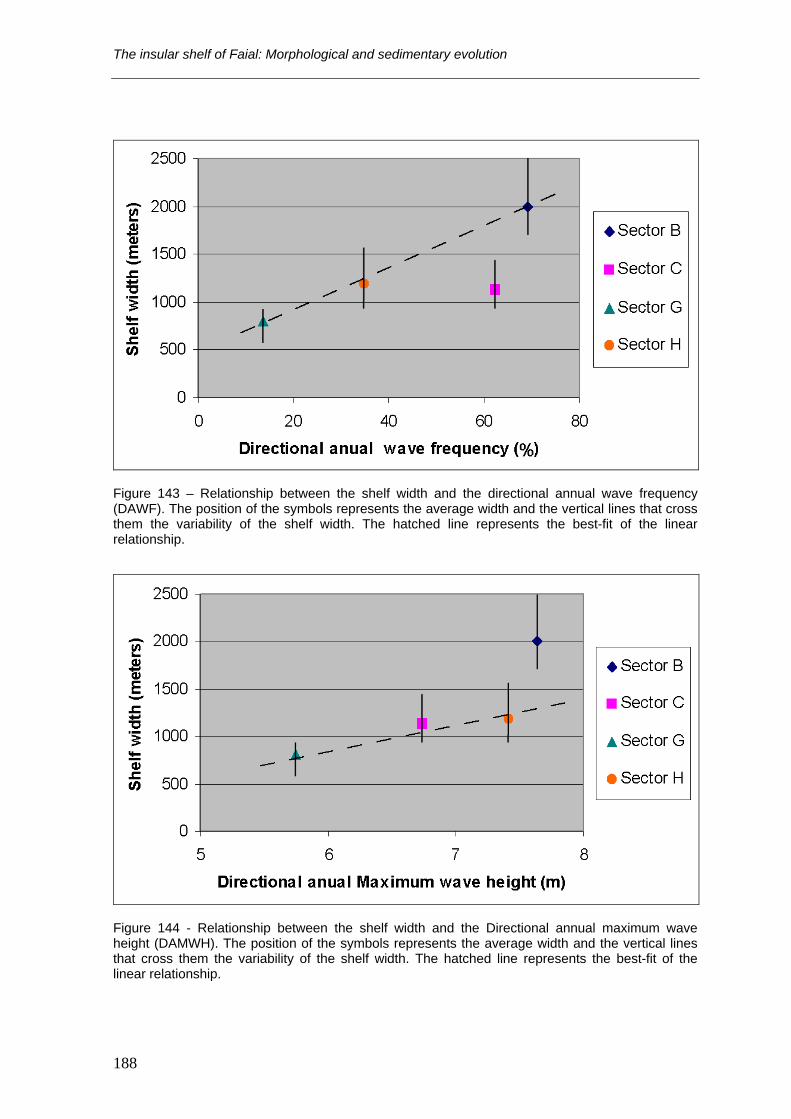
section 2.4.4 of Chapter 2). From the analysis of the Figure 143, a somewhat
linear relationship between the shelf width and the DAWF may be found,
explaining the variability of the shelf width. In order to have a better relationship,
the shelf of sector C should be wider than sector H, which is not the case (see
dashed line in Figure 144). The relationship between the shelf width and the
DAMWH shows a better linear relationship (Figure 144) for the sectors C, G and H
because there is a swap between sectors C and H. However, the sector B falls out
of the relationship (see dashed line in Figure 144). The coastal areas of the
sectors B and H are submitted to higher precipitation rates (see Figure 137 in
Chapter 4), which mean that part of the shelf widening may be accounted to cliff
subaerial erosion in these sectors. Therefore if the component of the cliff
subarerial erosion in the Figure 143 could be weighted and removed, the graph
would show a better relationship (Figure 145). This probably means that wave
frequency plays a bigger role than wave height in coastal retreat.
Submitting sectors A1 and A2 to the same analysis, we found again a linear
relationship between shelf width and wave predominance. Sector A2 is submitted
to higher wave frequency and wave heights (see Table 4 and Table 5 in section
2.4.4 of Chapter 2) and consequently on average has a wider shelf (see Table 7).
In conclusion, there appears to be a linear relationship between shelf width
and wave energy for the shelf sectors of the same age, in which the wider shelf
sectors are the ones submitted to higher wave energy. It also appears to exist a
linear relation between shelf width and age of the shelf sectors, with older sectors
187
The insular shelf of Faial: Morphological and sedimentary evolution
Figure 143 – Relationship between the shelf width and the directional annual wave frequency (DAWF). The position of the symbols represents the average width and the vertical lines that cross them the variability of the shelf width. The hatched line represents the best-fit of the linear relationship.
Figure 144 - Relationship between the shelf width and the Directional annual maximum wave height (DAMWH). The position of the symbols represents the average width and the vertical lines that cross them the variability of the shelf width. The hatched line represents the best-fit of the linear relationship.
188
Chapter 5. Origin and evolution of the insular shelf of Faial
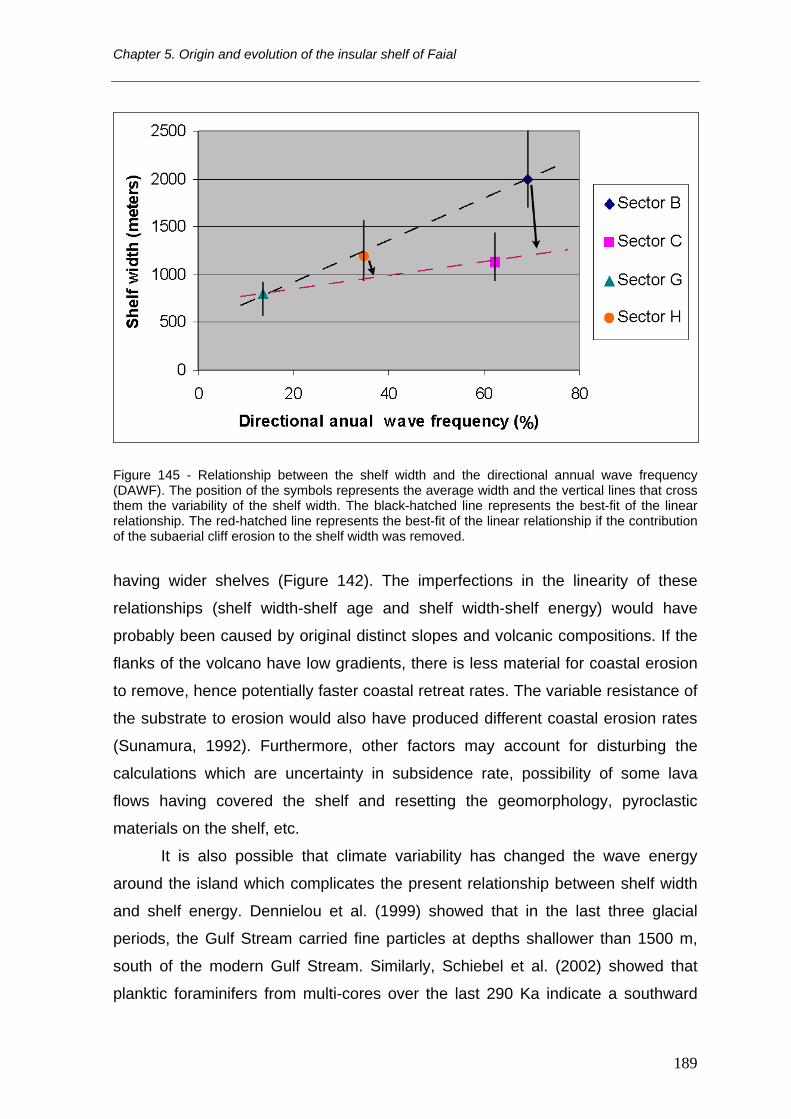
Figure 145 - Relationship between the shelf width and the directional annual wave frequency (DAWF). The position of the symbols represents the average width and the vertical lines that cross them the variability of the shelf width. The black-hatched line represents the best-fit of the linear relationship. The red-hatched line represents the best-fit of the linear relationship if the contribution of the subaerial cliff erosion to the shelf width was removed.
having wider shelves (Figure 142). The imperfections in the linearity of these
relationships (shelf width-shelf age and shelf width-shelf energy) would have
probably been caused by original distinct slopes and volcanic compositions. If the
flanks of the volcano have low gradients, there is less material for coastal erosion
to remove, hence potentially faster coastal retreat rates. The variable resistance of
the substrate to erosion would also have produced different coastal erosion rates
(Sunamura, 1992). Furthermore, other factors may account for disturbing the
calculations which are uncertainty in subsidence rate, possibility of some lava
flows having covered the shelf and resetting the geomorphology, pyroclastic
materials on the shelf, etc.
It is also possible that climate variability has changed the wave energy
around the island which complicates the present relationship between shelf width
and shelf energy. Dennielou et al. (1999) showed that in the last three glacial
periods, the Gulf Stream carried fine particles at depths shallower than 1500 m,
south of the modern Gulf Stream. Similarly, Schiebel et al. (2002) showed that
planktic foraminifers from multi-cores over the last 290 Ka indicate a southward
189

The insular shelf of Faial: Morphological and sedimentary evolution
shift of the Azores Front during glacial times, the presence of transitional water
masses south of the Azores islands and a southward shift and a weakening of the
Azores Current. According to Crowley (1981), the variations in the ocean
circulation around the Azores during the seven glacial advances of the last
150,000 years can be explained in terms of increased Gulf Stream/North Atlantic
Current velocities advecting warmer waters into the study area. The increased
velocities may have been due to a combination of increased wind stress,
increased baroclinicity of surface waters, and steepening of the thermocline due to
increased cooling of water (18°C) south of the Gulf Stream. All these authors
report changes of the ocean circulation in the Azores related to the glacial events.
It is possible that the variations in the wind pattern may have changed the resulting
wave energy that reaches the coastline and are therefore also responsible for the
less good linear relationship between the shelf width and shelf energy.
5.2.3. Extreme shelf widening erosion rates
As mentioned before, there are three sectors (sectors A1, A2 and F) that
have very high shelf widening erosion rates (10 to 100 mm/year) when compared
with those estimated (0.6 and 1.7 mm/year) by Menard (1983).
The shelf sector F (Figure 141) is wider than some of the older sectors of
the shelf (shelf sectors C and G) and shows higher erosion rates (Table 7). The
Almoxarife Formation (see Figure 43 and text in Chapter 2) comprises Hawaiian/
Strombolian volcanism and most of it appears in the Horta-Flamengos-Feteira
region (Figure 141), probably covering part of the southeastern slope of Caldeira
volcano (470 Ka old) and the southern remainings of Ribeirinha volcano (800 Ka
old). Therefore, it is possible that when this volcanism has started 30 Ka ago, a
considerable abrasion platform was already cut on the volcanic buildings of
Caldeira and Riberinha Volcano with the coastline of that time landwards of the
present-day one. This volcanism could have started on land, on top of one or both
the older volcanic buildings and prograded seaward building what is now the
Horta-Flamengos-Feteira region, resetting part of the older abrasion shelves of
Caldeira and Ribeirinha volcano (see Figures 164 and 165).
The offshore part of Capelo Peninsula (sectors A1 and A2) shows a great
190
Chapter 5. Origin and evolution of the insular shelf of Faial
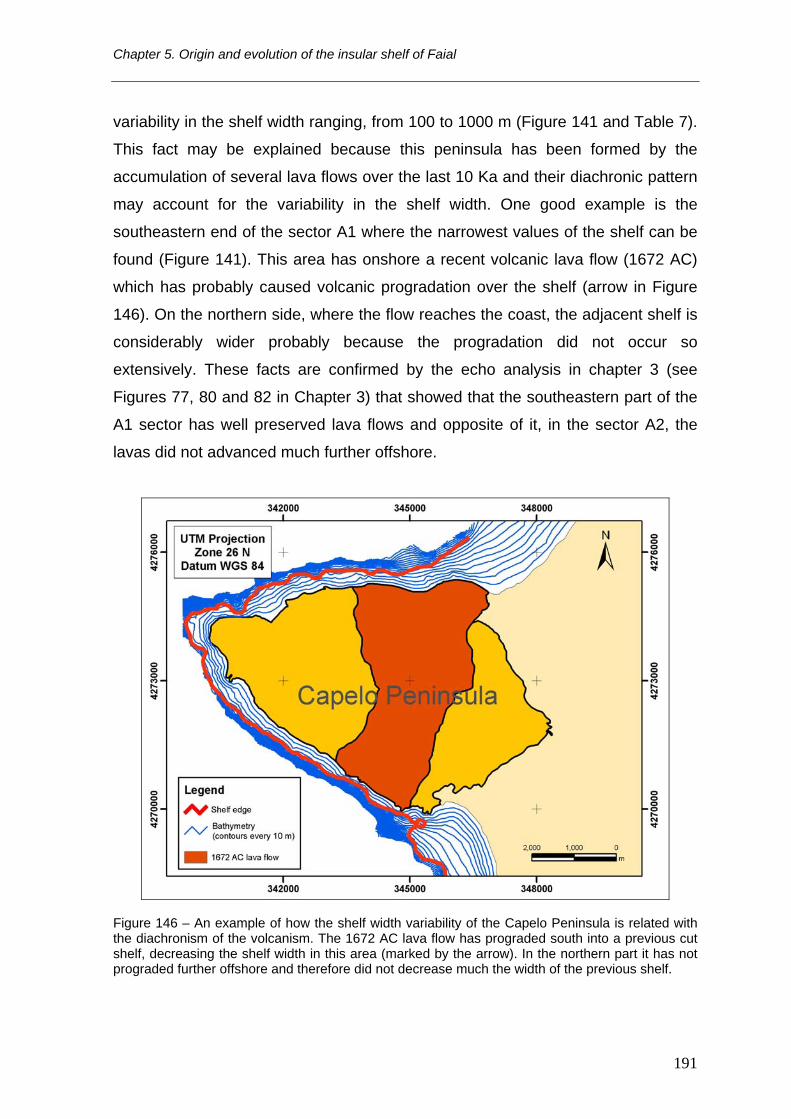
variability in the shelf width ranging, from 100 to 1000 m (Figure 141 and Table 7).
This fact may be explained because this peninsula has been formed by the
accumulation of several lava flows over the last 10 Ka and their diachronic pattern
may account for the variability in the shelf width. One good example is the
southeastern end of the sector A1 where the narrowest values of the shelf can be
found (Figure 141). This area has onshore a recent volcanic lava flow (1672 AC)
which has probably caused volcanic progradation over the shelf (arrow in Figure
146). On the northern side, where the flow reaches the coast, the adjacent shelf is
considerably wider probably because the progradation did not occur so
extensively. These facts are confirmed by the echo analysis in chapter 3 (see
Figures 77, 80 and 82 in Chapter 3) that showed that the southeastern part of the
A1 sector has well preserved lava flows and opposite of it, in the sector A2, the
lavas did not advanced much further offshore.
Figure 146 – An example of how the shelf width variability of the Capelo Peninsula is related with the diachronism of the volcanism. The 1672 AC lava flow has prograded south into a previous cut shelf, decreasing the shelf width in this area (marked by the arrow). In the northern part it has not prograded further offshore and therefore did not decrease much the width of the previous shelf.
191

The insular shelf of Faial: Morphological and sedimentary evolution
Despite the fact that the shelf growth offshore the Capelo Peninsula
(sectors A1 and A2) has been diachronic, it nevertheless shows very high erosion
rates (10 to 100 mm/year) and there is not a simple explanation like the one found
for the sector F. The other older sectors show erosion rates much smaller
(between 1.3 and 5.3 mm/year, see Figure 141 and Table 7). There should be an
explanation for the discrepancies in the erosion rates of the sectors A1 and A2
relative to the other older sectors (B, C, D, G and H). The easiest explanation is to
assume that the volcanic complexes in the sectors B, C, D, G and H did not form
in a single event (geologically speaking) and repeated volcanism has reset for
several times the abrasion platforms. Another explanation is to assume that the
abrasional shelves formed in the sectors B, C, D, G and H are not the result of the
cumulative erosion during the entire sea-level cycle, but that erosion only occurs
during highstand conditions. Therefore the high erosion rates of the sectors A1
and A2 represent highstand conditions because when the shelf started to form 10
Ka ago the sea-level was rising and at 7.5 Ka ago it was already at 10 m below the
present sea-level. It is possible to presume that after a first complete cycle of sea-
level oscillation (drop and rise) the shelf widening rates of the sectors A1 and A2
would become progressively smaller, because during most of the time of the cycle,
the erosion promoted by the sea does not reach the present cliffs. The first
hypothesis is impossible to assess because there is not detailed geological
knowledge of the subaerial evolution of the Faial Island. The second hypothesis is
easier to check and one way to untangle this is to compare these high erosion
rates with the ones found presently at the sea cliffs.
To test the second hypothesis one must turn to Borges work (1997, 2003).
He used aerial photographs to calculate erosion rates over a time period of 44
years for several coastal segments in S. Miguel Island (Azores). There, he found a
great variety of figures, with average erosion rates of 0.21 m/year and realized that
the differences found had to do with the natural variability of the cliffs studied and
in some cases with the wave climate. Another conclusion from Borges’s work
(1997, 2003) was that when analyzing different time spans he would get different
erosion rates. The S. Miguel erosion rates are in fact very high, but are difficult to
relate to the erosion rates of the sectors A1 and A2 because there is not a detailed
192
Chapter 5. Origin and evolution of the insular shelf of Faial
description of the areas under study. Luckily, Borges (2003) describes in detail two
cases, the cliff of Rocha Quebrada and the cliff of Rocha dos Campos. These
descriptions are useful to compare with Faial’s coastal sectors, since they are two
end-members representative of volcanic cliffs. The cliff of Rocha Quebrada is 20
m height and represents a cliff less prone to erosion since it is constituted manly
by basaltic lava flows and has an average erosion rate of 60 mm/year. On the
other extreme is the cliff of Rocha dos Campos, which is 50 to 70 m height, more
prone to erosion once it is manly constituted by pumice pyroclasts and has an
average erosion rate of 140 mm/year. These figures are more similar with those
measured in the sectors A1 and A2, especially the ones from Rocha Quebrada,
which cliff composition does not differ much from the Capelo cliffs. The heights of
Capelo cliffs are however extremely variable, between 10 and 120 m. Although the
differences in the shelf width of the Capelo Peninsula can be attributed to the
diachronic volcanism, some of the variability in the erosion rates may also be
explained by the cliff heights, with the higher cliffs being less prone to erosion.
In order to test this second hypothesis the composite sea-level curve
described in the section of 2.2.5 of Chapter 2 is used to recalculate the erosion
rates for all the sectors, assuming that the widening of the shelf is only occurring
when the sea-level is around the present level. Figures 147 and 148 try to explain
in a schematic way, why most of the widening of the shelf occurs during highstand
conditions (sea level around the present level). First, let us consider a stepping
sea-level curve like the one of Figure 147, with sea-level starting at -140 m and an
initial slope profile of the island (Figure 148). As the sea-level rises (orange part of
the curve in Figure 147) it starts eroding areas of the initial profile (orange triangles
in Figure 148). When it reaches the 10 m, it starts a descending cycle (blue part of
the curve in Figure 147) and continues eroding (blue areas in Figure 148) the
previous shelf formed during the sea level rise. From the Figure 148, it is obvious
that after one rise and drop of sea-level, the erosion at the present sea-level (0 m)
is three times bigger than the erosion made at shallower depths and for that
contributes the three stillstands at the present-level (0 m when it rises, at 10 m and
again at 0 m when it drops) compared with only one at each shallower depth. The
implication of this phenomenon is that after several cycles of sea-level oscillations
193

The insular shelf of Faial: Morphological and sedimentary evolution
what it really counts for the widening of the shelf are the highstand conditions
(Figure 148). In this work, it will be considered highstand conditions when the sea-
level is between -10 and 10 m relative to the present sea-level.
Figure 147 – Hypothetic sea-level rise and drop with vertical steps of 20 meters. The orange part of the curve corresponds to a sea-level rise and the blue part to a sea-level drop.
Figure 148 – Schematic model of the development of an abrasional shelf, using the curve of Figure 147. Each color corresponds to a cycle of sea-level rise or sea level drop (e.g the orange color represents the erosion made by a sea level rise from -140 to 10 m and the light blue the erosion made by a sea level drop from 10 to -140m and so on).
194
Chapter 5. Origin and evolution of the insular shelf of Faial
5.3. Sea-level curves and estimation of net erosion rates
Menard (1983) was not the first to propose that some continental shelves
were wave-cut features. Before him, Shepard (1973) had already made that
suggestion and following this assumption others authors (Sunamura, 1978;
Trenhaile, 2001) have modeled the formation of erosional continental shelves by
mechanical wave erosion during the sea-level glacially induced fluctuations.
Storms et al., (2002) have showed the importance of substrate slope in coastal
evolution through sea-level oscillations. According to these authors, barrier coasts
develop only on gentle slopes, whereas steeper slopes give rise to a closed
coastline or even cliff formation. Numerical modeling by Trenhaile (2001)
suggested that shelves cut into rock should be significantly narrower and more
steeply sloping than depositional shelves, which is also the case of Faial Island
when compared with the continental margins (O'Grady et al., 2000).
Trenhaile’s modelling (2001) assumed that the enlargement of the
abrasional shelf was continuous during an oscillating sea-level. However, as has
been discussed in section 5.2.3, there are evidences that probably the
enlargement of the shelf is only occurring when the sea is at the present high level
(± 10m). Therefore, the main question is: Is it or not plausible that over the 470 Ka
of the Caldeira Volcano and the 800 Ka of the Ribeirinha Volcano the coastline
has only been retreating during highstand conditions? Table 8 shows the amount
of time that the sea has been at different depths from the present to 470 Ka.
These calculations result from using the generalized sea-level curve for the last
130 Ka based on a U/Th coral datings (Thompson and Goldstein, 2006) and the
curve from Bintanja et al (2005), from 130 Ka to 470 Ka. The same procedure (the
curve of Bintanja et al., 2005) was used to generate Table 9 to calculate the
amount of time that sea level has been at different depths from 470 to 800 Ka.
The estimation of the percentage of time that the sea-level has been at
different levels makes possible the calculation of the net cliff erosions integrated
over the time. This calculation will be done for the different coastal sectors of the
Faial Island and the selected depths (10 to -10 meters) were chosen assuming
that when the sea level is below these depths no erosion is occurring on the
195
The insular shelf of Faial: Morphological and sedimentary evolution
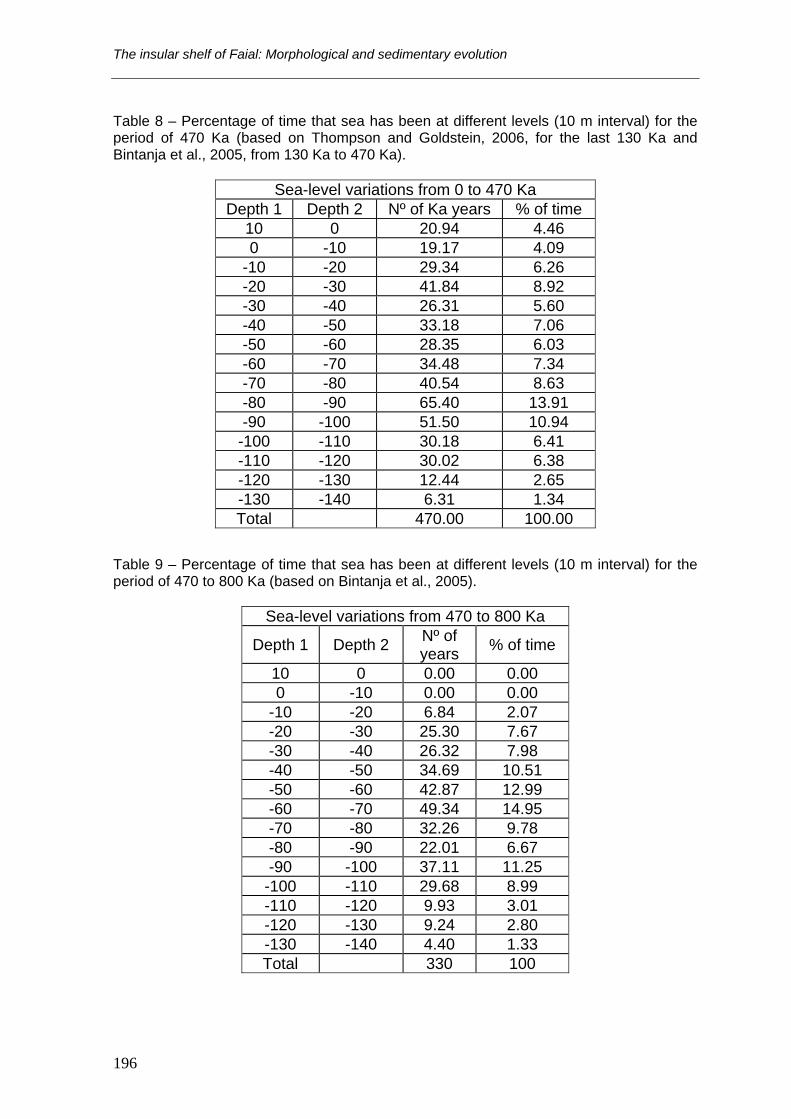
Table 8 – Percentage of time that sea has been at different levels (10 m interval) for the period of 470 Ka (based on Thompson and Goldstein, 2006, for the last 130 Ka and Bintanja et al., 2005, from 130 Ka to 470 Ka).
Sea-level variations from 0 to 470 Ka Depth 1 Depth 2 Nº of Ka years % of time
10 0 20.94 4.46 0 -10 19.17 4.09
-10 -20 29.34 6.26 -20 -30 41.84 8.92 -30 -40 26.31 5.60 -40 -50 33.18 7.06 -50 -60 28.35 6.03 -60 -70 34.48 7.34 -70 -80 40.54 8.63 -80 -90 65.40 13.91 -90 -100 51.50 10.94
-100 -110 30.18 6.41 -110 -120 30.02 6.38 -120 -130 12.44 2.65 -130 -140 6.31 1.34 Total 470.00 100.00
Table 9 – Percentage of time that sea has been at different levels (10 m interval) for the period of 470 to 800 Ka (based on Bintanja et al., 2005).
Sea-level variations from 470 to 800 Ka
Depth 1 Depth 2 Nº of years % of time
10 0 0.00 0.00 0 -10 0.00 0.00
-10 -20 6.84 2.07 -20 -30 25.30 7.67 -30 -40 26.32 7.98 -40 -50 34.69 10.51 -50 -60 42.87 12.99 -60 -70 49.34 14.95 -70 -80 32.26 9.78 -80 -90 22.01 6.67 -90 -100 37.11 11.25
-100 -110 29.68 8.99 -110 -120 9.93 3.01 -120 -130 9.24 2.80 -130 -140 4.40 1.33 Total 330 100
196

Chapter 5. Origin and evolution of the insular shelf of Faial
coastline because the waves cannot reach the cliffs. From Figure 34, the sea level
has remained between -15 m and -28 m water depth from 470 to 800 Ka.
Consequently, it will be considered highstand conditions for the retreat of the
paleo-coastline of the Ribeirinha Volcano when the sea-level was between -10 and
-30 m relative to the present sea-level.
Table 10 shows the estimation of the width of the abrasion platform for the
different coastal segments of the Faial Island. The calculus of the shelf width (CSW
- Equation 12) was made assuming an erosion rate of 60 mm/year, using the
percentage of time that the sea-level remained at a certain level (between 10 and
-10 m water depth for the Caldeira and Ribeirinha Volcano during the last 470 Ka,
and between -10 and -30 m water depth for the Ribeirinha Volcano for the period
Table 10 – Calculated Shelf Width (CSW) using the erosion rate from Borges (1997, 2003) and the Corrected Erosion Rate (CER) based on the CSW (see text for details)
Coastal Sectors
SA (years)
APSW (m)
PT between 10 and -10m
PT between-10 and -30m
ER (mm/year)
CSW (m)
Difference between CSW and
APSW
CER (mm/year)
A1 10000 400 100 60 600 100 40 A2 10000 500 100 60 600 100 50 B 470000 2100 8.55 60 2411 311 52 C 470000 1100 8.55 60 2411 1311 27 D 800000 2500 8.55 9.74 60 4340 1840 35 F 30000 1100 100 60 1800 700 37 G 470000 800 8.55 60 2411 1611 20 H 470000 1300 8.55 60 2411 1111 32
( )Calculated shelf width1000 100ER SA PTCSW ×
= × (12)
ER - Erosion rate of basaltic lava flow cliffs (60 mm/year) from Borges (1997,
2003).
SA – Age of the abrasional shelf (years).
PT – Percentage of time that sea-level has been at -10 to +10 m (0-470 Ka), -30 to
-10 m (470-800 Ka) or 100% (30 Ka to recent).
197

The insular shelf of Faial: Morphological and sedimentary evolution
( )Corrected erosion rate APSW ERCERCSW
×= (13)
APSW – Average present-day shelf width (m).
470-800 Ka). For the sectors A1, A2 and F, which are very recent (see age in
Table 10), the sea-level is always rising and during all that time since their
formation the surf erosion is widening their incipient shelves and for that reason
the percentage of time used is 100%.
The CSW (Equation 12) using the erosion rate (60 mm/year) taken from
Borges (1997, 2003) shows that using this value over the period of time that
corresponds to a certain sea-level where the retreat of the coastline is occurring (-
10 to 10 m for the period 0 to 470 Ka, -10 to -30 m for 470 to 800 Ka and 100% for
30 Ka to recent), gives an approximate value of the present-day shelf width. It
proves to be a good estimation for the sectors A1, A2 and B, but not so good for
the other sectors. The differences found may be explained by diverse erosion
rates caused by the distinct factors mentioned before, which may include different
original slopes and different composition of the volcanic buildings, different wave
energy attack and different height of the cliffs being retreated. In fact, if we
calculate the Corrected Erosion Rate (CER - Equation 13), values between 20 and
52 mm/year may be found, which are very similar to those reported by Borges
(1997, 2003). The Equation 12 for sector F gives 1800 m and this value might be
compatible with the present shelf width, considering a lower erosion rate (37
mm/year). However, in the section 4.2.3 it was considered the hypothesis that a
considerable abrasion platform was already cut on the volcanic buildings of
Caldeira and Riberinha Volcano (Figure 163) when the Almoxarife Formation
prograded into the sea. Considering the higher maturity of the shelf in sector F
(few well preserved lava flows, a large area with coarse clastic deposits and a high
thickness of sediments – see Figures 76 and 77 in Chapter 3) when compared
with sectors A1 and A2, this hypothesis remains valid.
Therefore, this type analysis appears to suggest that the erosion rates
measured by Borges (1997, 2003) are compatible with the long-term erosion rates
found by Menard (1983) and also with those measured in the older sectors of the
198

Chapter 5. Origin and evolution of the insular shelf of Faial
Faial Island, i.e. assuming that the shelf enlargement is only occurring when the
sea is near its present high level. In addition, if high erosion rates as those
suggested by Borges (1997, 2003), for instance 60 mm/year, were eroding the
shelf during the entire cycle of sea-level oscillation, the Faial Island (14 to 21 km
wide) would have been completely wiped out within 200 to 300 Ka. Only a very
high effusion rate could explain the permanence of the Faial Island above sea-
level.
Nevertheless, it is important to be cautious when analyzing these results.
Several processes that contribute to cliff erosion were not included in the
simulation and their effects cannot be evaluated. These include isostatic
compensations, initial topography and composition of the volcanic buildings,
accumulation and movement of loose sediments on the shelf and shelf break
retreat. All these simplifications aim to reduce the complexity of the model and
facilitate the analysis of the basic processes in the simulation. The author realizes
the considerable uncertainty of this estimation, but thinks that is nonetheless better
than having no estimate at all.
5.4. Depth of the shelf break
Dietz and Menard (1951) discussed the existence of the shelf break and
proposed an abrasional origin due to surf erosion, formed during lowstands when
the sea-level was 10 m or less above the break. According to them, this depth is
related not to the wave-base limit but to the vigorous abrasion reflected by wave-
breaking, which, in the most extreme cases, can break at these water depths.
Pickrill (1983) analyzed the morphology of several nearshore profiles from
lakes and semi-enclosed bodies of water. His aim was to draw similarities between
the small-scale terraces found in almost all profiles and the continental shelf. He
found in almost all profiles a shallow nearshore platform whose depth increased
slowly seaward, marked at the outer edge by a change to a steep gradient on the
offshore slope. He also showed that the width of the shelf increases logarithmically
with effective fetch. This study supports the evidences discussed in section 5.2.2
concerning the relationship between shelf width and wave effectiveness (whether
199
The insular shelf of Faial: Morphological and sedimentary evolution
it is related to wave frequency or wave height).
Pickrill’s terrace model represents the morphology produced during just one
period of relative stable sea level, whilst the topography of the insular shelf has
evolved in response to processes operating over thousands of years, including
several transgressions and regressions. Assuming that the island shelf is a wave-
cut platform, the depth of the shelf break is a result of isostasy as well as the
combined effect of erosion (and deposition) over the period of all the sea level
changes since the main volcanic activity has stopped. Moreover, the shelf break is
considered as the seaward limit of continental or insular margins where subaerial
processes (waves, wind, rivers, ice) have left a considerable imprint at low sea-
level stands along with marine depositional events and mass-wasting processes
during high sea-level stands (Southard and Stanley, 1976; Vanney and Stanley,
1983).
Trenhaile (2001) used a mathematical model to investigate the effect of
glacially induced fluctuations in sea level on the evolution of wave-cut shore
platforms and erosional continental shelves during the Quaternary. He showed
that the breaks in slope are produced by the accumulated action of waves over
many similar glacial stages and have a high preservation potential. Therefore, the
shelf edge is considerable old and is not the product of a single low sea level in
the late Quaternary, which means that probably the position of the present-day
shelf edge of the Faial Island has not changed much since the shelf begun to form.
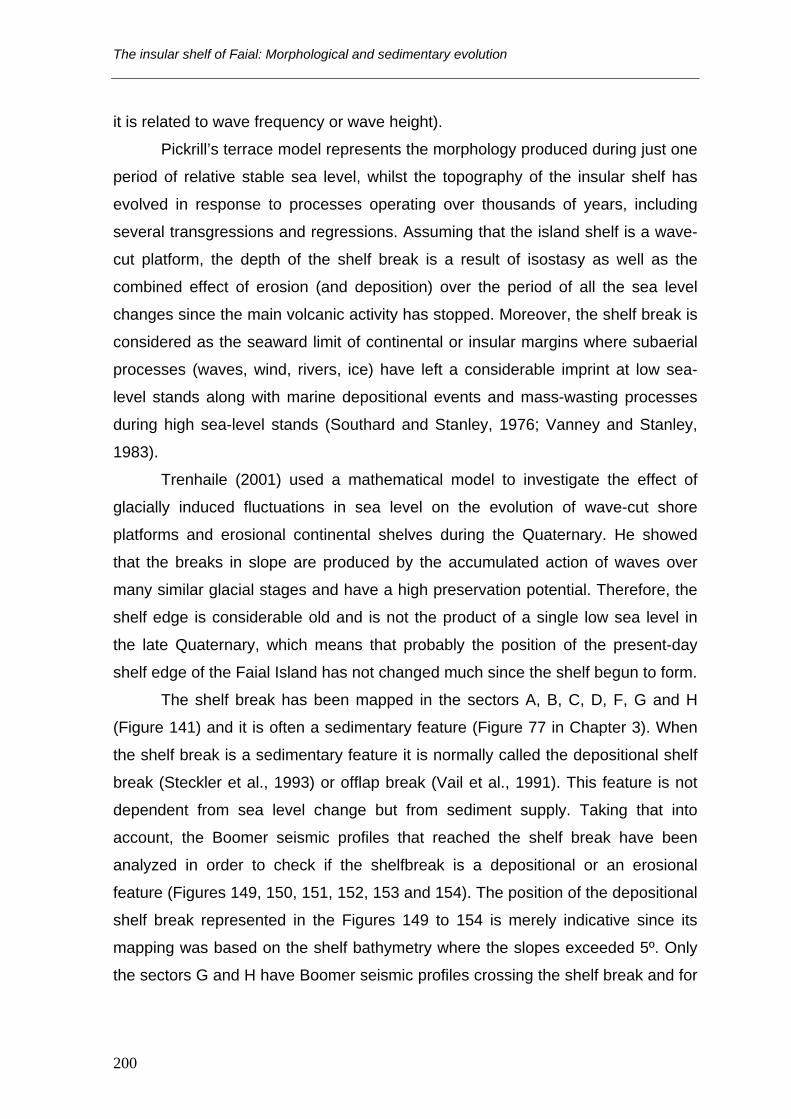
The shelf break has been mapped in the sectors A, B, C, D, F, G and H
(Figure 141) and it is often a sedimentary feature (Figure 77 in Chapter 3). When
the shelf break is a sedimentary feature it is normally called the depositional shelf
break (Steckler et al., 1993) or offlap break (Vail et al., 1991). This feature is not
dependent from sea level change but from sediment supply. Taking that into
account, the Boomer seismic profiles that reached the shelf break have been
analyzed in order to check if the shelfbreak is a depositional or an erosional
feature (Figures 149, 150, 151, 152, 153 and 154). The position of the depositional
shelf break represented in the Figures 149 to 154 is merely indicative since its
mapping was based on the shelf bathymetry where the slopes exceeded 5º. Only
the sectors G and H have Boomer seismic profiles crossing the shelf break and for
200
Chapter 5. Origin and evolution of the insular shelf of Faial
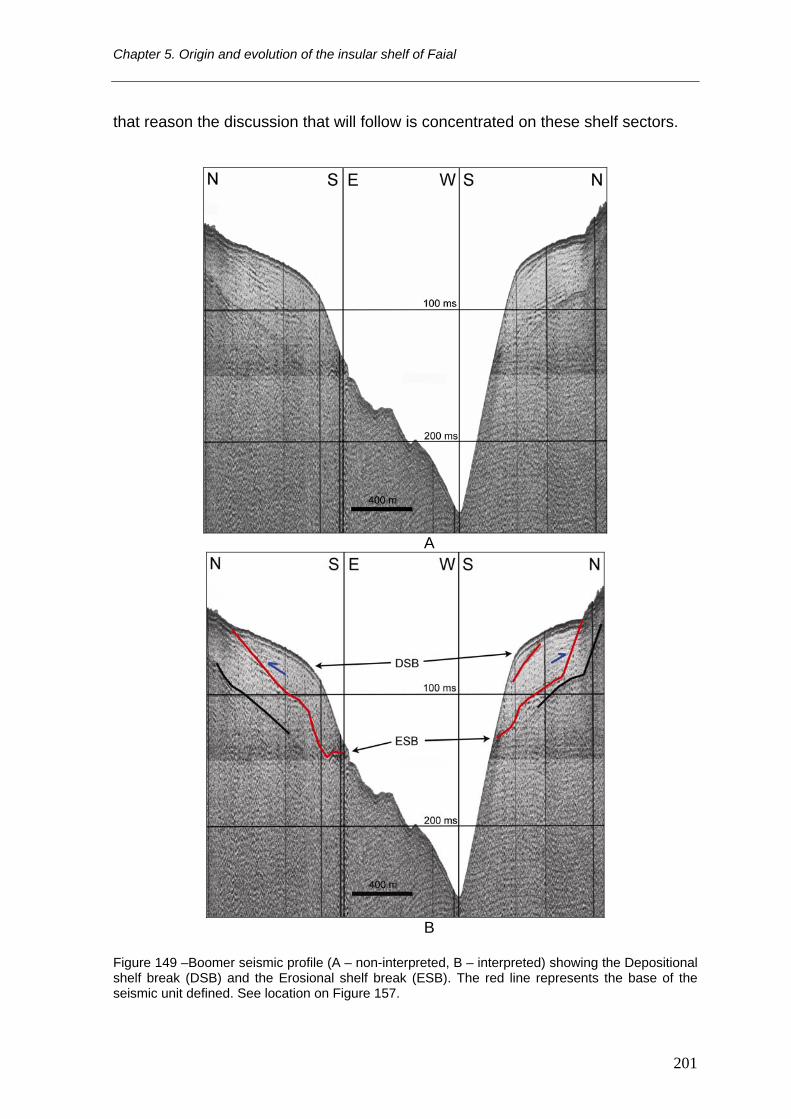
that reason the discussion that will follow is concentrated on these shelf sectors.
A
B
Figure 149 –Boomer seismic profile (A – non-interpreted, B – interpreted) showing the Depositional shelf break (DSB) and the Erosional shelf break (ESB). The red line represents the base of the seismic unit defined. See location on Figure 157.
201
The insular shelf of Faial: Morphological and sedimentary evolution
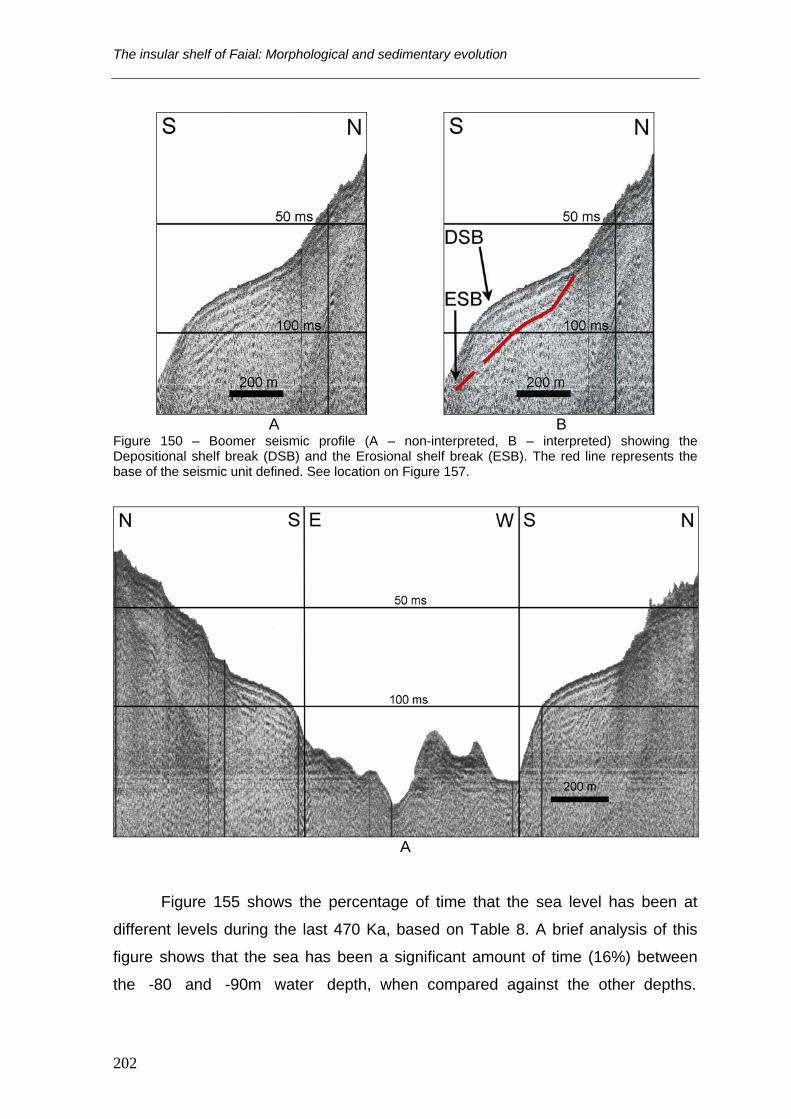
A B Figure 150 – Boomer seismic profile (A – non-interpreted, B – interpreted) showing the Depositional shelf break (DSB) and the Erosional shelf break (ESB). The red line represents the base of the seismic unit defined. See location on Figure 157.
A
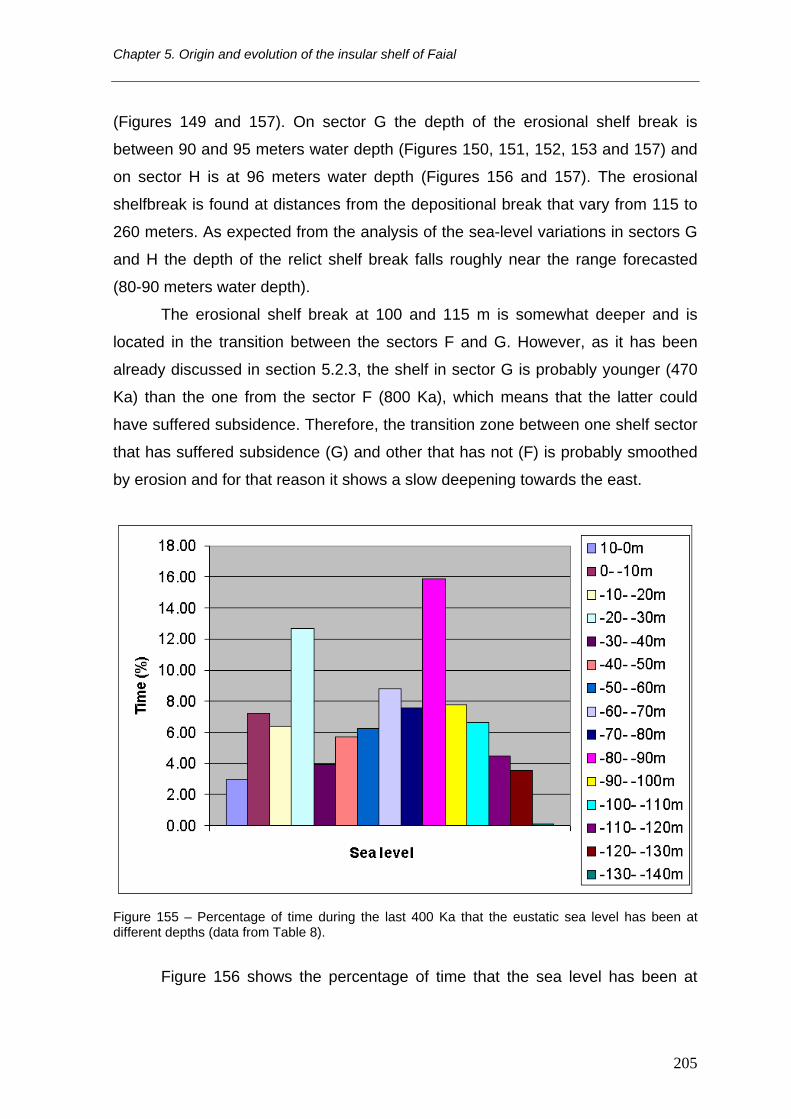
Figure 155 shows the percentage of time that the sea level has been at
different levels during the last 470 Ka, based on Table 8. A brief analysis of this
figure shows that the sea has been a significant amount of time (16%) between
the -80 and -90m water depth, when compared against the other depths.
202
Chapter 5. Origin and evolution of the insular shelf of Faial
B
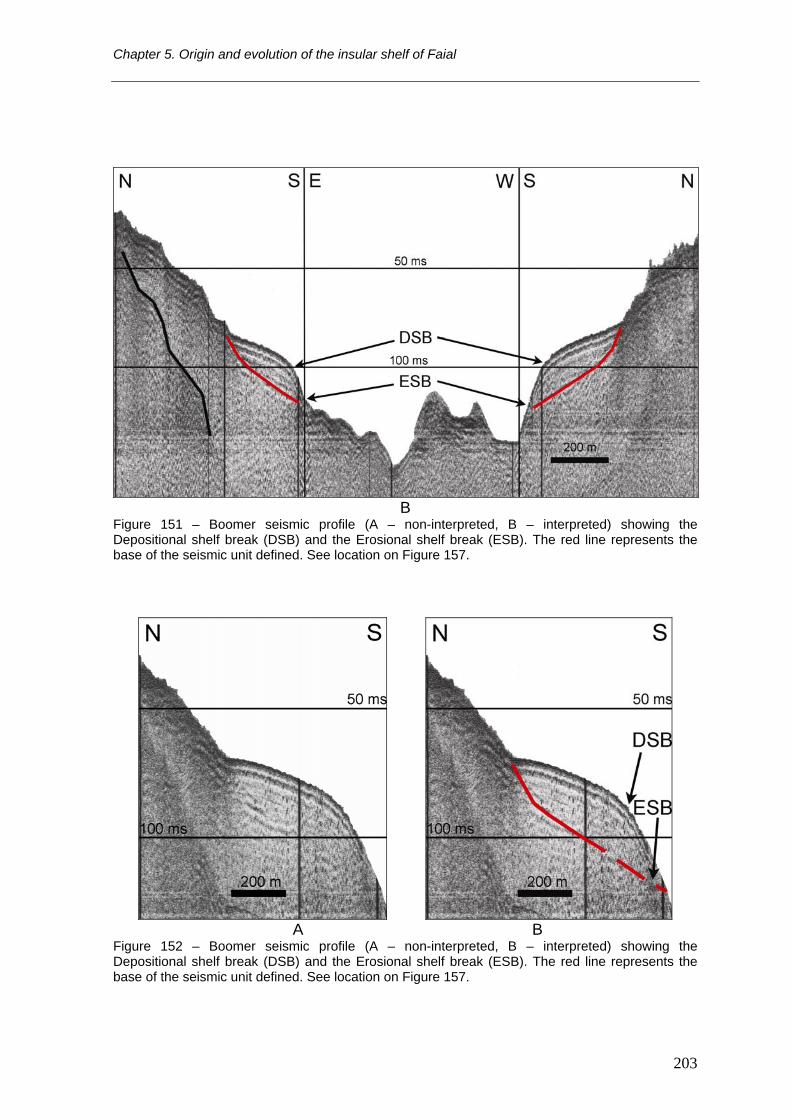
Figure 151 – Boomer seismic profile (A – non-interpreted, B – interpreted) showing the Depositional shelf break (DSB) and the Erosional shelf break (ESB). The red line represents the base of the seismic unit defined. See location on Figure 157.
A B Figure 152 – Boomer seismic profile (A – non-interpreted, B – interpreted) showing the Depositional shelf break (DSB) and the Erosional shelf break (ESB). The red line represents the base of the seismic unit defined. See location on Figure 157.
203

The insular shelf of Faial: Morphological and sedimentary evolution
A B Figure 153 – Boomer seismic profile (A – non-interpreted, B – interpreted) showing the Depositional shelf break (DSB) and the Erosional shelf break (ESB). The red line represents the base of the seismic unit defined. See location on Figure 157.
A B Figure 154 – Boomer seismic profile showing (A – non-interpreted, B – interpreted) the Depositional shelf break (DSB) and the Erosional shelf break (ESB). The red line represents the base of the seismic unit defined. See location on Figure 157.
Therefore, it would be expectable to have the erosional shelf break between these
depths. However, the contemporary processes can change in a minor degree the
position and shape of the shelf break, whether by progradation due to high
sedimentation rates, whether by retrogradation due to mass-wasting failures.
In the border between the sector F and G, the depth of the erosional shelf
break below the sedimentary wedge is at 115 and 100 meters water depth
204
Chapter 5. Origin and evolution of the insular shelf of Faial
(Figures 149 and 157). On sector G the depth of the erosional shelf break is
between 90 and 95 meters water depth (Figures 150, 151, 152, 153 and 157) and
on sector H is at 96 meters water depth (Figures 156 and 157). The erosional
shelfbreak is found at distances from the depositional break that vary from 115 to
260 meters. As expected from the analysis of the sea-level variations in sectors G
and H the depth of the relict shelf break falls roughly near the range forecasted
(80-90 meters water depth).
The erosional shelf break at 100 and 115 m is somewhat deeper and is
located in the transition between the sectors F and G. However, as it has been
already discussed in section 5.2.3, the shelf in sector G is probably younger (470
Ka) than the one from the sector F (800 Ka), which means that the latter could
have suffered subsidence. Therefore, the transition zone between one shelf sector
that has suffered subsidence (G) and other that has not (F) is probably smoothed
by erosion and for that reason it shows a slow deepening towards the east.
Figure 155 – Percentage of time during the last 400 Ka that the eustatic sea level has been at different depths (data from Table 8).
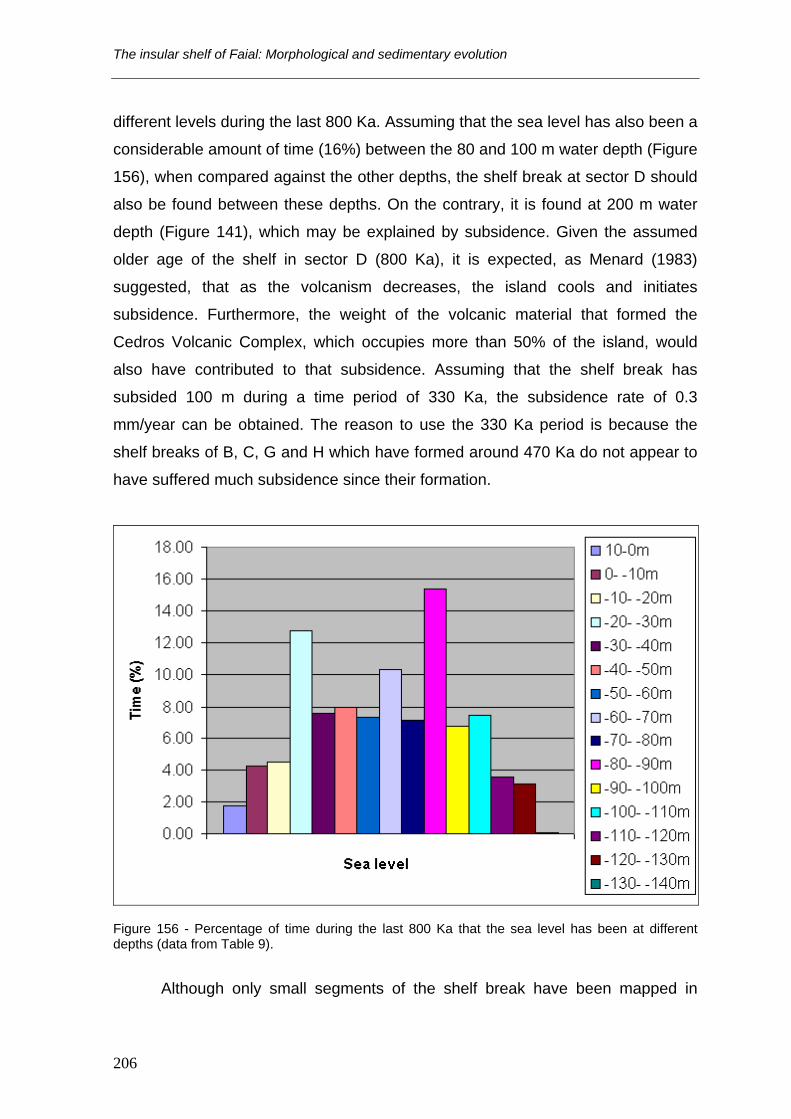
Figure 156 shows the percentage of time that the sea level has been at
205
The insular shelf of Faial: Morphological and sedimentary evolution
different levels during the last 800 Ka. Assuming that the sea level has also been a
considerable amount of time (16%) between the 80 and 100 m water depth (Figure
156), when compared against the other depths, the shelf break at sector D should
also be found between these depths. On the contrary, it is found at 200 m water
depth (Figure 141), which may be explained by subsidence. Given the assumed
older age of the shelf in sector D (800 Ka), it is expected, as Menard (1983)
suggested, that as the volcanism decreases, the island cools and initiates
subsidence. Furthermore, the weight of the volcanic material that formed the
Cedros Volcanic Complex, which occupies more than 50% of the island, would
also have contributed to that subsidence. Assuming that the shelf break has
subsided 100 m during a time period of 330 Ka, the subsidence rate of 0.3
mm/year can be obtained. The reason to use the 330 Ka period is because the
shelf breaks of B, C, G and H which have formed around 470 Ka do not appear to
have suffered much subsidence since their formation.
Figure 156 - Percentage of time during the last 800 Ka that the sea level has been at different depths (data from Table 9).
Although only small segments of the shelf break have been mapped in
206

Chapter 5. Origin and evolution of the insular shelf of Faial
sector B and sector C (red line in Figure 141), it appears that in these sectors the
shelf break might be found, if mapped, at higher depths than those found in the
sectors G and H. That is confirmed by the shelf break mapping (green line in
Figure 141) based on the Instituto Hidrográfico map (1999), although this map due
to the poor resolution does not allow obtaining its depths. In the sectors G and H,
the depositional shelf break is found at 65-70 m, whilst the unmapped area of the
sectors B and C were mapped until the 85 m water depth and no break feature
(depositional or erosional) has been found. Once again, it appears that subsidence
is the most plausible mechanism, to explain this discrepancy. The problem is that
these four sectors have the same age and a mechanism must be found to
generate subsidence on the north of the island but not on the south. This will be
discussed in more detail in the following section.
Figure 157 – The blue dots represent the places where the erosional shelfbreak has been mapped from the Boomer seismic profiles (next to them are the depths of the erosional shelf break). The red line represents the bathymetric shelfbreak mapped on this work. The corresponding figures of the seismic profiles are also shown on this map.
207

The insular shelf of Faial: Morphological and sedimentary evolution
The shelf break of the sectors A1 and A2 is on average at 20 and 25 meters
water depth respectively. Looking at the sea-level curve from Thompson &
Goldstein (2006), it is easy to see that the sea was at 38 meters water depth at 10
Ka (Figure 128 in Chapter 4). This discrepancy can only be explained by the fact
that the volcanism in this area has not been synchronous. Both shelves might
have had lavas prograding offshore until the sea-level was at the respective
present-day shelf break depths which made the start of the abrasion platform later.
5.5. Subsidence rates
The subsidence rate calculated for sector D, assuming that the shelf break
should be presently at 80-90 meters water depth, is 0.3 mm/year, which is a
considerably high value according to Pauly and McEdward (1990). These authors
compiled data of subsidence from oceanic volcanic islands and have shown that
older islands are almost stable with subsidence rates of 0.005 mm/year. In
contrast, younger islands can reach values as high as 0.2 mm/year whilst average
subsidence rates are 0.05 mm/year. Menard (1983) has also calculated average
rates of subsidence for a variety of Pacific plate islands based on estimates of reef
thickness made from bathymetric profiles and obtained subsidence rates of 0.04 to
0.23 mm/year. The subsidence rate of an island is directly connected with its
activity. An island that is volcanically active has subsidence rates up to two orders
of magnitude greater due to isostatic adjustment to the load added by the growing
island. A good example is the active volcano of Hawaii that subsides at a rate of
1.2-4.1 mm/year (Moore and Fornari, 1984).
Deep drilling in S. Miguel Island (Azores) showed subsidence rates of 1
mm/year, when transition from subaerial to submarine lavas was found at 786 m
below present sea-level. Once again, this high value reveals that subsidence
arises primarily from crustal loading due to addition of volcanic material (Muecke
et al., 1974). Moreover, São Miguel’s closest neighbor, Santa Maria, which is
currently inactive, shows uplift due to isostatic rebounding, as volcanic islands do
when they become extinct (Muecke et al., 1974). Nevertheless, this explanation
may not be that simple since S. Miguel overlies on what some authors believe to
208

Chapter 5. Origin and evolution of the insular shelf of Faial
be the Terceira Rift (TR, see Figure 18 in Chapter 2), formed either by pure
extensional regime (Buforn et al., 1988; Krause and Watkins, 1970; Udías, 1980;
Udías et al., 1986) or by transtensional regime (Argus et al., 1989; Laughton and
Whitmarsh, 1974; McKenzie, 1972; Searle, 1980). More recently Vogt & Jung
(2004) suggested that the TR is a hyper-slow (4 mm/yr) hotspot-dominated oblique
spreading axis. According to Vogt & Jung (2004) the TR is a 550 km long,
generally WNW trending line of alternating volcanic massifs (of which Graciosa,
Terceira and São Miguel islands are the highest) and basins. These deep basins
(Fig. 1 from Vogt & Jung, 2004 and Fig. 4 from Lourenço et al., 1998) that
separate the islands and seamounts along the TR may well simply be the holes
left vacant by volcanoes during volcano growth around them by sagging and
extension (Vogt and Jung, 2004).
Luís et al. (1994) work revealed several northward migrations of the
Eurasia–Africa–North America triple point, from a past location near 37°N up to its
present location in the Faial Fracture Zone (FFZ, see Figure 18 in Chapter 2).
According to these authors, the Faial and Pico are very young islands located
along the projected trace of the FFZ and probably built in a transtensional mode,
recorded geologically in the Faial graben structures (Luis et al., 1994). Recently,
new GPS data (Fernandes et al., 2006) seem to support the Pico–Faial alignment
of the triple point deduced from the magnetic modeling of Luís et al. (1994), which
may account for the high subsidence value recorded on the sector D.
It is also reasonable to assume that the fissural volcanism in the Capelo
Peninsula would also have contributed to the subsidence of the northwest sector
of the island through loading since its main body is not in the center of the island
but displaced to the northwest part (see Figure 168). This explanation could
account for the differences of the depth of the shelf break between the northern
and southern sectors of the Caldeira volcano region, discussed in the previous
section.
An alternative explanation to the shelf break variability can be due to the
selective preservation of former sea levels. Wave and rock strength function as
filters that determine the amount of time that the sea must be at a particular
elevation to produce significant erosional forms (Trenhaile, 1987). Therefore,
209

The insular shelf of Faial: Morphological and sedimentary evolution
depending on local wave conditions, geology and submarine morphology, waves
may be effective erosional agents during a low sea level stand in some areas
along a coast, but not in others (Trenhaile, 2001). These mechanisms could
explain the differences between the sectors A1 and A2 from the Capelo Peninsula
and between the sectors B, C and F, G from the Caldeira Volcano. The sectors
with higher wave frequency (see Figure 143 and Table 4 in Chapter 2) show
higher shelf break depths (A1, B and C) when compared with others of the same
age that have lower wave frequency (A2, F and G). However, it can not explain the
shelf break from sector D at 200 meters water depth, which can only be explained
by differential subsidence, either by crustal loading due to addition of the volcanic
material from Capelo Volcano, or by the transtensional regime, as suggested by
Luis et al. (1994).
5.6. Relation between the sand and gravel
volumes on the shelf and the estimated cliff and subaerial erosion rates
In Chapter 3 the sources of the sands and gravels in the shelf have been
discussed. At that time, the cliff erosion rates were not yet estimated and the
possible sources were mainly related to the onshore precipitation. Also in Chapter
3, the mechanism of deposition and age of the sedimentary bodies was discussed
and attributed to seaward downwelling currents that acted during the last 7450
years. During this period the island has been releasing sediments to the shelf
either by coastline erosion, land subaerial erosion or associated to volcanic
processes. In order to confirm the availability of sediments during this short period
of time, the volume of material eroded from the cliffs and from the subaerial
erosion of the hydrographic basins adjacent to the cliffs is calculated. The figures
obtained, are compared to the volume of the sand bodies found on the adjacent
shelf.
The submarine deposits from sectors F+G and H were almost completely
mapped (Figure 76 in Chapter 3) and for that reason their volume can be
estimated and compared with the volume of material resultant from the erosional
210
Chapter 5. Origin and evolution of the insular shelf of Faial
processes. The volume of the sediments was calculated using the ArcGis 9.0 GIS
running the 3D Analyst extension which gave 106×106 m3 of sediments for sectors
F+G of and 101 ×106 m3 for sector H.
5.6.1. Cliff erosion
The cliff erosion was calculated using the Corrected Erosion Rates
estimated on section 5.3. These erosion rates are the sum of several processes
acting on the coastline, namely wave erosion, cliff weathering and earthquake
induced landslides. On sector H the cliff heights vary from 230 m on the NNW
extreme till 60 m on the SSE extreme. Three topographic profiles (H1, H2 and H3
in Figure 158) were used and the area of the respective parallelograms was
calculated. Using these three areas as unitary volumes (corresponding to 1 m of
coastline) and the H1 and H3 as end-member and H2 as a middle member, the in-
between values were calculated using a linear interpolation technique for each
meter of coastline from a total of 5400 meters of coast. The value for the annual
cliff retreat (32 mm) was the same for entire coastline, since the shelf width is
relatively constant in this sector, suggesting that the entire cliff is retreating at the
same rate.
The calculated volume of eroded material from the cliffs on sector H during
the last 7450 years was 218×106 m3 (Table 11).
The sectors F and G have cliff heights more or less constant, with an
average of 30 meters. It might be expected that both sectors show similar erosion
rates using the shelf width as proxy. This is not the case as discussed in section
5.2, due to the uncertainty in estimating an erosion rate for the sector F.
Nevertheless, to simplify the calculations necessary to estimate the erosional
contribution of these sectors to the volume of the sand bodies found on the shelf, it
was assumed that sector F has the same erosional rate as sector G. Using for
both sectors the Corrected Erosion Rate of 20 mm/year during 7450 years, over a
cliff extension of 11500 meters, a volume of eroded material of 51.5×10⁶ m3 was
obtained.
211
The insular shelf of Faial: Morphological and sedimentary evolution
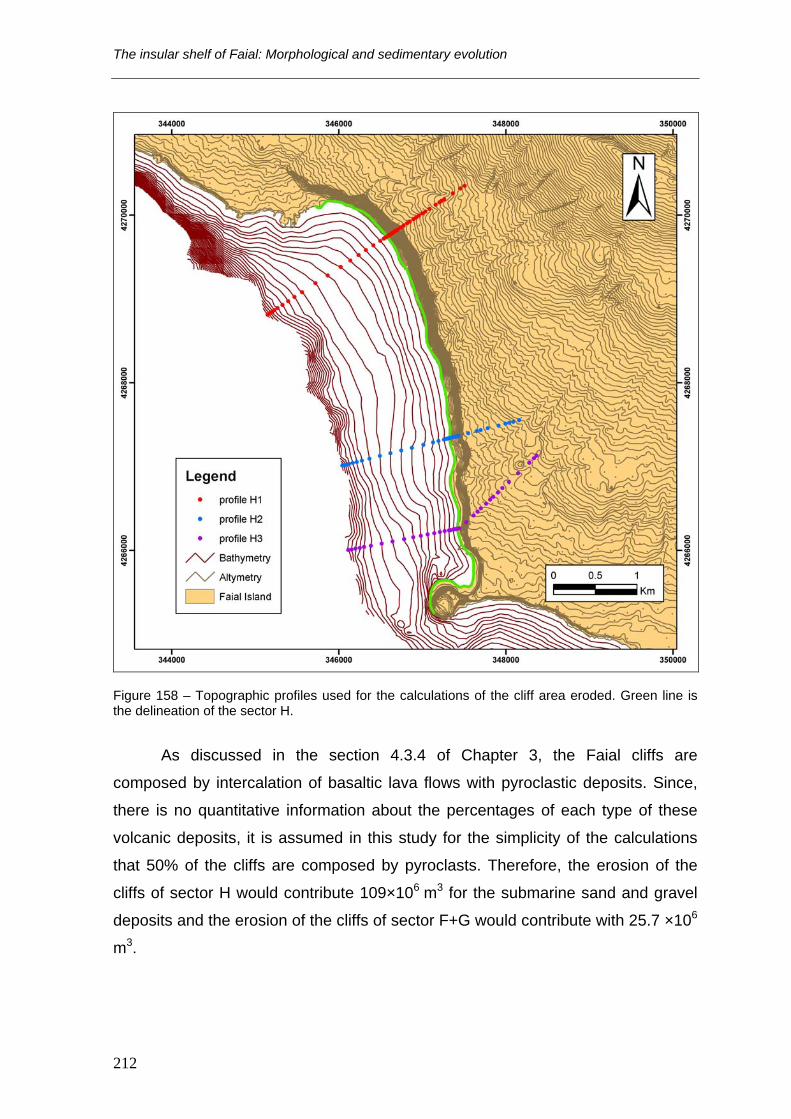
Figure 158 – Topographic profiles used for the calculations of the cliff area eroded. Green line is the delineation of the sector H.
As discussed in the section 4.3.4 of Chapter 3, the Faial cliffs are
composed by intercalation of basaltic lava flows with pyroclastic deposits. Since,
there is no quantitative information about the percentages of each type of these
volcanic deposits, it is assumed in this study for the simplicity of the calculations
that 50% of the cliffs are composed by pyroclasts. Therefore, the erosion of the
cliffs of sector H would contribute 109×106 m3 for the submarine sand and gravel
deposits and the erosion of the cliffs of sector F+G would contribute with 25.7 ×10⁶
m3.
212

Chapter 5. Origin and evolution of the insular shelf of Faial
Figure 159 – Cliff areas (brown polygons) of the sectors H1, H2 and H3 eroded during the last 7450 years.
Table 11 – Summary of the cliff erosion occurring at sectors F+G and H
Sectors
Corrected
erosion rate
mm/year
Nº of yearsCliff retreat
(m)
Average
Cliff
height
Cliff area
eroded (m2)
Profile H1 30 7450 223 230 51290
Profile H2 30 7450 223 175 39025
Profile H3 30 7450 223 100 22300
Total H 218×106 m3
F+G 20 7450 149 30 51.4×10⁶ m3
213

The insular shelf of Faial: Morphological and sedimentary evolution
5.6.1.1. Contribution from cliff weathering
Douglas et al. (1991) investigated the specific mechanism by which
subaerial processes erode precipitous basaltic sea cliffs. According to these
authors, first, microfractures develop and are eroded by processes such as
swelling, oxidation of iron, hydration, and freeze-thaw. Gradual enlargement of the
microfractures then leads to instability, and rock falls occur through gravity.
Subaerial erosion can be inferred from published erosion rates of basalt scarps
that are subject only to subaerial erosion processes. In southeast Australia, scarps
have generally retreated at rates of 12–28 m/million years (Young, 1983; Young
and McDougall, 1985), although Nott et al. (1996) noted considerably slower
erosion rates at the Shoalhaven Gorge (0.3 m/million years). Basalt scarps in
central Queensland, Australia, have retreated at rates of up to 130 m/million years
(Young and Wray, 2000), and rates of 50–95 m/million years have been recorded
at Drakensberg, South Africa (Fleming et al., 1999). Assuming these values as
reference and using the highest value found by these authors (95m/million years),
the subaerial erosion during the last 7450 years, would account only for 0.7 m of
cliff retreat and a volume of eroded material of 684.000 m3 for sector H. This value
represents only 0.31% of the 218×106 m3 estimated (Table 12). For the sectors F
and G the volume of eroded material would be 242.000 m3, which represents only
0.47% of the 51.5×10⁶ m3 estimated (Table 12).
5.6.1.2. Contribution from earthquakes
The cliff erosion also includes material resulting from landslides induced
from earthquakes. It is nevertheless impossible to estimate this contribution.
However, the report made by Coutinho (2000) of a 10 meters retreat in a sea cliff
after the 1998 seismic event and the work of Malheiro (2006), suggests that
seismicity is of considerable importance in the process of cliff retreat.
5.6.2. Subaerial erosion
There are no records of the subaerial erosion in the hydrographic basins of
the Faial Island. Nevertheless, as it was discussed in section 4.3.4 of Chapter 3,
214

Chapter 5. Origin and evolution of the insular shelf of Faial
this process appears to be responsible for the presence of sand and gravel
deposits nearshore the shelf sectors B, D, E and H. To estimate their contribution
to the submarine deposits, the areas of the two hydrographic basins have been
determined to use in the calculation of the subaerial erosion (Figure 160).
Figure 160 – Hydrographic basins responsible for the delivery of sediments to coastal sectors F+G and H.
It is possible to infer the subaerial erosion in these basins using some
published values of subaerial erosion in S. Miguel (Louvat and Allègre, 1998) and
Terceira Islands (Fontes et al., 2004). Their methods are described in detail in the
section 2.3.2 of Chapter 2. Louvat & Allègre (1998) estimated erosion rates of
riverine mechanical erosion of 70-500 ton/ km2/year. Fontes et al. (2004)
estimated erosion rates of less than 50 kg/ km2/year under pasture cover, but
increased to almost 150 ton/km2/year when the soil was disturbed by tillage and
less protected by vegetation. Both authors obtained values with similar
magnitudes for unprotected soils, 70-500 ton/ km2/year for Louvat & Allègre (1998)
215
The insular shelf of Faial: Morphological and sedimentary evolution
and 150 ton/ km2/year for Fontes et al. (2004). However, one should consider that
the soil in these hydrographic basins was once covered with evergreen forests
(Haggar, 1988) and only since the settlement in the 15th century were these
replaced by pastures. Therefore, the value of 50 kg/km2/year would probably be a
good estimate for the erosion on these basins. It would be anyway an
overestimation since the ancient land cover would retain more water than the
pastures. The calculated volume of material eroded from the hydrographic basins
F+G and H, based respectively on a surface area of 33.1 km2 and 15.2 km2 is
respectively 287.000 m3 and 138.000 m3 (Table 12).
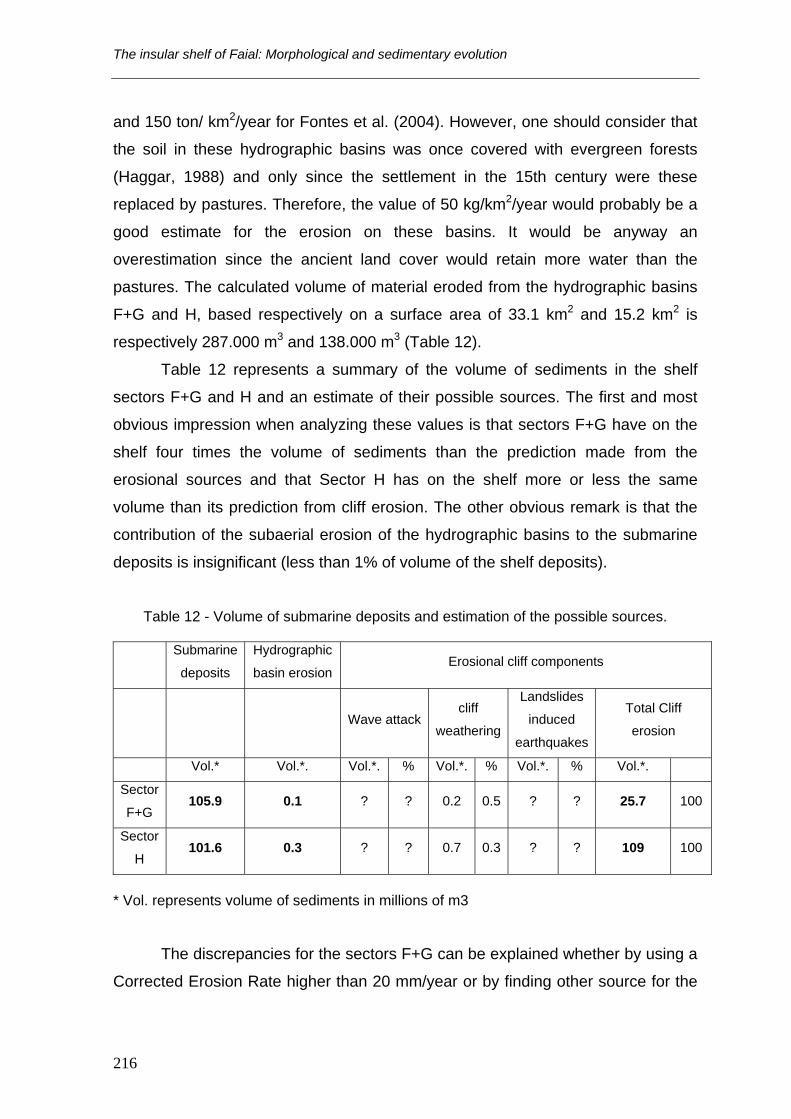
Table 12 represents a summary of the volume of sediments in the shelf
sectors F+G and H and an estimate of their possible sources. The first and most
obvious impression when analyzing these values is that sectors F+G have on the
shelf four times the volume of sediments than the prediction made from the
erosional sources and that Sector H has on the shelf more or less the same
volume than its prediction from cliff erosion. The other obvious remark is that the
contribution of the subaerial erosion of the hydrographic basins to the submarine
deposits is insignificant (less than 1% of volume of the shelf deposits).
Table 12 - Volume of submarine deposits and estimation of the possible sources.
Submarine
deposits
Hydrographic
basin erosion Erosional cliff components
Wave attackcliff
weathering
Landslides
induced
earthquakes
Total Cliff
erosion
Vol.* Vol.*. Vol.*. % Vol.*. % Vol.*. % Vol.*.
Sector
F+G 105.9 0.1 ? ? 0.2 0.5 ? ? 25.7 100
Sector
H 101.6 0.3 ? ? 0.7 0.3 ? ? 109 100
* Vol. represents volume of sediments in millions of m3
The discrepancies for the sectors F+G can be explained whether by using a
Corrected Erosion Rate higher than 20 mm/year or by finding other source for the
216
Chapter 5. Origin and evolution of the insular shelf of Faial
sediments than those presented on Table 12. The section 2.4.1 of Chapter 2
showed that adjacent to the shelf sectors F+G lye two volcanostatrigraphic units,
the Caldeira Formation and the Almoxarife Formation, composed of very friable
material. So, apparently both units could have contributed with volcaniclastic
sedimentation processes, either by syn-eruptive submarine volcaniclastic
sedimentation or non-eruptive submarine remobilization of the volcaniclastic
materials, supplying the necessary sediments to reach the shelf volume of
105.9×10⁶ of m3.
The contribution of the cliff eroded material in Sector H is similar to the
volume of sediments found on the shelf and like the sectors F+G, the
volcaniclastic sedimentation processes from the Cedros Volcanic Complex have
not be taken into account. There is also evidence that hydrographic basin erosion
plays an important role in the contribution of sand and gravel deposits to the shelf
(see discussion in section 4.3.4 in Chapter 3). Therefore, it means that probably
the Corrected Erosion Rate should be lower if considering the contribution of the
volcaniclastic sedimentation processes and the erosion of the hydrographic
basins.
In section 5.6.2 it was used a low value for the erosion of the hydrographic
basins (50 kg/ km2/year) assuming that the soils were protected by vegetation.
However, like it was discussed in the last two paragraphs, the hydrographic basins
are covered by the highly erodible deposits of either the Caldeira Formation or
Almoxarife Formation that have been emplaced by explosive eruptions during the
last 10 Ka. Therefore, the erosion value of Fontes et al. (2004) for unprotected
soils (150 ton/km2/year) is probably not that unlikely as it sounded in the first place.
The calculated volume of material eroded from the hydrographic basins F+G and
H, using this value is respectively 92×106 m3 and 42×106 m3, which is more than
enough to obtain the volume of the submarine deposits, if considering the cliff
erosion rates of Table 11.
In conclusion, the cliff erosion rates for the sectors F+G are probably higher
than 20 mm/year and also the hydrographic basin erosion rates (in the order of
some ton/km2/year) to obtain the volume of the submarine deposits. The cliff
erosion rates of the sector H is probably lower than 30 mm/year if one accounts
217

The insular shelf of Faial: Morphological and sedimentary evolution
also the contribution of the hydrographic basin erosion, in the order of some
ton/km2/year. It remains, however, impossible to evaluate the respective
contribution of each process due to lack of data. It is also possible that some of the
volcanism in the last 10 Ka have provided sediments directly to the shelf either by
syn-eruptive submarine submarine volcaniclastic sedimentation or by non-eruptive
submarine remobilization of the volcaniclastic material emplaced on the shelf (see
section 1.2.7 in Chapter 1). The role of the landslide induced earthquakes and the
wave attack on the overall value of cliff retreat is not easily perceived. It is likely
that wave attack is the major contributor for cliff retreat; what is not clear is how
lower would be the erosion rates without earthquakes. Very obvious is the
insignificance of the subaerial weathering of the cliffs (0.3-0.4×10⁶ m3) to the total
value of the submarine deposits. The probability that some percentage of the
sediments that reach the shelf may be lost to the slope is also high. That
possibility was already discussed in section 4.3.6 of Chapter 4 due to the evidence
of mass-wasting processes and gullying on the shelf break.
5.7. Evolutionary model of the Faial insular shelf
The analysis of the shelf geology in the Chapter 4 and especially the
discussion concerning the shelf width versus shelf age in the present chapter
permitted the development and proposal of an evolutionary model for the shelf of
Faial Island. This evolutionarily model is based on the assumption that the shelf is
abrasional in origin and results from the balance between erosive processes and
volcanic progradation. There are seven time windows presented in this model and
each one corresponds to the oldest age of the different subaerial volcanic stages
described in Chapter 2. The last time window is the present-day situation. The
distances of the coastline to the shelf break on most of the time windows are
merely schematic and do not correspond to real measurements.
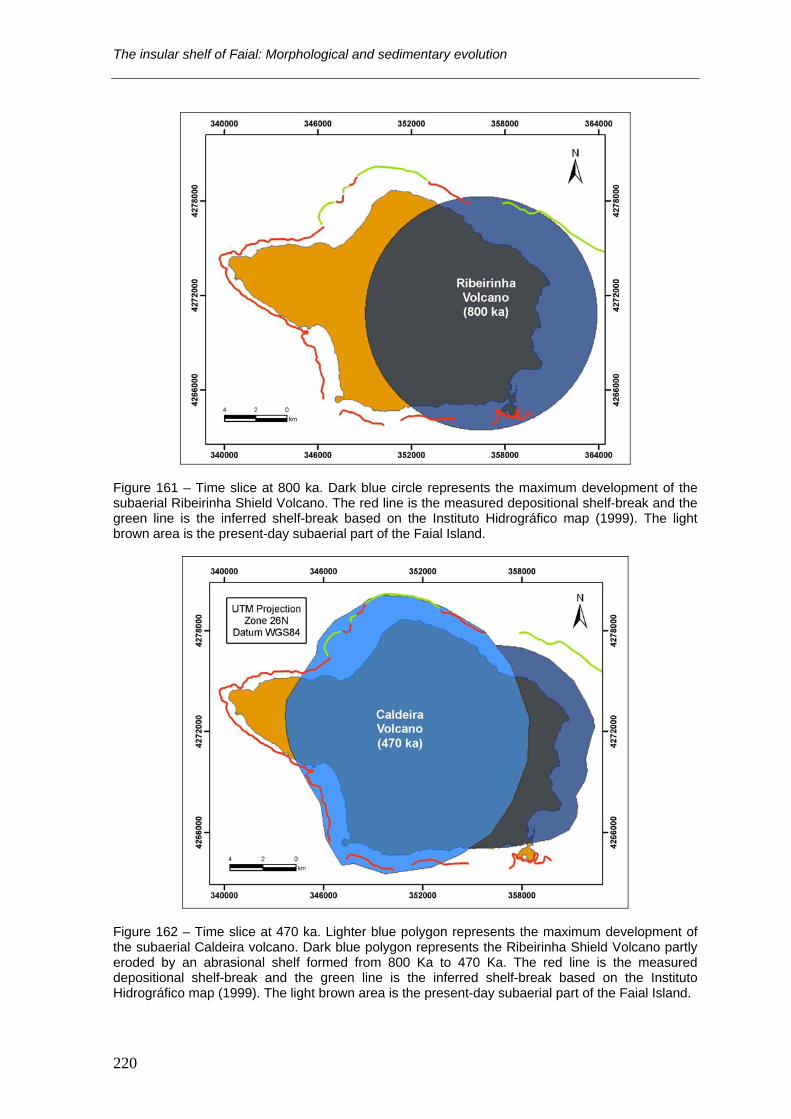
At 800 Ka ago the Ribeirinha shield volcano reached its maximum
horizontal subaerial expression marked by the mapped shelf breaks in sector D
and F in Figure 161. From 800 Ka to 470 Ka wave erosion associated to sea-level
changes formed an abrasion platform around the slopes of Ribeirinha volcano
218

Chapter 5. Origin and evolution of the insular shelf of Faial
(Figure 162). At 470 Ka ago the Caldeira Volcano (composed of the Cedros
Volcanic Complex) reached its maximum horizontal subaerial expression, covering
a significant part of the Riberinha shield volcano. The limits of its horizontal
subaerial expression are marked by the shelf breaks at sectors B, C, G and H
(Figure 162). From 470 Ka to 30 Ka an abrasion platform has formed around the
slopes of Caldeira Volcano (Figure 163). At the same time, the platform around the
Ribeirinha volcano also increased (Figure 163). At 30 Ka, fissural volcanism
emplaced the Almoxarife Formation on the top of the southeastern slope of the
Caldeira Volcano and the southern slope of the Ribeirinha volcano (Figure 164). A
significant part of the volcanism of the Almoxarife Formation has probably
prograded offshore covering the platforms cut on the slopes of Ribeirinha and
Caldeira volcanoes (Figure 164). From 30 Ka to 10 Ka all the platforms slightly
enlarged (although at the scale of Figure 168 it is not possible to see) around the
subaerial part of the island. At 10 Ka the Capelo Volcanic Complex started to form,
covering the western part of the Caldeira volcano and resetting some parts of the
platforms cut on the slopes of the Caldeira volcano (Figure 166). The limits of its
horizontal subaerial expression are marked by the shelf breaks at sectors A1 and
A2 (Figure 165). From 10 Ka to the present, the sea-level rose from - 38 m to the
present sea-level, forming an incipient platform on the offshore part of Capelo
Peninsula. In 1672 AC, a lava flow that has started on the central part of the
Capelo Peninsula, prograded, both north and south, into the sea (Figure 167). The
southern progradation was more extensive, resetting almost the southeastern
incipient platform. In 1958 AC, a surtseyan eruption (the Capelinhos volcano)
increased the western part of the Capelo Peninsula. Even the Capelinhos volcano,
a recent offshore advance of the island, has already been eroded, forming also
here an abrasion platform (Figure 168).
219
The insular shelf of Faial: Morphological and sedimentary evolution
Figure 161 – Time slice at 800 ka. Dark blue circle represents the maximum development of the subaerial Ribeirinha Shield Volcano. The red line is the measured depositional shelf-break and the green line is the inferred shelf-break based on the Instituto Hidrográfico map (1999). The light brown area is the present-day subaerial part of the Faial Island.
Figure 162 – Time slice at 470 ka. Lighter blue polygon represents the maximum development of the subaerial Caldeira volcano. Dark blue polygon represents the Ribeirinha Shield Volcano partly eroded by an abrasional shelf formed from 800 Ka to 470 Ka. The red line is the measured depositional shelf-break and the green line is the inferred shelf-break based on the Instituto Hidrográfico map (1999). The light brown area is the present-day subaerial part of the Faial Island.
220
Chapter 5. Origin and evolution of the insular shelf of Faial
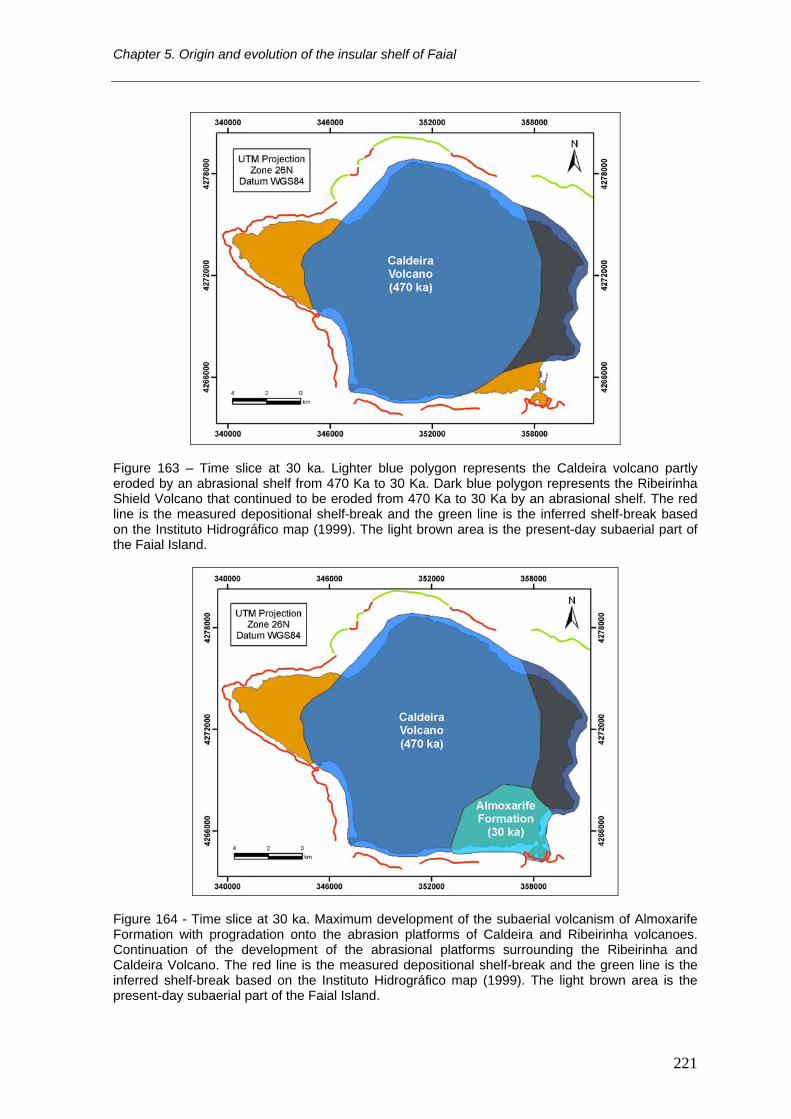
Figure 163 – Time slice at 30 ka. Lighter blue polygon represents the Caldeira volcano partly eroded by an abrasional shelf from 470 Ka to 30 Ka. Dark blue polygon represents the Ribeirinha Shield Volcano that continued to be eroded from 470 Ka to 30 Ka by an abrasional shelf. The red line is the measured depositional shelf-break and the green line is the inferred shelf-break based on the Instituto Hidrográfico map (1999). The light brown area is the present-day subaerial part of the Faial Island.
Figure 164 - Time slice at 30 ka. Maximum development of the subaerial volcanism of Almoxarife Formation with progradation onto the abrasion platforms of Caldeira and Ribeirinha volcanoes. Continuation of the development of the abrasional platforms surrounding the Ribeirinha and Caldeira Volcano. The red line is the measured depositional shelf-break and the green line is the inferred shelf-break based on the Instituto Hidrográfico map (1999). The light brown area is the present-day subaerial part of the Faial Island.
221

The insular shelf of Faial: Morphological and sedimentary evolution
Figure 165 - Time slice at 10 ka. Maximum development of the subaerial Capelo Volcanic Complex Continuation of the development of the abrasional shelf surrounding the Ribeirinha Shield Volcano, the Caldeira Stratovolcano and the Almoxarife Formation. The red line is the measured depositional shelf-break and the green line is the inferred shelf-break based on the Instituto Hidrográfico map (1999). The light brown area is the present-day subaerial part of the Faial Island.
Figure 166 - Time slice at 1672 AC. Development of the abrasional shelf surrounding the Ribeirinha Shield Volcano, the Caldeira Stratovolcano, the Almoxarife Formation and the Capelo Volcanic Complex. The red line is the measured depositional shelf-break and the green line is the inferred shelf-break based on the Instituto Hidrográfico map (1999). The light brown area is the present-day subaerial part of the Faial Island.
222

Chapter 5. Origin and evolution of the insular shelf of Faial
Figure 167 - Time slice at 1672 AC and 1958 AC. Historical lava flow of 1672 AC and Capelinhos eruption at 1958 AC. Development of the abrasional shelf surrounding the Ribeirinha Shield Volcano, the Caldeira Stratovolcano, the Almoxarife Formation and the Capelo Volcanic Complex. The red line is the measured depositional shelf-break and the green line is the inferred shelf-break based on the Instituto Hidrográfico map (1999).
Figure 168 – Present-day situation of the shelf. The red line is the measured depositional shelf-break and the green line is the inferred shelf-break based on the Instituto Hidrográfico map (1999). W – Width of the shelf; AD – Average Depth of the shelf break. The different blue polygons represent the different subaerial stages of volcanism in the Faial Island. The bold color lines bordering the coastline of Faial Island represent the landward limits of the shelf sectors defined in Chapter 3.
223

The insular shelf of Faial: Morphological and sedimentary evolution
224


![Downes v. Bidwell (1901) [Insular Cases]](https://static.fdocuments.us/doc/165x107/568165f6550346895dd91c9d/downes-v-bidwell-1901-insular-cases.jpg)


