
CHAPTER 5 MUTUAL FUND INVESTORS’...
45
83 CHAPTER 5 MUTUAL FUND INVESTORS’ BEHAVIOUR 5.1 Introduction 5.2 Fund Selection Behaviour of Mutual Fund Investors 5.2.1 Mutual Fund Product Attributes 5.2.2 Fund Preferences of Mutual Fund Investors 5.2.2.1 Selection of Mutual Fund Schemes 5.2.2.2 Association between Fund Preferences of Mutual Fund Investors and their Objectives of Investment 5.2.2.3 Association between Fund Preferences of Mutual Fund Investors and their Time Horizon 5.2.2.4 Association between Fund Preferences of Mutual Fund Investors and their Risk Perception 5.3 Post-buying Behaviour of Mutual Fund Investors 5.3.1 Association between Post-buying Behavioural Factors of Mutual Fund Investors and their Time Horizon 5.3.2 Association between Post-buying Behavioural Factors of Mutual Fund Investors and their Risk Perception 5.3.3 Association between Post-buying Behavioural Factors of Mutual Fund Investors and their Demography 5.3.4 Product Performance Satisfaction Level
Transcript of CHAPTER 5 MUTUAL FUND INVESTORS’...

83
CHAPTER 5
MUTUAL FUND INVESTORS’ BEHAVIOUR
5.1 Introduction
5.2 Fund Selection Behaviour of Mutual Fund Investors
5.2.1 Mutual Fund Product Attributes
5.2.2 Fund Preferences of Mutual Fund Investors
5.2.2.1 Selection of Mutual Fund Schemes
5.2.2.2 Association between Fund Preferences of Mutual Fund
Investors and their Objectives of Investment
5.2.2.3 Association between Fund Preferences of Mutual Fund
Investors and their Time Horizon
5.2.2.4 Association between Fund Preferences of Mutual Fund
Investors and their Risk Perception
5.3 Post-buying Behaviour of Mutual Fund Investors
5.3.1 Association between Post-buying Behavioural Factors of
Mutual Fund Investors and their Time Horizon
5.3.2 Association between Post-buying Behavioural Factors of
Mutual Fund Investors and their Risk Perception
5.3.3 Association between Post-buying Behavioural Factors of
Mutual Fund Investors and their Demography
5.3.4 Product Performance Satisfaction Level

84
5.1 Introduction
Mutual fund is the most suitable investment for the common man as it
offers an opportunity to invest in a diversified, professionally managed basket of
securities at a relatively low cost. Currently there are large numbers of mutual
fund schemes available in the market, and asset management companies
compete against one another by launching new products and repositioning old
ones. The mutual fund schemes are to be tailored to the changing needs of the
investors. In order to maintain the mutual fund products to the requirements of
the investors the AMC should understand the behaviour of mutual fund investors.
So, mutual fund investors’ behavioural studies occupy a significant role in the
designing of mutual fund products. Mutual fund investors’ behaviour refers to the
attitude and preferences of the investors while, searching, using, evaluating and
disposing mutual fund products and services that they expect, will satisfy their
needs. Therefore, the present study examine the behaviour of mutual fund
investors at two levels such as behaviour exhibited at the time of selecting mutual
fund products, and behaviour of the investors after buying the mutual fund
products. The pre-buying behaviour of the mutual fund investors is known as fund
selection behaviour of mutual fund investors, and buying behaviour exhibited
after the investment is known as post-buying behaviour of mutual fund investors.
5.2 Fund Selection Behaviour of Mutual Fund Investors
Fund selection behaviour refers to the behaviour exhibited by the
individual investors at the time of searching, evaluating and selecting mutual fund
schemes for the investment. It includes the factors influencing mutual fund
investors while selecting mutual fund products, and their fund preferences. These
two aspects are analysed in two parts, first part of this section discuss with key
features of mutual fund products (product attributes) and latter part deals with
fund preferences of the investors.

85
5.2.1 Mutual Fund Product Attributes
To ascertain the key product attributes of mutual fund products influencing
the fund selection behaviour of mutual fund investors, 38 variables were identified
from the evidence of the earlier research studies and discussions with experts in the
mutual fund industry. The 38 identified variables were coded as given below:-
A1. Past Fund performance Record
A2. Funds reputation or brand name
A3. Schemes expense ratio
A4. Schemes portfolio/constituents
A5. Withdrawal facilities/redemption features
A6. Favourable rating by a rating agency
A7. Innovativeness of the scheme
A8. Loan facility
A9. Option to switch scheme
A10. Annual return/Dividend
A11. Capital Appreciation
A12. Tax Benefit
A13. Liquidity
A14. Performance guarantee
A15. Insurance facility
A16. Safety
B1. Ownership of the company (Private/ Public)
B2. Reputation of the Sponsoring firm/Brand name/Track record
B3. Net worth of the sponsor
B4. Sponsor has a well-developed Agency/Network
B5. Sponsors expertise in managing Money
B6. Sponsor has a well-developed Research & Infrastructure
C1. Disclosure of Investment objective in the advertisement
C2. Disclosure of periodicity of Valuation in the advertisement
C3. Disclosure of the method and the Periodicity of the schemes sales
and repurchases in the offer documents

86
C4. Disclosure of NAV in every Trading day
C5. Disclosure of deviation of Investments from the original pattern
D1. Service centre
D2. Professional financial advisor
D3. Service standard
D4. Investor’s grievance redressal machinery
D5. Listing on stock exchange
D6. Technology Enabled Services
E1. Advertisement
E2. Brokers/Agents
E3. Reference Group
E4. Early bird incentives
E5. Awareness of Mutual fund products
The product attributes were measured through a five point Likert-type
scale ranging from ‘most considered’ to ‘least considered’. The identified 38
factors influencing selection of mutual fund schemes are analysed using Principal
Component Analysis, with the objective to identify the factor which is significant
in mutual fund product buying decision. Kaiser-Meyer-Olkin test and Bartlett’s
Test of Shericity measure of sampling adequacy are used to examine the
appropriateness of factor analysis. The approximate chi-square statistic is
13649.451 with 703 degrees of freedom, which is significant at 0.05 levels (table
5.1). The KMO statistic (0.940) is also large (>0.5). Hence, factor analysis is
considered as an appropriate technique of further analysis of data.
Table 5.1 KMO and Bartlett's Test
Kaiser-Meyer-Olkin Measure of Sampling Adequacy. .940
Bartlett's Test of Sphericity
Approx. Chi-square 13649.451
df 703
Sig. .000
Source: Survey data
87
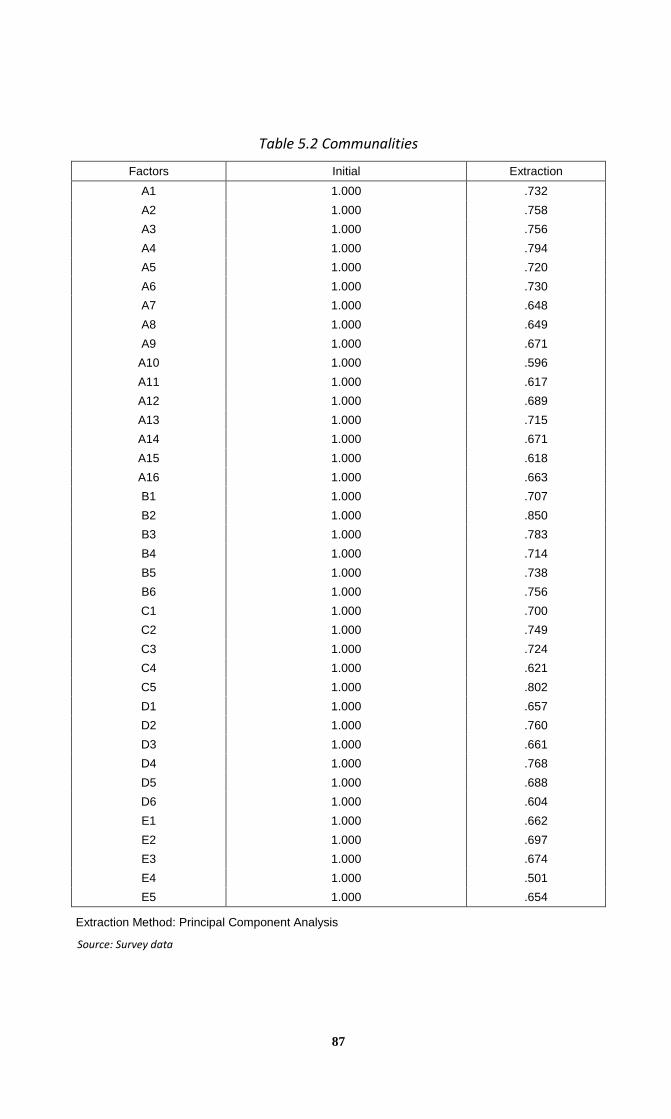
Table 5.2 Communalities
Factors Initial Extraction
A1 1.000 .732
A2 1.000 .758
A3 1.000 .756
A4 1.000 .794
A5 1.000 .720
A6 1.000 .730
A7 1.000 .648
A8 1.000 .649
A9 1.000 .671
A10 1.000 .596
A11 1.000 .617
A12 1.000 .689
A13 1.000 .715
A14 1.000 .671
A15 1.000 .618
A16 1.000 .663
B1 1.000 .707
B2 1.000 .850
B3 1.000 .783
B4 1.000 .714
B5 1.000 .738
B6 1.000 .756
C1 1.000 .700
C2 1.000 .749
C3 1.000 .724
C4 1.000 .621
C5 1.000 .802
D1 1.000 .657
D2 1.000 .760
D3 1.000 .661
D4 1.000 .768
D5 1.000 .688
D6 1.000 .604
E1 1.000 .662
E2 1.000 .697
E3 1.000 .674
E4 1.000 .501
E5 1.000 .654
Extraction Method: Principal Component Analysis
Source: Survey data

88
Table 5.3 Total Variance Explained
Component Initial Eigen values Extraction Sums of Squared
Loadings Rotation Sums of Squared
Loadings
Total % of Variance
Cumulative %
Total % of Variance
Cumulative %
Total % of Variance
Cumulative %
1 19.117 50.308 50.308 19.117 50.308 50.308 5.956 15.674 15.674
2 1.969 5.183 55.490 1.969 5.183 55.490 5.446 14.332 30.006
3 1.648 4.336 59.827 1.648 4.336 59.827 4.506 11.858 41.864
4 1.417 3.729 63.556 1.417 3.729 63.556 3.843 10.114 51.978
5 1.272 3.347 66.902 1.272 3.347 66.902 3.718 9.784 61.761
6 1.075 2.830 69.732 1.075 2.830 69.732 3.029 7.971 69.732
7 .984 2.589 72.321
8 .808 2.126 74.448
9 .764 2.009 76.457
10 .751 1.976 78.433
11 .680 1.790 80.224
12 .599 1.576 81.799
13 .581 1.529 83.329
14 .563 1.483 84.811
15 .506 1.332 86.143
16 .458 1.206 87.349
17 .420 1.104 88.453
18 .394 1.036 89.489
19 .366 .964 90.453
20 .331 .872 91.325
21 .323 .849 92.174
22 .303 .798 92.972
23 .269 .707 93.679
24 .259 .682 94.361
25 .237 .623 94.984
26 .222 .584 95.569
27 .207 .546 96.114
28 .195 .514 96.629
29 .176 .463 97.092
30 .170 .447 97.539
31 .155 .409 97.948
32 .142 .373 98.322
33 .138 .363 98.685
34 .122 .321 99.005
35 .107 .283 99.288
36 .102 .269 99.557
37 .095 .249 99.805
38 .074 .195 100.000
Extraction Method: Principal Component Analysis
Source: Survey data
89
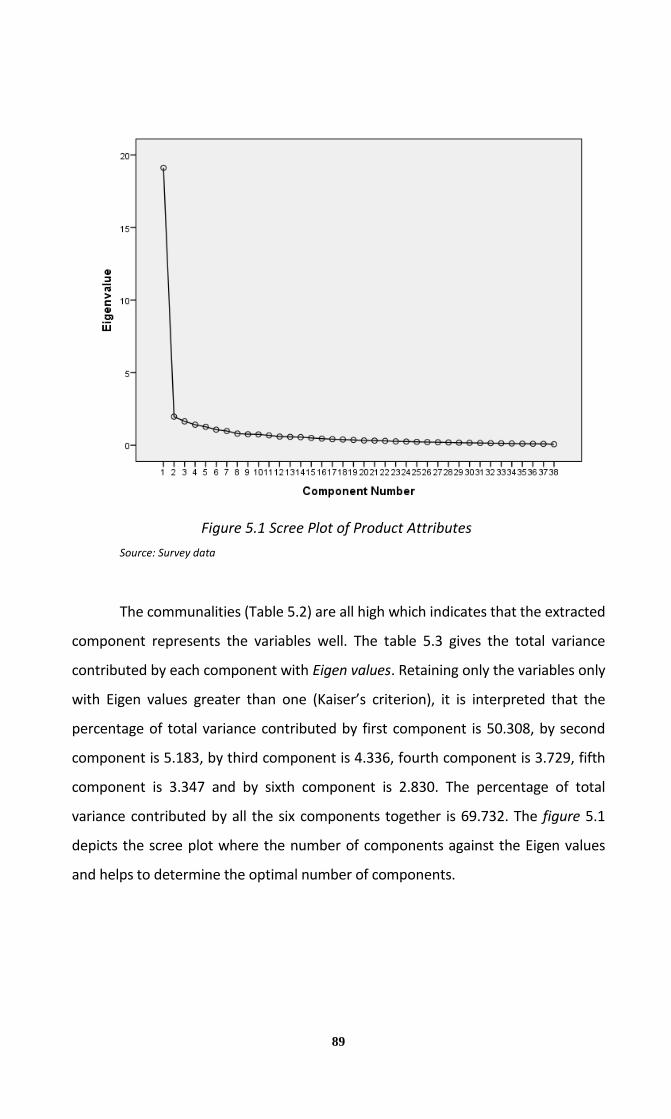
Figure 5.1 Scree Plot of Product Attributes
Source: Survey data
The communalities (Table 5.2) are all high which indicates that the extracted
component represents the variables well. The table 5.3 gives the total variance
contributed by each component with Eigen values. Retaining only the variables only
with Eigen values greater than one (Kaiser’s criterion), it is interpreted that the
percentage of total variance contributed by first component is 50.308, by second
component is 5.183, by third component is 4.336, fourth component is 3.729, fifth
component is 3.347 and by sixth component is 2.830. The percentage of total
variance contributed by all the six components together is 69.732. The figure 5.1
depicts the scree plot where the number of components against the Eigen values
and helps to determine the optimal number of components.

90
Table 5.4 Component Matrixa
Factors Component
1 2 3 4 5 6
A1 .667 -.373 -.007 .367 -.002 .116
A2 .621 -.414 .116 .408 .142 -.039
A3 .732 -.261 -.358 .045 -.059 -.133
A4 .722 -.301 -.386 .079 -.151 -.066
A5 .719 -.217 -.149 .281 -.007 .234
A6 .749 -.135 -.373 -.050 -.061 .070
A7 .723 -.201 -.284 .007 -.015 .057
A8 .667 .307 -.142 -.101 .283 .007
A9 .677 .232 -.075 -.001 .365 .141
A10 .651 .237 .078 .193 .270 .028
A11 .679 .189 -.276 .139 .066 -.143
A12 .599 .256 -.185 .208 .377 -.211
A13 .760 .132 -.335 .033 -.029 .077
A14 .740 .163 -.280 .004 .044 -.125
A15 .640 .389 -.149 -.055 .141 -.115
A16 .705 .092 -.011 -.076 .370 .119
B1 .718 -.169 .324 .184 .153 -.027
B2 .764 -.222 .389 .075 .127 -.211
B3 .799 -.118 .218 .031 -.036 -.283
B4 .781 -.023 .208 .020 -.078 -.232
B5 .781 -.087 .022 -.012 -.175 -.298
B6 .760 -.022 .054 .040 -.260 -.325
C1 .771 -.166 .107 -.225 .122 .017
C2 .786 -.116 .095 -.308 .073 -.096
C3 .761 -.181 .177 -.267 .075 .054
C4 .696 -.144 .262 -.121 .081 .161
C5 .800 -.146 .027 -.370 -.054 .022
D1 .689 -.176 .093 .113 -.011 .361
D2 .762 .124 .104 .074 -.250 .292
D3 .735 -.096 -.060 -.132 -.235 .189
D4 .757 .045 -.222 -.252 -.216 .182
D5 .722 .128 .232 -.253 .011 .181
D6 .680 .019 .120 -.330 .115 .078
E1 .612 .391 .300 .186 -.092 .034
E2 .497 .346 .187 .432 -.202 .261
E3 .624 .436 .022 .042 -.303 -.013
E4 .586 .295 .071 -.016 -.252 -.046
E5 .700 .213 .131 -.015 -.257 -.185
Extraction Method: Principal Component Analysis( a. 6 components extracted)
Source: Survey data

91
Table 5.5: Rotated Component Matrixa
Factors Component
1 2 3 4 5 6
A1 .174 .430 .102 .166 .681 .121
A2 .152 .264 .153 .044 .766 .232
A3 .202 .696 .252 .020 .279 .298
A4 .175 .761 .167 .065 .296 .255
A5 .212 .531 .213 .254 .533 -.002
A6 .306 .700 .286 .134 .180 .120
A7 .301 .623 .255 .097 .279 .133
A8 .345 .233 .651 .206 .033 .091
A9 .367 .192 .642 .213 .202 -.029
A10 .232 .080 .564 .316 .323 .116
A11 .082 .428 .535 .241 .140 .251
A12 .042 .187 .738 .110 .219 .218
A13 .231 .584 .446 .312 .118 .103
A14 .210 .481 .517 .226 .082 .266
A15 .229 .237 .613 .290 -.044 .219
A16 .476 .197 .563 .126 .253 .021
B1 .400 .083 .243 .210 .592 .293
B2 .477 .065 .217 .135 .553 .497
B3 .400 .229 .231 .213 .379 .572
B4 .388 .219 .237 .295 .308 .526
B5 .318 .406 .198 .229 .231 .571
B6 .253 .378 .167 .318 .208 .613
C1 .635 .296 .258 .086 .275 .243
C2 .649 .306 .270 .083 .167 .356
C3 .692 .264 .185 .117 .266 .238
C4 .614 .163 .156 .210 .362 .134
C5 .693 .429 .169 .139 .112 .279
D1 .432 .340 .114 .325 .481 -.062
D2 .398 .353 .142 .621 .258 .075
D3 .475 .519 .069 .340 .169 .131
D4 .486 .606 .198 .340 -.022 .098
D5 .658 .145 .252 .375 .118 .129
D6 .651 .199 .288 .157 .087 .159
E1 .226 -.027 .321 .640 .202 .239
E2 .009 .071 .198 .744 .315 .001
E3 .176 .246 .278 .651 -.056 .278
E4 .237 .215 .210 .514 -.010 .301
E5 .291 .236 .216 .482 .071 .479
Extraction Method: Principal Component Analysis. Rotation Method: Varimax with Kaiser Normalization.
a. Rotation converged in 14 iterations. Source: Survey data

92
Table 5.6: Component Transformation Matrix
Component 1 2 3 4 5 6
1 .505 .468 .412 .360 .348 .325
2 -.164 -.300 .516 .581 -.526 -.047
3 .376 -.751 -.279 .262 .306 .231
4 -.692 -.028 .101 .288 .653 -.030
5 .142 -.342 .672 -.526 .252 -.267
6 .277 .097 -.158 .322 .139 -.875
Extraction Method: Principal Component Analysis.
Rotation Method: Varimax with Kaiser Normalization.
Source: Survey data
On the basis of varimax rotation with Kaiser Normalisation six factors have
been emerged (table 5.3 and 5.4). Each factor is constituted by all those variables
that have factor loading greater than or equal to 0.5. After rotation factor one
account for 15.67 percent of the variance: factor two accounts for 14.332 percent
of variance; factor three accounts for 11.818 percent; factor four accounts for
10.114 percent of variance; factor five accounts for 9.784; factor six accounts for
7.971 percent of variance; and all the six factors together explained for 69.732
percent of variance. The identified factors with the associated variables and factor
loadings are given in the table 5.7
It is evident from the analysis that the changing preferences of the mutual
fund investors create many new needs, which may be controlled by key
determinants. The table 5.7 depicts that the first factor identified with key
attributes of mutual fund products are disclosure of deviation of Investments
from the original pattern; disclosure of the method and the periodicity of the
schemes sales and repurchases in the offer documents; disclosure of periodicity
of valuation in the advertisement disclosure of investment objective in the
advertisement; disclosure of NAV in every trading day; listing on stock exchange;

93
and technology enabled services. These attributes can be grouped under Factor- 1
and termed as Service Quality.
Table 5.7 Key factors influencing selection of mutual fund products
Component Factor Variables Factor
Loadings
F1 Service quality
Disclosure of deviation of Investments 0.693
Disclosure of the method and the
Periodicity of the schemes 0.692
Disclosure of periodicity of Valuation in
the advertisement 0.649
Disclosure of Investment objective in
the advertisement 0.635
Disclosure of NAV in every Trading day 0.614
Listing on stock exchange 0.658
Technology Enabled Services 0.651
F2 Fund quality
Schemes portfolio/constituent 0.761
Favourable rating by a rating agency 0.700
Schemes expense ratio 0.696
Innovativeness of the scheme 0.623
Liquidity 0.584
MF’s investors grievance redressal
machinery 0.606
Service standard 0.519
F3 Core of the
product
Tax Benefit 0.738
Loan facility 0.651
Option to Switch scheme 0.642
Insurance facility 0.613
Annual return/Dividend 0.564
Safety 0.563
Capital Appreciation 0.535
Performance guarantee 0.517
F4 Promotional mix
Brokers/Agent 0.744
Reference Group 0.651
Advertisement 0.640
Early bird incentives 0.514
Professional financial advisor 0.621

94
F5 Investor’s
confidence
Funds reputation or brand name 0.766
Past Fund performance Record 0.681
Withdrawal facilities/redemption
features 0.533
Ownership of the company (Private/
public) 0.592
Reputation of the Sponsoring
firm/Brand name/Track record 0.553
F6 Fund sponsor
quality
Sponsor has a well developed Research
& Infrastructure 0.613
Net worth of the sponsor 0.572
Sponsors expertise in managing Money 0.571
Sponsor has a well developed
Agency/network 0.526
Source: Survey data
The second factor is designated Fund Quality on the basis of the loaded
variables. The data set of the Factor-2 loading indicates that among various
product attributes, schemes portfolio/constituents; favourable rating by a rating
agency; schemes expense ratio; innovativeness of the scheme; liquidity; mutual
fund investors grievance redressal machinery; and service standard are found to
be important by customers for making a brand choice.
Factor- 3 shows significance for tax benefit; loan facility; option to switch
scheme; insurance facility; annual return/dividend; safety; capital Appreciation;
and performance guarantee. These attributes can be grouped under Factor-3 and
termed as core of the product. These are the core parts of a mutual fund product
which are common expectation of any customer While, making a purchase
decision.
Factor-4 includes attributes such as brokers/agents; reference group;
advertisement; early bird incentives; and professional financial advisor. This
element is more important in a competitive market where most of the product
offerings are similar and the customer finds it difficult to take a decision. In an
advanced and matured market like that of urban India what needs to be done for

95
the success of a mutual fund is a high degree of promotional mix than the current
practice. Present communication and promotions about various mutual fund
products in India are informative only. As the market has advanced to a higher
level what needs to be done is to promote own brands than promoting the
category only for attracting investors of mutual fund.
Factor-5 clearly indicates the combination of five attributes such as funds
reputation/brand name; past fund performance record; withdrawal facilities/
redemption features; ownership of the company (Private/ public); and reputation
of the sponsoring firm/brand name/track record. This factor is termed as
Investor’s Confidence, which is built over a period of time due to consistency in
performance and transparency in market behaviour.
The last and sixth factor is designated as Fund Sponsor Quality on the
basis of the factor loadings. The set of the Factor-6 loading indicates that the
variables such as sponsor has a well developed research & infrastructure; net
worth of the sponsor; sponsors expertise in managing money; and sponsor has a
well developed agency/network are found to be important by customers for
deciding their buying decision.
The six factors explained above are the proposed product combinations of
a mutual fund offering to the investors. If the product designers will be careful
about these key issues while, designing a brand of mutual fund then only the
brand will see a higher customer response and enjoy market success.
5.2.2 Fund Preferences of Mutual Fund Investors
The second factor considered under fund selection behaviour is the fund
preferences of mutual fund investors. In order to assess the fund preferences of
the mutual fund investors, various schemes of mutual funds are classified under
two groups namely schemes of mutual funds on the basis of maturity period, and
schemes of mutual funds on the basis of investment objectives. Here, the
researcher made an attempt to study the fund preference of mutual fund

96
investors by analysing the pattern of selecting different schemes of mutual funds;
and associating their pattern of selection with their investment objectives, time
horizon and risk perception.
5.2.2.1 Selection of Mutual Fund Schemes
The table 5.8 and 5.9 shows the number of respondents who have opted
different schemes of mutual funds on the basis of maturity period, and
investment objectives respectively.
Table 5.8 Number of respondents opted different schemes of Mutual funds on the
basis of maturity period
Sl
No Schemes
Opted Not opted
Total
Frequency Percentage Frequency Percentage
1 Open-ended
schemes 305 76.25 95 23.75 400
2 Close-ended
schemes 45 11.25 355 88.75 400
3 Interval schemes 25 6.25 375 93.75 400
Source: Survey data
The table 5.8 reveals that out of 400 sample respondents
305(76.25percent) respondents opted open-ended scheme. But in the case of
close-ended scheme, the percentage share in this respect is only 11.25. Similarly,
only 6.25 percent of respondents have opted interval schemes.

97
Table 5.9 Number of respondents opted different schemes of Mutual funds on the
basis of investment objectives
Sl.
No Schemes
Opted Not opted Total
Frequency Percentage Frequency Percentage
1 Growth-fund 296 74 104 26 400
2 Income-fund 42 10.50 358 89.5 400
3 Balanced-fund 40 10 360 90 400
4 Tax saving schemes 91 22.75 309 77.25 400
5 Money market funds 27 6.75 373 93.25 400
6 Sectoral based
funding 25 6.25 375 93.75 400
7 Index-Funds 23 5.75 377 94.25 400
8 Exchange Traded
funds 65 16.25 335 83.75 400
9 Capital protection
scheme 24 6 376 94 400
10 Fund of funds 11 2.75 389 97.25 400
Source: Survey data
The study on the pattern of fund preference of mutual fund investors on
the basis of investment objectives (table 5.9) indicates that 74 percent of the
respondents opted for growth-fund where as the percentage share of other types
of funds in this respect is comparatively very low. The percentage of respondents
opted income-fund is only 10.5 and the percentage share of balanced-fund is only
10. However, the percentage of respondents opted for tax saving schemes is
22.75 and exchange traded fund is 16.25. But, the percentage share of
respondents opted money market fund, sectoral fund, index fund, capital
protection scheme, and fund of funds is below 10 percent, and it indicates that
majority of the investors have not shown interest in opting such schemes.

98
5.2.2.2 Association between Fund Preferences of Mutual Fund Investors and
their Objectives of Investment
In order to study the influence of investment objectives of mutual fund
investors on their fund preferences, Friedman’s test has been conducted. The
association test has been done in accordance with the fund preferences on the
basis of maturity period and investment objectives. The table 5.10 and 5.11
presents the Friedman’s test to associate the investment objectives with fund
preferences on the basis of maturity period.
Ha: There is a significant difference in the ranking of investment objectives
of the mutual fund investors across their fund preferences.
Table 5.10 Investment objectives Vs Funds preference on the basis of Maturity
period
Objectives Open-ended Close-ended Interval schemes
Mean Rank Mean Rank Mean Rank
Rank Return 5.18 1 5.02 1 4.56 2
Rank Liquidity 3.07 4 3.31 3 3.29 3
Rank Safety 4.41 2 4.96 2 5.40 1
Rank Tax benefits 2.15 6 3.09 4 2.87 6
Rank Capital app 3.65 3 2.33 5 2.88 5
Rank Meet
Contingencies 2.59 5 2.22 6 2.99 4
Source: Survey data
Table 5.11 Equal Variance Test: Fund preference on the basis of Maturity period
Group N Missing Median 25% 75%
Col 1 6 0 3.2 2.333 4.956
Col 2 6 0 3.14 2.882 4.559
Col 3 6 0 3.294 2.655 4.419
‘F’ value Table Value d.f. P value Sig. 5 % level Inference
0.333 5.991 2 0.956 Not significant Ha rejected
Source: Survey data

99
The calculated value of ‘F’ (0.333) with 2 degrees of freedom is less than
the tabulated value of chi-square (5.991) at 5 percent level of significance and
therefore, no significant difference in the ranking of investment objectives across
fund preferences on the basis of maturity period. Thus, the null hypothesis is
accepted and alternative hypothesis is rejected.
Table 5.12 Investment objectives Vs Fund preference on the basis of Investment
Objectives
FUNDS
INVESTMENT OBJECTIVES
Return Liquidity Safety Tax
benefit
Capital
appreciation
Provision for
Contingencies
Growth-
fund
Mean 5.28 2.99 4.42 2.18 3.59 2.66
Rank 1 4 2 6 3 5
Income-
fund
Mean 5.29 2.93 4.43 2.10 4.19 2.26
Rank 1 4 2 6 3 5
Balanced-
fund
Mean 4.73 3.88 4.43 2.25 3.10 2.55
Rank 1 3 2 6 4 5
Tax
schemes
Mean 4.89 2.91 3.92 3.11 3.49 2.93
Rank 1 6 2 4 3 5
Money
market
Mean 4.48 3.85 4.67 1.94 3.33 2.82
Rank 2 3 1 6 4 5
Sectoral
based
Mean 4.81 3.19 4.31 2.06 3.56 3.06
Rank 1 4 2 6 3 5
Index
funds
Mean 5.47 3.47 4.12 2.12 3.76 2.06
Rank 1 4 2 5 3 6
Exchange
traded
Mean 5.11 2.88 5.17 2.49 3.77 2.63
Rank 2 4 1 6 3 5
Capital
Protection
scheme
Mean 4.98 3.11 4.64 2.56 3.07 2.73
Rank 1 3 2 6 4 5
Fund of
funds
Mean 5.71 1.71 5.00 3.43 3.86 1.29
Rank 1 5 2 4 3 6
Source: Survey data
100
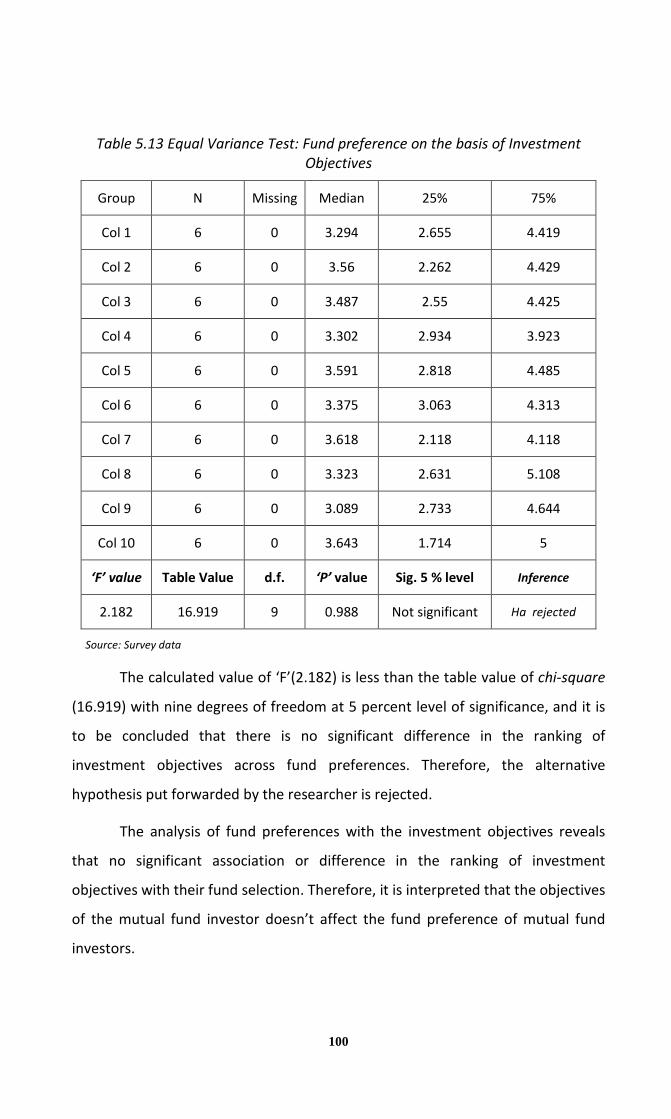
Table 5.13 Equal Variance Test: Fund preference on the basis of Investment
Objectives
Group N Missing Median 25% 75%
Col 1 6 0 3.294 2.655 4.419
Col 2 6 0 3.56 2.262 4.429
Col 3 6 0 3.487 2.55 4.425
Col 4 6 0 3.302 2.934 3.923
Col 5 6 0 3.591 2.818 4.485
Col 6 6 0 3.375 3.063 4.313
Col 7 6 0 3.618 2.118 4.118
Col 8 6 0 3.323 2.631 5.108
Col 9 6 0 3.089 2.733 4.644
Col 10 6 0 3.643 1.714 5
‘F’ value Table Value d.f. ‘P’ value Sig. 5 % level Inference
2.182 16.919 9 0.988 Not significant Ha rejected
Source: Survey data
The calculated value of ‘F’(2.182) is less than the table value of chi-square
(16.919) with nine degrees of freedom at 5 percent level of significance, and it is
to be concluded that there is no significant difference in the ranking of
investment objectives across fund preferences. Therefore, the alternative
hypothesis put forwarded by the researcher is rejected.
The analysis of fund preferences with the investment objectives reveals
that no significant association or difference in the ranking of investment
objectives with their fund selection. Therefore, it is interpreted that the objectives
of the mutual fund investor doesn’t affect the fund preference of mutual fund
investors.

101
5.2.2.3 Association between Fund Preferences of Mutual Fund Investors and
their Time Horizon
Here, the basic objective is to assess the fund preferences of mutual fund
investors in relation to their time horizon of investments. It is assumed that the
fund preferences of mutual fund investors depend on their level of time horizon
of investments. So, the researcher made an attempt to associate the fund
preferences of mutual fund investors with their time horizon of investments
(Table 5.14 & 5.15). Due to the lack of availability of sufficient number of
respondents opted for all the schemes, the analysis has been confined to selected
funds viz., Open-end, Close-end, Growth-fund, Income-fund, balanced-fund, Tax
saving fund and Exchange traded fund.
Ha: The fund preference of mutual fund investors depends on their time
horizon
Table 5.14 Fund preferences Vs Time horizon of Mutual Fund investors
Fund Time Period Opted / not
Total Yes No
Open-end
Below 1 year Count 31 11 42
% within Time Horizon 73.8% 26.2% 100.%
1 to 3 years Count 158 34 192
% within Time Horizon 82.3% 17.7% 100%
3 to 6 years Count 68 28 96
% within Time Horizon 70.8% 29.2% 100%
6 to 9 years Count 20 5 25
% within Time Horizon 80.0% 20.0% 100%
9 years & Above Count 28 17 45
% within Time Horizon 62.2% 37.8% 100%
Total Count 305 95 400
% within Time Horizon 76.2% 23.8% 100.%
Close-end
Below 1 year Count 6 36 42
% within Time Horizon 14.2% 85.7% 100%
1 to 3 years Count 10 182 192
% within Time Horizon 5.2% 94.7% 100.%
3 to 6 years Count 18 78 96
% within Time Horizon 18.7% 81.2% 100.%
6 to 9 years Count 5 20 25
% within Time Horizon 20% 80% 100.%
9 years & Above Count 6 39 45
% within Time Horizon 13.3% 86.7% 100.%
Total Count 45 355 400
% within Time Horizon 11.2% 88.8% 100%

102
Growth-fund
Below 1 year Count 32 10 42
% within Time Horizon 76.2% 23.8% 100.0%
1 to 3 years Count 151 41 192
% within Time Horizon 78.6% 21.4% 100.0%
3 to 6 years Count 62 34 96
% within Time Horizon 64.6% 35.4% 100.0%
6 to 9 years Count 15 10 25
% within Time Horizon 60.0% 40.0% 100.0%
9 years & Above Count 36 9 45
% within Time Horizon 80.0% 20.0% 100.0%
Total Count 296 104 400
% within Time Horizon 74.0% 26.0% 100.0%
Income-fund
Below 1 year Count 7 35 42
% within Time Horizon 16.7% 83.3% 100.%
1 to 3 years Count 19 173 192
% within Time Horizon 9.89% 90.1% 100.%
3 to 6 years Count 5 91 96
% within Time Horizon 5.2% 94.8% 100.%
6 to 9 years Count 6 19 25
% within Time Horizon 24% 76% 100.%
9 years & Above Count 5 40 45
% within Time Horizon 11.1% 88.8% 100.%
Total Count 42 358 400
% within Time Horizon 10.5% 89.5% 100.%
Balanced-
fund
Below 1 year Count 6 36 42
% within Time Horizon 2.38% 85.7% 100.%
1 to 3 years Count 11 181 192
% within Time Horizon 5.72% 94.2% 100.%
3 to 6 years Count 13 83 96
% within Time Horizon 13.5% 86.4% 100.%
6 to 9 years Count 5 20 25
% within Time Horizon 20% 80% 100.%
9 years & Above Count 5 40 45
% within Time Horizon 11.1% 88.9% 100.%
Total Count 40 360 400
% within Time Horizon 10.0% 90.0% 100.%
Tax Saving
Below 1 year Count 6 33 42
% within Time Horizon 14.2% 78.5% 100.%
1 to 3 years Count 39 153 192
% within Time Horizon 20.3% 79.6% 100.%
3 to 6 years Count 30 66 96
% within Time Horizon 31.2% 68.8% 100.%
6 to 9 years Count 6 19 25
% within Time Horizon 24.0% 76.0% 100.%
9 years & Above Count 10 35 45
% within Time Horizon 22.2% 77.8% 100.%
Total Count 91 309 400
% within Time Horizon 22.8% 77.2% 100.%

103
ETF
Below 1 year Count 6 36 42
% within Time Horizon 14.28% 86.05% 100.0%
1 to 3 years Count 33 159 192
% within Time Horizon 17.18% 82.81% 100.0%
3 to 6 years Count 15 81 96
% within Time Horizon 15.6% 84.4% 100.0%
6 to 9 years Count 6 19 25
% within Time Horizon 24% 76% 100.0%
9 years & Above Count 5 40 45
% within Time Horizon 11.11% 88.89% 100.0%
Total Count 65 335 400
% within Time Horizon 16.2% 83.8% 100.0%
Source: Survey data
Table: 5.15 Chi- square test for dependence of Fund preferences Vs Time horizon
of Mutual Fund investors
Funds Calculated value
of chi- square
Table
Value
Degrees
of
freedom
P value significance
at 5 % level Inference
Open-end 10.647 5.991 2 0.031 *Significant Ha is accepted
Close-end 20.594 5.991 2 0.001 *Significant Ha is accepted
Growth 10.072 5.991 2 0.039 *Significant Ha is accepted
Income 7.798 5.991 2 0.020 *Significant Ha is accepted
Balanced 6.686 5.991 2 0.035 *Significant Ha is accepted
Tax schemes 9.881 5.991 2 0.042 *Significant Ha is accepted
ETF 1.719 5.991 2 0.423 NS Ha is rejected
Source: Survey data
The table 5.14 depicts that out of 305 mutual fund investors who have
opted open-ended schemes, 158 investors opted for a period of one to three
years. But, in the case of investors who have not opted open-ended scheme, out
of 95 investors 34 investors prefer a time period of one to three years. The chi-
square test reveals that the calculated value (10.647) is more than the tabulated
value (5.991) at two degrees of freedom with five percent level of significance,
and it falls in the critical region, the alternative hypothesis is to be accepted.

104
But, in the case of close-ended fund, out of 355 investors (majority) who
have not opted the scheme 182 investors prefer a time period of one to three
years while, out of 45 investors who have opted close-ended scheme, 18
investors prefer a time period of three to six years. The statistical test shows that
the calculated value of chi- square (20.594) is more than the tabled value (5.991)
and thus, the alternative hypothesis is accepted.
The analysis of growth-fund reveals that out of 296 investors who have
opted growth-fund schemes, 151 investors prefer a time period of one to three
years. In the case of investors who have not opted growth-fund, out of 104
investors, 41 investors prefer a time period of one to three years. The chi-square
test shows that the calculated value (10.072) is greater than the tabulated value
(5.991) at two degrees of freedom with five percent level of significance, and it
falls in the critical region, the alternative hypothesis is to be accepted.
Out of 358 investors who have not opted income-fund schemes, 173
investors prefer a time period of one to three years. But, out of 42 investors who
have opted income-fund scheme, 19 investors prefer a time period of one to
three years. The calculated value of the chi- square (7.798) is greater than the
tabled value (5.991) at two degrees of freedom with five percent level of
significance, and it falls in the critical region, the alternative hypothesis is to be
accepted.
In the case of balanced-fund out of 360 investors who have not opted
balanced-funds, 181 investors prefer a time period of one to three years.
Similarly, out of 40 investors who have opted balanced-fund, 13 investors prefer a
time period of three to six years. The statistical test shows that the chi-square
value (6.686) is greater than the tabled value at two degrees of freedom with five
percent level of significance, and it falls in the critical region, the alternative
hypothesis is to be accepted.
In the case of tax saving fund, out of 309 investors who have not opted the
scheme, 153 investors prefer a time period of one to three years. Similarly, out of

105
91 investors who have opted the tax saving scheme, 39 investors prefer a time
period of one to three years. Here, the chi-square value (9.881) is more than the
tabled value (5.991) and thus, the alternative hypothesis is accepted.
Out of 335 investors who have not opted ETF, 159 investors prefer a time
period of one to three years. Similarly, out of 65 investors who have not opted
ETF, 33 investors prefer a time period of one to three years. The statistical test
shows that that the calculated value of chi- square (1.719) is less than the tabled
value (5.991) and thus, the alternative hypothesis is rejected.
The foregoing analysis of association between fund preferences and time
horizon of mutual fund investors reveals that out of seven funds, significant
association has been observed in six funds. No significant association has been
found in the case of ETF. Therefore, the researcher has accepted the alternative
hypothesis and concluded that fund preferences of mutual fund investors depend
on their time horizon of investments.
5.2.2.4 Association between Fund Preferences of Mutual Fund Investors and
their Risk Perception
It is assumed that the fund selection of mutual fund investors depend on
their level of risk perception. So the researcher made an attempt to associate the
fund preferences of mutual fund investors with their risk perception (table 5.16).
Due to the lack of availability of sufficient number of respondents opted for
certain schemes, the analysis has been restricted to selected funds such as Open-
end, Close-end, Growth-fund, Income-fund, Balanced-fund, Tax saving fund and
Exchange traded fund.
Ha: The fund preference of mutual fund investors depends on their risk
perception.

106
Table: 5.16 Association between Fund Preferences of Mutual Fund Investors and
their Risk Perception
Fund Level of risk Opted / Not
Total Yes No
Open-end
Low Count 13 17 30
% within Risk MF group 43.3% 56.7% 100.0%
Medium Count 163 51 214
% within Risk MF group 76.2% 23.8% 100.0%
High Count 129 27 156
% within Risk MF group 82.7% 17.3% 100.0%
Total Count 305 95 400
% within Risk MF group 76.2% 23.8% 100%
Close-end
Low Count 6 24 30
% within Risk MF group 20.0% 80.0% 100.0%
Medium Count 21 193 214
% within Risk MF group 9.8% 90.2% 100.0%
High Count 18 138 156
% within Risk MF group 11.5% 88.5% 100.0%
Total Count 45 355 400
% within Risk MF group 11.2% 88.8% 100%
Growth-
fund
Low Count 16 14 30
% within Risk MF group 53.3% 46.7% 100.0%
Medium Count 148 66 214
% within Risk MF group 69.2% 30.8% 100.0%
High Count 132 24 156
% within Risk MF group 84.6% 15.4% 100.0%
Total Count 296 104 400
% within Risk MF group 74.0% 26.0% 100%
Income-
fund
Low Count 6 24 30
% within Risk MF group 20% 80% 100.0%
Medium Count 27 187 214
% within Risk MF group 13.5% 85.9% 100.0%
High Count 9 147 156
% within Risk MF group 5.8% 94.2% 100.0%
Total Count 42 358 400
% within Risk MF group 10.5% 89.5% 100%

107
Balanced-
fund
Low Count 6 24 30
% within Risk MF group 20.0% 80.0% 100.0%
Medium Count 23 191 214
% within Risk MF group 10.7% 89.3% 100.0%
High Count 11 145 156
% within Risk MF group 7.1% 92.9% 100.0%
Total Count 40 360 400
% within Risk MF group 10.0% 90.0% 100%
Tax Saving
Low Count 6 24 30
% within Risk MF group 20.0% 80.0% 100.0%
Medium Count 51 163 214
% within Risk MF group 23.8% 76.2% 100.0%
High Count 34 122 156
% within Risk MF group 21.8% 78.2% 100.0%
Total Count 91 309 400
% within Risk MF group 22.8% 77.2% 100%
ETF
Low Count 7 23 30
% within Risk MF group 23.3% 76.7% 100.0%
Medium Count 31 183 214
% within Risk MF group 14.5% 85.5% 100.0%
High Count 27 129 156
% within Risk MF group 17.3% 82.7% 100.0%
Total Count 65 335 400
% within Risk MF group 16.2% 83.8% 100%
Source: Survey data
The table 5.16 depicts that out of 305 mutual fund investors who have
opted open-ended schemes, 163 investors fall under medium level of risk group.
But, in the case of investors who have not opted open-ended scheme, out of 95
investors 51 investors fall under the medium level of risk group. The chi-square
test reveals that the calculated value (19.621) is more than the tabulated value
(5.991) at two degrees of freedom with five percent level of significance, and it
falls in the critical region, the alternative hypothesis is to be accepted.

108
Table 5.17 Chi-square tests for dependence of Fund preferences Vs
Risk perception of MF investors
Funds Calculated value
of chi- square
Table
Value
Degrees of
freedom ‘P’ value
Significance
at 5 % level Inference
Open-end 19.621 5.991 2 0.000 *Significant Ha is accepted
Close-end 1.405 5.991 2 0.843 NS Ha is rejected
Growth 24.512 5.991 2 0.000 *Significant Ha is accepted
Income 7.344 5.991 2 0.025 *Significant Ha is accepted
Balanced 7.528 5.991 2 0.023 *Significant Ha is accepted
Tax schemes 0.263 5.991 2 0.877 NS Ha is rejected
ETF 3.499 5.991 2 0.174 NS Ha is rejected
Source: Survey data
But, in the case of close-ended fund, out of 355 investors (majority)
who have not opted the scheme, 193 investors belong to medium level of risk
group; While, out of 45 investors who have opted close-ended schemes, 21
investors falls under medium level of risk group. The statistical test shows that
the calculated value of chi- square (1.405) is less than the tabled value (5.991)
and thus the alternative hypothesis is rejected.
The analysis of growth-fund reveals that out of 296 investors who have
opted growth-fund schemes, 148 investors have medium level of risk
perception and 132 investors has high level of risk perception. In the case of
investors who have not opted growth-fund, out of 104 investors, 66 investors
belongs to medium level of risk group. The chi-square test shows that the
calculated value (24.512) is greater than the tabulated value (5.991) at two
degrees of freedom with five percent level of significance, and it falls in the
critical region, the alternative hypothesis is to be accepted.
Out of 358 investors who have not opted income-fund schemes, 187
investors belong to medium level risk group and 147 investors belong to high

109
level risk group. But, out of 42 investors who have opted income-fund scheme,
27 investors belong to medium level of risk group. The calculated value of the
chi- square (7.344) is greater than the tabled value (5.991) at two degrees of
freedom with five percent level of significance, and it falls in the critical region,
the alternative hypothesis is to be accepted.
In the case of balanced-fund, out of 360 investors who have not opted
balanced-funds, 191 investors belong to medium level of risk group and 145
investors coming under high level risk group. Similarly, out of 40 investors
who have opted balanced-fund, 23 investors fall under medium level of risk
group and 11 investors belong to high level risk group. The statistical test
shows that the chi-square value (7.528) is greater than the tabled value at two
degrees of freedom with five percent level of significance, and it falls in the
critical region, the alternative hypothesis is to be accepted.
In the case of tax saving fund out of 309 investors who have not opted
the scheme, 163 investors coming under medium level of risk group and 122
investors belongs to high-level risk group. Similarly, out of 91 investors who
have opted the tax saving scheme, 51 investors belongs to medium level risk
group and 34 investors represented by high-level risk group. Here the chi-
square value (0.263) is less than the tabled value (5.991) and thus, the
alternative hypothesis is rejected.
Out of 335 investors who have not opted ETF, 183 investors belong to
medium level risk group and 129 investors fall under high level risk group.
Similarly, out of 65 investors who have not opted ETF, 31 investors have
medium level of risk perception and 27 investors have high level of risk
perception. The statistical test shows that that the calculated value of chi-
square (3.499) is less than the tabled value (5.991) and thus, the alternative
hypothesis is rejected.

110
The foregoing analysis of association between fund preference and
investment objectives reveals that there is no significant association between
the fund preference of mutual fund investors and their investment objectives.
In the case of time horizon there is a significant association between fund
preferences and time horizon of mutual fund investors in respect of open-end,
close-end, growth, income, balanced and tax saving fund. The analysis of risk
perception and fund preferences indicates that risk perception of investors
depends on fund preferences in respect of open-end, growth-fund, income-
fund and balanced-fund; whereas, no statistical significance has been
observed in the case of close-end, tax saving and ETF.
5.3 Post-buying Behaviour of Mutual Fund Investors
Since, the former part of this chapter has been dealt with the fund
selection behaviour of mutual fund investors, the latter part of the discussion
emphasised on post-buying behavioural aspects. The post-buying behaviour of
investors is referred to as a collective sum of all the behavioural factors
exhibited by the mutual fund investors after investing in mutual funds such as
product performance satisfaction level, redemption factors, switching reasons,
additional buying and future buying intention. In this section the researcher
has made an attempt to study the post-buying behaviour of mutual fund
investors across their time horizon, risk perception and demographic features.
The table 5.18 depicts the post-buying profile of mutual fund investors.
The table 5.18 reveals that out of 400 sample mutual fund investors, 99.5
percent of the respondents has redeemed mutual fund units; and 62.2 percent of
the investors has performed switching of funds.

111
Table 5.18 Number of mutual fund investors opted for Redemption, Additional
buying, Switching of funds and Future buying intention
Post-buying
behavioural factors
Whether
Opted /Not
No of
respondents Percentage
Cumulative
percentage
Redemption of units
Yes 398 99.5 99.5
No 2 0.5 100
Total 400
Switching of funds
Yes 249 62.2 62.2
No 151 37.8 100
Total 400
Additional buying
Yes 250 62.5 62.5
No 150 37.5 100
Total 400
Future buying
intention
Yes 151 37.8 37.8
No 249 62.2 100
Total 400
Source: Survey data
In the case of additional units buying, majority (62.5 percent) of the
investors has bought additional units of mutual fund. However, the study reveals
that majority (62.2 percent) of the respondents had not shown future intention to
buy the mutual fund products.
5.3.1 Association between Post-buying Behavioural Factors of Mutual Fund
Investors and their Time Horizon
In order to analyse whether the time horizon of investments influence
post-buying behavioural factors of mutual fund investors, the association test
between the variables have been performed (Table 5.19 & 5.20).
Ha: The post-buying behaviour of mutual fund investors depends on time
horizon of the investment.

112
Table 5.19 Post-buying behaviour of mutual fund investors Vs Time horizon
Post-buying
behaviour Time Period
Opted/Not Total
Yes No
Redemption
Below 1 year Count 42 0 42
% within Time Horizon 100.0% 0.0% 100.0%
1 to 3 years Count 190 2 192
% within Time Horizon 99.0% 1.0% 100.0%
3 to 6 years Count 96 0 96
% within Time Horizon 100.0% 0.0% 100.0%
6 to 9 years Count 25 0 25
% within Time Horizon 100.0% 0.0% 100.0%
9 years & Above Count 45 0 45
% within Time Horizon 100.0% 0.0% 100.0%
Total Count 398 2 400
% within Time Horizon 99.5% .5% 100%
Additional
buying
Below 1 year Count 20 22 42
% within Time Horizon 47.6% 52.4% 100.0%
1 to 3 years Count 116 76 192
% within Time Horizon 60.4% 39.6% 100.0%
3 to 6 years Count 62 34 96
% within Time Horizon 64.6% 35.4% 100.0%
6 to 9 years Count 16 9 25
% within Time Horizon 64.0% 36.0% 100.0%
9 years & Above Count 36 9 45
% within Time Horizon 80.0% 20.0% 100.0%
Total Count 250 150 400
% within Time Horizon 62.5% 37.5% 100%
Switching
Below 1 year Count 20 22 42
% within Time Horizon 47.6% 52.4% 100.0%
1 to 3 years Count 129 63 192
% within Time Horizon 67.2% 32.8% 100.0%
3 to 6 years Count 55 41 96
% within Time Horizon 57.3% 42.7% 100.0%
6 to 9 years Count 18 7 25
% within Time Horizon 72.0% 28.0% 100.0%
9 years & Above Count 27 18 45
% within Time Horizon 60.0% 40.0% 100.0%
Total Count 249 151 400
% within Time Horizon 62.2% 37.8% 100%

113
Future buying
Below 1 year Count 13 29 42
% within Time Horizon 31.0% 69.0% 100.0%
1 to 3 years Count 63 129 192
% within Time Horizon 32.8% 67.2% 100.0%
3 to 6 years Count 39 57 96
% within Time Horizon 40.6% 59.4% 100.0%
6 to 9 years Count 11 14 25
% within Time Horizon 44.0% 56.0% 100.0%
9 years & Above Count 25 20 45
% within Time Horizon 55.6% 44.4% 100.0%
Total Count 151 249 400
% within Time Horizon 37.8% 62.3% 100%
Source: Survey data
Table 5.20 Chi- square test for dependence of Post-buying behaviour of Mutual
Fund investors Vs Time horizon
Variables
Calculated
value of
chi- square
Table
Value
Degrees
of
freedom
‘P’ value significance
at 5 % level Inference
Additional buying 10.406 9.488 4 0.034 NS Ha is rejected
Switching 7.93 9.488 4 0.094 NS Ha is rejected
Future
preferences 9.642 9.488 4 0.047* *Significant Ha is accepted
Source: Survey data
The table 5.19 reveals that out of 398 mutual fund investors who have
redeemed their mutual fund units, 190 (47.5percent) investors belong to one to
three years time horizon of investments. The investors who have redeemed
mutual fund units belong to three to six years of investment were 24.12 percent.
Out of 250 mutual fund investors who have bought additional units of
mutual funds, 116 (29 percent) investors have reported time horizon of one to
three years. The investors belong to three to six years of time horizon of
investment were 62 (24.8 percent). But, out of 150 mutual fund investors who
have not bought any additional units of mutual fund, 76 (50.67 percent) of
investors belong to time horizon of one to three years. The statistical test shows

114
no significant association between time horizon of investment and additional
units bought by the mutual fund investors (Table 5.20).
In the case of 151 mutual fund investors who have expressed future
intention to invest in mutual funds, 63 (41.72 percent) investors came under the
time horizon of one to three years. The investors with time horizon of three to six
years who have expressed future intention to buy the mutual fund were 39 (258)
percent. But, out of 249 investors who had not expressed future intention to buy,
129 (51.8) of investors represented by the time horizon of one to three years. The
statistical test shows that calculated value of chi-square (9.642) is greater than
the tabulated value (9.488) and falls in the rejection region with four degrees of
freedom at five percent level of significance. Thus, the null hypothesis is rejected
and it is concluded that there exist a significant association between time horizon
and future buying intention of mutual fund investors.
Out of 249 mutual fund investors who had switched their funds 129 (51.8
percent) investors account for time horizon of one to three years. But out of 151
investors who had not switched their funds, 63 (41.72 percent) investors belongs
to time horizon of one to three years. No significant association has been
observed between switching of funds and their time horizon.
The foregoing analysis reveals that out of four variables of post-buying
behaviour of mutual fund investors, statistically significant association has been
found in the future buying intention only. In the case of redemption, majority of
the investors who have redeemed the mutual fund units belong to the time
horizon of one to six years. However, no significant association has been observed
in the case of additional units buying and switching of funds. Therefore, it can be
concluded that time horizon influences redemption behaviour and future buying
preferences of mutual fund investors.

115
5.3.2 Association between Post-buying Behaviour of Mutual Fund Investors
and their Risk Perception
Risk perception of mutual fund investors is one of the important factors
that affect post-buying behaviour of mutual fund investors. The post-buying
behavioural factors such as redemption, switching, additional units buying and
future preferences may have an association with risk perception of the investors.
Therefore, the researcher has made an attempt to test the dependence of the risk
perception of mutual fund investors with their post-buying behavioural factors
(Table 5.21 & 5.22).
Ha: The post-buying behaviour of mutual fund investors depends on their
risk perception.
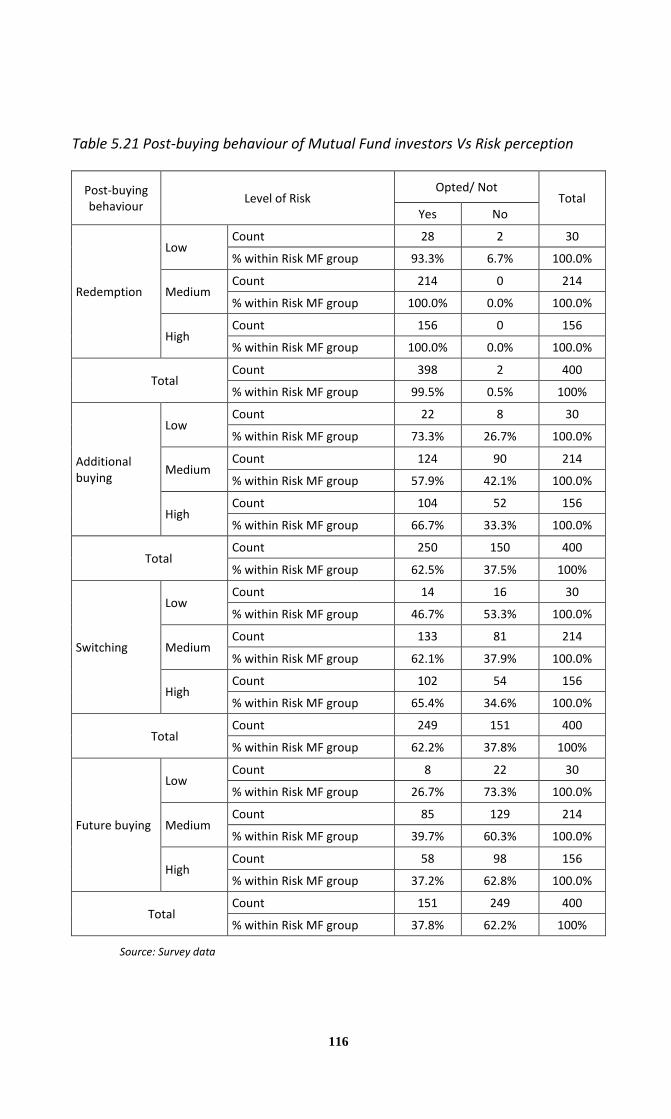
The table 5.21 reveals that out of 250 investors who have bought
additional units of mutual fund, 49.6 percent of them represented by medium
level of risk perception, and 41.6 percent of them belongs to high-level risk group.
But, out of 150 investors who haven’t bought additional units, 90 investors belong
to medium level risk group and 52 investors represented by high level risk groups.
The statistical test shows no significant association between risk group and
additional units buying (Table 5.22).
In the case of future intention to buy, out of 151 investors having interest
in future buying of mutual fund, 85 investors belong to medium level risk
perception and 58 investors having high-level risk perception. Similarly, out of 249
investors who didn’t have any future buying intention, 51.8 percent of them
represented by medium level risk group and 39.35 percent accounted by high
level risk group. However, chi-square test shows no significant association
between future buying intention of mutual fund investors and their risk
perception (Table 5.22).
116
Table 5.21 Post-buying behaviour of Mutual Fund investors Vs Risk perception
Post-buying
behaviour Level of Risk
Opted/ Not Total
Yes No
Redemption
Low Count 28 2 30
% within Risk MF group 93.3% 6.7% 100.0%
Medium Count 214 0 214
% within Risk MF group 100.0% 0.0% 100.0%
High Count 156 0 156
% within Risk MF group 100.0% 0.0% 100.0%
Total Count 398 2 400
% within Risk MF group 99.5% 0.5% 100%
Additional
buying
Low Count 22 8 30
% within Risk MF group 73.3% 26.7% 100.0%
Medium Count 124 90 214
% within Risk MF group 57.9% 42.1% 100.0%
High Count 104 52 156
% within Risk MF group 66.7% 33.3% 100.0%
Total Count 250 150 400
% within Risk MF group 62.5% 37.5% 100%
Switching
Low Count 14 16 30
% within Risk MF group 46.7% 53.3% 100.0%
Medium Count 133 81 214
% within Risk MF group 62.1% 37.9% 100.0%
High Count 102 54 156
% within Risk MF group 65.4% 34.6% 100.0%
Total Count 249 151 400
% within Risk MF group 62.2% 37.8% 100%
Future buying
Low Count 8 22 30
% within Risk MF group 26.7% 73.3% 100.0%
Medium Count 85 129 214
% within Risk MF group 39.7% 60.3% 100.0%
High Count 58 98 156
% within Risk MF group 37.2% 62.8% 100.0%
Total Count 151 249 400
% within Risk MF group 37.8% 62.2% 100%
Source: Survey data

117
Table 5.22 Chi-square test for dependence of Post-buying behaviour of Mutual
Fund investors Vs Risk perception
Variables
Calculated
value of
chi- square
Table
Value
Degrees
of
freedom
‘P’ value Significance
at 5 % level Inference
Additional buying 5.901 5.991 2 0.052 NS Ha is rejected
Switching 2.163 5.991 2 0.339 NS Ha is rejected
Future
preferences 1.106 5.991 2 0.575 NS Ha is rejected
Source: Survey data
Out of 249 mutual fund investors who have switched their funds, 53.41
percent belongs to medium level risk group and 40.96 percent constituted by
high-level risk group. Similarly, out of 151 mutual fund investors who didn’t
switch their funds, 53.64 percent accounted by medium level of risk perception
and 35.76 percent constituted by high level risk group. However, no significant
association has been observed between risk perception and switching of fund
(Table 5.22).
In the case of redemption of mutual fund units out of 398 mutual fund
investors who have redeemed their mutual fund units, 53.76 percentage of them
belongs to medium level of risk group and 39.19 percent represented by high
level risk group.
The foregoing analysis indicates that the investors with medium and high
level of risk perception have shown both features (Yes/No) of post-buying
behavioural factors such as additional units buying, future buying intention and
switching of fund. But in the case of redemption factors majority of the investors
who have redeemed their units belong to medium and high level risk groups.
However, the statistical test shows that risk perception of mutual fund investors
and their post-buying behavioural factors are independent of each other.

118
5.3.3 Association between Post-buying Behavioural Factors of Mutual Fund
Investors and their Demographic Features
In order to study the influence of demographic factors on post-buying
behaviour of the mutual fund investors, the researcher has made an attempt to
associate the post-buying behavioural factors such as additional buying factors,
future buying intention and switching of funds with selected demographic
features of mutual fund investors. The chi-square test has been done for each of
the post-buying behavioural factors to test the association between the variables.
The detailed cross tab of the association between the variables is presented in
Appendix B.
a) Additional buying Vs Demographic Features
The additional buying of mutual fund investors with their demographic
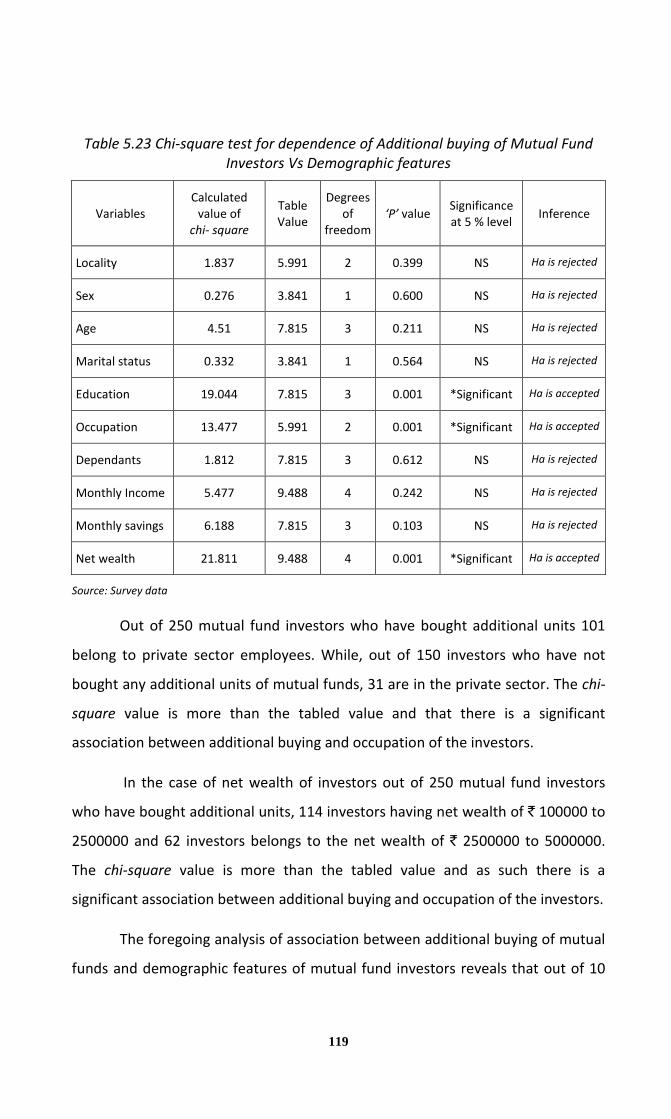
features have been tested with chi-square and its results are shown in table 5.23.
Ha: The additional buying of mutual fund investors and their demographic
features are dependent of each other.
The chi-square test shows no significant association between additional
buying with locality of the investors, sex, age and marital status, number of
dependants, monthly income and savings of the investors. While education,
occupation and net wealth of the investors have got significance with additional
buying of mutual fund units.
In the case of education, out of 250 investors who have bought additional
units of mutual fund, 124 investors belong to postgraduates and 79 investors
have postgraduate professional qualification. Since the chi-square value is more
than the tabled value, there is a significant association between additional buying
and educational status of the investors.
119
Table 5.23 Chi-square test for dependence of Additional buying of Mutual Fund
Investors Vs Demographic features
Variables
Calculated
value of
chi- square
Table
Value
Degrees
of
freedom
‘P’ value Significance
at 5 % level Inference
Locality 1.837 5.991 2 0.399 NS Ha is rejected
Sex 0.276 3.841 1 0.600 NS Ha is rejected
Age 4.51 7.815 3 0.211 NS Ha is rejected
Marital status 0.332 3.841 1 0.564 NS Ha is rejected
Education 19.044 7.815 3 0.001 *Significant Ha is accepted
Occupation 13.477 5.991 2 0.001 *Significant Ha is accepted
Dependants 1.812 7.815 3 0.612 NS Ha is rejected
Monthly Income 5.477 9.488 4 0.242 NS Ha is rejected
Monthly savings 6.188 7.815 3 0.103 NS Ha is rejected
Net wealth 21.811 9.488 4 0.001 *Significant Ha is accepted
Source: Survey data
Out of 250 mutual fund investors who have bought additional units 101
belong to private sector employees. While, out of 150 investors who have not
bought any additional units of mutual funds, 31 are in the private sector. The chi-
square value is more than the tabled value and that there is a significant
association between additional buying and occupation of the investors.
In the case of net wealth of investors out of 250 mutual fund investors
who have bought additional units, 114 investors having net wealth of ` 100000 to
2500000 and 62 investors belongs to the net wealth of ` 2500000 to 5000000.
The chi-square value is more than the tabled value and as such there is a
significant association between additional buying and occupation of the investors.
The foregoing analysis of association between additional buying of mutual
funds and demographic features of mutual fund investors reveals that out of 10

120
selected demographic variables significant association has been observed in the
case of three variables such as education, occupation and net wealth of mutual
fund investors. Therefore, it is concluded that the education, occupation and net
wealth of mutual fund investors have significant association with additional
buying of mutual fund units.
b) Future Buying Intention Vs Demographic features
Future buying intention of mutual fund investors may have an association
with demographic features of the investor. Therefore, the researcher made an
attempt to associate demographic features with future buying intention of
mutual fund investors (table 5.24).
Ha: The future buying intention of mutual fund investors and their
demographic features are dependent of each other.
The chi-square test shows no significant association between future
buying intention with locality, sex, age, marital status, occupation, and monthly
income of the investors. While, education, number of dependants, monthly
savings and net wealth of the investors have got significance with future buying
intention of Mutual Fund Investors.
In the case of education, out of 151 investors who opted for future buying
intention, 74 investors belong to postgraduates and 54 investors have
postgraduate professional qualification. The chi-square value is more than the
tabled value which shows that there is a significant association between future
buying intention and education of the investors.

121
Table 5.24 Chi-square test for dependence of Future buying intention of Mutual
Fund Investors Vs Demographic features
Variables
Calculated
value of
chi- square
Table
Value
Degrees
of
freedom
‘P’ value Significance
at 5 % level Inference
Locality 0.213 5.991 2 0.899 NS Ha is rejected
Sex 0.111 3.841 1 0.985 NS Ha is rejected
Age 5.303 7.815 3 0.151 NS Ha is rejected
Marital status 0.268 3.841 1 0.604 NS Ha is rejected
Education 14.372 7.815 3 0.002 *Significant Ha is accepted
Occupation 8.029 9.488 4 0.091 NS Ha is rejected
Dependants 10.277 7.815 3 0.016 *Significant Ha is accepted
Monthly Income 7.518 9.488 4 0.111 NS Ha is rejected
Monthly savings 12.913 7.815 3 0.005 *Significant Ha is accepted
Net wealth 15.629 7.815 3 0.001 *Significant Ha is accepted
Source: Survey data
Out of 151 mutual fund investors who have opted future buying intention,
53 investors are having three or more dependants. As the chi-square value is
more than the tabled value there is a significant association between future
buying intention and number of dependants of the investors.
The investors having average monthly savings up to ` 25000 have shown
more interest in future buying of mutual fund products.
In the case of net wealth of investors, out of 151 mutual fund investors who
have opted for future buying intention, 80 investors having net wealth of ` 100000
to 2500000 and 28 investors belong to the net wealth of ` 2500000 to 5000000.
The chi-square value is more than the tabled value, and thus there is a significant
association between future buying intention and occupation of the investors.

122
It can be summarized from the analysis that the variables such as
education, dependents, average savings and net assets have got significant
relationship in the future preferences of mutual fund investors. Thus, it can be
generalized that the earning capacity, educational profile, net wealth and family
size influences the future buying intention of the investors while making mutual
fund investments.
b) Switching of fund Vs Demographic Features
After considering additional buying and future buying intention, switching
of funds is the next important variable to be tested for association with
demography. Table 5.25 elaborates the test of dependence of switching of funds
Vs demographic features of mutual fund investors.
Ha: The Switching of funds and the demographic features of mutual fund
investors are dependent of each other.
The chi-square test shows no significant association between switching of
Mutual Fund Investors with locality sex, age, marital status, and occupation,
number of dependants, monthly savings, income and net wealth of the investors.
But, locality and educational level of investors have got significant association
with switching of fund.

123
Table 5.25 Chi-square test for dependence of Switching of Funds Vs Demographic
features
Variables
Calculated
value of
chi- square
Table
Value
Degrees
of
freedom
‘P’ value Significance
at 5 % level Inference
Locality 4.817 5.991 2 0.09 *Significant Ha is accepted
Sex 0.736 3.841 1 0.391 NS Ha is rejected
Age 4.152 7.815 3 0.246 NS Ha is rejected
Marital status 0.076 3.841 1 0.783 NS Ha is rejected
Education 9.45 7.815 3 0.024 *Significant Ha is accepted
Occupation 9.02 9.488 4 0.061 NS Ha is rejected
Dependants 6.888 7.815 3 0.076 NS Ha is rejected
Monthly Income 0.767 9.488 4 0.943 NS Ha is rejected
Monthly savings 0.319 7.815 3 0.956 NS Ha is rejected
Net wealth 1.209 7.815 3 0.751 NS Ha is rejected
Source: Survey data
Out of 249 mutual fund investors who have opted for switching of funds, 104
(43.2 percent) belongs to urban areas and 72 (28.8 percent) of investors represented
by rural areas. While, out of 151 investors who have not switched the funds, 76 (48
percent) of investors constituted from urban areas and 45 (30 percent) comes from
rural areas. As the chi-square value is more than the tabled value there is a significant
association between Switching of Funds and their locality.
In the case of education, out of 249 investors who opted for switching of
funds, 107 investors belong to postgraduates (non professional) and 86 investors
have postgraduate professional qualification. The chi-square value is more than
the tabled value, which shows that there is a significant association between
switching of funds and educational level of the investors.
The foregoing analysis of association between post-buying behaviour and
demographic features of mutual fund investors indicates that educational status

124
and economic status of mutual fund investors have an association with post-
buying behavioural aspects of mutual fund investors in respect of additional
buying, switching of funds and future buying preferences.
5.3.4 Product Performance Satisfaction Level of Mutual Fund Investors
Product performance satisfaction level can be referred to as the
satisfaction level of mutual fund investors with regards to return, transparency,
safety, liquidity, service quality, fund management and the overall performance of
the mutual fund products. Here, the researcher made an attempt to analyse the
satisfaction level of mutual fund investors in respect of different funds/schemes
opted by the investors. For these purpose seven parameters of satisfaction of
mutual fund investors in respect of the investment including overall performance
of the fund has been taken in to consideration. The respondents are asked to rate
the performance parameters on five point Likert-type scale ranging from excellent
to extremely poor. The standardised regression weight obtained for the seven
parameters is presented in table 5.26.
Table 5.26 Standardized Regression Weights of parameters of Product
Performance Satisfaction
Sl No. Parameters Estimate Rank
1 Return 0.676 6
2 Transparency 0.677 5
3 Safety 0.673 7
4 Service 0.792 3
5 Professional management 0.853 2
6 Liquidity 0.764 4
7 Overall performance 0.867 1
Source: Survey data
The standardised regression weight of product performance satisfaction
level of mutual fund investors reveals that overall performance is one of the
major indicators of satisfaction level of mutual fund investors. The second rank

125
belongs to professional management of AMCs with regression weight of 0.853.
Service quality, liquidity, transparency, return and safety are the third, fourth,
fifth, sixth and seventh rank respectively.
Later on, the researcher has classified the overall satisfaction level of
mutual fund investors in to three groups such as low level of satisfaction, medium
level of satisfaction and high level of satisfaction. The Table 5.27 shows the
detailed result of overall product performance satisfaction level of the
respondents in respect of the schemes/funds opted by them .
Ho: Mutual fund product performance satisfaction level of the investors is
uniform across different types of funds.
Table 5.27 Overall Product performance satisfaction level of the mutual fund
investors in respect of different funds
Sl
No Funds
Level of satisfaction
Total Chi-
square ‘P’ value
High % Medium % Low %
1 Open-ended 34 11.14 104 34.09 167 54.75 305 85.91 0.000*
2 Closed ended 7 15.55 11 24.44 27 60 45 14.93 0.0007*
3 Growth-fund 26 8.78 98 33.10 172 58.10 296 106.74 0.000*
4 Income Fund 6 14.28 15 35.71 21 50 42 8.14 0.0170*
5 Balanced Fund 7 17.5 13 32.5 20 50 40 5.34 0.0692
6 Tax Saving 5 5.49 32 35.16 54 59.34 91 38.03 0.000*
7 Exchange
Traded 5 7.69 19 29.23 41 63.07 65 29.01 0.000*
*Significant at 5 % level (d.f.2)
Source: Survey data
The table 5.26 reveals that out of 305 mutual fund investors who have
opted open-ended scheme, 54.74 percent of the investors have only low level of
satisfaction about their fund performance, and 34.09 percent of the investors
126
have medium level of satisfaction. The Chi-square test reveals that the
satisfaction level of the respondents among the sample groups is not uniform.
Out of 45 mutual fund investors who have opted close-ended scheme, 60
percent of them have only low level of satisfaction about their fund performance,
while 24.44 percent of the investors have medium level of satisfaction. The
statistical test shows that there is a significant difference in the satisfaction level
of mutual fund investors.
Out of 296 mutual fund investors who have opted growth-funds, 58.1
percent investors have only low level of satisfaction about their fund
performance, whereas 33.1 percent of the investors have medium level of
satisfaction. The Chi-square test reveals that the satisfaction level of the
respondents among the sample groups is not uniform.
Out of 42 mutual fund investors who have opted income-funds, 50
percent of the investors have only low level of satisfaction about their fund
performance, and 35.71 percent of the investors have medium level of
satisfaction. The Chi-square test reveals that the satisfaction level of the
respondents among the sample groups is not uniform.
In the case of balanced-funds, out of 40 investors who have opted the
scheme, 50 percent of the investors have only low level of satisfaction about their
fund performance, and 13 percent of the investors have medium level of
satisfaction. However, the statistical test shows no significant difference in the
satisfaction level of the mutual fund investors in respect of balanced-funds.
Out of 91 mutual fund investors who have opted tax saving funds, 59.34
percent of the investors have only low level of satisfaction about their fund
performance, and 32 percent of the investors have medium level of satisfaction.
The Chi-square test reveals that the satisfaction level of the respondents among
the sample groups is not uniform.

127
Out of 65 mutual fund investors who have opted ETF, 63.07 percent of
them have shown only low level of satisfaction about their fund performance, and
19 percent of the investors have medium level of satisfaction. The Chi-square test
reveals that the satisfaction level of the respondents among the sample groups is
not uniform.
The foregoing analysis of product performance satisfaction level of mutual
fund investors in respect of different funds opted by them shows that most of the
investors have only low level of satisfaction about the performance of mutual
fund. It also reveals that the satisfaction level of the mutual fund investors in
respect of the funds opted by them is not uniform among the sample groups.
Therefore, the null hypothesis put forth by the researcher is rejected and
concluded that there is a significant difference in the product performance
satisfaction level of mutual fund investors in respect of the funds opted by them
(except in case of balanced-fund).