
Chapter 5 Morphology of MAn-g-EPM based ionomers - Technische
204
Ionomeric Thermoplastic Elastomers based on Ethylene-Propylene Copolymers Preparation, Structure and Properties
Transcript of Chapter 5 Morphology of MAn-g-EPM based ionomers - Technische
Ionomeric Thermoplastic Elastomers based
on Ethylene-Propylene Copolymers Preparation, Structure and Properties
CIP-DATA LIBRARY TECHNISCHE UNIVERSITEIT EINDHOVEN Wouters, Mariëlle Ionomeric thermoplastic elastomers based on ethylene-propylene copolymers : preparation, structures and properties / by Maria E.L. Wouters. - Eindhoven : Technische Universiteit Eindhoven, 2000. - Proefschrift. - ISBN 90-386-3051-4 NUGI 813 Trefwoorden: polymeren ; mechanische eigenschappen / elastomeren ; vernetting / morfologie / polymeren ; Röntgenverstrooiing Subject headings: polymers ; mechanical properties / elastomers ; crosslinking / morphology / polymers ; X-ray scattering Omslagontwerp: Ben Mobach (TUE), Mariëlle Wouters Druk: Universiteitsdrukkerij TUE 2000, M.E.L. Wouters
Ionomeric Thermoplastic Elastomers based
on Ethylene-Propylene Copolymers
Proefschrift
ter verkrijging van de graad van doctor aan de
Technische Universiteit Eindhoven, op gezag van de
Rector Magnificus, prof.dr. M. Rem, voor een
commissie aangewezen door het College voor
Promoties in het openbaar te verdedigen
op maandag 11 december 2000 om 16.00 uur
door
Maria Elisabeth Louise Wouters
geboren te ‘s-Hertogenbosch
Dit proefschrift is goedgekeurd door de promotoren:
prof.dr. F.L. Binsbergen
en
prof.dr. P.J. Lemstra
Het onderzoek beschreven in dit proefschrift werd
mogelijk gemaakt door financiële steun van DSM

voor Paul,
voor mijn ouders

Contents
Summary vii
Glossary xi
Chapter 1 Introduction 1.1 General considerations 1 1.2 Thermoplastic elastomers 2 1.2.1 General introduction 2 1.2.2 Thermoplastic elastomers vs. conventional crosslinked rubbers 3 1.2.3 Types of TPEs 4 1.3 Ionomers 6 1.3.1 Definition 6 1.3.2 Historical aspects 6 1.3.3 EPDM based ionomers 8 1.4 Proposal to use the ionomeric principle for thermoplastic elastomers 8 1.5 Objective and outline of this thesis 9 1.6 References 11
Chapter 2 Grafting of Maleic Anhydride 2.1 Introduction 13 2.2 Grafting of Maleic Anhydride onto polyolefins in solution 14 2.2.1 Materials 14 2.2.2 Grafting procedure 15 2.2.3 Analysis 15 2.3 Results and Discussion 16 Effect of … 2.3.1 type of peroxide 17 2.3.2 peroxide concentration 19 2.3.3 reaction time 20 2.3.4 polymer concentration 21 2.3.5 maleic anhydride concentration 22 2.3.6 molecular weight of the polyolefin 24 2.4 Conclusions 25 2.5 References 25
ii
Chapter 3 Ionomer preparation Neutralisation of MAn-g-EPM
3.1 Introduction 27 3.2 Ionomer preparation 28 3.2.1 Materials 28 3.2.2 Neutralisation procedure 28 3.2.3 Definitions concerning concentrations 28 3.3 Characterisation 29 3.3.1 Methods 29 3.3.2 Results and discussion 30 3.4 Conclusions 34 3.5 References 34
Chapter 4 Morphological models for ionomers 4.1 Introduction 35 4.2 Overview of proposed structural models for ionomers 35 4.3 Morphological models to fit SAXS data 37 4.3.1 Introduction 37 4.3.2 Evaluation of some morphological models 42 4.3.3 The model and fitting procedure 48 4.4 Conclusions 50 4.5 References 51
Chapter 5 Morphology of MAn-g-EPM based ionomers 5.1 Introduction 53 5.2 Aggregate formation in carboxylic acid based ionomers 54 5.3 Small Angle X-ray Scattering 55 5.3.1 Introduction 55 5.3.2 Experimental 55 5.3.3 Results 56 5.3.4 Discussion 59 5.3.5 Summary 67 5.4 Solid State NMR 67 5.4.1 Introduction 67 5.4.2 Solid state 1H NMR techniques 69 5.4.3 Experimental 71 5.4.4 Results and discussion 72 5.4.5 Conclusions 80
Contents
iii
5.5 Transmission Electron Microscopy 81 5.5.1 Introduction 81 5.5.2 Experimental 82 5.5.3 Results and discussion 82 5.5.4 Conclusions 84 5.6 Conclusions 84 5.7 References 86
Chapter 6 Gel content of MAn-g-EPM based ionomers 6.1 Introduction 89 6.2 Effect of ionomer composition on gel content 89 6.2.1 Experimental 90 6.2.2 Results 90 6.2.3 Discussion 93 6.3 Conclusions 96 6.4 References 96
Chapter 7 Material properties of MAn-g-EPM based ionomers 7.1 Introduction 97 7.2 Effect of ionomer composition on processing properties 98 7.2.1 Experimental 98 7.2.2 Results 98 7.2.3 Discussion 102 7.2.4 Conclusions 103 7.3 Effect of ionomer composition on tensile properties 104 7.3.1 Experimental 104 7.3.2 Results 104 7.3.3 Discussion 108 7.3.4 Summary 109 7.4 Effect of ionomer composition on compression set 109 7.4.1 Experimental 109 7.4.2 Results 110 7.4.3 Discussion 112 7.4.4 Conclusion 112 7.5 Effect of ionomer composition on water absorption 112 7.5.1 Introduction 112 7.5.2 Experimental 112 7.5.3 Results 113 7.5.4 Discussion 116 7.5.5 Conclusions 119 7.6 Summary and conclusions 120 7.7 References 122
iv
Chapter 8 Structure-property relations in MAn-g-EPM based ionomers 8.1 Present picture of morphology and structure 123 8.2 Stress relaxation in ionomers by ion hopping 124 8.3 Relation of gel content and ionomer morphology 125 8.4 Relation of melt viscosity and ionomer morphology 125 8.5 Relation of mechanical properties and ionomer morphology 127 8.5.1 Tensile testing 127 8.5.2 Hardness 130 8.6 Relation of compression set and ionomer morphology 131 8.7 Effect of ionomer composition on water absorption 132 8.7.1 Introduction 132 8.7.2 Experimental 132 8.7.3 Results and discussion of SAXS measurements 132 8.8 Summary 135 8.9 Conclusions 138 8.10 References 138
Chapter 9 Balance between mechanical and processing properties of MAn-g-EPM based ionomers
9.1 Introduction 139 9.2 Comparing macroscopic properties of MAn-g-EPM based ionomers
with suitable other systems 140 9.2.1 Overview of comparable systems 140 9.2.2 Processing properties 141 9.2.3 Tensile properties 142 9.2.4 Shore A hardness 143 9.2.5 Compression set 144 9.3 Summary and conclusions 145 9.4 References 146
Technology Assessment 147
Contents
v
Appendices A Determination of the degree of grafting 151 B Side reactions during grafting 155 C Absorbance ratio to determine the degree of neutralisation 163 D Paracrystalline lattice model 165 E Mechanical properties of MAn-g-EPM based ionomers 169 F The rubber elastic state 173
Samenvatting 177
Dankwoord 181
Curriculum Vitae 183

vi
Summary The emergence of thermoplastic elastomers (TPEs) provided a new interesting field in polymer technology. TPEs have most of the performance characteristics of crosslinked elastomers at ambient temperature and processibility of thermoplastic materials at elevated temperatures. The key points to the growth of TPEs are that they can be processed on widely used and inexpensive plastic processing equipment and do not require power extensive vulcanisation. Ionomers are polymeric materials consisting of hydrophobic organic backbone chains onto which a small amount of ionic groups are attached. Ionomers are mainly synthesised by copolymerisation of functionalised monomers with unsaturated monomers. Presently only one ionomer is commercially available, viz. Surlyn®, a semicrystalline thermoplastic based on a random copolymer of ethylene and methacrylic acid, that is partially neutralised to either a zinc or a sodium salt. The highly polar salt groups aggregate to small clusters, that may act as temporary crosslinks at room temperature, but that nevertheless sufficiently soften at elevated temperature to make thermoplastic processing possible. In the past, attempts were made to apply this ionomeric principle to produce thermoplastic elastomers, i.e. to introduce such thermoreversible crosslinks that are active as crosslinks at room temperature but that yet allow thermoplastic processing. However, the starting materials for these ionomers were all polymers of conventionally high molecular weight. This apparently led to poor processibility; large amounts of specific plasticisers (impairing the mechanical properties of the products) were required in order to attain proper processibility. The combination of thermoreversible crosslinks based on ionic interactions and the use of a low molecular weight elastomer is the basis of the present feasibility study towards an ionomeric thermoplastic elastomer. For this purpose, maleic anhydride (MAn) was grafted onto an ethylene-propylene copolymer (EPM) to obtain the ionomer precursor (MAn-g-EPM). The anhydride functionality of the precursor was hydrolysed and subsequently neutralised with a suitable base. The effect of composition of the ionomer precursor (the degree of grafting and the molecular weight of the EPM used), the degree of neutralisation and a type of cation on morphology, mechanical properties and processibility are subject of the study. An additional goal is to obtain detailed information on the morphology of the materials and to relate this to the practical properties mentioned. Ionomer preparation requires two steps: (1) the synthesis or preparation of the ionomer precursor and (2) the neutralisation of the functional groups of the precursor material. In this study the ionomer precursor is obtained by grafting of MAn onto the EPM backbone.
viii Summary
Grafting of MAn can be performed in the polymer melt or in solution. The former route has proven to lead to insufficient degrees of grafting therefore, the latter route was chosen for this study. Optimisation of the solution grafting route resulted in a general recipe that can be used to obtain a whole series of ionomer precursors with various, sufficiently high, degrees of grafting. Moreover, the grafting study revealed that MAn and peroxide are consumed in side-reactions such as grafting of MAn onto the solvent, reducing the grafting efficiency of MAn onto EPM. The second step in ionomer preparation, the neutralisation, can also be performed in the polymer melt or in solution. In this study, the ionomer precursors are neutralised by the solution preparation method, in which the neutralisation reaction has proven to be a stoichiometric one. The detailed knowledge of the morphology of the various ionomer samples may aid in the understanding of the relations between their composition and their properties. It is generally accepted that the ionic groups of the ionomers form small aggregates. These aggregates serve as scattering centres of X-rays. Small Angle X-ray Scattering (SAXS) has proven to be the best characterisation technique for ionomer morphology. Combination of the SAXS data with a suitable morphological model results in information about the size, number and composition of the ionic aggregates. The best morphological model appeared to be a model in which the ionic aggregates are represented as spheres of high electron density. The ionic spheres have a liquid-like order and have a minimum distance of approach as a result of the steric hindrance caused by the hydrocarbon layer attached to and surrounding each ionic aggregate; concomitantly, this layer may be largely immobilised. The positioning of the ionic aggregates is such that in many samples almost a random close packing of spheres is observed, each sphere consisting of an ionic aggregate and its hydrocarbon shell. The number of polar groups participating in one aggregate is fairly large, viz. between 100 and 500, which is far higher than found in literature for other types of ionomers. Variation of the composition of the ionomer precursor (degree of grafting (DG) and molecular weight of the EPM) affects the size, number and composition of these aggregates. It was remarkable to observe that the ionomer precursor material showed already a scattering profile similar to the ionomers. Variation of the degree of grafting showed that there is a critical concentration of grafted MAn above which aggregation of the polar groups occurs for both un-neutralised and neutralised materials. By the combination of SAXS and solid-state NMR it is concluded that the aggregates may be considered as rigid domains in a mobile matrix and that the aggregates contain, besides the ionic groups, also immobilised EPM chain fragments.
Summary ix
The presence of ionic aggregates, acting as (thermally reversible) crosslinks, greatly modifies the properties of the resulting material. Sol-gel analysis indicated that the ionic network of the MAn-g-EPM based ionomers is rather strong. In some cases the network partially remains even at severe extraction conditions. A degree of neutralisation of 50% had to be exceeded in order to achieve a network with considerable gel content, independent of degree of grafting, type of cation or molecular weight of the parent EPM. The study of mechanical properties and melt processibility revealed that the MAn-g-EPM based ionomers exhibit good mechanical properties and acceptable melt viscosities. It was shown that the composition of the ionomer affects these properties. It appeared that one of the most pronounced effects of the neutralisation was the increase in melt viscosity. From capillary rheological measurements it became evident that the ionic interaction is rather strong. The most important mechanical properties such as tensile strength, hardness and compression set were studied as a function of ionomer composition. Below a critical degree of grafting (5wt%) determination of properties was not possible. The materials were too soft and sticky. It was found that an increasing degree of neutralisation and/or degree of grafting resulted in increasing melt viscosity, tensile strength, hardness and decreasing elongation at break and compression set. The results of the different characterisation methods and test methods for mechanical properties revealed that the structure-property relation is rather complex for the ionomers studied. Usually, in the case of covalent networks, properties are related to network density. However, the ionomer network is a complex one and straightforward explanations are not possible, as not only the amount of network junction points, i.e. ionic aggregates, but also the strength of the junction is a function of ionomer composition. In general it was observed that both the strength of the anion-cation interaction in the ionic aggregates and the volume-fraction of ionic aggregates govern the macroscopic properties of the ionomer. Water absorption measurements showed that several ionomers were fairly hydrophilic. As the size of the aggregates increases substantially upon water absorption, it was concluded that the absorbed water resides preferentially in the ionic aggregates. The amount of absorbed water is strongly dependent on the type of cation. Compared to alkaline earth or zinc ionomers, the alkali metal cation neutralised ionomers absorb the largest amounts of water. The zinc ionomer absorb the least amount of water. Positioning of the most promising products from this study between existing, commercial TPEs is difficult because in the brochures many of the most relevant properties are lacking. In the literature, data are found on a number of proposed TPEs with which our products may be compared. Unfortunately, the compression set data of those products are lacking where compression set is an important criterion for long term rubber properties (under load).

x Summary
The literature indicates that invariably the properties of the TPEs are upgraded by blending with additives and/or other polymers. Future product optimisation has to include the variation of base polymer molecular weight next tot the variation of degree of grafting and of degree of neutralisation and, in addition, the effects of reinforcing fillers and other additives.
Glossary Description Unit Chapter Quantities: A absorbance 3,C a absorptivity cm2⋅mol-1 C a constant 5 b thickness of the sample cm C C characteristic ratio 8 c concentration of the substance mol⋅cm-3 C C∞ number of rotationable backbone bonds of the statistical segment 5 Cpol concentration of the polymer solution wt% A CS compression set % 7-9,E DG degree of grafting wt% all DN degree of neutralisation % all EB elongation at break % 7-9,E I observed intensity 4,5 Ie intensity scattered by a single electron 4,5 k Boltzmann constant N·m·K-1·chain-1 8 m number of backbone chain bonds 8 Mc molar mass per elementary chain unit g·mol-1 5,8 Mn number average molecular weight kg⋅mol-1 2,5-9 Mu molar mass of network chains g·mol-1 5 Mw weight average molecular weight kg⋅mol-1 6 mxxx mass of compound xxx g 3 Mxxx molecular weight of compound xxx g·mol-1 2,3 N normality of the TBAOH-solution mol·l-1 A N number of rotationable backbone bonds in an elementary chain unit 5 NAv Avogadro number mol-1 5,8 P(r) probability function 4 q scattering vector Å-1 4,5,8 ( r 2)½ root mean square end-to-end distance of the a random coil 8 Rionic ionic radius Å 5-8 RT retention time min B Rxx radius Å 4,5,8 T temperature °C, K 8 t thickness m 7 t time s 5
xii
t½ half-life time min, hr 2 T1 spin lattice relaxation time ms 5 T2 spin-spin relaxation time ms 5 Tg glass transition temperature °C, K 1,5 Tm melting point °C, K 1 TS tensile strength MPa 7-9,E V sample volume radiated by X-rays Å3 4,5 VMAn volume fraction of grafted MAn 5,8 Vp average sample volume per scattering particle Å3 4,5,8 Vtitrant volume of titrant required for titration ml A Vxx volume of a sphere with radius Rxx Å3 4,5 Z number of statistical segments between crosslinks 5 ∆Hhydr enthalpy of hydration kJ·mol-1 7 Greek symbols: Φ(x) scattering function of a single sphere 4 ϑ number of carboxylate groups per unit volume mol·cm-3 6,8 Ρparticle number of electrons per scattering particle 4 Ω average number of grafted MAn units per EPM chain 8 Ξ number of MAn units per scattering particle 5,8 χ acid content eq·kg-1 3 ε constant in scattering equation (close to 1) 4 ε strain % 7,8 ⋅γ shear rate s-1 7,8
ηapp apparent viscosity Pa·s 7,8 κ normalised number of carboxylate groups per unit volume mol·cm-3 6,8 λ deformation ratio 8 λmax maximum extension ratio 8 ν valency of the metal ion (in case of zinc ν equals 2) 3,5-8 2θ angle between incident and scattered beam 4 θb bond angle ° 8 ρ density of the material g·cm-3 6,8 ρ electron density e-⋅ Å-3 4,5,8 σen engineering stress MPa 7,8 σtrue true stress MPa 8 σxx tensile stress at xx% elongation MPa 7,8 τ pulse spacing time µs 5 τapp apparent shear stress Pa 7,8 ϖ water absorption wt% 7,8

Glossary xiii
Abbreviations: CB carbon black DBPO dibenzoylperoxide EDX energy dispersive X-ray analysis EPDM ethylene-propylene-diene terpolymer EPM ethylene-propylene copolymer FID free induction decay FT-IR Fourier-transform infrared spectroscopy GC-MS gas chromatography – mass spectrometry HDPE high density polyethylene HEPS Hahn-echo pulse sequence IPP isotactic polypropylene MAn maleic anhydride MAn-g-EPM maleated ethylene-propylene copolymer NMR nuclear magnetic resonance phr (weight) parts per hundred (weight parts) rubber PMMA poly(methyl methacrylate) SAXS small angle X-ray scattering SEPS solid echo pulse sequence TBAOH tetrabutylammonium hydroxide TEM transmission electron microscopy TGA thermogravimetric analysis TPE thermoplastic elastomer TPV thermoplastic vulcanisate TxB Trigonox B TxC Trigonox C ZnAc zinc acetate ZnSt zinc stearate

xiv
Chapter 1
Introduction
1.1 General considerations Flexible and elastic materials are part of daily life and are generally referred to as rubbers. The predominant property of this type of materials is the elastic behaviour after deformation in compression or tension. In addition, these materials are characterised by a great toughness and a high resistance to swelling in solvents. These properties are mainly dependent on the type and degree of crosslinking. By the introduction of covalent crosslinks along the polymer chains an elastomer is transformed from a sticky substance into a non-sticky elastic rubber. The formation of a three-dimensional network results in considerable improvement of the mechanical properties, but also result in certain limitations on the processing of the crosslinked elastomer. Beside the variety of processing steps needed to obtain a crosslinked elastomer, it is seldom possible to regenerate uncrosslinked polymers suitable for reprocessing by selective breaking of these crosslinks. These and other considerations have led to attempts to produce materials that effectively crosslink at room temperature after processing but which on (re)heating lose their crosslinks, viz. materials with thermoreversible crosslinks. These materials are called thermoplastic elastomers (TPEs), because at temperatures of use these materials exhibit the properties of a crosslinked elastomer but at elevated temperature they can be processed with the speed and efficiency of thermoplastics. In this introductory chapter possible routes to produce materials with thermoreversible crosslinks are presented. At first, thermoplastic elastomers (TPEs) are discussed (section 1.2). TPEs combine the processibility of a thermoplastic with the functional performance and properties of a conventional crosslinked rubber. These materials are characterised by the presence of thermoreversible interactions along the polymeric chain. These interactions in TPEs are physical rather than chemical in nature and these physical crosslinks anchor a network of flexible molecules in the material. In most cases, TPEs are block copolymers consisting of mobile ‘rubbery’ blocks with a low glass transition temperature (Tg), and rigid ‘glassy’ blocks with a high Tg. The rigid blocks tend to aggregate, and when the temperature is raised above the glass transition temperature of the rigid blocks the glassy domains become
2 Chapter 1
rubbery and processing is possible. On cooling, the glassy domains are reformed and the material, once again, is effectively physically crosslinked. In section 1.3 a different approach to introduce thermoreversible crosslinks, the introduction of ionic crosslinks, is presented. The technique was first developed by DuPont and resulted in a commercially successful product named Surlyn®. This is a semicrystalline plastic, a random copolymer of ethylene and methacrylic acid, that is partially neutralised to a salt. The polar salt groups form clusters in the apolar polymer matrix and act as crosslinks. The ionic crosslinks are strong at ambient temperatures but become weaker on heating. On cooling, crosslinks (re)form and the process may be repeated. This has led to the idea that such an ionic crosslink might potentially be used as a thermoreversible crosslink for an elastomer and in this way lead to a novel class of TPEs. In section 1.4 a proposal is made for a new type of thermoplastic elastomer based on ionomeric thermoreversible crosslinks. This proposal was made because there are good reasons to look for a new type of TPE. The materials that exist to date have some limitations: the low-cost TPEs available are unsaturated polymers possessing limited outdoor durability and the saturated TPEs on the market are of relatively high price. In the past attempts have been made to produce an ionomeric TPE but none of these products were successful. It is possible that it was not realised that a large reduction in polymer molecular weight, as compared with conventional elastomers, is required for such a material to be processible. In section 1.5 the objective and outline of the thesis will be presented.
1.2 Thermoplastic elastomers
1.2.1 General introduction
Thermoplastic elastomers are defined1 as “a family of rubber-like materials that, unlike conventional vulcanised rubber*, can be processed and recycled like thermoplastic materials”. As defined, a thermoplastic elastomer is a special kind of material; at temperatures of use these materials exhibit the properties of a vulcanised rubber while at processing temperatures the mechanism of crosslinking disappears. When the temperature decreases, the crosslinks reappear; the crosslinks are thermoreversible.
________________ * A vulcanised rubber is defined1 as “a material that is capable of recovering from large deformations quickly
and forcibly” and “retracts within 1 min to less than 1.5 times its original length after being stretched at room temperature (18 to 29°C) to twice its length and held for 1 min before release”.
General introduction 3
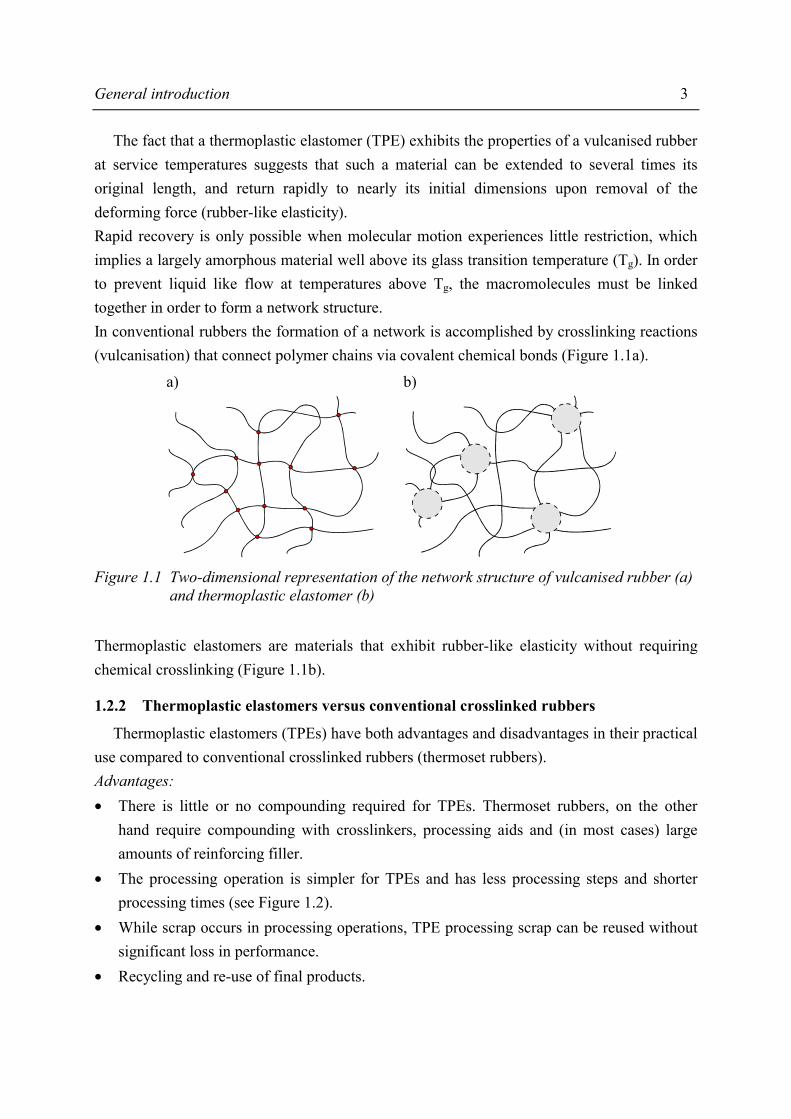
The fact that a thermoplastic elastomer (TPE) exhibits the properties of a vulcanised rubber at service temperatures suggests that such a material can be extended to several times its original length, and return rapidly to nearly its initial dimensions upon removal of the deforming force (rubber-like elasticity). Rapid recovery is only possible when molecular motion experiences little restriction, which implies a largely amorphous material well above its glass transition temperature (Tg). In order to prevent liquid like flow at temperatures above Tg, the macromolecules must be linked together in order to form a network structure. In conventional rubbers the formation of a network is accomplished by crosslinking reactions (vulcanisation) that connect polymer chains via covalent chemical bonds (Figure 1.1a).
a) b)
Figure 1.1 Two-dimensional representation of the network structure of vulcanised rubber (a)
and thermoplastic elastomer (b) Thermoplastic elastomers are materials that exhibit rubber-like elasticity without requiring chemical crosslinking (Figure 1.1b).
1.2.2 Thermoplastic elastomers versus conventional crosslinked rubbers
Thermoplastic elastomers (TPEs) have both advantages and disadvantages in their practical use compared to conventional crosslinked rubbers (thermoset rubbers). Advantages: • There is little or no compounding required for TPEs. Thermoset rubbers, on the other
hand require compounding with crosslinkers, processing aids and (in most cases) large amounts of reinforcing filler.
• The processing operation is simpler for TPEs and has less processing steps and shorter processing times (see Figure 1.2).
• While scrap occurs in processing operations, TPE processing scrap can be reused without significant loss in performance.
• Recycling and re-use of final products.

4 Chapter 1
Disadvantages: • TPEs melt or soften at a specific temperature above which they lose their rubber
properties. A relatively short exposure at these temperatures will result in a permanent deformation. Brief exposure of thermoset rubbers to high temperatures will probably not result in a high degree of deformation.
• TPEs embrace new technology, unfamiliar to conventional rubber processors. • TPEs require processing equipment unfamiliar to the thermoset rubber producer. a) Thermoplastic elastomer
b) Thermoset rubber
Figure 1.2 Processing scheme of thermoplastic elastomers and of thermoset rubbers
1.2.3 Types of TPEs
Thermoplastic elastomers always consist of a ‘flexible’ (continuous) phase and a ‘rigid’ (dispersed) phase and can be divided into two major groups: the block copolymers and the polymer blends, schematically outlined in Table 1.1.
Table 1.1 Types of thermoplastic elastomers
Block copolymers Blends ABA triblocks Non-vulcanised
• Styrene-diene (TPE-S)
• Polyolefin based (TPE-O)
(AB)n multiblocks Vulcanised (TPE-V) • Polyurethane based (TPE-U) • Polyester based (TPE-E) • Polyamide based (TPE-A)
• Polypropylene based
General introduction 5
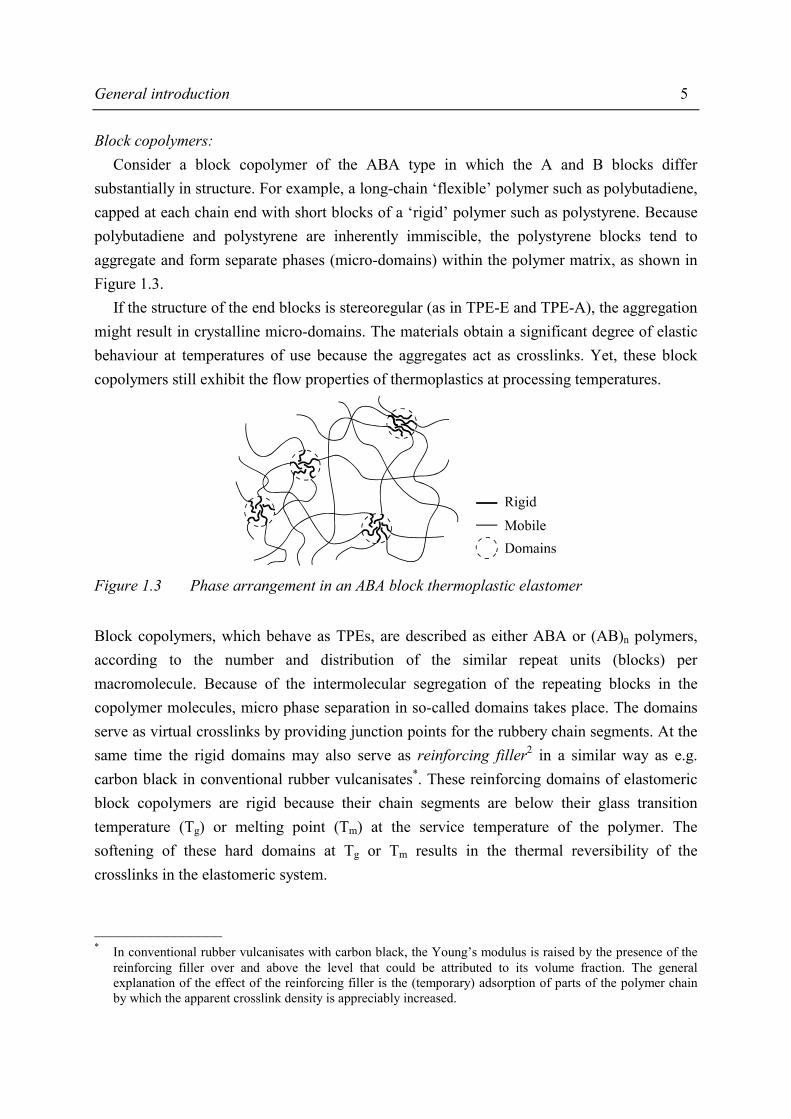
Block copolymers: Consider a block copolymer of the ABA type in which the A and B blocks differ substantially in structure. For example, a long-chain ‘flexible’ polymer such as polybutadiene, capped at each chain end with short blocks of a ‘rigid’ polymer such as polystyrene. Because polybutadiene and polystyrene are inherently immiscible, the polystyrene blocks tend to aggregate and form separate phases (micro-domains) within the polymer matrix, as shown in Figure 1.3. If the structure of the end blocks is stereoregular (as in TPE-E and TPE-A), the aggregation might result in crystalline micro-domains. The materials obtain a significant degree of elastic behaviour at temperatures of use because the aggregates act as crosslinks. Yet, these block copolymers still exhibit the flow properties of thermoplastics at processing temperatures.
Figure 1.3 Phase arrangement in an ABA block thermoplastic elastomer Block copolymers, which behave as TPEs, are described as either ABA or (AB)n polymers, according to the number and distribution of the similar repeat units (blocks) per macromolecule. Because of the intermolecular segregation of the repeating blocks in the copolymer molecules, micro phase separation in so-called domains takes place. The domains serve as virtual crosslinks by providing junction points for the rubbery chain segments. At the same time the rigid domains may also serve as reinforcing filler2 in a similar way as e.g. carbon black in conventional rubber vulcanisates*. These reinforcing domains of elastomeric block copolymers are rigid because their chain segments are below their glass transition temperature (Tg) or melting point (Tm) at the service temperature of the polymer. The softening of these hard domains at Tg or Tm results in the thermal reversibility of the crosslinks in the elastomeric system.
________________ * In conventional rubber vulcanisates with carbon black, the Young’s modulus is raised by the presence of the
reinforcing filler over and above the level that could be attributed to its volume fraction. The general explanation of the effect of the reinforcing filler is the (temporary) adsorption of parts of the polymer chain by which the apparent crosslink density is appreciably increased.
6 Chapter 1
Blends: Apart from the TPEs based on segregated block copolymers, there is another class of TPEs that is based on a blend of semicrystalline thermoplastic (primarily polypropylene) and an amorphous elastomer. Usually, the ideal elastomer-thermoplastic blend comprises very fine elastomer particles dispersed in a relatively small amount of thermoplastic. The elastomer particles should be vulcanised to obtain elasticity. The rubber-like elasticity of these blends is thought to be caused by physical interaction of the vulcanised rubber particles with one another, forming kind of ‘network’ of vulcanised elastomer. On the other hand, the interaction between the soft particles should be sufficiently weak to permit the TPE to become fluid and processible above the Tm of the thermoplastic.
1.3 Ionomers
1.3.1 Definition
Historically, the word ionomer was applied to olefin-based polymers containing a relatively small percentage of ionic groups3. Over the years the definition of an ionomer has been broadened to include other parent polymers. Overall, the word ionomer will undoubtedly be associated with polymers which contain up to about 15 mole percent of ionic groups pendant to a predominantly hydrocarbon polymer chain. These pendant groups result in ionic interactions, having a significant effect on the mechanical properties and rheological behaviour of the polymer.
1.3.2 Historical aspects
Although the word ionomer was coined for the first time in 19653, materials of this type had been synthesised and investigated long before. Carboxylated elastomers based on butadiene and acrylic acid were vulcanised with sulphur using zinc oxide as an accelerator. Ionic crosslinks were apparently not recognised at that time. However, not long hereafter, it was noted that the incorporation of carboxyl groups into elastomers exerts a major influence on their properties4. In the 1950s Goodrich introduced an elastomer based on ionic interactions, a butadiene-acrylonitrile-acrylic acid terpolymer. Brown5 described how these materials could be suitably neutralised with the oxide or salt of a polyvalent metal. In the early 1950s DuPont introduced a second family of elastomers which possessed a substantial level of ionic interaction. These materials were based on sulphonated structures that were obtained from chlorinated polyethylene6. These materials were cured with various metal oxides and exhibited a combination of ionic and covalent crosslinks.
General introduction 7
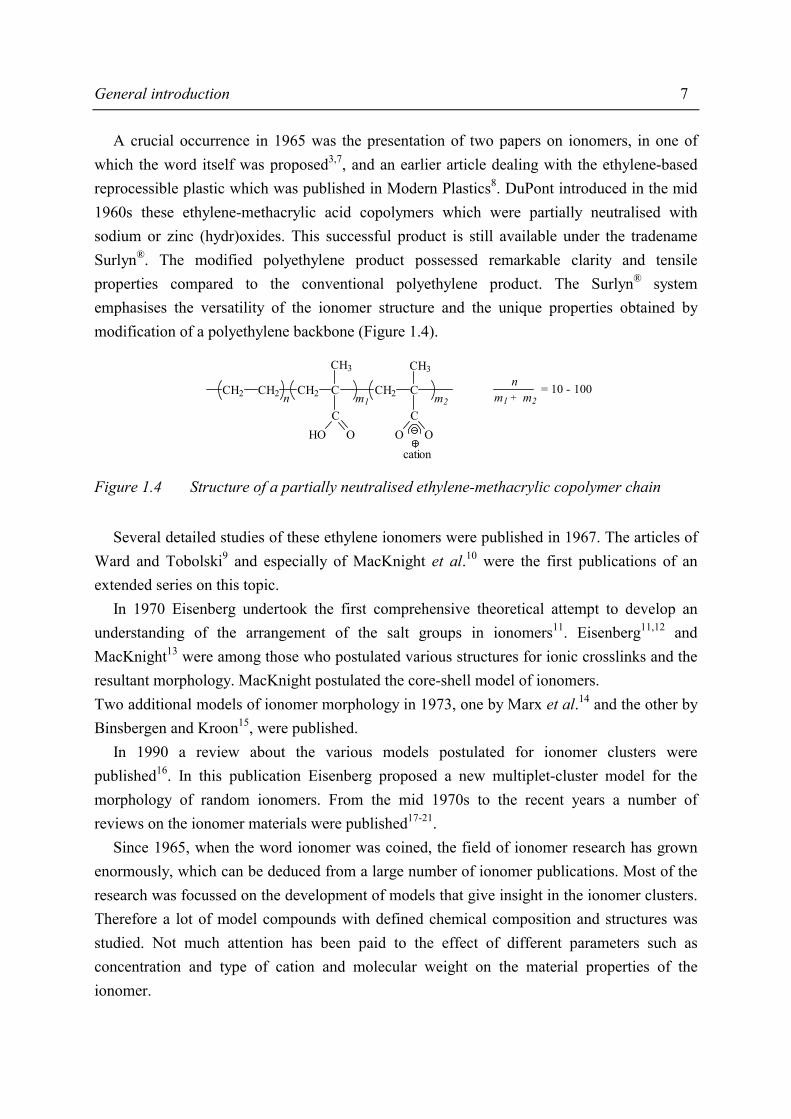
A crucial occurrence in 1965 was the presentation of two papers on ionomers, in one of which the word itself was proposed3,7, and an earlier article dealing with the ethylene-based reprocessible plastic which was published in Modern Plastics8. DuPont introduced in the mid 1960s these ethylene-methacrylic acid copolymers which were partially neutralised with sodium or zinc (hydr)oxides. This successful product is still available under the tradename Surlyn®. The modified polyethylene product possessed remarkable clarity and tensile properties compared to the conventional polyethylene product. The Surlyn® system emphasises the versatility of the ionomer structure and the unique properties obtained by modification of a polyethylene backbone (Figure 1.4).
CH3
C
CHO O
CH2
CO O
C
CH3
CH2CH2CH2 n m1 m2
nm1 m2+
= 10 - 100
cation
Figure 1.4 Structure of a partially neutralised ethylene-methacrylic copolymer chain Several detailed studies of these ethylene ionomers were published in 1967. The articles of Ward and Tobolski9 and especially of MacKnight et al.10 were the first publications of an extended series on this topic. In 1970 Eisenberg undertook the first comprehensive theoretical attempt to develop an understanding of the arrangement of the salt groups in ionomers11. Eisenberg11,12 and MacKnight13 were among those who postulated various structures for ionic crosslinks and the resultant morphology. MacKnight postulated the core-shell model of ionomers. Two additional models of ionomer morphology in 1973, one by Marx et al.14 and the other by Binsbergen and Kroon15, were published. In 1990 a review about the various models postulated for ionomer clusters were published16. In this publication Eisenberg proposed a new multiplet-cluster model for the morphology of random ionomers. From the mid 1970s to the recent years a number of reviews on the ionomer materials were published17-21. Since 1965, when the word ionomer was coined, the field of ionomer research has grown enormously, which can be deduced from a large number of ionomer publications. Most of the research was focussed on the development of models that give insight in the ionomer clusters. Therefore a lot of model compounds with defined chemical composition and structures was studied. Not much attention has been paid to the effect of different parameters such as concentration and type of cation and molecular weight on the material properties of the ionomer.
8 Chapter 1
1.3.3 EPDM based ionomers
Metal oxide neutralisation of the acid groups in functionalised polymers, like sulphonated and maleated ethylene-propylene terpolymer (EPDM) rubbers, results in ionic crosslinks or domains which are thermoreversible22,23. Ionic rubbers based on sulphonated EPDM have been studied by several scientists22,24-27. Maleated EPDM rubber, on the other hand, has been mostly used as component in reactive blending or for the impact modification of nylon-66 or polybutylene terephthalate28. Nowhere the impact of ionic interaction is more evident than in the flow behaviour of ionomers. The introduction of relatively low levels of metal sulphonate groups into EPDM yields ionomers with improved physical properties and high melt viscosities24,26, which is attributed to the very strong intermolecular associations and relatively high stability of metal sulphonate groups29. A number of studies has been published in literature dealing with carboxylate ionomers17,19,30 and sulphonate ionomers31,32. Very few studies have attempted to make a direct comparison between the ionomers possessing an identical backbone and ion content but different functionalised acid groups. The best examples are the studies of Lundberg and Makowski33, Visser and Cooper34 and Clas and Eisenberg35. In the study of Lundberg and Makowski, comparing sodium carboxylated and sodium sulphonated polystyrene ionomers, it was shown that the sulphonated ionomers associate stronger than the analogous carboxylate systems. This stronger association has been attributed to the larger polarisation of the sulphonate groups compared to the carboxyl groups. The melt viscosities of the sulphonate ionomers at a given level of functionality and temperature are about 2-3 orders of magnitude higher than the carboxylated analogues. Additionally, another limitation of sulphonic acid based ionomers is, if these groups are not quantitatively neutralised, that they may thermally degrade at elevated temperatures and cause corrosion in processing equipment.
1.4 Proposal to use the ionomeric principle for thermoplastic elastomers As already discussed, the presence of a low level of salt groups in ionomers has a dramatic effect on the polymer properties. Unlike homogeneous polymer systems, the pendant ionic groups interact to form ion-rich aggregates in the apolar matrix, and affect the polymer properties dramatically3,36. On increasing temperature the mobility of these ion-rich aggregates increases and the material becomes processible. When the temperature decreases the crosslinks reappear. The crosslinks are thermoreversible.
General introduction 9
So, combining the effect of the thermoreversible crosslink based on ionic interactions and the use of a low-cost elastomer, the concept of an ionomeric thermoplastic elastomer is proposed. In the past, attempts have been made to produce ionomeric elastomers but these materials had a high melt viscosity and needed additives (zinc stearate) when processed26,37-39. In all cases the ionomer precursor was an elastomer of conventional (high) molecular weight. The processibility of the sulphonated elastomers showed that the sulphonate groups result in stronger associations and therefore higher melt viscosities than in carboxylated elastomers, therefore the use of a carboxylated elastomer is preferred. Additionally, sulphonated elastomers require complete neutralisation because of the corrosivity of the free sulphonic acid groups in the partially neutralised ionomer. For carboxylated elastomers partial neutralisation is allowed, the degree of neutralisation parameter can therefore be used in product optimisation. In this research a new approach was used. In this new approach, contrary to previous work, a low molecular weight polyolefin is modified in order to attain acceptable processing viscosity after carboxylation and (partial) neutralisation. The use of an ethylene-propylene copolymer as base polymer results in a saturated thermoplastic elastomer. Compared to commercially available saturated thermoplastic elastomers, the new material as proposed above may be of modest manufacturing cost. The low molecular weight, the carboxylic acid functionality and the degree of neutralisation are parameters that are to be used to optimise the material properties of the ionomer.
1.5 Objective and outline of the thesis The purpose of this study is to investigate whether it is possible to obtain an ionomeric thermoplastic elastomer starting from a functionalised ethylene-propylene copolymer. Another objective is to obtain a proper understanding of the effect of the different parameters on the product performance. The different parameters studied are the composition of the ionomer precursor (the degree of grafting and the molecular weight of the polyolefin used), the degree of neutralisation and the variation of the cation used to neutralise the ionomer precursor. The route to obtain a functionalised polymer comprises the grafting of maleic anhydride (MAn) onto the ethylene-propylene copolymer (EPM) backbone. The grafting procedure provides a relatively easy route to obtain an ionomer precursor based on a commodity polymer such as ethylene-propylene copolymers. MAn is a suitable monomer to graft onto an EPM because it has a low tendency to homopolymerise.

10 Chapter 1
When using a maleated ethylene-propylene copolymer (MAn-g-EPM) as ionomer precursor, an ionomer based on carboxyl groups is produced. Carboxylic-based functionality implies that a plasticiser (and thus extra compounding steps in processing the rubber) is not necessary. First, the synthesis of the functionalised ethylene-propylene copolymer will be described in Chapter 2. In this chapter a low molecular weight ethylene-propylene copolymer (EPM) will be functionalised by grafting maleic anhydride (MAn) onto the polymer backbone. By systematic variation of the important reaction parameters such as peroxide, EPM- and MAn- concentration, the efficiency of the grafting reaction will be investigated. In this way the grafting reaction can be controlled and optimised for a specific ionomer. In Chapter 3 the preparation of the MAn-g-EPM based ionomers will be described. The resulting ionomers will be characterised using different techniques to study the reaction during ionomer synthesis and to verify the recipe used. To characterise the morphology of ionomers, Small Angle X-ray Scattering (SAXS) has proven to be the most direct characterisation technique. SAXS data are commonly used in combination with a suitable model to obtain morphological information. In Chapter 4 some morphological models will be evaluated and discussed. From these models a suitable one was chosen and used to interpret the SAXS data of the MAn-g-EPM based ionomers. In Chapter 5 the morphology of the ionomer will be elucidated. Using a morphological model that was used to interpret the SAXS data, information about the size, number and composition of the ionic aggregates will be obtained. Solid state Nuclear Magnetic Resonance (NMR) will be used to obtain information about mobility differences in the ionomer network. Solid state NMR will also be used to validate the morphological SAXS model. Finally, Transmission Electron Microscopy (TEM) will be used to visualise the morphology of the MAn-g-EPM based ionomers. Chapter 6 is concerned with the gel content of the ionomers and in Chapter 7 the macroscopic properties of the ionomers will be discussed. The effect of ionomer composition on a variety of properties such as melt viscosity, hardness and compression set will be discussed. The relation between morphology and the macroscopic properties of the MAn-g-EPM based ionomers will be discussed in Chapter 8.
General introduction 11
In Chapter 9, the balance between mechanical and processing properties will be made and the MAn-g-EPM based ionomers will be compared with existing thermoplastic materials. This comparison will give insight in whether the new ionomer thermoplastic elastomer may compete with commercially available products. Finally, in the Technology Assessment, the most important results will be summarised and suggestions for future investigations will be presented.
1.6 References 1. According to ASTM 1566-93a (1993) 2. Morton, M. and Healy, J.C., Appl. Polym. Symp. 7, 155 (1968) 3. Rees, R.W. and Vaughan, D.J., Polym. Prepr. 6, 287 (1965) 4. Bacon, R.G.R. and Farmer, E.H., Rubber Chem. Technol. 12, 200 (1939) 5. Brown, H.P. and Duke, N.G., Rubber World 130, 784 (1954) 6. Warner, R.R., Rubber Age 71, 205 (1952) 7. Rees, R.W. and Vaughan, D.J., Polym. Prepr. 6, 296 (1965) 8. Rees, R.W., Modern Plastics 42, 209 (1964) 9. Ward, T.C. and Tobolski, A.V., J. Appl. Polym. Sci. 11, 2403 (1967) 10. MacKnight, W.J., McKenna, L.W. and Read, B.E., J. Appl. Phys. 38, 4208 (1967) 11. Eisenberg, A., Macromolecules 3, 147 (1970) 12. Eisenberg, A. and Navratil, M., Macromolecules 6, 604 (1973) 13. MacKnight, W.J., Taggart, W.P. and Stein, R.S., J. Polym. Sci.: Symp. 45, 113 (1974) 14. Marx, L., Claufield, D.F. and Cooper, S.L., Macromolecules 6, 344 (1973) 15. Binsbergen, F.L. and Kroon, G.F., Macromolecules 6, 145 (1973) 16. Eisenberg, A., Hird, B. and Moore, R.B., Macromolecules 23, 4098 (1990) 17. Ionic Polymers, edited by Holliday, L., London: Applied Science Publishers, 1975 18. Ions in Polymers, edited by Eisenberg, A., Washington: American Chemical Society: Advances
in Chemistry 187, 1980 19. Developments in Ionic Polymers, edited by Wilson, A.D. and Prosser, H.J., London: Elsevier
Applied Science Publishers, 1986 20. Ionomers: Characterizations, Theory, and Applications, edited by Schlick, S., Boca Raton:
CRC Press Inc., 1996 21. Ionomers: Synthesis, Structure, Properties and Applications, edited by Tant, M.R., Mauritz,
K.A. and Wilkes, G.L., London: Chapman & Hall, 1997 22. Agarwal, P.K. and Lundberg, R.D., Macromolecules 17, 1918 (1984) 23. Agarwal, P.K., Makowski, H.S. and Lundberg, R.D., Macromolecules 13, 1679 (1980) 24. MacKnight, W.J. and Lundberg, R.D., Rubber Chem. Technol. 57, 652 (1984) 25. Agarwal, P.K. and Lundberg, R.D., Macromolecules 17, 1928 (1984) 26. Paeglis, A.U. and O'Shea, F.X., Rubber Chem. Technol. 61, 223 (1988) 27. Oostenbrink, A.J. and Gaymans, R.J. Polymer 33, 3086 (1992) 28. Greco, R., Malinconico, M., Martuscelli, E., Ragosta, G.and Scarinzi, G., Polymer 28, 1185
(1987) 29. Weiss, R.A., Fitzgerald, J.J. and Kim, D., Macromolecules 24, 1064 (1991) 30. Eisenberg, A. and King, M., Ion-Containing Polymers, New York: Academic Press, 1977 31. Fitzgerald, J.J. and Weiss, R.A., J, Macromol. Sci. Rev. Macromol. Chem. Phys. C28, 99 (1988)

12 Chapter 1
32. Bagrodia, S.R., Wilkes, G.L. and Kennedy, J.P., J. Appl. Polym. Sci. 30, 2179 (1985) 33. Lundberg R.D. and Makowski, H.S., in Ions in Polymers, edited by Eisenberg, A., 1980,
Chapter 2 34. Visser, S.A. and Cooper, S.L., Macromolecules, 24, 2576 (1991) 35. Clas, S.-D. and Eisenberg, A., J. Polym. Sci.: Part B: Polym. Phys. 24, 2767 (1986) 36. MacKnight, W.J. and Earnest, T.R., J. Polym. Sci. – Macromol. Rev. 16, 41 (1981) 37. Makowski, H.S. and Lundberg, R.D., Polym. Prepr. 19, 304 (1978) 38. Kurian, T., Khastgir, D., De, P.P., Tripathy, D.K. and De, S.K., Rubber World 41 (1995) 39. Datta, S., De, S.K., Kontos, E.G. and Wefer, J.M., J. Appl. Polym. Sci. 61, 177 (1996)

Chapter 2
Grafting of Maleic Anhydride
2.1 Introduction As described in Chapter 1, one of the important parameters determining ionomer properties is the degree of grafting. In this chapter, the grafting of maleic anhydride onto an ethylene-propylene copolymer is studied. These maleated products (MAn-g-EPM) will be used for the synthesis of ionomers. In literature several procedures for the grafting of maleic anhydride (MAn) in the presence of an organic peroxide are described. These graft reactions describe functionalisation in the polymer melt1-5, in the solid state6,7 or in solution3,8. A few less conventional methods were also reported, viz., the ene reaction process9 and a melt process comprising the dissolution of maleic anhydride and peroxide in a solvent10 or the use of additives to prevent some side reactions10,11. When focussing on polyolefins, systems such as high-density polyethylene (HDPE)12,13, ethylene-propylene copolymers (EPM)14 and isotactic polypropylene (iPP)15 have been studied extensively. Furthermore, many papers concerning maleation of ethylene-propylene copolymer or ethylene-propylene-diene terpolymer (EPDM) have been published describing the grafting in solution14,16 or in the polymer melt17-19. From these studies it became obvious that melt (or bulk) modification results in a rather low content of bound MAn in the products, usually below 1.5wt%. The limited solubility of MAn in the rubber and the high volatility of MAn at elevated temperatures cause this low content of grafted MAn. Moreover, grafting reactions in the bulk state are diffusion controlled due to the relatively high viscosities of the molten polymers. However, a grafting reaction in a solvent eliminates the diffusion-controlled step and usually gives a higher maleation efficiency20. Functionalisation in solvent media, initiated by means of organic peroxides, is reported by a number of authors8,14,16,21-23. Cimmino et al.16 proved that grafting of maleic anhydride onto EPM in a xylene solution is a suitable route to obtain materials with high amounts of grafted maleic anhydride (up to 7wt%).
14 Chapter 2
Modification of polyolefins in the polymer melt is preferred when low amounts of grafted MAn will suffice. The disadvantage of the solution modification is the purification step (removal of the solvent), but when higher amounts of grafted MAn are needed, the modification of the polymer in solution will be preferred. As described in Chapter 1, high amounts of polar groups are necessary for ionomer synthesis; therefore the grafting of MAn onto ethylene-propylene copolymers in solution has been studied. In this chapter the experimental procedure on grafting of maleic anhydride onto a low molecular ethylene-propylene copolymer in a xylene medium is described. Due to ambiguity in literature, a systematic variation of the concentration of the different ingredients in the reaction mixture has been studied. An optimised recipe will provide a range of materials that can be used for ionomer synthesis. The amount of grafted MAn, the degree of grafting, is defined as the weight percentage of maleic anhydride (MAn) grafted onto the polymer backbone. Some characterisation techniques to determine the MAn grafting degree (DG) on polyolefins and styrenics have been reported. These techniques are essentially Fourier-transform infrared spectroscopy (FT-IR)1,24-26 and titration1,2,13,26,27. In this study a combination of the two techniques has been used. The occurrence of a grafting reaction was checked by means of infrared spectroscopy (the carbonyl stretching vibration absorption peaks are situated at about 1785 and 1865 cm-1). Quantitative determination of the grafted functional groups (degree of grafting) was performed by means of potentiometric titration.
2.2 Grafting of Maleic Anhydride onto polyolefins in solution
2.2.1 Materials
Only one ethylene-propylene copolymer in the desired low molecular weight range was at our disposal in ample quantities. Therefore this polymer was used in the grafting optimisation studies. The polymer used was a random ethylene-propylene copolymer (45 wt% ethylene, 55 wt% propylene, Mn 11 kg·mol-1). Unfortunately other random ethylene-propylene copolymers of relatively low molecular weight were available in small quantities only. Maleic anhydride (MAn, Merck, >99%), which was used as received, was grafted onto the polymer backbone using free radical initiators. Free radical initiators tert-butylperoxybenzoate (Trigonox C (TxC), Akzo Nobel) and di-tert-butylperoxide (Trigonox B (TxB), Akzo Nobel) were used as received. The free radical initiator dibenzoylperoxide (Lucidol (DBPO), Akzo Nobel) was recrystallised from ethanol, in order to remove water, and dried in a desiccator over silica gel at 4°C.
Grafting of Maleic Anhydride 15
At the end of the reaction an antioxidant, octadecyl-3-(3,5-di-tert-butyl-4-hydroxyphenyl) propionate (Irganox 1076, Ciba Geigy), was added to stabilise the grafted products during storage. As in other studies12-16, a mixture of xylene isomers (o-,m- and p-xylene, supplied by Aldrich) was used as solvent medium.
2.2.2 Grafting procedure
In a double walled glass reactor equipped with N2 inlet, septum and helical impeller, the copolymer was dissolved at the reaction temperature (130°C). When dissolution of the polymer had been completed, maleic anhydride was added to the solution. After all maleic anhydride had been dissolved, the peroxide was added via the septum*. The antioxidant was added after a reaction time of at least 5 half-life times of the peroxide used. The amount of antioxidant was always 0.10wt% (based on the polymer weight) and was allowed to react for 15 min. Next, the mixture was poured into acetone† (using 1 l acetone for a 150 ml reaction mixture) under vigorous stirring to remove unreacted maleic anhydride. Acetone is a good solvent for maleic anhydride and it is a non-solvent for the polymer. The precipitate was washed at least 3 times with smaller portions of acetone (150 ml aliquots) to remove all traces of ‘free’ maleic anhydride, peroxide, and peroxide decomposition products. Finally, the product was dried overnight in a vacuum oven at 80°C with a nitrogen flush.
2.2.3 Analysis
The amount of grafted maleic anhydride was determined by potentiometric titration as follows: the maleated product was dried at 150°C for 1 hour under vacuum and nitrogen flush to close hydrolysed anhydride rings. Subsequently, a sample of the dried product was dissolved in a toluene/isopropanol mixture (9/1 v/v). A 0.03N solution of tetrabutylammonium hydroxide in isopropanol was used as titrant. The potentiometric titration was performed by a Methrom E670 Titroprocessor. A more detailed prescription of the actual titration procedure is presented in Appendix A.
________________ * In case of dibenzoylperoxide (solid at room temperature) the peroxide was quickly added to the reaction
mixture as a 4 wt% solution in xylene. Di-tert-butylperoxide and tert-butylperoxybenzoate are both liquid peroxides and were added pure.
† The acetone used for the precipitation and subsequent washing steps contained about 0.05 wt% Irganox 1076 to prevent the loss of antioxidant in the precipitated product.
16 Chapter 2
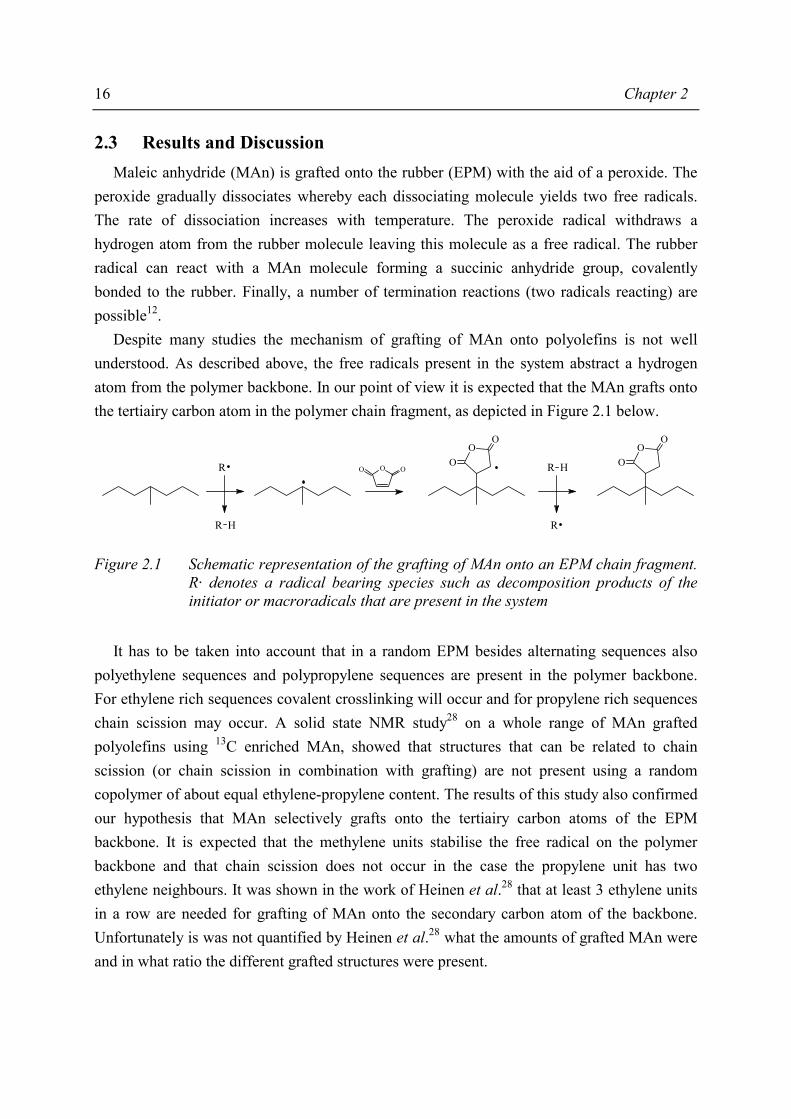
2.3 Results and Discussion Maleic anhydride (MAn) is grafted onto the rubber (EPM) with the aid of a peroxide. The peroxide gradually dissociates whereby each dissociating molecule yields two free radicals. The rate of dissociation increases with temperature. The peroxide radical withdraws a hydrogen atom from the rubber molecule leaving this molecule as a free radical. The rubber radical can react with a MAn molecule forming a succinic anhydride group, covalently bonded to the rubber. Finally, a number of termination reactions (two radicals reacting) are possible12. Despite many studies the mechanism of grafting of MAn onto polyolefins is not well understood. As described above, the free radicals present in the system abstract a hydrogen atom from the polymer backbone. In our point of view it is expected that the MAn grafts onto the tertiairy carbon atom in the polymer chain fragment, as depicted in Figure 2.1 below.
O OOR
R H
R H
R
O
OO
O
OO
Figure 2.1 Schematic representation of the grafting of MAn onto an EPM chain fragment. R· denotes a radical bearing species such as decomposition products of the initiator or macroradicals that are present in the system
It has to be taken into account that in a random EPM besides alternating sequences also polyethylene sequences and polypropylene sequences are present in the polymer backbone. For ethylene rich sequences covalent crosslinking will occur and for propylene rich sequences chain scission may occur. A solid state NMR study28 on a whole range of MAn grafted polyolefins using 13C enriched MAn, showed that structures that can be related to chain scission (or chain scission in combination with grafting) are not present using a random copolymer of about equal ethylene-propylene content. The results of this study also confirmed our hypothesis that MAn selectively grafts onto the tertiairy carbon atoms of the EPM backbone. It is expected that the methylene units stabilise the free radical on the polymer backbone and that chain scission does not occur in the case the propylene unit has two ethylene neighbours. It was shown in the work of Heinen et al.28 that at least 3 ethylene units in a row are needed for grafting of MAn onto the secondary carbon atom of the backbone. Unfortunately is was not quantified by Heinen et al.28 what the amounts of grafted MAn were and in what ratio the different grafted structures were present.
Grafting of Maleic Anhydride 17
In order to optimise the conditions for grafting of maleic anhydride the concentration and type of peroxide, the concentration of maleic anhydride, the concentration of polymer and the reaction time were varied.
2.3.1 Effect of type of peroxide
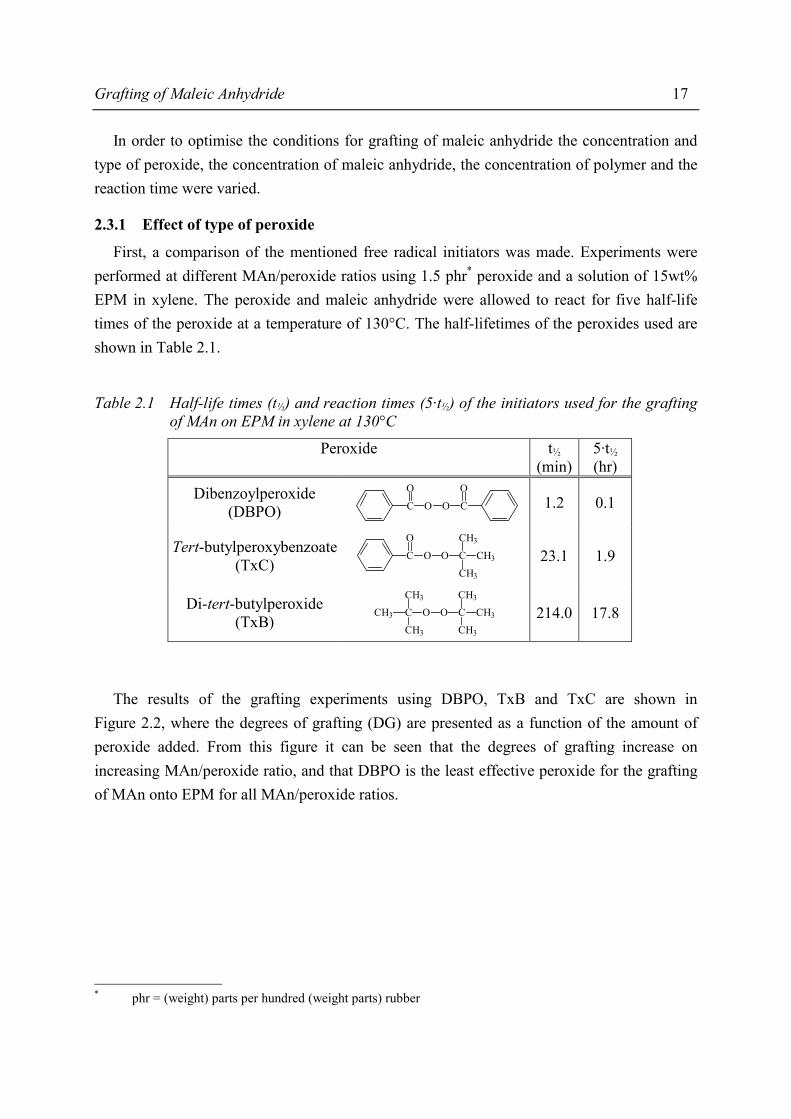
First, a comparison of the mentioned free radical initiators was made. Experiments were performed at different MAn/peroxide ratios using 1.5 phr* peroxide and a solution of 15wt% EPM in xylene. The peroxide and maleic anhydride were allowed to react for five half-life times of the peroxide at a temperature of 130°C. The half-lifetimes of the peroxides used are shown in Table 2.1.
Table 2.1 Half-life times (t½) and reaction times (5·t½) of the initiators used for the grafting of MAn on EPM in xylene at 130°C
Peroxide t½ (min)
5·t½ (hr)
Dibenzoylperoxide (DBPO)
C O O
O O
C
1.2 0.1
Tert-butylperoxybenzoate(TxC)
C O O
O
C
CH3
CH3
CH3
23.1 1.9
Di-tert-butylperoxide (TxB)
C O O C
CH3
CH3
CH3
CH3
CH3
CH3
214.0 17.8
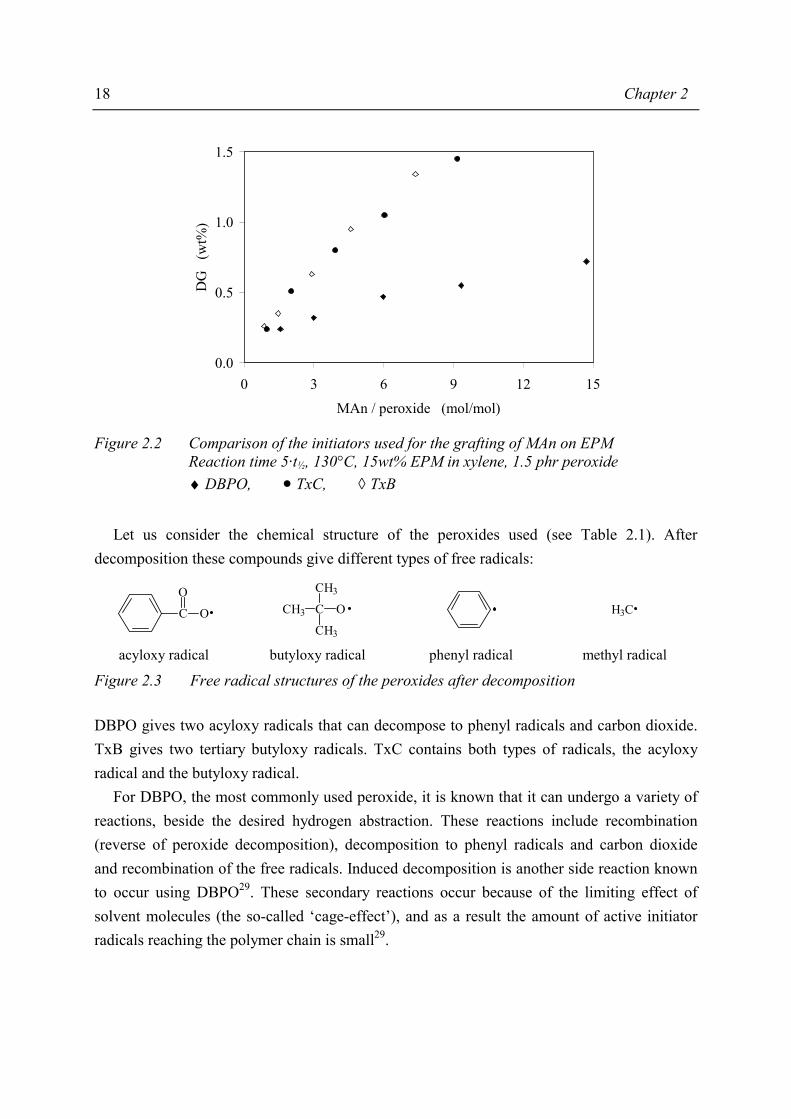
The results of the grafting experiments using DBPO, TxB and TxC are shown in Figure 2.2, where the degrees of grafting (DG) are presented as a function of the amount of peroxide added. From this figure it can be seen that the degrees of grafting increase on increasing MAn/peroxide ratio, and that DBPO is the least effective peroxide for the grafting of MAn onto EPM for all MAn/peroxide ratios.
________________ * phr = (weight) parts per hundred (weight parts) rubber
18 Chapter 2
0.0
0.5
1.0
1.5
0 3 6 9 12 15
MAn / peroxide (mol/mol)
DG
(w
t%)
Figure 2.2 Comparison of the initiators used for the grafting of MAn on EPM
Reaction time 5·t½, 130°C, 15wt% EPM in xylene, 1.5 phr peroxide ♦ DBPO, • TxC, ◊ TxB
Let us consider the chemical structure of the peroxides used (see Table 2.1). After decomposition these compounds give different types of free radicals:
C
O
O
OC
CH3
CH3
CH3 H3C
acyloxy radical butyloxy radical phenyl radical methyl radical
Figure 2.3 Free radical structures of the peroxides after decomposition DBPO gives two acyloxy radicals that can decompose to phenyl radicals and carbon dioxide. TxB gives two tertiary butyloxy radicals. TxC contains both types of radicals, the acyloxy radical and the butyloxy radical. For DBPO, the most commonly used peroxide, it is known that it can undergo a variety of reactions, beside the desired hydrogen abstraction. These reactions include recombination (reverse of peroxide decomposition), decomposition to phenyl radicals and carbon dioxide and recombination of the free radicals. Induced decomposition is another side reaction known to occur using DBPO29. These secondary reactions occur because of the limiting effect of solvent molecules (the so-called ‘cage-effect’), and as a result the amount of active initiator radicals reaching the polymer chain is small29.
Grafting of Maleic Anhydride 19
In the case of the symmetric peroxides, DBPO and TxB, the reactivity of the two radicals produced is equal. As can be seen in Figure 2.2, the degrees of grafting using TxB are comparable with the results obtained using TxC. The degrees of grafting using these two peroxides are comparable, probably due to the high reactivity of the tertiary butyloxy radicals. The most important difference between TxB and TxC is the reaction time due to the different t½ of the peroxides used. As a result, from these experiments TxC was chosen as radical initiator for the grafting reaction, considering its half-life time and the resulting degree of grafting.
2.3.2 Effect of peroxide concentration
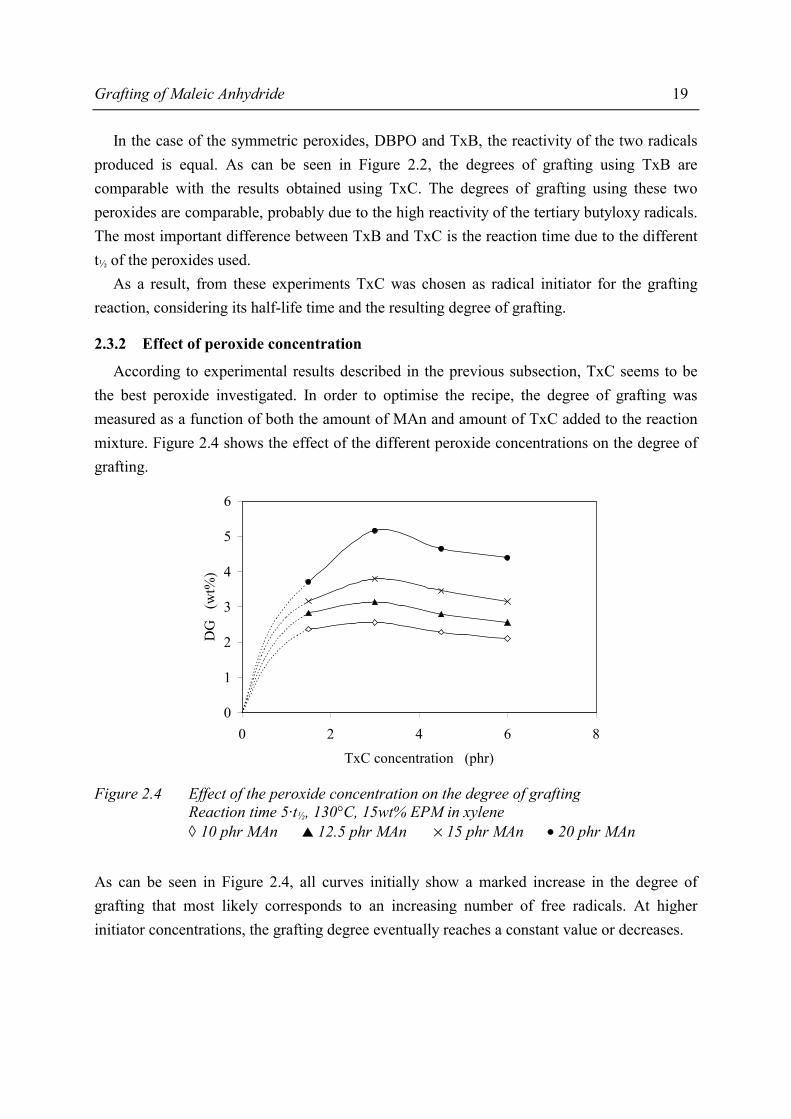
According to experimental results described in the previous subsection, TxC seems to be the best peroxide investigated. In order to optimise the recipe, the degree of grafting was measured as a function of both the amount of MAn and amount of TxC added to the reaction mixture. Figure 2.4 shows the effect of the different peroxide concentrations on the degree of grafting.
0
1
2
3
4
5
6
0 2 4 6 8
TxC concentration (phr)
DG
(w
t%)
Figure 2.4 Effect of the peroxide concentration on the degree of grafting
Reaction time 5·t½, 130°C, 15wt% EPM in xylene ◊ 10 phr MAn 12.5 phr MAn × 15 phr MAn • 20 phr MAn
As can be seen in Figure 2.4, all curves initially show a marked increase in the degree of grafting that most likely corresponds to an increasing number of free radicals. At higher initiator concentrations, the grafting degree eventually reaches a constant value or decreases.
20 Chapter 2
This trend could be ascribed to a combination of effects such as: a decreasing efficiency of the initiator due to the recombination reactions among primary radicals and an increasing probability of secondary reactions of macroradicals (crosslinking). From the result, as presented in Figure 2.4, a peroxide concentration of 3 phr was chosen for the experiments discussed in the following sections.
2.3.3 Effect of reaction time
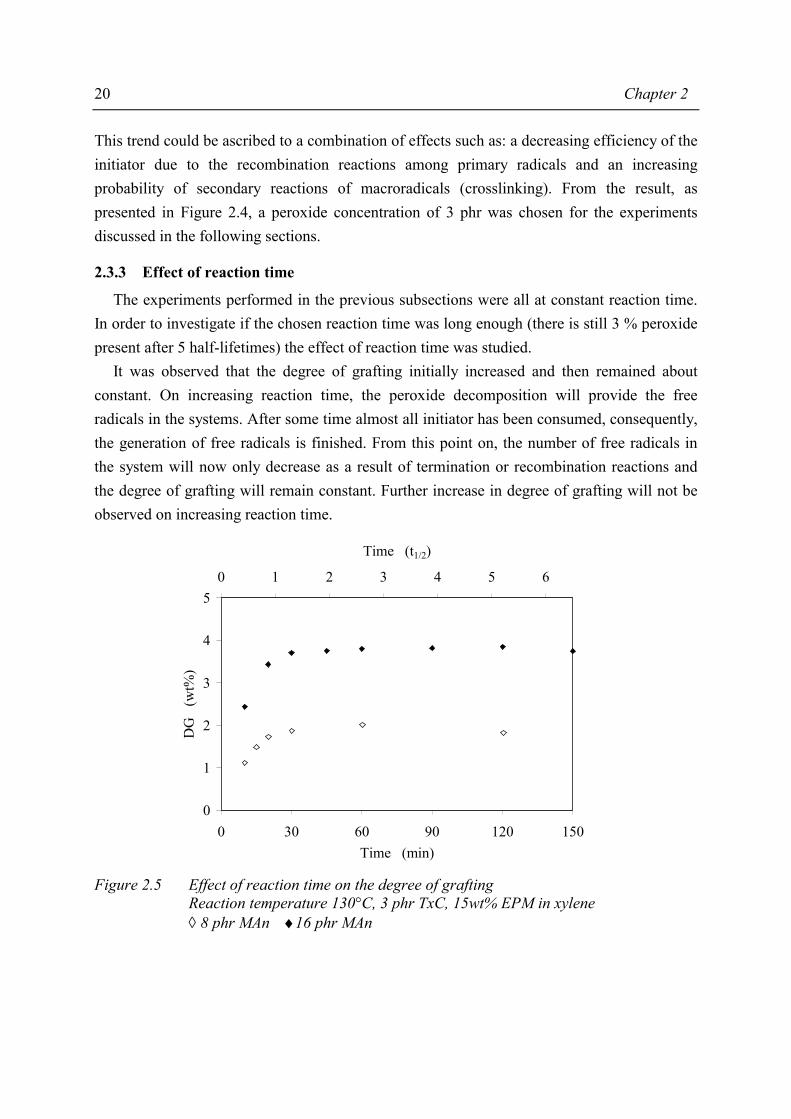
The experiments performed in the previous subsections were all at constant reaction time. In order to investigate if the chosen reaction time was long enough (there is still 3 % peroxide present after 5 half-lifetimes) the effect of reaction time was studied. It was observed that the degree of grafting initially increased and then remained about constant. On increasing reaction time, the peroxide decomposition will provide the free radicals in the systems. After some time almost all initiator has been consumed, consequently, the generation of free radicals is finished. From this point on, the number of free radicals in the system will now only decrease as a result of termination or recombination reactions and the degree of grafting will remain constant. Further increase in degree of grafting will not be observed on increasing reaction time.
0
1
2
3
4
5
0 30 60 90 120 150Time (min)
DG
(w
t%)
0 1 2 3 4 5 6
Time (t1/2)
Figure 2.5 Effect of reaction time on the degree of grafting
Reaction temperature 130°C, 3 phr TxC, 15wt% EPM in xylene ◊ 8 phr MAn ♦16 phr MAn
Grafting of Maleic Anhydride 21
Although Figure 2.5 indicates that 1 hour of reaction suffices, still about 25% of unreacted peroxide is present. After a reaction time of 5 half-life times, about 97% of the peroxide is decomposed, therefore a reaction time for the grafting reaction of 5 half-life times was proposed. Literature concerning grafting supports the choice of a reaction time of at least 5 half-life times of the peroxide used. Therefore, for upcoming experiments the reaction time of 2 hours was chosen, corresponding to 5 half-lifetimes of the peroxide TxC at 130°C. Reaction of the remaining active peroxide (about 3%) was inhibited by addition of an antioxidant (Irganox 1076) to the reaction mixture at the end of the reaction time.
2.3.4 Effect of polymer concentration
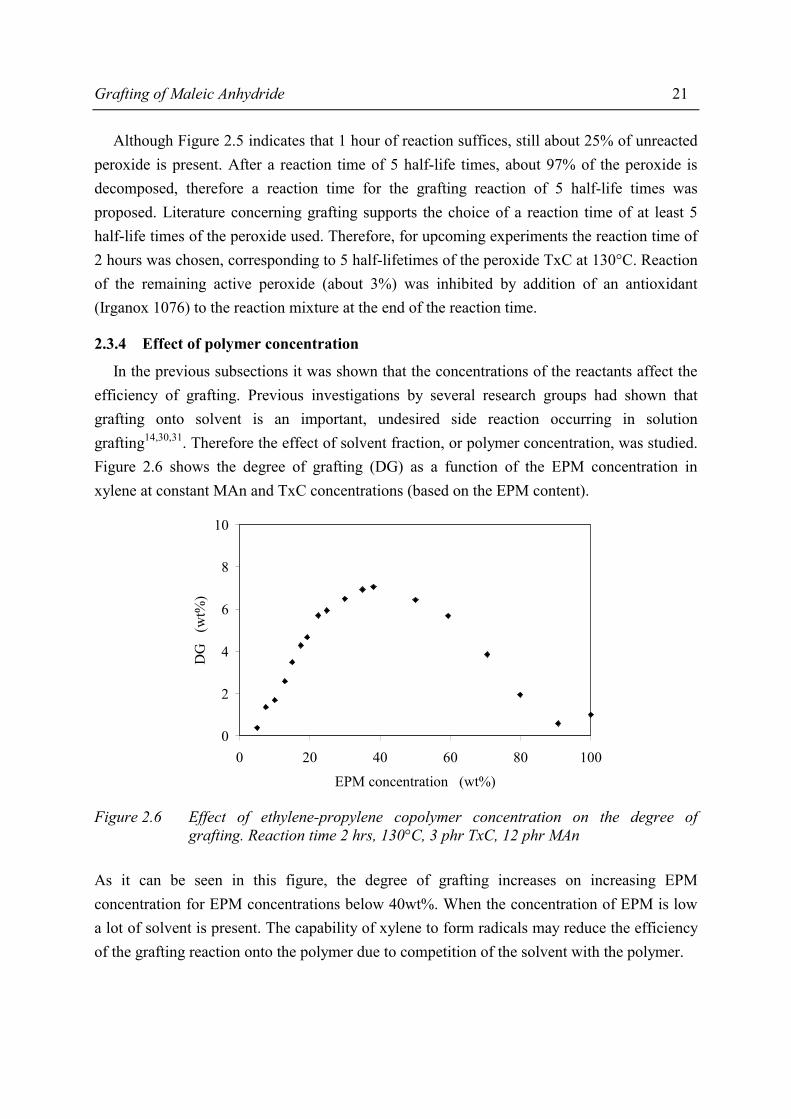
In the previous subsections it was shown that the concentrations of the reactants affect the efficiency of grafting. Previous investigations by several research groups had shown that grafting onto solvent is an important, undesired side reaction occurring in solution grafting14,30,31. Therefore the effect of solvent fraction, or polymer concentration, was studied. Figure 2.6 shows the degree of grafting (DG) as a function of the EPM concentration in xylene at constant MAn and TxC concentrations (based on the EPM content).
0
2
4
6
8
10
0 20 40 60 80 100
EPM concentration (wt%)
DG
(w
t%)
Figure 2.6 Effect of ethylene-propylene copolymer concentration on the degree of
grafting. Reaction time 2 hrs, 130°C, 3 phr TxC, 12 phr MAn As it can be seen in this figure, the degree of grafting increases on increasing EPM concentration for EPM concentrations below 40wt%. When the concentration of EPM is low a lot of solvent is present. The capability of xylene to form radicals may reduce the efficiency of the grafting reaction onto the polymer due to competition of the solvent with the polymer.

22 Chapter 2
When EPM concentrations above 40wt% are considered, the degree of grafting decreases with increasing polymer concentration. The increasing viscosity of the reaction mixture may explain this effect. At high polymer concentrations the reaction becomes comparable or even equal to a modification in the polymer melt. It is known from literature that the reaction of maleic anhydride with molten polyolefins in the presence of a peroxide catalyst proceeds as a heterogeneous reaction due to the insolubility of molten MAn1. It was observed at concentrations higher than 60wt% EPM; dark spots were visible in the polymer solution. These dark spots were also mentioned in the modification of polyolefins by grafting of MAn in the polymer melt32. The dark spots were characterised as decarboxylated MAn and oligomers of MAn and are an indication of phase separation of MAn in the polymer melt. The fact that it is difficult to obtain maleated polyolefins via melt-modification is in agreement with the solubility/heterogeneity problem occurring at these concentrations. The grafting reactions are in principle diffusion controlled and, as a result, are hampered by the high viscosities pf the polymer melt. This is probably the reason why in a fairly dilute solution a higher grafting efficiency can be reached20. Finally, from these experiments a polymer concentration of 40wt% in xylene was chosen because of the maximum in degree of grafting that occurred. Since apparently the solvent and the polymer compete in the grafting reaction of MAn in a xylene medium initiated by TxC. Therefore a detailed study, using GC-MS, was performed to describe the side-products that are formed during the grafting procedure. The results of these experiments are presented in Appendix B and confirm the competition between solvent and polymer in the grafting reaction.
2.3.5 Effect of maleic anhydride concentration
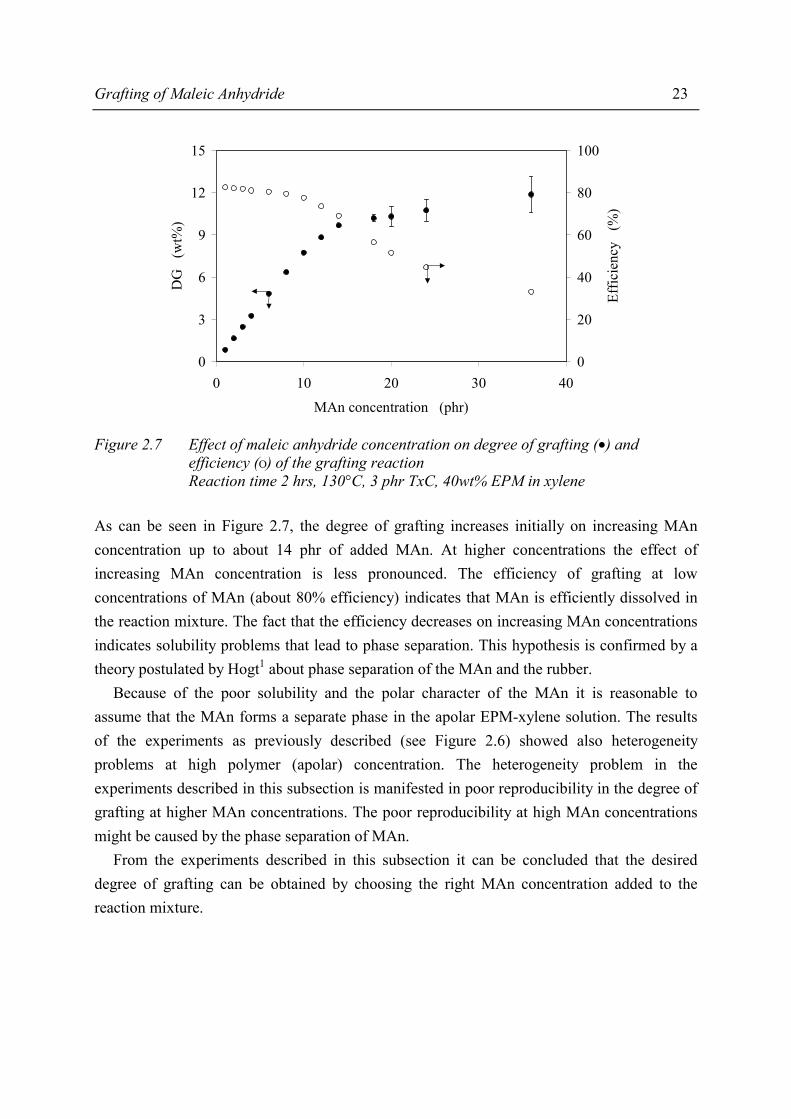
Because of the poor solubility of maleic anhydride in apolar media the influence of the concentration of MAn on the degree of grafting was studied. The reaction time and temperature were kept at 2 hrs and 130 °C, respectively. The peroxide concentration was kept at 3 phr. The effect of MAn concentration on degree of grafting is illustrated in Figure 2.7.
Grafting of Maleic Anhydride 23
0
3
6
9
12
15
0 10 20 30 40
MAn concentration (phr)
DG
(w
t%)
0
20
40
60
80
100
Effic
ienc
y (
%)
Figure 2.7 Effect of maleic anhydride concentration on degree of grafting (•) and
efficiency (Ο) of the grafting reaction Reaction time 2 hrs, 130°C, 3 phr TxC, 40wt% EPM in xylene
As can be seen in Figure 2.7, the degree of grafting increases initially on increasing MAn concentration up to about 14 phr of added MAn. At higher concentrations the effect of increasing MAn concentration is less pronounced. The efficiency of grafting at low concentrations of MAn (about 80% efficiency) indicates that MAn is efficiently dissolved in the reaction mixture. The fact that the efficiency decreases on increasing MAn concentrations indicates solubility problems that lead to phase separation. This hypothesis is confirmed by a theory postulated by Hogt1 about phase separation of the MAn and the rubber. Because of the poor solubility and the polar character of the MAn it is reasonable to assume that the MAn forms a separate phase in the apolar EPM-xylene solution. The results of the experiments as previously described (see Figure 2.6) showed also heterogeneity problems at high polymer (apolar) concentration. The heterogeneity problem in the experiments described in this subsection is manifested in poor reproducibility in the degree of grafting at higher MAn concentrations. The poor reproducibility at high MAn concentrations might be caused by the phase separation of MAn. From the experiments described in this subsection it can be concluded that the desired degree of grafting can be obtained by choosing the right MAn concentration added to the reaction mixture.

24 Chapter 2
2.3.6 Effect of molecular weight of the polyolefin
Some small samples of EPM were available having somewhat higher molecular weights than that of the EPM used in the previous described experiments. These EPMs were used to study the effect of the molecular weight of the polymer on the degree of grafting. The specification of the EPMs used is given in Table 2.2.
Table 2.2 Specifications of the ethylene-propylene copolymers
Ethylene content(wt%)
Mn (kg·mol-1)
47 20 47 28 52 37 46 52 48 65
These polymers were all dissolved in xylene at the same concentration. The concentration of the polymer in xylene is limited due to the molecular weight, and is therefore determined by the EPM with the highest molecular weight. All reactions were performed under the standard conditions, viz., 130°C, 3 phr TxC, 12 phr MAn, reaction time of 2 hours and EPM concentration of 20wt%. The results are shown in Figure 2.8.
0
1
2
3
4
5
6
0 10 20 30 40 50 60 70 80
Mn (kg· mol-1)
DG
(w
t%)
Figure 2.8 Effect of the molecular weight of EPM
Reaction time 2 hrs, 130°C, 3 phr TxC, 12 phr MAn, 20wt% EPM in xylene
Grafting of Maleic Anhydride 25
As it can be inferred in this figure, the effect of the molecular weight is not really pronounced. Based on the fact that the polymers consist of about the same ethylene-propylene ratio it seems reasonable to state that the molecular weight has no significant effect on the degree of grafting at this polymer concentration.
2.4 Conclusions The objective of the study described in this chapter was to study the conditions that allow the preparation of a range of ethylene-propylene copolymers grafted with maleic anhydride. These maleated products (MAn-g-EPM) will be used for the synthesis of ionomers. Therefore a recipe for grafting had to be composed and optimised. First, a suitable peroxide was chosen as initiator for the grafting process. In comparison with TxB and DBPO, TxC is a better initiator for grafting maleic anhydride onto ethylene-propylene copolymer in xylene solution at 130 °C. Subsequently, using TxC as initiator, the optimal reaction time and the optimal concentrations of the other reactants; EPM and MAn, were determined. Depending on these reaction parameters, the extent of grafting was in the range of 0 to 12wt%. In conclusion, the results show that it is possible to obtain a range of MAn-g-EPMs with one single recipe as described in subsection 2.2.2 using 40wt% EPM (Mn 11 kg·mol-1) and a TxC concentration of 3 phr. By variation of the MAn concentration the desired degrees of grafting can be obtained.
2.5 References 1. Hogt, A.H., Compalloy '90 , 179 (1990) 2. Callais, P.A. and Kazmierczak, R.T., ANTEC '90 , 1921 (1990) 3. Ruggeri, G., Aglietto, M., Petragnani, A., and Ciardelli, F., Eur. Polym. J. 19, 863 (1983) 4. Ho, R.M., Su, A.C., Wu, C.H. and Chen, S.I., Polymer 34, 3264 (1993) 5. Gaylord, N.G. and Mishra, M.K., J. Polym. Sci.: Polym. Lett. Ed. 21, 23 (1983) 6. Rengarajan, R., Parameswaran, V.R., Lee, S., Vicic, M., and Rinaldi, P.L. Polymer 31, 1703
(1990) 7. Singh, R.P., Prog. Polym. Sci. 17, 251 (1992) 8. Mínoura, Y., Ueda, M., Mizunuma, S., and Oba, M. J. Appl. Polym. Sci. 13, 1625 (1969) 9. Mülhaupt, R., Suschek, T. and Rieger, B., Makromol. Chem. Macromol. Symp. 48/49, 317
(1991) 10. Lambla, M. and Flat, D., Makromol. Kollo. Fribourg, 70 (1993) 11. Al-Malaika, S., ACS Symp. Ser. 364, 409 (1988) 12. Braun, D. and Eisenlohr, U. Angew. Makromol. Chem 55, 43 (1976) 13. Gaylord, N.G. and Mehta, R., J. Polym. Sci.: Part A: Polym. Chem. 26, 1189 (1988)
26 Chapter 2
14. De Vito, G., Lanzetta, N., Maglio G., Malinconico, M., Musto, P. and Palumbo, R., J. Polym.
Sci.: Polym. Chem. Ed. 22, 1335 (1984) 15. Ide, F. and Hasegawa, A., J. Appl. Polym. Sci. 18, 963 (1974) 16. Cimmino, S., d’Orazio, L., Greco, R., Maglio, G., Malinconico, M., Mancarella, C., Martuscelli,
E., Palumbo, R. and Ragosta, G., Polym. Eng. Sci. 24, 48 (1984) 17. Gaylord, N.G., Mehta, M., and Mehta, R. J. Appl. Polym. Sci. 33, 2549 (1987) 18. Gaylord, N.G., Mehta, R., Kumar, V., and Tazi, M., Polym. Prepr. 27, 105 (1986) 19. Oostenbrink, A.J. and Gaymans, R.J., Polymer 33, 3086 (1992) 20. Greco, R., Maglio, G. and Musto, P.V., J. Appl. Polym. Sci. 33, 2513 (1987) 21. Porejko, S., Gabara, W. and Kuleska, J., J. Polym. Sci.: Part A-1 5, 1571 (1967) 22. Gabara, W. and Porejko, S., J. Polym. Sci.: Part A-1 5, 1547 (1967) 23. Xanthos, M. Polym. Eng. Sci. 28, 1392 (1988) 24. Wu, C.H. and Su, A.C. Polym. Eng. Sci. 31, 1629 (1991) 25. Wu, C.H. and Su, A.C. Polymer 33, 1987 (1992) 26. Borggreve, R.J.M. and Gaymans, R.J. Polymer 30, 63 (1989) 27. Gaylord, N.G., Mehta, R., Mohan, D.R. and Kumar, V. J. Appl. Polym. Sci. 44, 1941 (1992) 28. Heinen, W., Rosenmöller, C.H., Wenzel, C.B., De Groot, H.J.M. and Lugtenburg, J.,
Macromolecules 29, 1151 (1996) 29. Moad, G., and Solomon, D.H., The Chemistry of Free Radical Polymerization, Pergamon, 1995,
Chapter 3 30. Wu, C.-J., Chen, C.-Y., Woo, E. and Kuo,J.-F., J. Polym. Sci.: Part A: Polym. Chem. 31, 3405
(1993) 31. Priola, A., Bongiovanni, R. and Gozzelino, G., Eur. Polym. J. 30, 1047 (1994) 32. Braun, D., Braun, I., Krämer, I. and Hellmann, G.P., Angew. Makromol. Chem. 251, 37 (1997)
Chapter 3 Ionomer preparation Neutralisation of MAn-g-EPM
3.1 Introduction In general, ionomer preparation requires two steps. The first step is the preparation of the acid-modified polymer by copolymerisation or by grafting of a suitable acidic monomer onto a polymer backbone. The second step is the (partial) neutralisation of the acid functional polymer. A fair amount of literature has been published on the first step of ionomer synthesis; the synthesis of acid functional polymers. A variety of methods in order to prepare the different structures, as well as acid functions have been reported. A relatively wide range of acid groups is available for the preparation of ionomers. The most common pendant acid groups used in the synthesis of ionomers are carboxylic acids1, sulphonic acids2 and to a much lesser extent phosphonic acids3. For the neutralisation of acid groups two different routes are possible. Neutralisation may take place in a solvent medium or in the melt of the ionomer precursor. Various methods have been described to neutralise ethylene-methacrylic copolymers1. These methods include the neutralisation of a polymer solution, of pellets in an aqueous suspension and the neutralisation of a polymer melt in an extruder or on a heated two-roll rubber mill. The polymer melt neutralisation method is probably most suitable for large-scale operation. In this chapter the preparation of a zinc-ionomer will be discussed. MAn-g-EPM is used as ionomer precursor, and is obtained as described in Chapter 2. The polar maleic anhydride groups grafted onto the polymer backbone are crosslinked by divalent zinc cations (added as zinc acetate*) in a solution of MAn-g-EPM in toluene/isopropanol. The neutralisation reaction will be verified using infrared analysis (FT-IR) and thermogravimetric analysis (TGA).
________________ * The zinc-ionomer is taken as an example, the zinc acetate can easily be replaced by e.g. sodium acetate or
other acetates with the restriction that the salt is water soluble.
28 Chapter 3
3.2 Ionomer preparation
3.2.1 Materials
The modified ethylene-propylene copolymer (MAn-g-EPM), obtained according to the procedure described in Chapter 2, was dried for 18 hrs at 100°C under a nitrogen atmosphere. Zinc-acetate dihydrate (ZnC4H6O4·2H2O (ZnAc), Fluka, p.a. 99.5%) was used for the neutralisation, and the solvent used for the ionomer preparation was a mixture of toluene (Lamers & Pleuger, analytical grade) and isopropanol (Fluka, >99%) in a 9 to 1 weight ratio.
3.2.2 Neutralisation procedure
Typically, 15 g of MAn-g-EPM was dissolved in a mixture of 135 g toluene and 15 g isopropanol at 80°C. After complete dissolution, 10 g of an aqueous solution containing the required amount of ZnAc was added. The two-phase reaction mixture was mixed for 15 min. Then approximately 75 g solvent was distilled off and new solvent (toluene/isopropanol) was added to the viscous system to remove the excess of water. The mixture was allowed to homogenise at 80°C for 30 min after which the solvent was evaporated and the polymer was dried under vacuum at 100°C for 16 hrs.
3.2.3 Definitions concerning concentrations
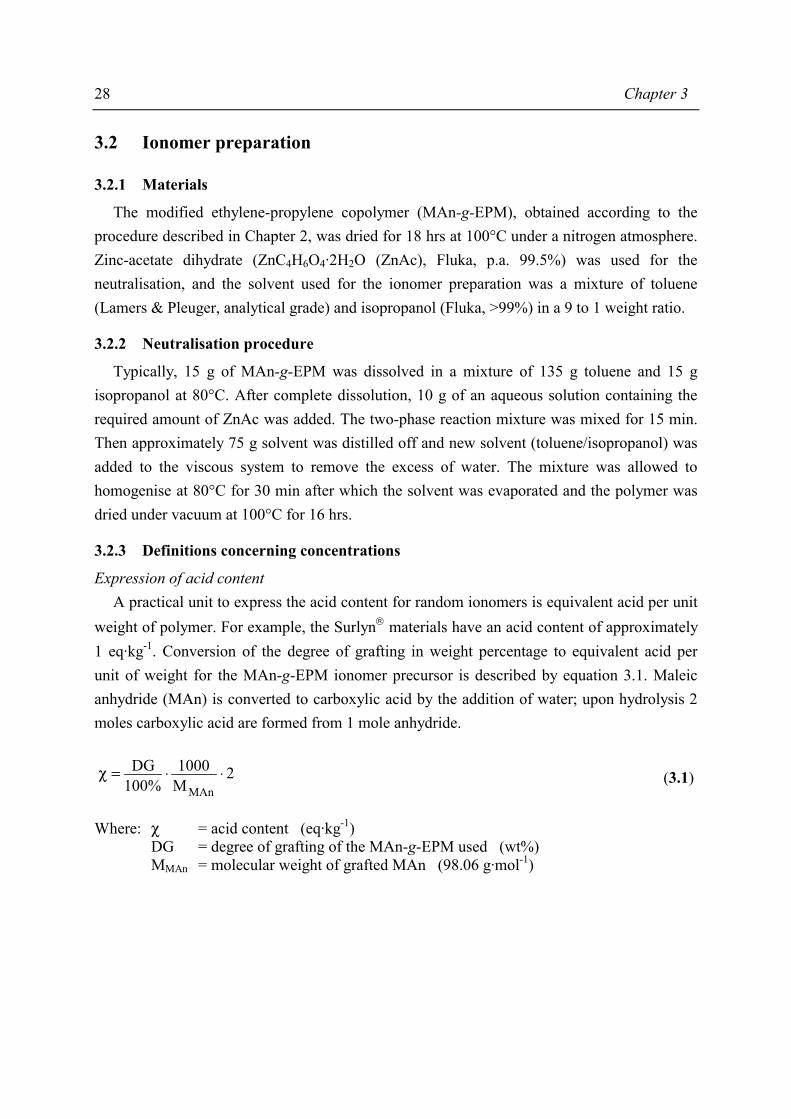
Expression of acid content A practical unit to express the acid content for random ionomers is equivalent acid per unit weight of polymer. For example, the Surlyn materials have an acid content of approximately 1 eq·kg-1. Conversion of the degree of grafting in weight percentage to equivalent acid per unit of weight for the MAn-g-EPM ionomer precursor is described by equation 3.1. Maleic anhydride (MAn) is converted to carboxylic acid by the addition of water; upon hydrolysis 2 moles carboxylic acid are formed from 1 mole anhydride.
2M1000
100%DG
MAn⋅⋅=χ (3.1)
Where: χ = acid content (eq·kg-1) DG = degree of grafting of the MAn-g-EPM used (wt%) MMAn = molecular weight of grafted MAn (98.06 g·mol-1)

Ionomer preparation 29
Definition of degree of neutralisation The degree of neutralisation (DN) is defined as the fraction of acid groups that is converted into metal carboxylate groups. Thus the degree of neutralisation is the actual amount of neutralised acid groups divided by the total amount of available acid groups for neutralisation. As mentioned before, MAn is hydrolysed by the water and each grafted MAn molecule provides two acid groups for neutralisation. The degree of neutralisation (DN) is calculated using:
%100mM
1000mDN
productZnAc
ZnAc ⋅⋅χ⋅
⋅⋅ν⋅= (3.2)
Where: DN = degree of neutralisation (%) ν = valency of the metal ion (in case of zinc ν equals 2) mZnAc = mass of zinc-acetate dihydrate added (g) MZnAc = molecular weight of zinc-acetate dihydrate (219.50 g·mol-1) χ = acid content (eq·kg-1) mproduct = mass of MAn-g-EPM used (g)
3.3 Characterisation
3.3.1 Methods
Thermogravimetric analysis (TGA) In order to determine the amount of zinc present in the material, the weight loss of the ionomer was measured from 30°C to 700°C with a heating rate of 20°C·min-1 using a Perkin Elmer TGA7 under an airflow of 50 ml·min-1. The amount of zinc present in the ionomer was calculated from the weight of the ash present as ZnO. The DN calculated from the recipe was verified by the result of the above described TGA procedure using equation 3.3.
( )( ) ( )( ))100M/(DGmm
M/mDN
MAnZnOsample
ZnOZnO
××−= x 100 (3.3)
Where: mZnO = mass of the remaining ash (g) msample = mass of the analysed sample (g) MZnO = molecular weight of ZnO (81.39 g·mol-1) MMAn = molecular weight of grafted MAn (98.06 g·mol-1) DG = degree of grafting of the MAn-g-EPM used (7.33 wt%)
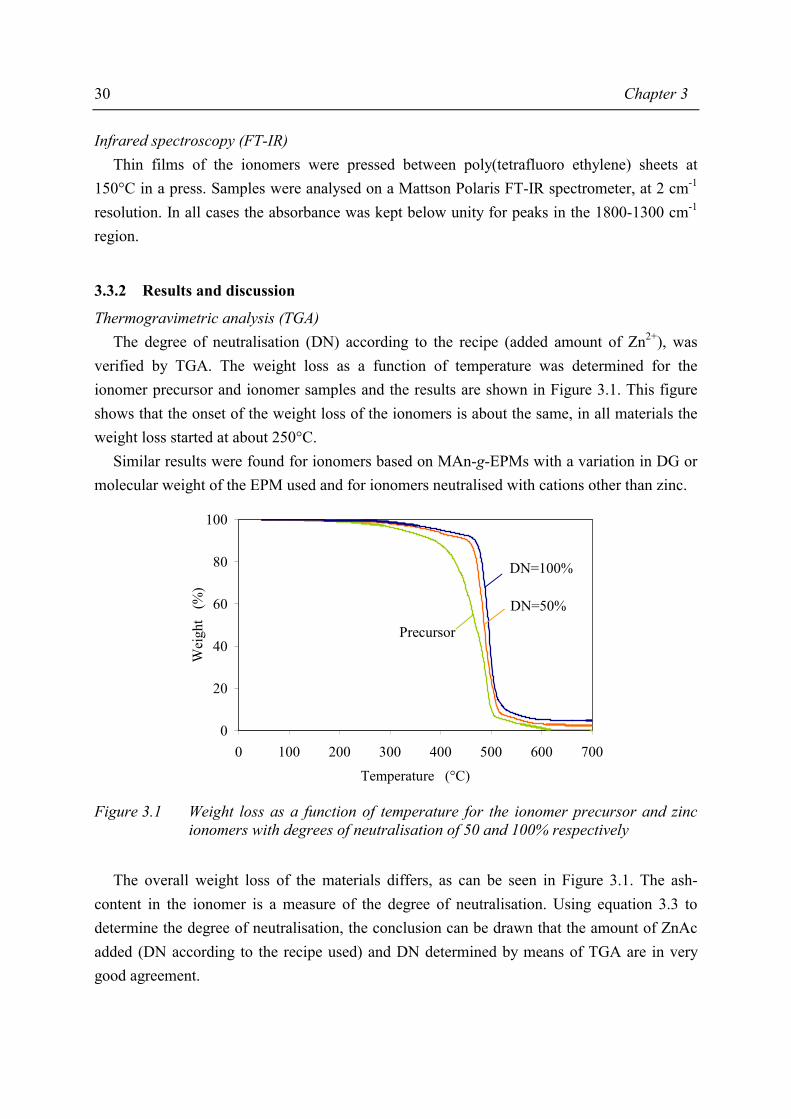
30 Chapter 3
Infrared spectroscopy (FT-IR) Thin films of the ionomers were pressed between poly(tetrafluoro ethylene) sheets at 150°C in a press. Samples were analysed on a Mattson Polaris FT-IR spectrometer, at 2 cm-1 resolution. In all cases the absorbance was kept below unity for peaks in the 1800-1300 cm-1 region.
3.3.2 Results and discussion
Thermogravimetric analysis (TGA) The degree of neutralisation (DN) according to the recipe (added amount of Zn2+), was verified by TGA. The weight loss as a function of temperature was determined for the ionomer precursor and ionomer samples and the results are shown in Figure 3.1. This figure shows that the onset of the weight loss of the ionomers is about the same, in all materials the weight loss started at about 250°C. Similar results were found for ionomers based on MAn-g-EPMs with a variation in DG or molecular weight of the EPM used and for ionomers neutralised with cations other than zinc.
0
20
40
60
80
100
0 100 200 300 400 500 600 700Temperature (°C)
Wei
ght
(%)
Precursor
DN=100%
DN=50%
Figure 3.1 Weight loss as a function of temperature for the ionomer precursor and zinc
ionomers with degrees of neutralisation of 50 and 100% respectively The overall weight loss of the materials differs, as can be seen in Figure 3.1. The ash-content in the ionomer is a measure of the degree of neutralisation. Using equation 3.3 to determine the degree of neutralisation, the conclusion can be drawn that the amount of ZnAc added (DN according to the recipe used) and DN determined by means of TGA are in very good agreement.

Ionomer preparation 31
Infrared spectroscopy (FT-IR) All anhydrides show two carbonyl absorption bands in the infrared spectra. The position, separation and intensity of these bands depend on whether the carbonyls are conjugated and whether they are part of a strained five-membered ring as in MAn. In open anhydrides the higher frequency band is always the most intense of the two, but in cyclic systems the intensity of this band is reduced4. The infrared spectrum of the ionomer precursor showed that characteristic anhydride bands appeared at ~1785 and ~1865 cm-1. This doublet is usually ascribed to coupling of carbonyl vibrations. The 1785 cm-1 band is very strong and is generally used to estimate the amount of MAn present5. The infrared spectrum of the zinc ionomers showed that new characteristic absorption bands, which are clearly not present in the MAn-g-EPM, appear upon neutralisation at 1630 cm-1 and 1560 cm-1. Figure 3.2 shows the infrared spectra of the MAn-g-EPM and the zinc ionomers. Designations of the different peaks in the infrared spectrum are given in Table 3.1.
50075010001250150017502000
Wavenumber (cm-1)
Abs
orba
nce 0
204075
DNrecipe
(%)
Figure 3.2 Infrared spectrum of MAn-g-EPM and zinc ionomers of this material with different degrees of neutralisation
Upon neutralisation the intensity of the peaks in the 1900 – 1700 cm-1 region (originating from the grafted MAn) decrease in intensity. However, extra absorption bands, which increase in intensity upon neutralisation, indicate the presence of ionised carboxylic groups, the zinc-carboxylate (Table 3.1).
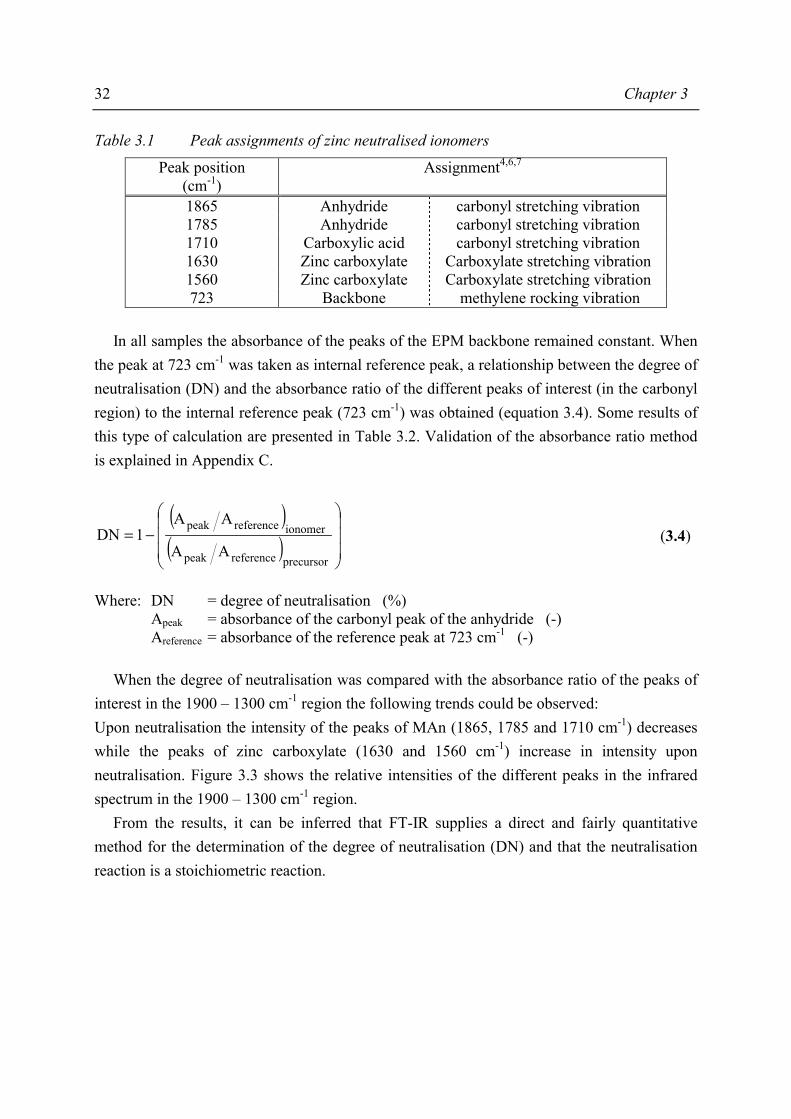
32 Chapter 3
Table 3.1 Peak assignments of zinc neutralised ionomers
Peak position (cm-1)
Assignment4,6,7
1865 Anhydride carbonyl stretching vibration 1785 Anhydride carbonyl stretching vibration 1710 Carboxylic acid carbonyl stretching vibration 1630 Zinc carboxylate Carboxylate stretching vibration 1560 Zinc carboxylate Carboxylate stretching vibration 723 Backbone methylene rocking vibration
In all samples the absorbance of the peaks of the EPM backbone remained constant. When the peak at 723 cm-1 was taken as internal reference peak, a relationship between the degree of neutralisation (DN) and the absorbance ratio of the different peaks of interest (in the carbonyl region) to the internal reference peak (723 cm-1) was obtained (equation 3.4). Some results of this type of calculation are presented in Table 3.2. Validation of the absorbance ratio method is explained in Appendix C.
( )( )
−=
precursorreferencepeak
ionomerreferencepeak
AA
AA1DN (3.4)
Where: DN = degree of neutralisation (%) Apeak = absorbance of the carbonyl peak of the anhydride (-) Areference = absorbance of the reference peak at 723 cm-1 (-) When the degree of neutralisation was compared with the absorbance ratio of the peaks of interest in the 1900 – 1300 cm-1 region the following trends could be observed: Upon neutralisation the intensity of the peaks of MAn (1865, 1785 and 1710 cm-1) decreases while the peaks of zinc carboxylate (1630 and 1560 cm-1) increase in intensity upon neutralisation. Figure 3.3 shows the relative intensities of the different peaks in the infrared spectrum in the 1900 – 1300 cm-1 region. From the results, it can be inferred that FT-IR supplies a direct and fairly quantitative method for the determination of the degree of neutralisation (DN) and that the neutralisation reaction is a stoichiometric reaction.

Ionomer preparation 33
0
1
2
3
4
5
0 20 40 60 80 100DN (%)
Rel
ativ
e pe
ak in
tens
ity
(-)
Figure 3.3 Relative peak intensities as a function of the degree of neutralisation
♦ 1560 cm-1, • 1630 cm-1, -- 1710 cm-1, Ο 1785 cm-1, ◊ 1865 cm-1 The drawn lines are only a guide to the eye
For zinc ionomers based on MAn-g-EPM with a DG of 7.33wt% the results are presented in Table 3.2. The results of the degree of neutralisation according to the recipe (DNrecipe) agree very well with DNFTIR and DNTGA. The infrared method is sensitive to errors in peak determinations because small differences in absorbance ratios result in large errors in DN calculation. On the other hand, the TGA method is less sensitive to experimental errors.
Table 3.2 Comparison of calculated and measured degrees of neutralisation
Sample
DNrecipe (%)
DNFTIR-1785 (%)
DNFTIR-1865 (%)
msample (mg)
mZnO (mg)
DNTGA (%)
A 0 0 0 9.806 0.000 0 B 9.8 9.04 11.59 9.876 0.057 9.6 C 20.4 20.66 19.11 9.939 0.123 20.6 D 25.4 25.36 28.94 10.307 0.155 25.1 E 50.3 49.19 52.58 10.891 0.325 50.5 F 75.0 72.83 79.67 11.098 0.478 74.0 G 100.2 97.97 98.00 11.879 0.677 99.3
DNFTIR was calculated according to the method as described in Appendix C The results of the analyses were comparable for ionomers with different types of ionomer precursor or neutralised with different types of cations.
34 Chapter 3
3.4 Conclusions In this chapter the preparation of ionomers has been described by (partial) neutralisation of MAn-g-EPM with zinc acetate in solution. The solvent was a 9/1 toluene/isopropanol mixture. Two different methods were employed for the verification of the recipe and determination of the degree of neutralisation: infrared spectroscopy (FT-IR) and thermogravimetric analysis (TGA). Both methods are fairly quantitative; the TGA method was judged to be more precise, because of some inaccuracy in the IR absorbances. The amount of ZnAc added (DN according to the recipe used) and DN as determined by means of TGA and FT-IR agree very well. This implies that neutralisation is a stoichiometric reaction. The results of the analyses were comparable for ionomers with different types of ionomer precursor or neutralised with different types of cations.
3.5 References 1. Rees, R.W., U.S. Patents 3,264,272 2. Thaler, W.A., Macromolecules 16, 623 (1983) 3. Phillips, P.J., MacKnight, W.J., J. Polym. Sci B 8, 87 (1970) 4. Bellamy, L.J., The Infrared Spectra of Complex Molecules, Volume 1, London:
Chapman &Hall, 1975 5. Trivedi, B.C. and Culbertson, B.M, Maleic Anhydride, New York: Plenum Press, 1982 6. Simons, W.W., The Sadtler Handbook of Infrared Spectra, London: Heyden, 1978 7. Bellamy, L.J., The Infrared Spectra of Complex Molecules, Volume 2, London:
Chapman &Hall, 1980
Chapter 4
Morphological models for ionomers
4.1 Introduction In view of the material properties of the synthesised ionomers it is of interest to study the ionomer morphology on the microscopic level. The results of such a study may give insight in the compositional parameters of the ionomers relevant for the variation and optimisation of the material properties. To form a complete picture of the ionomer morphology such as size, shape and spatial arrangement of these ionic aggregates Small Angle X-ray Scattering (SAXS) has proved to be the most direct characterisation technique. SAXS data are commonly used in combination with a structural model to obtain information about the size and composition of the scattering particles. In this chapter morphological models that assign the scattering profile of ionomers to interparticle interference will be evaluated and discussed. From these models the most suitable one was chosen that was able to fit the experimental SAXS data of the MAn-g-EPM based ionomers. In the next chapter the chosen model will be fitted to the experimental data in order to obtain information about the morphology of the MAn-g-EPM based ionomers.
4.2 Overview of proposed structural models for ionomers One of the outstanding problems of ionomers is the description of the structure of these materials. Although there is little doubt that ionic aggregation is responsible for their unique physical properties, no complete picture of the aggregates and their organisation in bulk or solution has emerged. Yet, basic questions such as ‘What kind of ionic species are the aggregates?’ 1,2, ‘Is the shape of these aggregates spherical, lamellar or even more complex?’, and ‘Are the aggregates randomly distributed or are they organised?’ still need to be resolved. All the proposed structural models3,4 are principally derived from SAXS data, but are based on a wide variety of ion-containing polymers.

36 Chapter 4
Wilson et al.5 and Longworth and Vaughan6 were in 1968 the first to publish a small angle X-ray scattering (SAXS) profile of an ethylene-based ionomer. Although the original interpretation that the observed peak originated from the ordered hydrocarbon chains between ionic aggregates is no longer accepted, the data are still important because a peak was observed at low angles for the first time. This peak was designated as the ‘ionic peak’. A schematic representation of the structure of ionic aggregates appeared in the same year in a paper of Bonotto and Bonner7. Based on mechanical and rheological properties of the ionomers studied it was proposed that in ethylene-based ionomers the ionic aggregates contain both ionic material and acid groups in addition to hydrocarbon material. A wide range of experimental studies has been performed since 1968 to elucidate the organisation of ion pairs in aggregates. Delf and MacKnight8 assigned the ionic SAXS peak to scattering from the ionic aggregates. Later, Marx et al.9 proposed a model in which the ionic SAXS peak was ascribed to the electron density difference between the metal cations and the hydrocarbon matrix. In the model of Marx it was suggested that the scattering entities, i.e. the ionic aggregates, are homogeneously distributed throughout the amorphous phase of the polymer. Marx assumed the X-ray scattering to be similar to the WAXS scattering of mono-atomic liquids such as a liquefied noble gas. This concept provided a fairly good fit of the experimental SAXS data. A similar qualitative model was put forward by Binsbergen and Kroon10. In their model, the scattering entities were considered as points with a high electron density at the centres of randomly packed spheres. Other models were also proposed. The model developed by MacKnight et al.11 is based on a radial distribution function for the electron density of a partially neutralised cesium ionomer based on ethylene-acrylic acid copolymers. In this model, known as the core-shell model, it is assumed that ion pairs form a core of high electron density that is surrounded by a shell of material of low electron density, which is surrounded by another shell with a slightly higher electron density. The major difference between this model and the model of Marx et al.9 is that the ionic peak is assigned to intraparticle interference rather than interparticle interference. In 1983, Yarusso and Cooper12 extended and refined the qualitative models of Marx et al.9 and Binsbergen and Kroon10 by postulating that the ionic aggregates, depicted as spheres of high electron density, are arranged with a liquid-like order but with a distance of closest approach. The hydrocarbon layer attached to and surrounding each ionic aggregate determines this distance of closest approach. They showed that this model to be in excellent agreement with their experimentally determined SAXS profiles of sulphonated styrene based ionomers12.
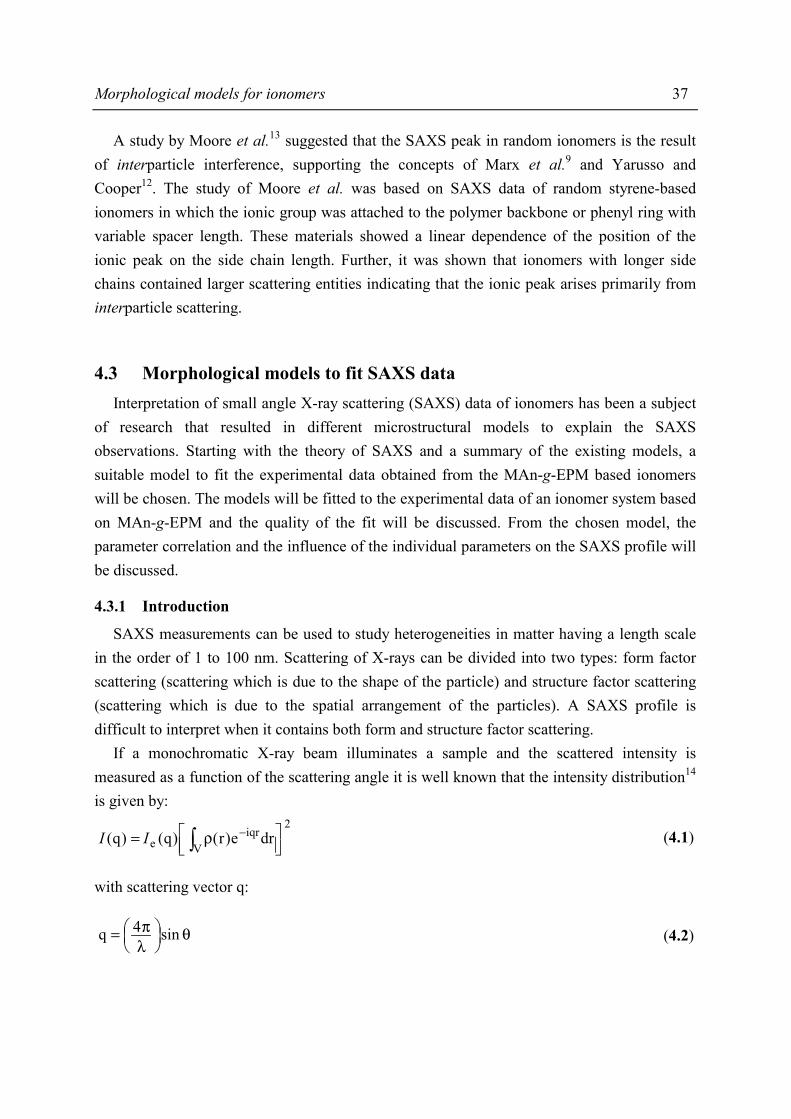
Morphological models for ionomers 37
A study by Moore et al.13 suggested that the SAXS peak in random ionomers is the result of interparticle interference, supporting the concepts of Marx et al.9 and Yarusso and Cooper12. The study of Moore et al. was based on SAXS data of random styrene-based ionomers in which the ionic group was attached to the polymer backbone or phenyl ring with variable spacer length. These materials showed a linear dependence of the position of the ionic peak on the side chain length. Further, it was shown that ionomers with longer side chains contained larger scattering entities indicating that the ionic peak arises primarily from interparticle scattering.
4.3 Morphological models to fit SAXS data Interpretation of small angle X-ray scattering (SAXS) data of ionomers has been a subject of research that resulted in different microstructural models to explain the SAXS observations. Starting with the theory of SAXS and a summary of the existing models, a suitable model to fit the experimental data obtained from the MAn-g-EPM based ionomers will be chosen. The models will be fitted to the experimental data of an ionomer system based on MAn-g-EPM and the quality of the fit will be discussed. From the chosen model, the parameter correlation and the influence of the individual parameters on the SAXS profile will be discussed.
4.3.1 Introduction
SAXS measurements can be used to study heterogeneities in matter having a length scale in the order of 1 to 100 nm. Scattering of X-rays can be divided into two types: form factor scattering (scattering which is due to the shape of the particle) and structure factor scattering (scattering which is due to the spatial arrangement of the particles). A SAXS profile is difficult to interpret when it contains both form and structure factor scattering. If a monochromatic X-ray beam illuminates a sample and the scattered intensity is measured as a function of the scattering angle it is well known that the intensity distribution14
is given by: 2
Vqri
e rde)r()q()q(
ρ= ∫ −I I (4.1)
with scattering vector q:
θ
λπ= sin4q (4.2)
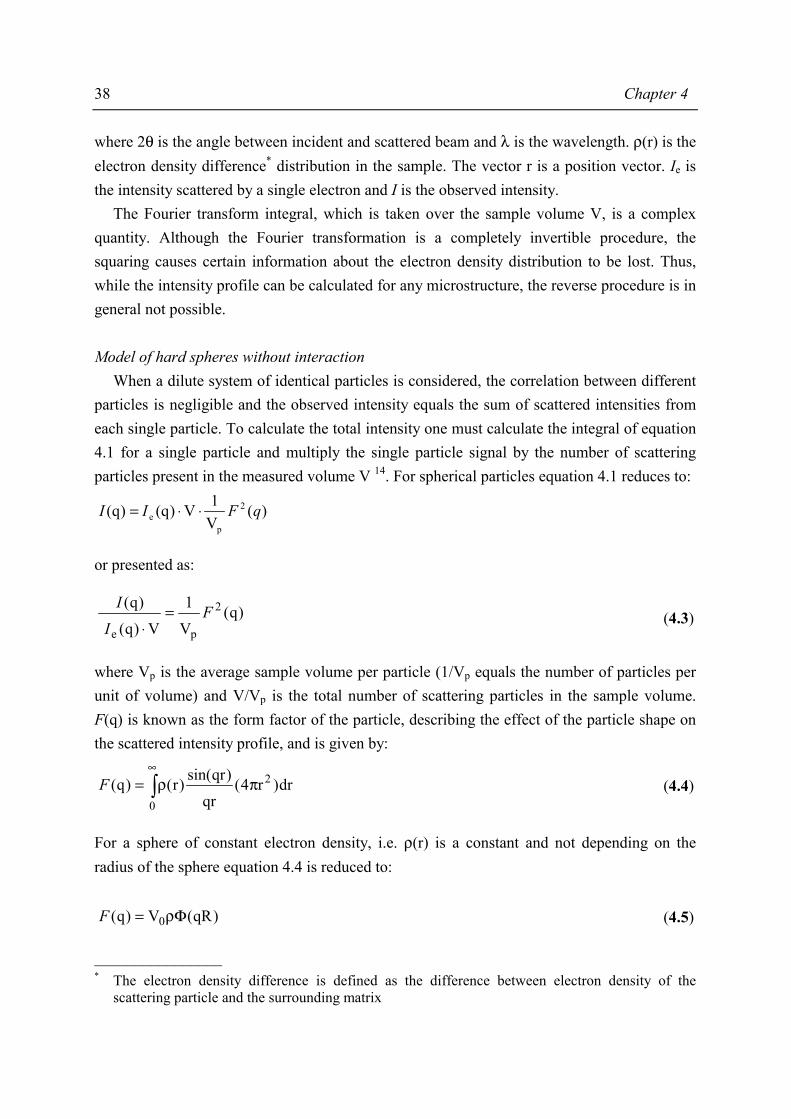
38 Chapter 4
where 2θ is the angle between incident and scattered beam and λ is the wavelength. ρ(r) is the electron density difference* distribution in the sample. The vector r is a position vector. Ie is the intensity scattered by a single electron and I is the observed intensity. The Fourier transform integral, which is taken over the sample volume V, is a complex quantity. Although the Fourier transformation is a completely invertible procedure, the squaring causes certain information about the electron density distribution to be lost. Thus, while the intensity profile can be calculated for any microstructure, the reverse procedure is in general not possible. Model of hard spheres without interaction When a dilute system of identical particles is considered, the correlation between different particles is negligible and the observed intensity equals the sum of scattered intensities from each single particle. To calculate the total intensity one must calculate the integral of equation 4.1 for a single particle and multiply the single particle signal by the number of scattering particles present in the measured volume V 14. For spherical particles equation 4.1 reduces to:
)(V1V)q()q( 2
pe qFI I ⋅⋅=
or presented as:
)q(V
1
V)q(
)q( 2
pe
FI
I =⋅
(4.3)
where Vp is the average sample volume per particle (1/Vp equals the number of particles per unit of volume) and V/Vp is the total number of scattering particles in the sample volume. F(q) is known as the form factor of the particle, describing the effect of the particle shape on the scattered intensity profile, and is given by:
∫∞
πρ=0
2 dr)r4(qr
)qrsin()r()q(F (4.4)
For a sphere of constant electron density, i.e. ρ(r) is a constant and not depending on the radius of the sphere equation 4.4 is reduced to:
)qR(V)q( 0 Φρ=F (4.5) ________________ * The electron density difference is defined as the difference between electron density of the
scattering particle and the surrounding matrix
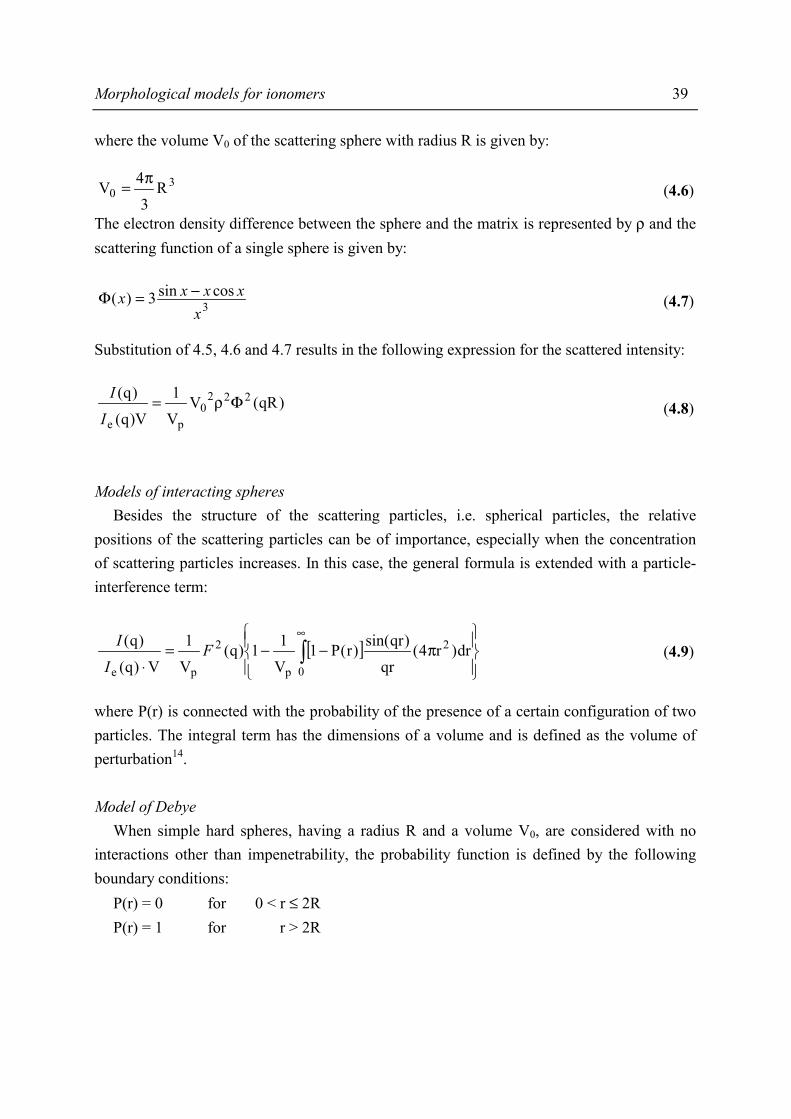
Morphological models for ionomers 39
where the volume V0 of the scattering sphere with radius R is given by:
30 R
3
4V π= (4.6)
The electron density difference between the sphere and the matrix is represented by ρ and the scattering function of a single sphere is given by:
3cossin3)(
xxxxx −=Φ (4.7)
Substitution of 4.5, 4.6 and 4.7 results in the following expression for the scattered intensity:
)qR(VV
1
)Vq(
)q( 2220
pe
Φρ=I
I (4.8)
Models of interacting spheres Besides the structure of the scattering particles, i.e. spherical particles, the relative positions of the scattering particles can be of importance, especially when the concentration of scattering particles increases. In this case, the general formula is extended with a particle-interference term:
[ ]
π−−=⋅
∫∞
0
2
p
2
pe
dr)r4(qr
)qrsin()r(P1V
11)q(V
1
V)q(
)q( FI
I (4.9)
where P(r) is connected with the probability of the presence of a certain configuration of two particles. The integral term has the dimensions of a volume and is defined as the volume of perturbation14. Model of Debye When simple hard spheres, having a radius R and a volume V0, are considered with no interactions other than impenetrability, the probability function is defined by the following boundary conditions: P(r) = 0 for 0 < r ≤ 2R P(r) = 1 for r > 2R
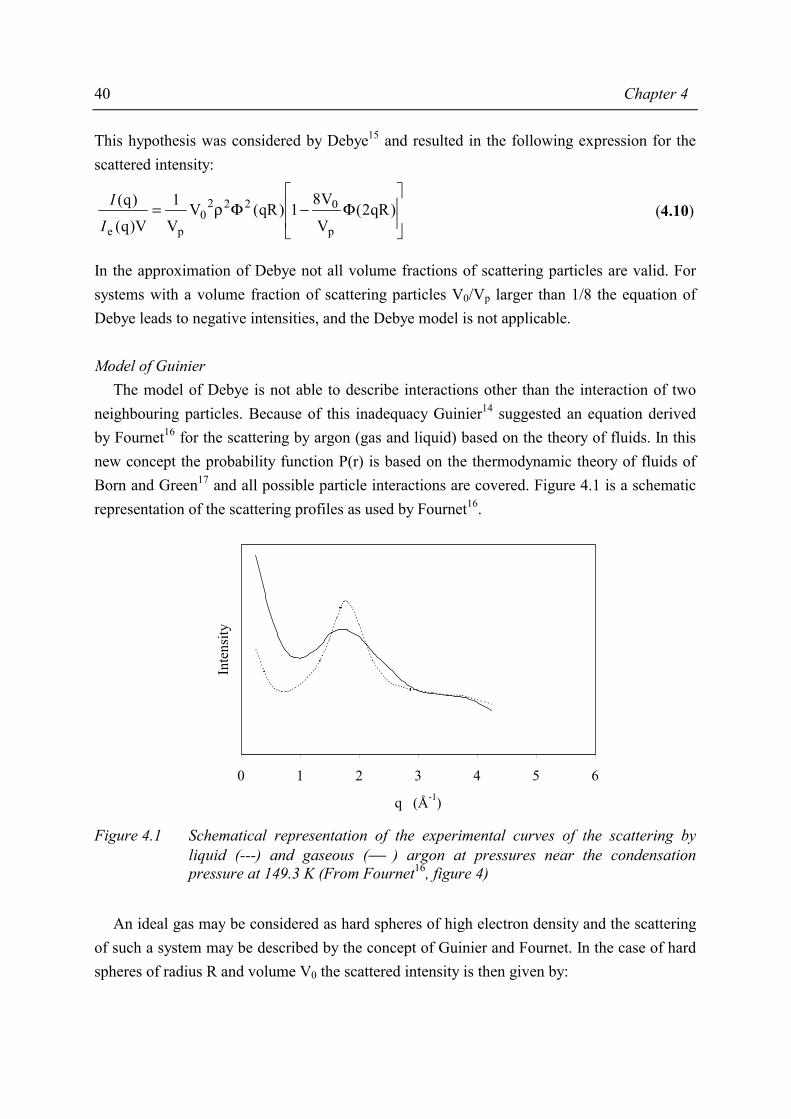
40 Chapter 4
This hypothesis was considered by Debye15 and resulted in the following expression for the scattered intensity:
Φ−Φρ= )qR2(
V
V81)qR(V
V
1
)Vq(
)q(
p
02220
peII (4.10)
In the approximation of Debye not all volume fractions of scattering particles are valid. For systems with a volume fraction of scattering particles V0/Vp larger than 1/8 the equation of Debye leads to negative intensities, and the Debye model is not applicable. Model of Guinier The model of Debye is not able to describe interactions other than the interaction of two neighbouring particles. Because of this inadequacy Guinier14 suggested an equation derived by Fournet16 for the scattering by argon (gas and liquid) based on the theory of fluids. In this new concept the probability function P(r) is based on the thermodynamic theory of fluids of Born and Green17 and all possible particle interactions are covered. Figure 4.1 is a schematic representation of the scattering profiles as used by Fournet16.
0 1 2 3 4 5 6
q (Å-1)
Inte
nsity
Figure 4.1 Schematical representation of the experimental curves of the scattering by
liquid (---) and gaseous ( ) argon at pressures near the condensation pressure at 149.3 K (From Fournet16, figure 4)
An ideal gas may be considered as hard spheres of high electron density and the scattering of such a system may be described by the concept of Guinier and Fournet. In the case of hard spheres of radius R and volume V0 the scattered intensity is then given by:

Morphological models for ionomers 41
)qR2(V
V81
1)qR(VV
1
)Vq(
)q(
p
0
2220
pe Φε+Φρ=
II
(4.11)
The average electron density of the gas atoms is ρ and the average sample volume per particle is Vp. ε is a constant very close to one and the function Φ is defined by equation 4.7. Model of Yarusso and Cooper In 1983 Yarusso and Cooper12 proposed a modified Guinier model. The model describes identical spherical particles of high electron density that are surrounded by a restricted mobility layer dispersed in a matrix of low electron density (see Figure 4.2). The restricted mobility layer has the same electron density as the matrix. a) b)
Figure 4.2 a) Modified hard sphere model b) corresponding electron density profile The correlation between the relative positions of the different particles is comparable with the interaction of hard spheres as proposed by Guinier14. However, in the model of Yarusso and Cooper, the hard sphere interaction radius (RCA) is larger than the radius of the scattering particle (R1). The restricted mobility layer (RCA-R1) provides a steric barrier to the closest approach of two scattering particles but provides no additional scattering. This leads to the following modification of the equation of Guinier (eq. 4.11); if the closest approach distance between two aggregates is 2·RCA and the scattering particle radius is R1, the scattered intensity according to the Yarusso-Cooper model is then given by:
)qR2(V
V81
1)qR(VV
1
)Vq(
)q(
CAp
CA1
2221
pe Φε+Φρ=
II
(4.12)
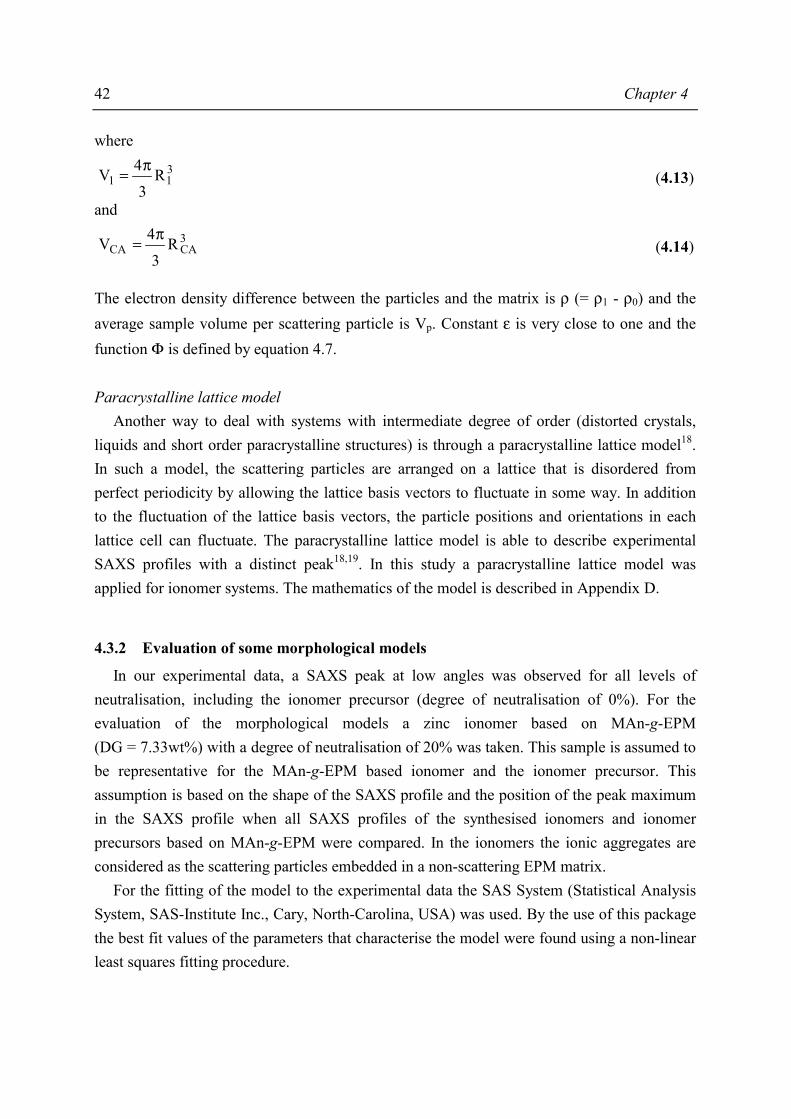
42 Chapter 4
where
311 R
3
4V π= (4.13)
and
3CACA R
3
4V π= (4.14)
The electron density difference between the particles and the matrix is ρ (= ρ1 - ρ0) and the average sample volume per scattering particle is Vp. Constant ε is very close to one and the function Φ is defined by equation 4.7. Paracrystalline lattice model Another way to deal with systems with intermediate degree of order (distorted crystals, liquids and short order paracrystalline structures) is through a paracrystalline lattice model18. In such a model, the scattering particles are arranged on a lattice that is disordered from perfect periodicity by allowing the lattice basis vectors to fluctuate in some way. In addition to the fluctuation of the lattice basis vectors, the particle positions and orientations in each lattice cell can fluctuate. The paracrystalline lattice model is able to describe experimental SAXS profiles with a distinct peak18,19. In this study a paracrystalline lattice model was applied for ionomer systems. The mathematics of the model is described in Appendix D.
4.3.2 Evaluation of some morphological models
In our experimental data, a SAXS peak at low angles was observed for all levels of neutralisation, including the ionomer precursor (degree of neutralisation of 0%). For the evaluation of the morphological models a zinc ionomer based on MAn-g-EPM (DG = 7.33wt%) with a degree of neutralisation of 20% was taken. This sample is assumed to be representative for the MAn-g-EPM based ionomer and the ionomer precursor. This assumption is based on the shape of the SAXS profile and the position of the peak maximum in the SAXS profile when all SAXS profiles of the synthesised ionomers and ionomer precursors based on MAn-g-EPM were compared. In the ionomers the ionic aggregates are considered as the scattering particles embedded in a non-scattering EPM matrix. For the fitting of the model to the experimental data the SAS System (Statistical Analysis System, SAS-Institute Inc., Cary, North-Carolina, USA) was used. By the use of this package the best fit values of the parameters that characterise the model were found using a non-linear least squares fitting procedure.
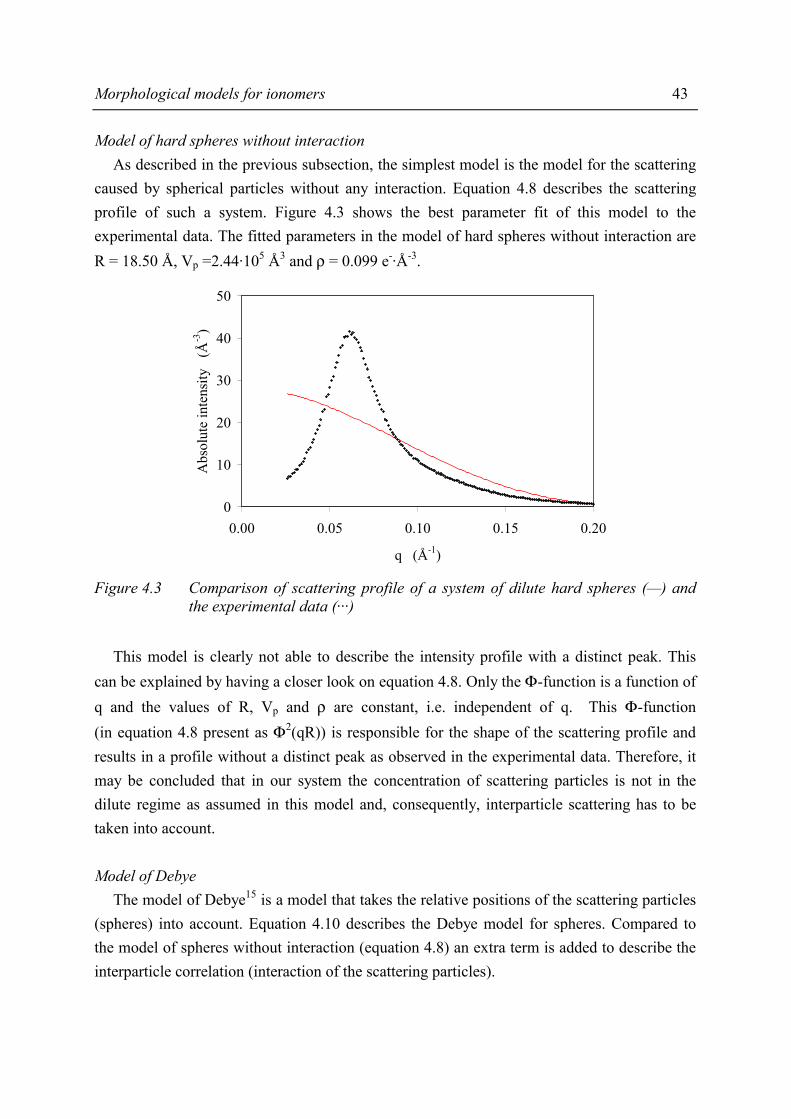
Morphological models for ionomers 43
Model of hard spheres without interaction As described in the previous subsection, the simplest model is the model for the scattering caused by spherical particles without any interaction. Equation 4.8 describes the scattering profile of such a system. Figure 4.3 shows the best parameter fit of this model to the experimental data. The fitted parameters in the model of hard spheres without interaction are R = 18.50 Å, Vp =2.44·105 Å3 and ρ = 0.099 e-·Å-3.
0
10
20
30
40
50
0.00 0.05 0.10 0.15 0.20
q (Å-1)
Abs
olut
e in
tens
ity
(Å-3
)
Figure 4.3 Comparison of scattering profile of a system of dilute hard spheres (—) and
the experimental data (···) This model is clearly not able to describe the intensity profile with a distinct peak. This can be explained by having a closer look on equation 4.8. Only the Φ-function is a function of q and the values of R, Vp and ρ are constant, i.e. independent of q. This Φ-function (in equation 4.8 present as Φ2(qR)) is responsible for the shape of the scattering profile and results in a profile without a distinct peak as observed in the experimental data. Therefore, it may be concluded that in our system the concentration of scattering particles is not in the dilute regime as assumed in this model and, consequently, interparticle scattering has to be taken into account. Model of Debye The model of Debye15 is a model that takes the relative positions of the scattering particles (spheres) into account. Equation 4.10 describes the Debye model for spheres. Compared to the model of spheres without interaction (equation 4.8) an extra term is added to describe the interparticle correlation (interaction of the scattering particles).
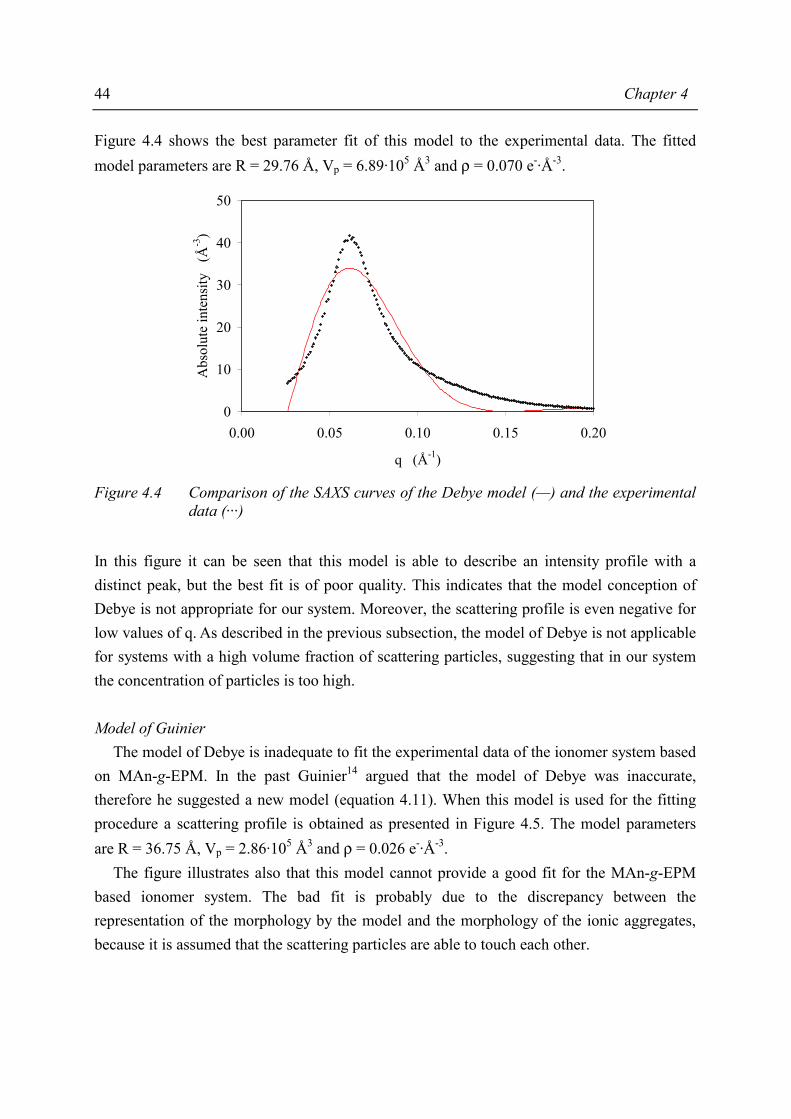
44 Chapter 4
Figure 4.4 shows the best parameter fit of this model to the experimental data. The fitted model parameters are R = 29.76 Å, Vp = 6.89·105 Å3 and ρ = 0.070 e-·Å-3.
0
10
20
30
40
50
0.00 0.05 0.10 0.15 0.20
q (Å-1)
Abs
olut
e in
tens
ity
(Å-3
)
Figure 4.4 Comparison of the SAXS curves of the Debye model (—) and the experimental
data (···) In this figure it can be seen that this model is able to describe an intensity profile with a distinct peak, but the best fit is of poor quality. This indicates that the model conception of Debye is not appropriate for our system. Moreover, the scattering profile is even negative for low values of q. As described in the previous subsection, the model of Debye is not applicable for systems with a high volume fraction of scattering particles, suggesting that in our system the concentration of particles is too high. Model of Guinier The model of Debye is inadequate to fit the experimental data of the ionomer system based on MAn-g-EPM. In the past Guinier14 argued that the model of Debye was inaccurate, therefore he suggested a new model (equation 4.11). When this model is used for the fitting procedure a scattering profile is obtained as presented in Figure 4.5. The model parameters are R = 36.75 Å, Vp = 2.86·105 Å3 and ρ = 0.026 e-·Å-3. The figure illustrates also that this model cannot provide a good fit for the MAn-g-EPM based ionomer system. The bad fit is probably due to the discrepancy between the representation of the morphology by the model and the morphology of the ionic aggregates, because it is assumed that the scattering particles are able to touch each other.
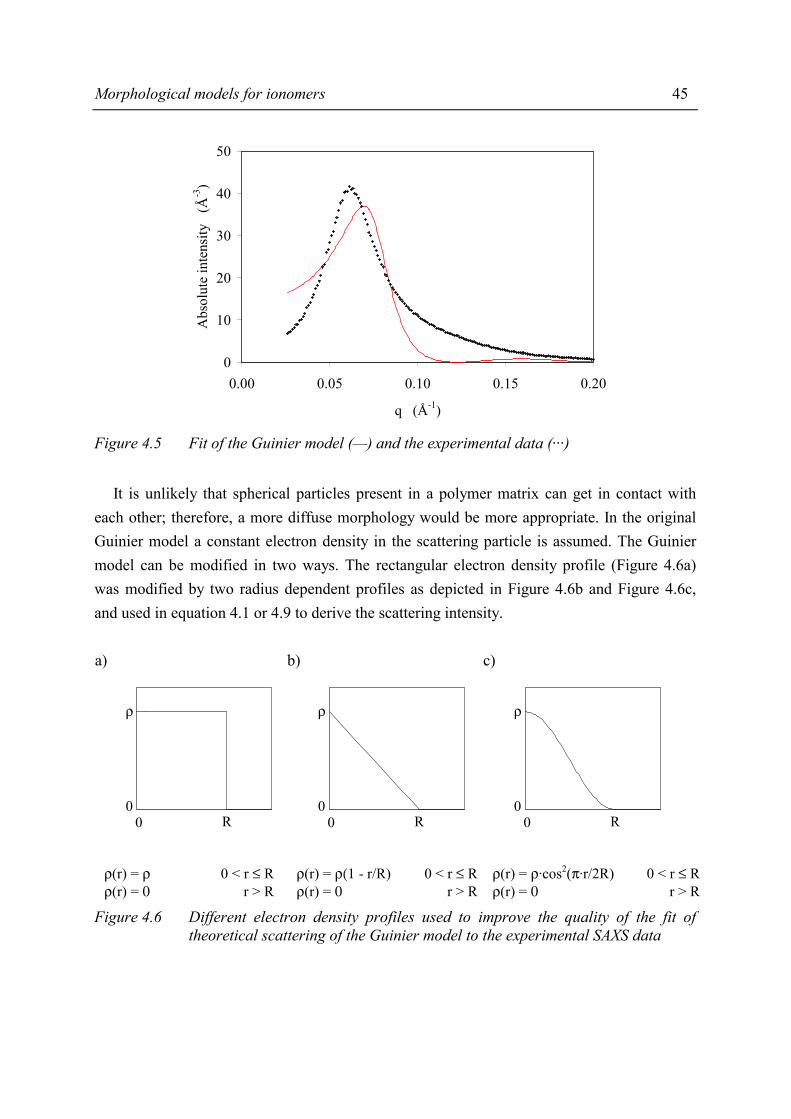
Morphological models for ionomers 45
0
10
20
30
40
50
0.00 0.05 0.10 0.15 0.20
q (Å-1)
Abs
olut
e in
tens
ity
(Å-3
)
Figure 4.5 Fit of the Guinier model (—) and the experimental data (···) It is unlikely that spherical particles present in a polymer matrix can get in contact with each other; therefore, a more diffuse morphology would be more appropriate. In the original Guinier model a constant electron density in the scattering particle is assumed. The Guinier model can be modified in two ways. The rectangular electron density profile (Figure 4.6a) was modified by two radius dependent profiles as depicted in Figure 4.6b and Figure 4.6c, and used in equation 4.1 or 4.9 to derive the scattering intensity. a) b) c)
ρ
R0
0
ρ
R0
0
ρ
R0
0
ρ(r) = ρ 0 < r ≤ R ρ(r) = 0 r > R
ρ(r) = ρ(1 - r/R) 0 < r ≤ R ρ(r) = 0 r > R
ρ(r) = ρ·cos2(π·r/2R) 0 < r ≤ R ρ(r) = 0 r > R
Figure 4.6 Different electron density profiles used to improve the quality of the fit of theoretical scattering of the Guinier model to the experimental SAXS data

46 Chapter 4
When the electron density difference of the scattering particle is allowed to decrease upon increasing radius of the scattering sphere (Figure 4.6b), the modelled scattering profile does not change significantly. The values of R and ρ increase compared to the model with constant electron density (Figure 4.6a). Even a gradually decreasing electron density profile (Figure 4.6c) does not improve the fit of the scattered intensity profile. Yarusso-Cooper model The inconsistency of the Guinier model with the experimental data is probably due to the morphological representation of the Guinier model; it is difficult to imagine that the spheres are able to touch each other. The model as proposed by Yarusso and Cooper is an improved Guinier model that describes spheres of high electron density which are dispersed in a matrix of lower electron density but these spheres are surrounded by a layer of restricted mobility (Figure 4.2). The fit is in very good agreement with the experimental data (see Figure 4.7). The obtained model parameters are R1 = 22.18Å, RCA = 44.79Å, Vp = 5.93·105 Å3 and ρ = 0.100e-·Å-3.
0
10
20
30
40
50
0.00 0.05 0.10 0.15 0.20
q (Å-1)
Abs
olut
e in
tens
ity
(Å-3
)
Figure 4.7 Fit of the Yarusso-Cooper model (—) and the experimental data (···) Modification of the electron density profile on the quality of the fit was also studied for the Yarusso-Cooper model. The effect was clearly visible in the values of R and ρ, but the quality of the fit did not improve significantly.
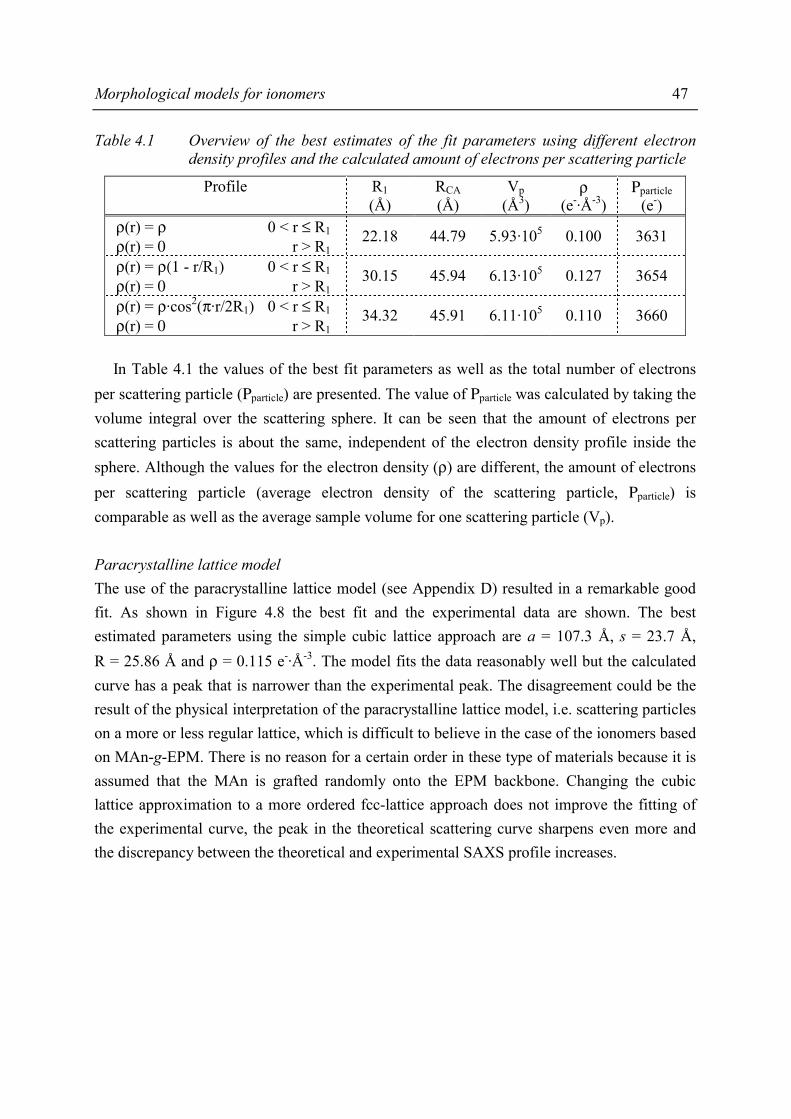
Morphological models for ionomers 47
Table 4.1 Overview of the best estimates of the fit parameters using different electron density profiles and the calculated amount of electrons per scattering particle
Profile R1 RCA Vp ρ Ρparticle (Å) (Å) (Å3) (e-·Å-3) (e-)
ρ(r) = ρ 0 < r ≤ R1 ρ(r) = 0 r > R1
22.18 44.79 5.93·105 0.100 3631
ρ(r) = ρ(1 - r/R1) 0 < r ≤ R1 ρ(r) = 0 r > R1
30.15 45.94 6.13·105 0.127 3654
ρ(r) = ρ·cos2(π·r/2R1) 0 < r ≤ R1 ρ(r) = 0 r > R1
34.32 45.91 6.11·105 0.110 3660
In Table 4.1 the values of the best fit parameters as well as the total number of electrons per scattering particle (Ρparticle) are presented. The value of Ρparticle was calculated by taking the volume integral over the scattering sphere. It can be seen that the amount of electrons per scattering particles is about the same, independent of the electron density profile inside the sphere. Although the values for the electron density (ρ) are different, the amount of electrons per scattering particle (average electron density of the scattering particle, Ρparticle) is comparable as well as the average sample volume for one scattering particle (Vp). Paracrystalline lattice model The use of the paracrystalline lattice model (see Appendix D) resulted in a remarkable good fit. As shown in Figure 4.8 the best fit and the experimental data are shown. The best estimated parameters using the simple cubic lattice approach are a = 107.3 Å, s = 23.7 Å, R = 25.86 Å and ρ = 0.115 e-·Å-3. The model fits the data reasonably well but the calculated curve has a peak that is narrower than the experimental peak. The disagreement could be the result of the physical interpretation of the paracrystalline lattice model, i.e. scattering particles on a more or less regular lattice, which is difficult to believe in the case of the ionomers based on MAn-g-EPM. There is no reason for a certain order in these type of materials because it is assumed that the MAn is grafted randomly onto the EPM backbone. Changing the cubic lattice approximation to a more ordered fcc-lattice approach does not improve the fitting of the experimental curve, the peak in the theoretical scattering curve sharpens even more and the discrepancy between the theoretical and experimental SAXS profile increases.

48 Chapter 4
0
10
20
30
40
50
0.00 0.05 0.10 0.15 0.20
q (Å-1)
Abs
olut
e in
tens
ity
(Å-3
)
Figure 4.8 Fit of the paracrystalline lattice model (—) and the experimental data (···)
4.3.3 The model and fitting procedure
In the previous section, different models were used to fit the experimental data. The Yarusso and Cooper model provided the best fit for the MAN-g-EPM based ionomers. Since the model has four adaptable fit parameters, i.e. R1, RCA, Vp and ρ, correlation may exist between the parameters. In this section, the fitting procedure will be discussed in more detail to get more insight in possible correlations between the parameter and the influence of the individual parameters on the peak profile. SAS software (Statistical Analysis System, SAS-Institute Inc., Cary, North-Carolina, USA) was used to fit the model to the experimental data. By using this package the best-fit values of the four model parameters were found by a non-linear least squares fitting procedure. The Newton-Gauss method was used for numerical stability and fast convergence. An estimation of the best-fit parameter value set is obtained as well as the number of iterations necessary for convergence. In addition, the uncertainty of each best-fit parameter value is given by a 95% confidence interval (Table 4.2).
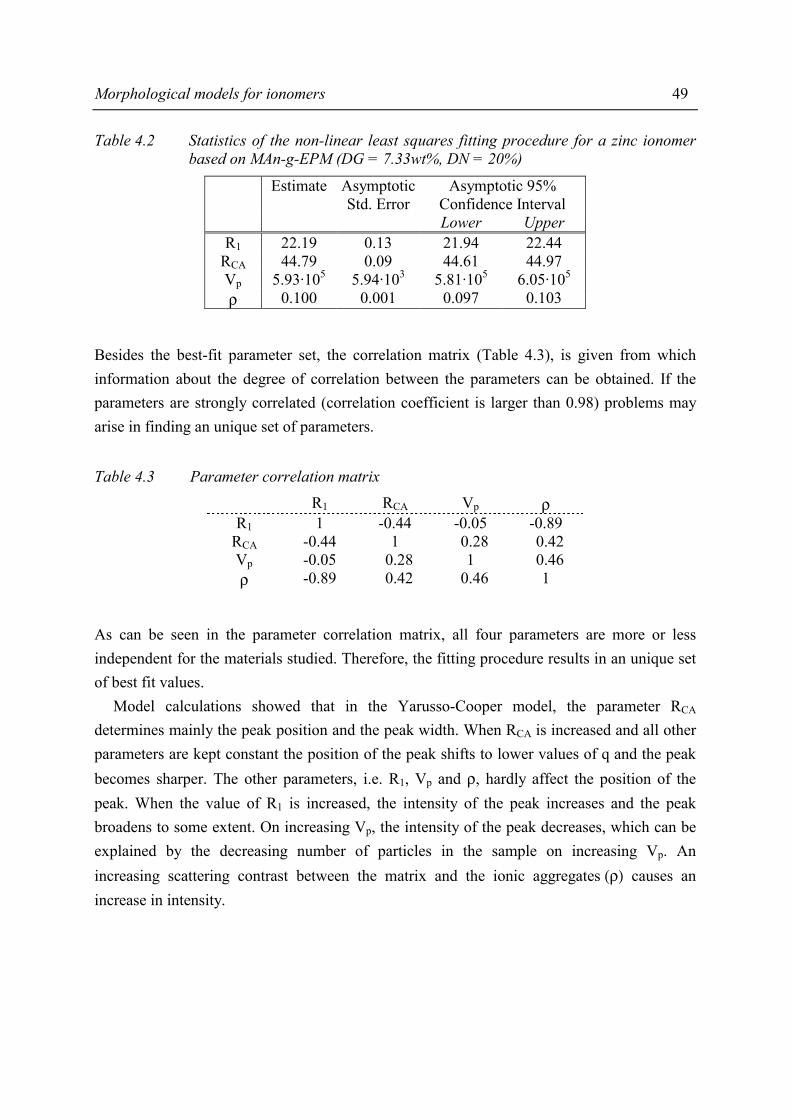
Morphological models for ionomers 49
Table 4.2 Statistics of the non-linear least squares fitting procedure for a zinc ionomer based on MAn-g-EPM (DG = 7.33wt%, DN = 20%)
Estimate Asymptotic Std. Error
Asymptotic 95% Confidence Interval
Lower Upper R1 22.19 0.13 21.94 22.44
RCA 44.79 0.09 44.61 44.97 Vp 5.93·105 5.94·103 5.81·105 6.05·105 ρ 0.100 0.001 0.097 0.103
Besides the best-fit parameter set, the correlation matrix (Table 4.3), is given from which information about the degree of correlation between the parameters can be obtained. If the parameters are strongly correlated (correlation coefficient is larger than 0.98) problems may arise in finding an unique set of parameters.
Table 4.3 Parameter correlation matrix R1 RCA Vp ρ
R1 1 -0.44 -0.05 -0.89 RCA -0.44 1 0.28 0.42 Vp -0.05 0.28 1 0.46 ρ -0.89 0.42 0.46 1
As can be seen in the parameter correlation matrix, all four parameters are more or less independent for the materials studied. Therefore, the fitting procedure results in an unique set of best fit values. Model calculations showed that in the Yarusso-Cooper model, the parameter RCA determines mainly the peak position and the peak width. When RCA is increased and all other parameters are kept constant the position of the peak shifts to lower values of q and the peak becomes sharper. The other parameters, i.e. R1, Vp and ρ, hardly affect the position of the peak. When the value of R1 is increased, the intensity of the peak increases and the peak broadens to some extent. On increasing Vp, the intensity of the peak decreases, which can be explained by the decreasing number of particles in the sample on increasing Vp. An increasing scattering contrast between the matrix and the ionic aggregates (ρ) causes an increase in intensity.
50 Chapter 4
For all recorded SAXS profiles of the ionomers and ionomer precursors studied the fitting procedure was performed to gain insight in the effect of the various compositional variables on the dimensions (R1 and RCA) of the scattering particles. The amount of scattering particles can be deduced from the average sample volume per scattering particle (Vp). The number of scattering particles per unit volume in the sample equals Vp
-1. Assuming that all grafted MAn units are phase separated from the EPM matrix, which is plausible based on polarity differences, the value of the electron density difference of the scattering particle with the EPM matrix (ρ) can provide information about the composition of the scattering particle.
4.4 Conclusions In this chapter different types of morphological models were discussed. There are two types of models that attribute the ionomer SAXS peak to an interparticle interference and that are able to describe the ionomer morphology. These two models are the paracrystalline lattice model9,12 and the liquid-like interference models12,14,15. The paracrystalline lattice model is not suitable for the ionomer systems studied. The shape of the theoretical SAXS peak is not correct; the experimental scattering profile is not as sharp as the theoretical peak. The actual order that exists can be modelled more accurately with the approach of the liquid-like ordering. Of the existing liquid-like interference models discussed in literature the morphological concept described by the Yarusso-Cooper model fitted very well to the experimentally determined SAXS profiles. According to this model the morphology of the ionomers can be described by spherical ionic aggregates of high electron density surrounded by a layer of restricted mobility embedded in a matrix. The electron density of the restricted mobility layer is similar to the electron density of the matrix. The peak position of the ’ionic peak’ in the systems of the MAn-g-EPM based ionomers is different from the systems described in literature. For ethylene-methacrylic acid copolymer based ionomers the ‘ionic peak’ is observed at q-values of approximately 0.30 Å-1. The peak of sulphonated styrene based ionomers is located at approximately 0.15 Å-1. The peak position of the MAn-g-EPM based ionomers shifted to lower q-values of approximately 0.05 Å-1. Regarding the good fit results for the MAn-g-EPM ionomers, and the results Yarusso and Cooper for sulphonated polystyrene ionomers12, the concept of Yarusso and Cooper seems to be quite satisfactory for the description of the scattering profile of random ionomers. Moreover, the trends observed by Yarusso and Cooper for molecular weight or ion content variation correspond to our data.

Morphological models for ionomers 51
4.5 References 1. Eisenberg, A., Macromolecules 3, 147 (1970) 2. Dreyfus, B., Macromolecules 18, 284 (1985) 3. MacKnight, W.J. and Earnest, T.R., J. Polym. Sci., Macromol. Rev. 16, 41 (1981) 4. Eisenberg, A. and King, M., “Ion-Containing Polymers”; Academic Press: New York, 1977 5. Wilson, F.C., Longworth, R. and Vaughan, D.J., Polym. Prepr. Am. Chem. Soc., Div. Polym.
Chem. 9, 505 (1968) 6. Longworth R. and Vaughan, D., Nature 18, 85 (1968) 7. Bonotto, S. and Bonner, E.F., Macromolecules 1, 510 (1968) 8. Delf, B.W. and MacKnight, W.J., Macromolecules 2, 309 (1969) 9. Marx, C., Caulfield, D. and Cooper, S., Macromolecules 6, 344 (1973) 10. Binsbergen, F.L. and Kroon, G.F., Macromolecules 6, 145 (1973) 11. MacKnight, W.J., Taggert, W. and Stein, R., J. Polym. Sci., Symp. 45, 113 (1974) 12. Yarusso, D.J. and Cooper, S.L., Macromolecules 16, 1871 (1983) 13. Moore, R.B., Brittencourt, D., Gauthier, M., Williams, C.E. and Eisenberg, A., Macromolecules
24, 1376 (1991) 14. Guiner, A. and Fournet, G., “Small Angle Scattering of X-rays”, Wiley: New York, 1955 15. Debye, P., Phys. Z. 28, 135 (1927) 16. Fournet, G., Acta Crystallogr. 4, 293 (1951) 17. Born, M., and Green, H.S., Proc. Roy. Soc. London A-188, 10 (1946) 18. Matsuoka, H., Tanaka, H., Hashimoto, T. and Ise, N., Phys. Rev. B 36, 1754 (1987) 19. Hashimoto, T., Kawamura, T., Harada, M., and Tanaka, H., Macromolecules 27, 3063 (1994)

52 Chapter 4
Chapter 5
Morphology of MAn-g-EPM based ionomers
5.1 Introduction In the previous chapter various morphological models were evaluated in order to interpret the experimentally obtained SAXS data of the MAn-g-EPM based ionomers. From the available structural models discussed in literature the Yarusso-Cooper model agreed best with the proposed ionomer structure of the MAn-g-EPM systems. Moreover, the model fitted very well to the experimentally determined SAXS profiles. In this chapter the ionomer morphology will be elucidated using different characterisation techniques. The goal is to depict the ionomer morphology indicating size, shape and spatial arrangement of these ionic aggregates. For this purpose some well-developed techniques were used to elucidate the ionomer structure of the ionomers synthesised for this study. It is generally accepted that in ionomers the ionic groups form small aggregates. The reason for aggregate formation in ionomers will be discussed in section 5.2. In section 5.3 SAXS data are used in combination with the structural model of Yarusso and Cooper to obtain information about the size and composition of the ionic aggregates. To support the morphological model of Yarusso and Cooper and to obtain information about the mobility differences in the ionomer network, solid state NMR was used. Solid-state Nuclear Magnetic Resonance (NMR) is a powerful technique able to distinguish between regions of different mobility in polymer networks. The results of this characterisation technique are discussed in section 5.4. In section 5.5 the visualisation of the aggregates of ionic groups by means of Transmission Electron Microscopy (TEM) is described. In this chapter the effect of ionomer composition (degree of grafting, degree of neutralisation, type of cation and molecular weight of the parent EPM) on the morphology of the resulting ionomers will be discussed. These results may provide some insight in the effects of variation of compositional parameters on the material properties.
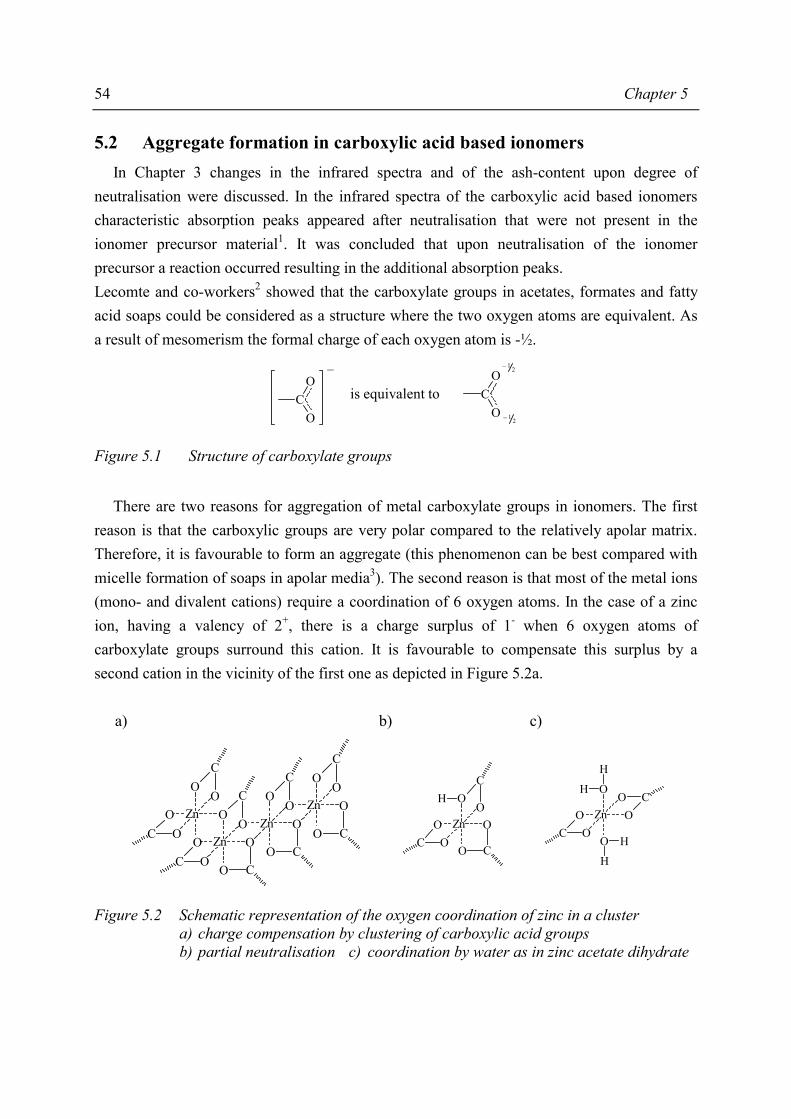
54 Chapter 5
5.2 Aggregate formation in carboxylic acid based ionomers In Chapter 3 changes in the infrared spectra and of the ash-content upon degree of neutralisation were discussed. In the infrared spectra of the carboxylic acid based ionomers characteristic absorption peaks appeared after neutralisation that were not present in the ionomer precursor material1. It was concluded that upon neutralisation of the ionomer precursor a reaction occurred resulting in the additional absorption peaks. Lecomte and co-workers2 showed that the carboxylate groups in acetates, formates and fatty acid soaps could be considered as a structure where the two oxygen atoms are equivalent. As a result of mesomerism the formal charge of each oxygen atom is -½.
CO
O_
is equivalent to CO
O1 2
_
1 2_
Figure 5.1 Structure of carboxylate groups There are two reasons for aggregation of metal carboxylate groups in ionomers. The first reason is that the carboxylic groups are very polar compared to the relatively apolar matrix. Therefore, it is favourable to form an aggregate (this phenomenon can be best compared with micelle formation of soaps in apolar media3). The second reason is that most of the metal ions (mono- and divalent cations) require a coordination of 6 oxygen atoms. In the case of a zinc ion, having a valency of 2+, there is a charge surplus of 1- when 6 oxygen atoms of carboxylate groups surround this cation. It is favourable to compensate this surplus by a second cation in the vicinity of the first one as depicted in Figure 5.2a.
a) b) c)
ZnO
CO
O C
O
O C
OO
CO
ZnZn
O
CO
OC O
O C
O
ZnO
CO
OC O
ZnO
COH
OC O
O C
O
Zn
OH
H
OC O
O
H
H
OCO
Figure 5.2 Schematic representation of the oxygen coordination of zinc in a cluster a) charge compensation by clustering of carboxylic acid groups b) partial neutralisation c) coordination by water as in zinc acetate dihydrate
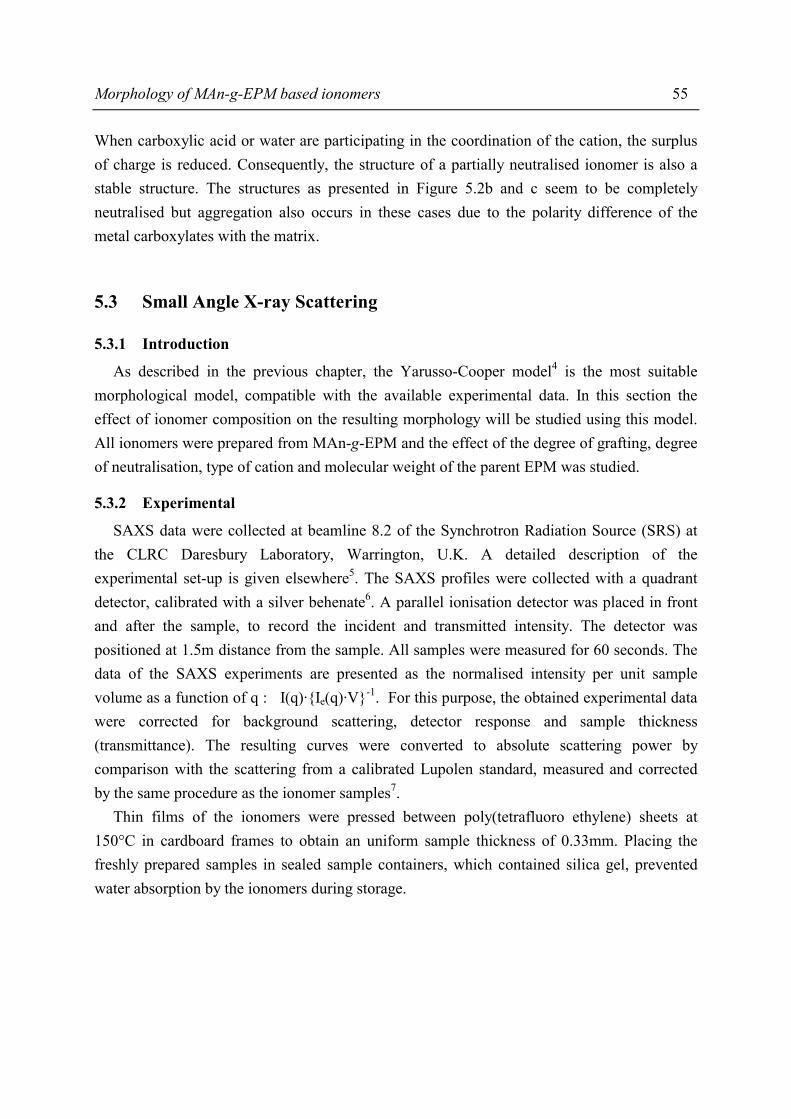
Morphology of MAn-g-EPM based ionomers 55
When carboxylic acid or water are participating in the coordination of the cation, the surplus of charge is reduced. Consequently, the structure of a partially neutralised ionomer is also a stable structure. The structures as presented in Figure 5.2b and c seem to be completely neutralised but aggregation also occurs in these cases due to the polarity difference of the metal carboxylates with the matrix.
5.3 Small Angle X-ray Scattering
5.3.1 Introduction
As described in the previous chapter, the Yarusso-Cooper model4 is the most suitable morphological model, compatible with the available experimental data. In this section the effect of ionomer composition on the resulting morphology will be studied using this model. All ionomers were prepared from MAn-g-EPM and the effect of the degree of grafting, degree of neutralisation, type of cation and molecular weight of the parent EPM was studied.
5.3.2 Experimental
SAXS data were collected at beamline 8.2 of the Synchrotron Radiation Source (SRS) at the CLRC Daresbury Laboratory, Warrington, U.K. A detailed description of the experimental set-up is given elsewhere5. The SAXS profiles were collected with a quadrant detector, calibrated with a silver behenate6. A parallel ionisation detector was placed in front and after the sample, to record the incident and transmitted intensity. The detector was positioned at 1.5m distance from the sample. All samples were measured for 60 seconds. The data of the SAXS experiments are presented as the normalised intensity per unit sample volume as a function of q : I(q)·Ie(q)·V-1. For this purpose, the obtained experimental data were corrected for background scattering, detector response and sample thickness (transmittance). The resulting curves were converted to absolute scattering power by comparison with the scattering from a calibrated Lupolen standard, measured and corrected by the same procedure as the ionomer samples7. Thin films of the ionomers were pressed between poly(tetrafluoro ethylene) sheets at 150°C in cardboard frames to obtain an uniform sample thickness of 0.33mm. Placing the freshly prepared samples in sealed sample containers, which contained silica gel, prevented water absorption by the ionomers during storage.
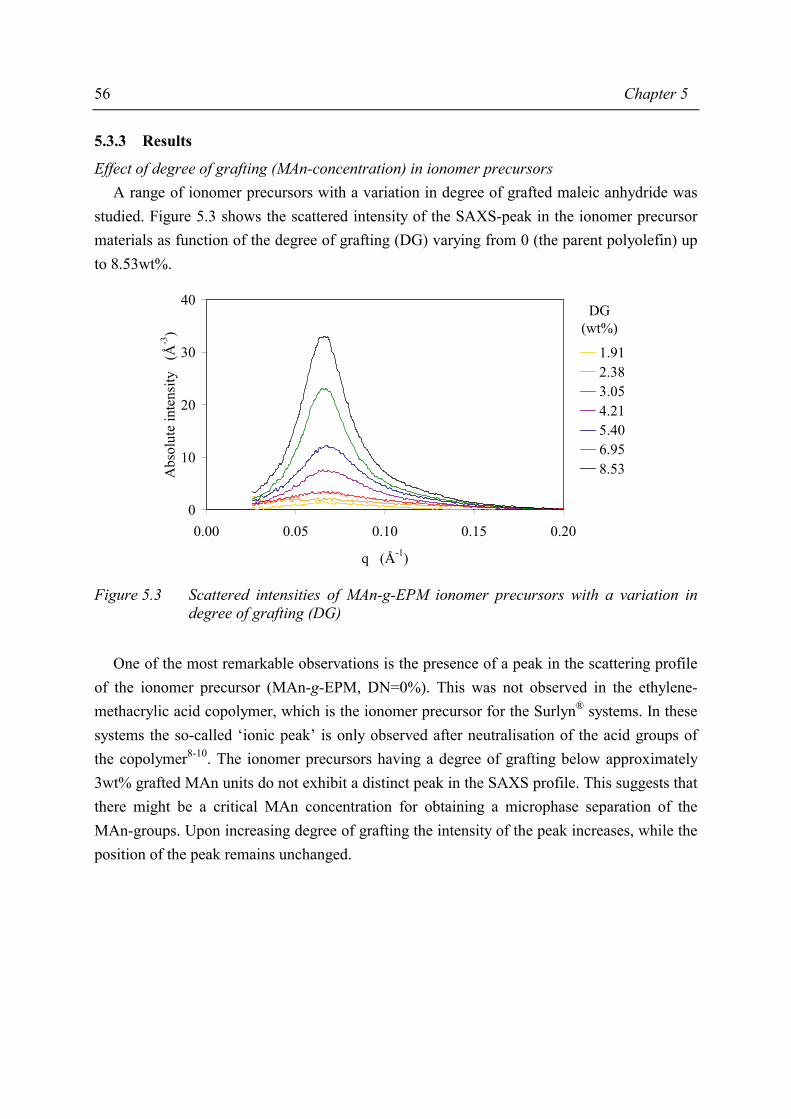
56 Chapter 5
5.3.3 Results
Effect of degree of grafting (MAn-concentration) in ionomer precursors A range of ionomer precursors with a variation in degree of grafted maleic anhydride was studied. Figure 5.3 shows the scattered intensity of the SAXS-peak in the ionomer precursor materials as function of the degree of grafting (DG) varying from 0 (the parent polyolefin) up to 8.53wt%.
0
10
20
30
40
0.00 0.05 0.10 0.15 0.20
q (Å-1)
Abs
olut
e in
tens
ity
(Å-3
)
1.912.383.054.215.406.958.53
DG (wt%)
Figure 5.3 Scattered intensities of MAn-g-EPM ionomer precursors with a variation in
degree of grafting (DG) One of the most remarkable observations is the presence of a peak in the scattering profile of the ionomer precursor (MAn-g-EPM, DN=0%). This was not observed in the ethylene-methacrylic acid copolymer, which is the ionomer precursor for the Surlyn® systems. In these systems the so-called ‘ionic peak’ is only observed after neutralisation of the acid groups of the copolymer8-10. The ionomer precursors having a degree of grafting below approximately 3wt% grafted MAn units do not exhibit a distinct peak in the SAXS profile. This suggests that there might be a critical MAn concentration for obtaining a microphase separation of the MAn-groups. Upon increasing degree of grafting the intensity of the peak increases, while the position of the peak remains unchanged.
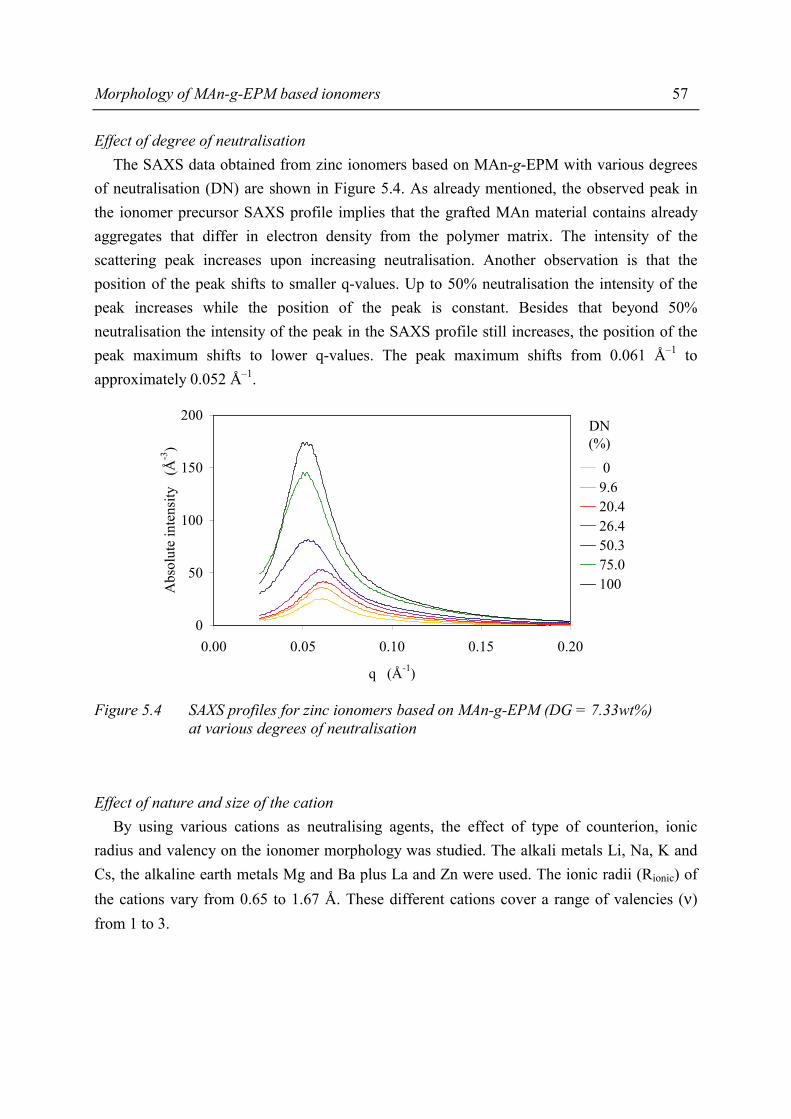
Morphology of MAn-g-EPM based ionomers 57
Effect of degree of neutralisation The SAXS data obtained from zinc ionomers based on MAn-g-EPM with various degrees of neutralisation (DN) are shown in Figure 5.4. As already mentioned, the observed peak in the ionomer precursor SAXS profile implies that the grafted MAn material contains already aggregates that differ in electron density from the polymer matrix. The intensity of the scattering peak increases upon increasing neutralisation. Another observation is that the position of the peak shifts to smaller q-values. Up to 50% neutralisation the intensity of the peak increases while the position of the peak is constant. Besides that beyond 50% neutralisation the intensity of the peak in the SAXS profile still increases, the position of the peak maximum shifts to lower q-values. The peak maximum shifts from 0.061 Å–1 to approximately 0.052 Å–1.
0
50
100
150
200
0.00 0.05 0.10 0.15 0.20
q (Å-1)
Abs
olut
e in
tens
ity
(Å-3
)
09.620.426.450.375.0100
DN (%)
Figure 5.4 SAXS profiles for zinc ionomers based on MAn-g-EPM (DG = 7.33wt%)
at various degrees of neutralisation Effect of nature and size of the cation By using various cations as neutralising agents, the effect of type of counterion, ionic radius and valency on the ionomer morphology was studied. The alkali metals Li, Na, K and Cs, the alkaline earth metals Mg and Ba plus La and Zn were used. The ionic radii (Rionic) of the cations vary from 0.65 to 1.67 Å. These different cations cover a range of valencies (ν) from 1 to 3.
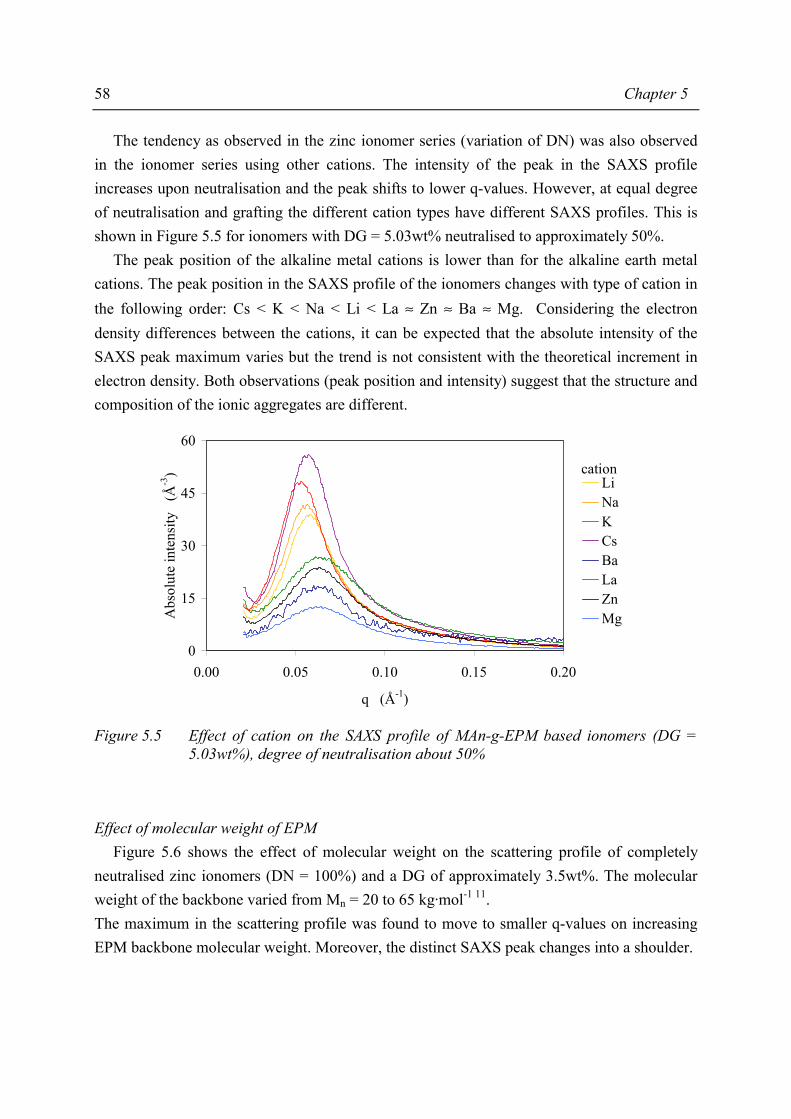
58 Chapter 5
The tendency as observed in the zinc ionomer series (variation of DN) was also observed in the ionomer series using other cations. The intensity of the peak in the SAXS profile increases upon neutralisation and the peak shifts to lower q-values. However, at equal degree of neutralisation and grafting the different cation types have different SAXS profiles. This is shown in Figure 5.5 for ionomers with DG = 5.03wt% neutralised to approximately 50%. The peak position of the alkaline metal cations is lower than for the alkaline earth metal cations. The peak position in the SAXS profile of the ionomers changes with type of cation in the following order: Cs < K < Na < Li < La ≈ Zn ≈ Ba ≈ Mg. Considering the electron density differences between the cations, it can be expected that the absolute intensity of the SAXS peak maximum varies but the trend is not consistent with the theoretical increment in electron density. Both observations (peak position and intensity) suggest that the structure and composition of the ionic aggregates are different.
0
15
30
45
60
0.00 0.05 0.10 0.15 0.20
q (Å-1)
Abs
olut
e in
tens
ity
(Å-3
)
LiNaKCsBaLaZnMg
cation
Figure 5.5 Effect of cation on the SAXS profile of MAn-g-EPM based ionomers (DG =
5.03wt%), degree of neutralisation about 50% Effect of molecular weight of EPM Figure 5.6 shows the effect of molecular weight on the scattering profile of completely neutralised zinc ionomers (DN = 100%) and a DG of approximately 3.5wt%. The molecular weight of the backbone varied from Mn = 20 to 65 kg·mol-1 11. The maximum in the scattering profile was found to move to smaller q-values on increasing EPM backbone molecular weight. Moreover, the distinct SAXS peak changes into a shoulder.
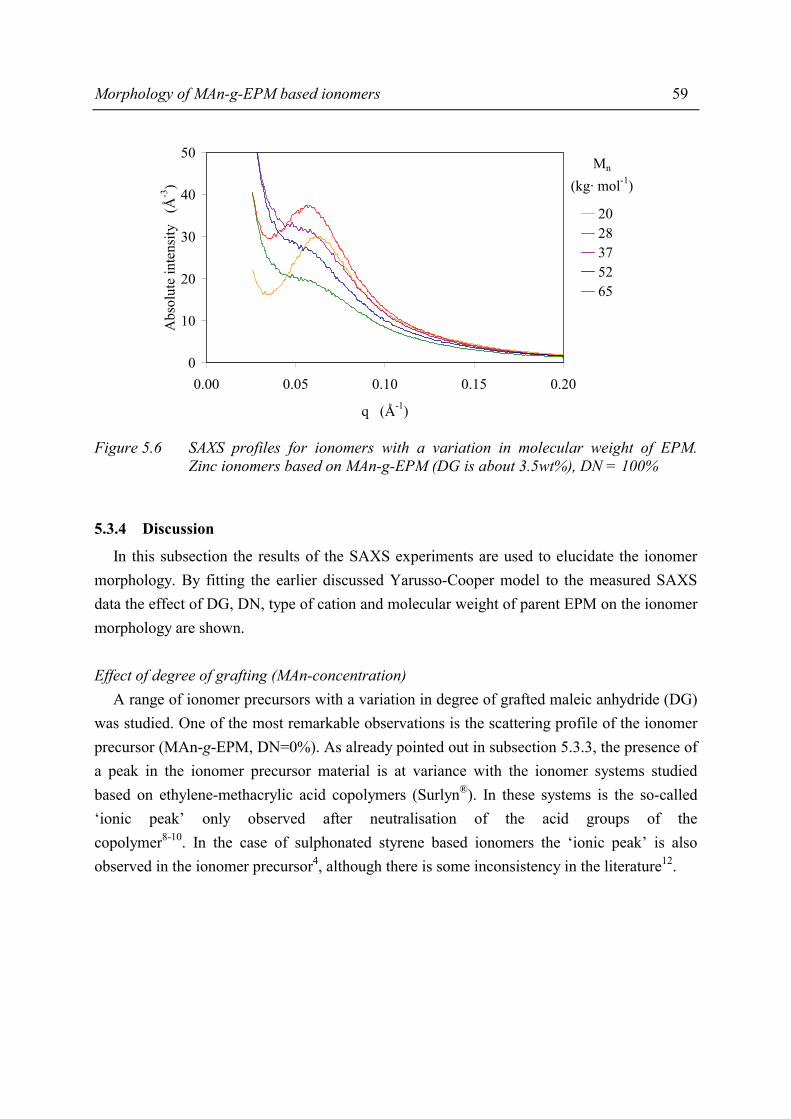
Morphology of MAn-g-EPM based ionomers 59
0
10
20
30
40
50
0.00 0.05 0.10 0.15 0.20
q (Å-1)
Abs
olut
e in
tens
ity
(Å-3
)
2028375265
Mn
(kg· mol-1)
Figure 5.6 SAXS profiles for ionomers with a variation in molecular weight of EPM.
Zinc ionomers based on MAn-g-EPM (DG is about 3.5wt%), DN = 100%
5.3.4 Discussion
In this subsection the results of the SAXS experiments are used to elucidate the ionomer morphology. By fitting the earlier discussed Yarusso-Cooper model to the measured SAXS data the effect of DG, DN, type of cation and molecular weight of parent EPM on the ionomer morphology are shown. Effect of degree of grafting (MAn-concentration) A range of ionomer precursors with a variation in degree of grafted maleic anhydride (DG) was studied. One of the most remarkable observations is the scattering profile of the ionomer precursor (MAn-g-EPM, DN=0%). As already pointed out in subsection 5.3.3, the presence of a peak in the ionomer precursor material is at variance with the ionomer systems studied based on ethylene-methacrylic acid copolymers (Surlyn®). In these systems is the so-called ‘ionic peak’ only observed after neutralisation of the acid groups of the copolymer8-10. In the case of sulphonated styrene based ionomers the ‘ionic peak’ is also observed in the ionomer precursor4, although there is some inconsistency in the literature12.
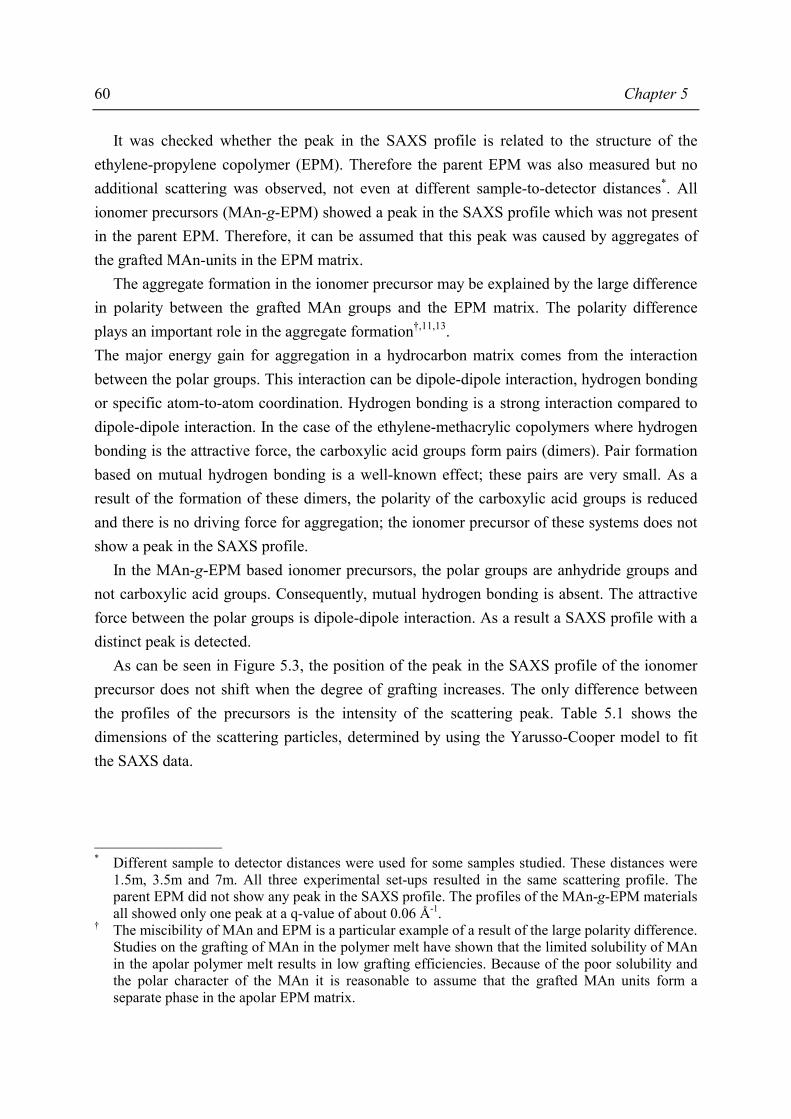
60 Chapter 5
It was checked whether the peak in the SAXS profile is related to the structure of the ethylene-propylene copolymer (EPM). Therefore the parent EPM was also measured but no additional scattering was observed, not even at different sample-to-detector distances*. All ionomer precursors (MAn-g-EPM) showed a peak in the SAXS profile which was not present in the parent EPM. Therefore, it can be assumed that this peak was caused by aggregates of the grafted MAn-units in the EPM matrix. The aggregate formation in the ionomer precursor may be explained by the large difference in polarity between the grafted MAn groups and the EPM matrix. The polarity difference plays an important role in the aggregate formation†,11,13. The major energy gain for aggregation in a hydrocarbon matrix comes from the interaction between the polar groups. This interaction can be dipole-dipole interaction, hydrogen bonding or specific atom-to-atom coordination. Hydrogen bonding is a strong interaction compared to dipole-dipole interaction. In the case of the ethylene-methacrylic copolymers where hydrogen bonding is the attractive force, the carboxylic acid groups form pairs (dimers). Pair formation based on mutual hydrogen bonding is a well-known effect; these pairs are very small. As a result of the formation of these dimers, the polarity of the carboxylic acid groups is reduced and there is no driving force for aggregation; the ionomer precursor of these systems does not show a peak in the SAXS profile. In the MAn-g-EPM based ionomer precursors, the polar groups are anhydride groups and not carboxylic acid groups. Consequently, mutual hydrogen bonding is absent. The attractive force between the polar groups is dipole-dipole interaction. As a result a SAXS profile with a distinct peak is detected. As can be seen in Figure 5.3, the position of the peak in the SAXS profile of the ionomer precursor does not shift when the degree of grafting increases. The only difference between the profiles of the precursors is the intensity of the scattering peak. Table 5.1 shows the dimensions of the scattering particles, determined by using the Yarusso-Cooper model to fit the SAXS data.
________________ * Different sample to detector distances were used for some samples studied. These distances were
1.5m, 3.5m and 7m. All three experimental set-ups resulted in the same scattering profile. The parent EPM did not show any peak in the SAXS profile. The profiles of the MAn-g-EPM materials all showed only one peak at a q-value of about 0.06 Å-1.
† The miscibility of MAn and EPM is a particular example of a result of the large polarity difference. Studies on the grafting of MAn in the polymer melt have shown that the limited solubility of MAn in the apolar polymer melt results in low grafting efficiencies. Because of the poor solubility and the polar character of the MAn it is reasonable to assume that the grafted MAn units form a separate phase in the apolar EPM matrix.
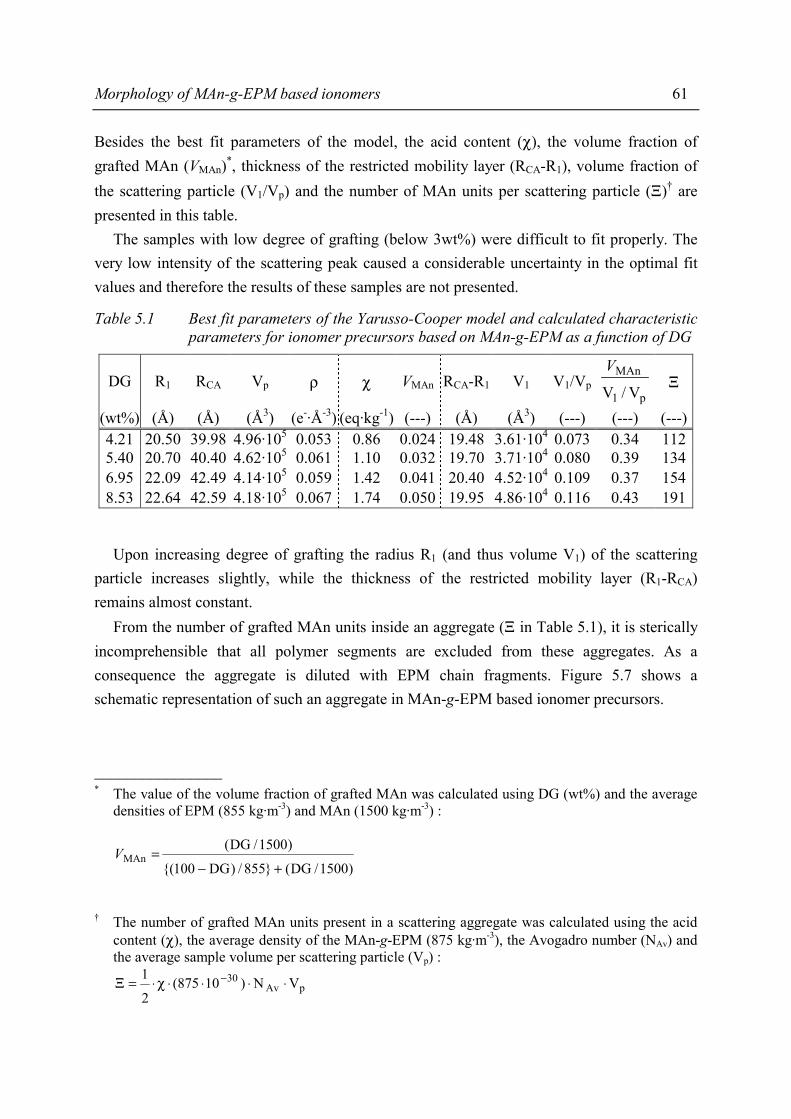
Morphology of MAn-g-EPM based ionomers 61
Besides the best fit parameters of the model, the acid content (χ), the volume fraction of grafted MAn (VMAn)*, thickness of the restricted mobility layer (RCA-R1), volume fraction of the scattering particle (V1/Vp) and the number of MAn units per scattering particle (Ξ)† are presented in this table. The samples with low degree of grafting (below 3wt%) were difficult to fit properly. The very low intensity of the scattering peak caused a considerable uncertainty in the optimal fit values and therefore the results of these samples are not presented.
Table 5.1 Best fit parameters of the Yarusso-Cooper model and calculated characteristic parameters for ionomer precursors based on MAn-g-EPM as a function of DG
DG R1 RCA Vp ρ χ VMAn RCA-R1 V1 V1/Vpp1
MAn
V/V
V Ξ
(wt%) (Å) (Å) (Å3) (e-·Å-3) (eq·kg-1) (---) (Å) (Å3) (---) (---) (---)4.21 20.50 39.98 4.96·105 0.053 0.86 0.024 19.48 3.61·104 0.073 0.34 1125.40 20.70 40.40 4.62·105 0.061 1.10 0.032 19.70 3.71·104 0.080 0.39 1346.95 22.09 42.49 4.14·105 0.059 1.42 0.041 20.40 4.52·104 0.109 0.37 1548.53 22.64 42.59 4.18·105 0.067 1.74 0.050 19.95 4.86·104 0.116 0.43 191
Upon increasing degree of grafting the radius R1 (and thus volume V1) of the scattering particle increases slightly, while the thickness of the restricted mobility layer (R1-RCA) remains almost constant. From the number of grafted MAn units inside an aggregate (Ξ in Table 5.1), it is sterically incomprehensible that all polymer segments are excluded from these aggregates. As a consequence the aggregate is diluted with EPM chain fragments. Figure 5.7 shows a schematic representation of such an aggregate in MAn-g-EPM based ionomer precursors.
________________ * The value of the volume fraction of grafted MAn was calculated using DG (wt%) and the average
densities of EPM (855 kg·m-3) and MAn (1500 kg·m-3) :
)1500/DG(855/)DG100(
)1500/DG(MAn
+−=V
† The number of grafted MAn units present in a scattering aggregate was calculated using the acid
content (χ), the average density of the MAn-g-EPM (875 kg·m-3), the Avogadro number (NAv) and the average sample volume per scattering particle (Vp) :
pAv30 VN)10875(
2
1 ⋅⋅⋅⋅χ⋅=Ξ −
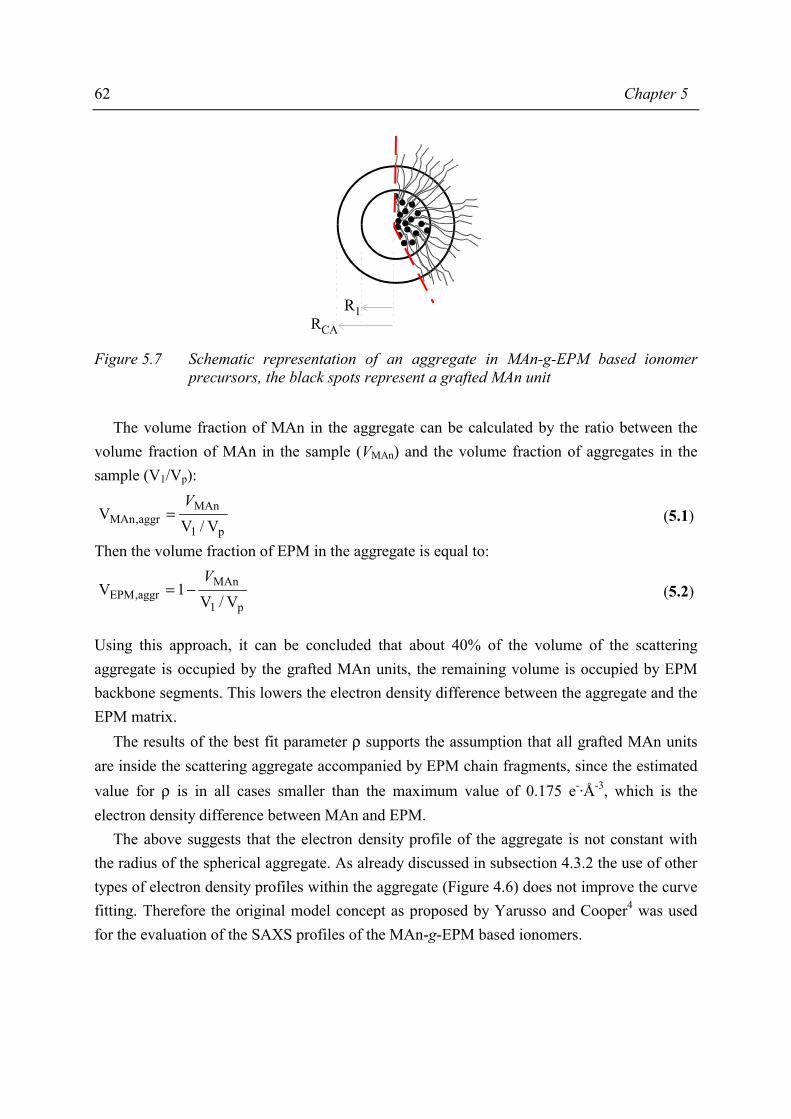
62 Chapter 5
Figure 5.7 Schematic representation of an aggregate in MAn-g-EPM based ionomer
precursors, the black spots represent a grafted MAn unit The volume fraction of MAn in the aggregate can be calculated by the ratio between the volume fraction of MAn in the sample (VMAn) and the volume fraction of aggregates in the sample (V1/Vp):
p1
MAnaggr,MAn V/V
VV
= (5.1)
Then the volume fraction of EPM in the aggregate is equal to:
p1
MAnaggr,EPM V/V
1VV
−= (5.2)
Using this approach, it can be concluded that about 40% of the volume of the scattering aggregate is occupied by the grafted MAn units, the remaining volume is occupied by EPM backbone segments. This lowers the electron density difference between the aggregate and the EPM matrix. The results of the best fit parameter ρ supports the assumption that all grafted MAn units are inside the scattering aggregate accompanied by EPM chain fragments, since the estimated value for ρ is in all cases smaller than the maximum value of 0.175 e-·Å-3, which is the electron density difference between MAn and EPM. The above suggests that the electron density profile of the aggregate is not constant with the radius of the spherical aggregate. As already discussed in subsection 4.3.2 the use of other types of electron density profiles within the aggregate (Figure 4.6) does not improve the curve fitting. Therefore the original model concept as proposed by Yarusso and Cooper4 was used for the evaluation of the SAXS profiles of the MAn-g-EPM based ionomers.
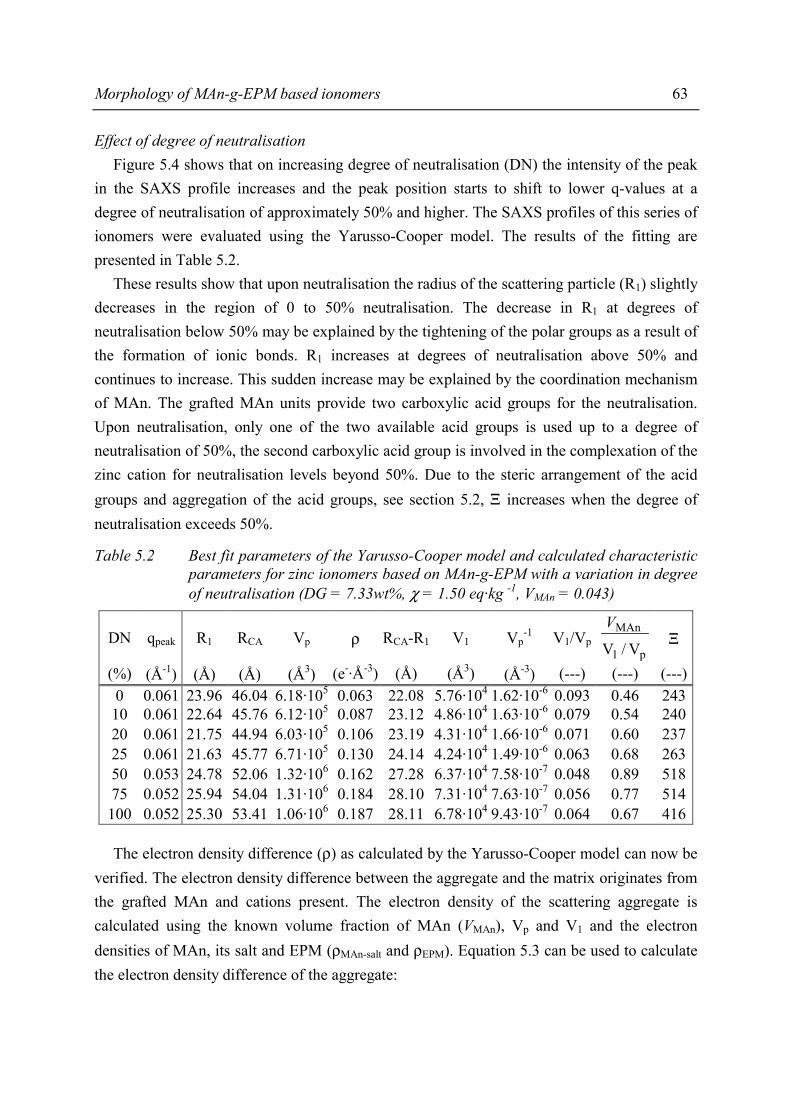
Morphology of MAn-g-EPM based ionomers 63
Effect of degree of neutralisation Figure 5.4 shows that on increasing degree of neutralisation (DN) the intensity of the peak in the SAXS profile increases and the peak position starts to shift to lower q-values at a degree of neutralisation of approximately 50% and higher. The SAXS profiles of this series of ionomers were evaluated using the Yarusso-Cooper model. The results of the fitting are presented in Table 5.2. These results show that upon neutralisation the radius of the scattering particle (R1) slightly decreases in the region of 0 to 50% neutralisation. The decrease in R1 at degrees of neutralisation below 50% may be explained by the tightening of the polar groups as a result of the formation of ionic bonds. R1 increases at degrees of neutralisation above 50% and continues to increase. This sudden increase may be explained by the coordination mechanism of MAn. The grafted MAn units provide two carboxylic acid groups for the neutralisation. Upon neutralisation, only one of the two available acid groups is used up to a degree of neutralisation of 50%, the second carboxylic acid group is involved in the complexation of the zinc cation for neutralisation levels beyond 50%. Due to the steric arrangement of the acid groups and aggregation of the acid groups, see section 5.2, Ξ increases when the degree of neutralisation exceeds 50%.
Table 5.2 Best fit parameters of the Yarusso-Cooper model and calculated characteristic parameters for zinc ionomers based on MAn-g-EPM with a variation in degree of neutralisation (DG = 7.33wt%, χ = 1.50 eq·kg -1, VMAn = 0.043)
DN qpeak R1 RCA Vp ρ RCA-R1 V1 Vp-1 V1/Vp
p1
MAn
V/V
V Ξ
(%) (Å-1) (Å) (Å) (Å3) (e-·Å-3) (Å) (Å3) (Å-3) (---) (---) (---)0 0.061 23.96 46.04 6.18·105 0.063 22.08 5.76·104 1.62·10-6 0.093 0.46 243
10 0.061 22.64 45.76 6.12·105 0.087 23.12 4.86·104 1.63·10-6 0.079 0.54 24020 0.061 21.75 44.94 6.03·105 0.106 23.19 4.31·104 1.66·10-6 0.071 0.60 23725 0.061 21.63 45.77 6.71·105 0.130 24.14 4.24·104 1.49·10-6 0.063 0.68 26350 0.053 24.78 52.06 1.32·106 0.162 27.28 6.37·104 7.58·10-7 0.048 0.89 51875 0.052 25.94 54.04 1.31·106 0.184 28.10 7.31·104 7.63·10-7 0.056 0.77 514
100 0.052 25.30 53.41 1.06·106 0.187 28.11 6.78·104 9.43·10-7 0.064 0.67 416 The electron density difference (ρ) as calculated by the Yarusso-Cooper model can now be verified. The electron density difference between the aggregate and the matrix originates from the grafted MAn and cations present. The electron density of the scattering aggregate is calculated using the known volume fraction of MAn (VMAn), Vp and V1 and the electron densities of MAn, its salt and EPM (ρMAn-salt and ρEPM). Equation 5.3 can be used to calculate the electron density difference of the aggregate:

64 Chapter 5
( )
EPM1
EPMMAnp1saltMAnMAnpcalculated
V
)V(VVρ−
ρ⋅⋅−+ρ⋅⋅=ρ − VV
(5.3)
100
DN)DN100(2ZnAcMAn
saltMAnρ⋅+ρ⋅−
=ρ − (5.4)
With ρEPM = 0.293 e-·Å-3, ρMAn = 0.468 e-·Å-3, and ρZnAc2
= 0.531 e-·Å-3.
The comparison of the calculated electron density difference and the estimated value for the electron density difference using the Yarusso-Cooper model is presented in Figure 5.8. The discrepancy between the calculated and fitted value of ρ at low degrees of neutralisation is caused by the fact that the electron density of crystalline zinc acetate dihydrate is used in the calculations, though the anionic packing is less dense. As the degree of neutralisation increases the polarity of the aggregate increases; simultaneously the volume fraction of MAn in the aggregate appears to increase (VMAn·V1/Vp-1 in Table 5.2). As a consequence, the packing of the polar groups will be denser and more approach that of a crystal, which allows a more accurate calculation of ρ.
0.00
0.05
0.10
0.15
0.20
0.00 0.05 0.10 0.15 0.20
ρmodel (e-· Å-3)
ρ cal
cula
ted
(e- · Å
-3)
Figure 5.8 Comparison of the estimated electron density difference using the Yarusso-
Cooper model (ρmodel) and the calculated electron density difference (ρcalculated) as determined using the sample composition
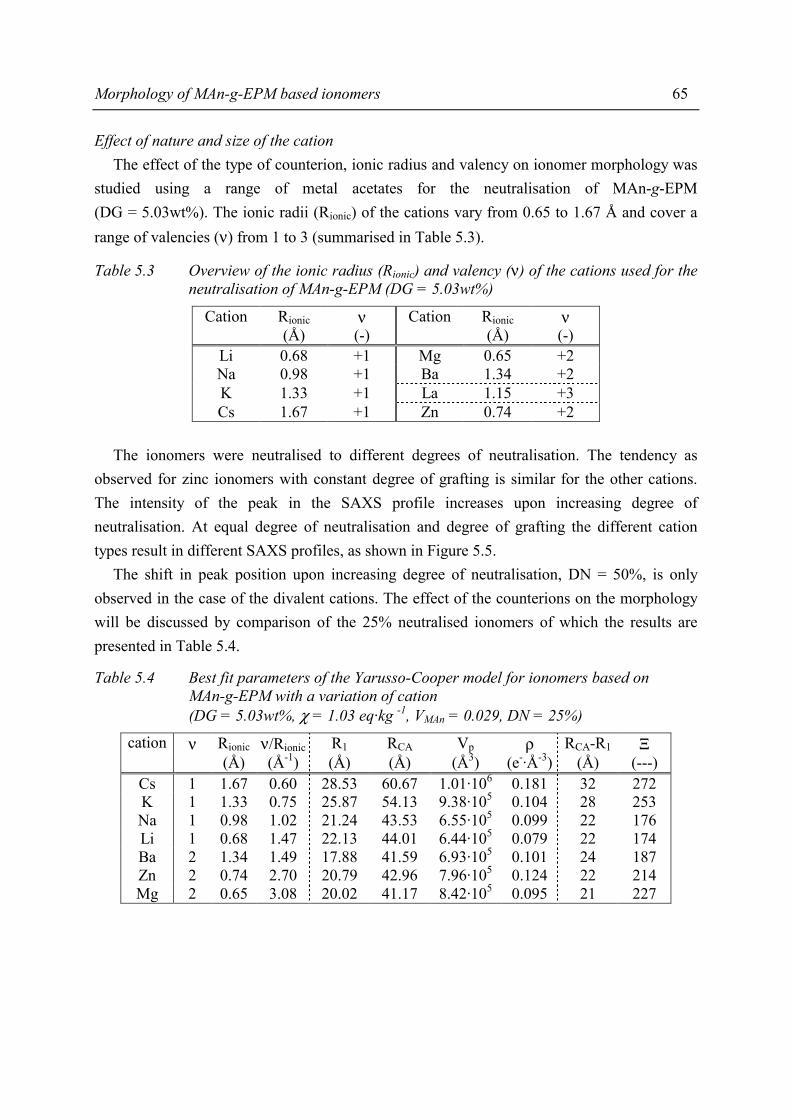
Morphology of MAn-g-EPM based ionomers 65
Effect of nature and size of the cation The effect of the type of counterion, ionic radius and valency on ionomer morphology was studied using a range of metal acetates for the neutralisation of MAn-g-EPM (DG = 5.03wt%). The ionic radii (Rionic) of the cations vary from 0.65 to 1.67 Å and cover a range of valencies (ν) from 1 to 3 (summarised in Table 5.3).
Table 5.3 Overview of the ionic radius (Rionic) and valency (ν) of the cations used for the neutralisation of MAn-g-EPM (DG = 5.03wt%)
Cation Rionic ν Cation Rionic ν (Å) (-) (Å) (-)
Li 0.68 +1 Mg 0.65 +2 Na 0.98 +1 Ba 1.34 +2 K 1.33 +1 La 1.15 +3 Cs 1.67 +1 Zn 0.74 +2
The ionomers were neutralised to different degrees of neutralisation. The tendency as observed for zinc ionomers with constant degree of grafting is similar for the other cations. The intensity of the peak in the SAXS profile increases upon increasing degree of neutralisation. At equal degree of neutralisation and degree of grafting the different cation types result in different SAXS profiles, as shown in Figure 5.5. The shift in peak position upon increasing degree of neutralisation, DN = 50%, is only observed in the case of the divalent cations. The effect of the counterions on the morphology will be discussed by comparison of the 25% neutralised ionomers of which the results are presented in Table 5.4.
Table 5.4 Best fit parameters of the Yarusso-Cooper model for ionomers based on MAn-g-EPM with a variation of cation (DG = 5.03wt%, χ = 1.03 eq·kg -1, VMAn = 0.029, DN = 25%)
cation ν Rionic ν/Rionic R1 RCA Vp ρ RCA-R1 Ξ (Å) (Å-1) (Å) (Å) (Å3) (e-·Å-3) (Å) (---)
Cs 1 1.67 0.60 28.53 60.67 1.01·106 0.181 32 272 K 1 1.33 0.75 25.87 54.13 9.38·105 0.104 28 253 Na 1 0.98 1.02 21.24 43.53 6.55·105 0.099 22 176 Li 1 0.68 1.47 22.13 44.01 6.44·105 0.079 22 174 Ba 2 1.34 1.49 17.88 41.59 6.93·105 0.101 24 187 Zn 2 0.74 2.70 20.79 42.96 7.96·105 0.124 22 214 Mg 2 0.65 3.08 20.02 41.17 8.42·105 0.095 21 227

66 Chapter 5
The dependency of aggregate radius on valency may be explained by the coordination mechanism of the grafted maleic anhydride. When monovalent cations are considered, these cations are neutralised by one acid group and surrounded by other salts and acid groups, suggesting that there is no difference in neutralisation by the first or the second acid group of the grafted MAn. In the case of divalent cations, which are neutralised by two acid groups, there is a preference for the first acid group to be neutralised. The neutralisation mechanism results in tightening of the aggregate beyond 50%, because all ‘single’ acid groups have been consumed and the second acid groups participate in the coordination. The observed changes in aggregate radius upon increasing cation radius in the case of the alkali metal cation neutralised ionomers differs from the changes observed in the alkali-earth metal cation neutralised ionomers. In the case of the alkali metal cations the radius of the core of the aggregate increases as well as the radius of closest approach (RCA) upon increasing ionic radius. The thickness of the immobilised layer and the number of grafted MAn units in an aggregate (Ξ) increase also. However, in the alkaline-earth metal cation series the radius R1 and Ξ decrease upon increasing cation radius. No further attempt will be made to explain this disagreement, but these effects may be important for the mechanical properties. Effect of molecular weight of EPM Variation of the molecular weight of the parent polyolefin and thus the polymer matrix resulted in SAXS profiles as presented in Figure 5.6. All ionomers were based on MAn-g-EPM with a degree of grafting of about 3.5wt% and these materials were neutralised with Zn. The molecular weight of the backbone ranged from 20 to 65 kg·mol-1 11. The maximum in scattering profile was found to move to smaller q-values on increasing EPM molecular weight. Moreover, when the molecular weight was increased, the SAXS peak changed from a distinct peak into a shoulder. Consequently, the fit for these samples is less reliable. In general it can be concluded that the ionic radius (R1) and the thickness of the immobilised layer (R1 - RCA) are not drastically affected by the molecular weight of the parent EPM. There are two possibilities for the change in peak shape. The first possibility is related to the relatively high viscosity of the ionomers during film preparation (via compression moulding) which may lead to incomplete phase separation of the grafted MAn units in the matrix. The second possibility is non-random grafting onto the high molecular weight polyolefin. The grafting was performed in a high viscous solution. This may affect the mixing and consequently the grafting of MAn onto EPM.
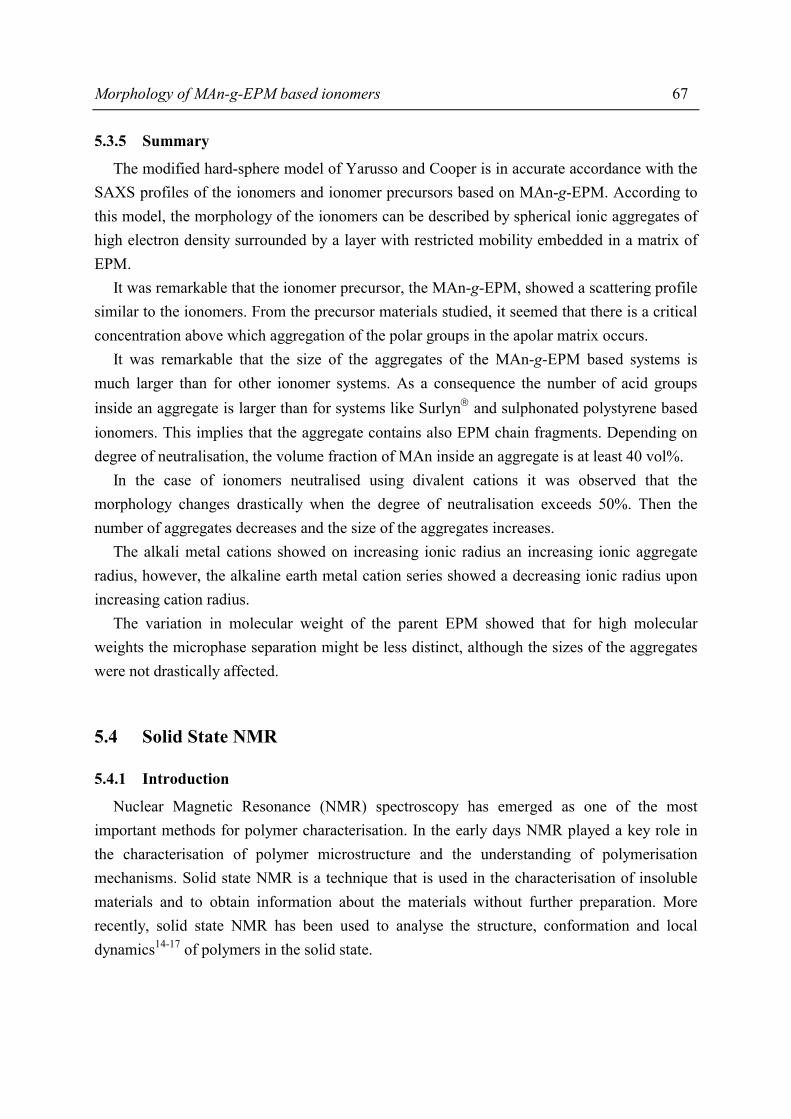
Morphology of MAn-g-EPM based ionomers 67
5.3.5 Summary
The modified hard-sphere model of Yarusso and Cooper is in accurate accordance with the SAXS profiles of the ionomers and ionomer precursors based on MAn-g-EPM. According to this model, the morphology of the ionomers can be described by spherical ionic aggregates of high electron density surrounded by a layer with restricted mobility embedded in a matrix of EPM. It was remarkable that the ionomer precursor, the MAn-g-EPM, showed a scattering profile similar to the ionomers. From the precursor materials studied, it seemed that there is a critical concentration above which aggregation of the polar groups in the apolar matrix occurs. It was remarkable that the size of the aggregates of the MAn-g-EPM based systems is much larger than for other ionomer systems. As a consequence the number of acid groups inside an aggregate is larger than for systems like Surlyn and sulphonated polystyrene based ionomers. This implies that the aggregate contains also EPM chain fragments. Depending on degree of neutralisation, the volume fraction of MAn inside an aggregate is at least 40 vol%. In the case of ionomers neutralised using divalent cations it was observed that the morphology changes drastically when the degree of neutralisation exceeds 50%. Then the number of aggregates decreases and the size of the aggregates increases. The alkali metal cations showed on increasing ionic radius an increasing ionic aggregate radius, however, the alkaline earth metal cation series showed a decreasing ionic radius upon increasing cation radius. The variation in molecular weight of the parent EPM showed that for high molecular weights the microphase separation might be less distinct, although the sizes of the aggregates were not drastically affected.
5.4 Solid State NMR
5.4.1 Introduction
Nuclear Magnetic Resonance (NMR) spectroscopy has emerged as one of the most important methods for polymer characterisation. In the early days NMR played a key role in the characterisation of polymer microstructure and the understanding of polymerisation mechanisms. Solid state NMR is a technique that is used in the characterisation of insoluble materials and to obtain information about the materials without further preparation. More recently, solid state NMR has been used to analyse the structure, conformation and local dynamics14-17 of polymers in the solid state.
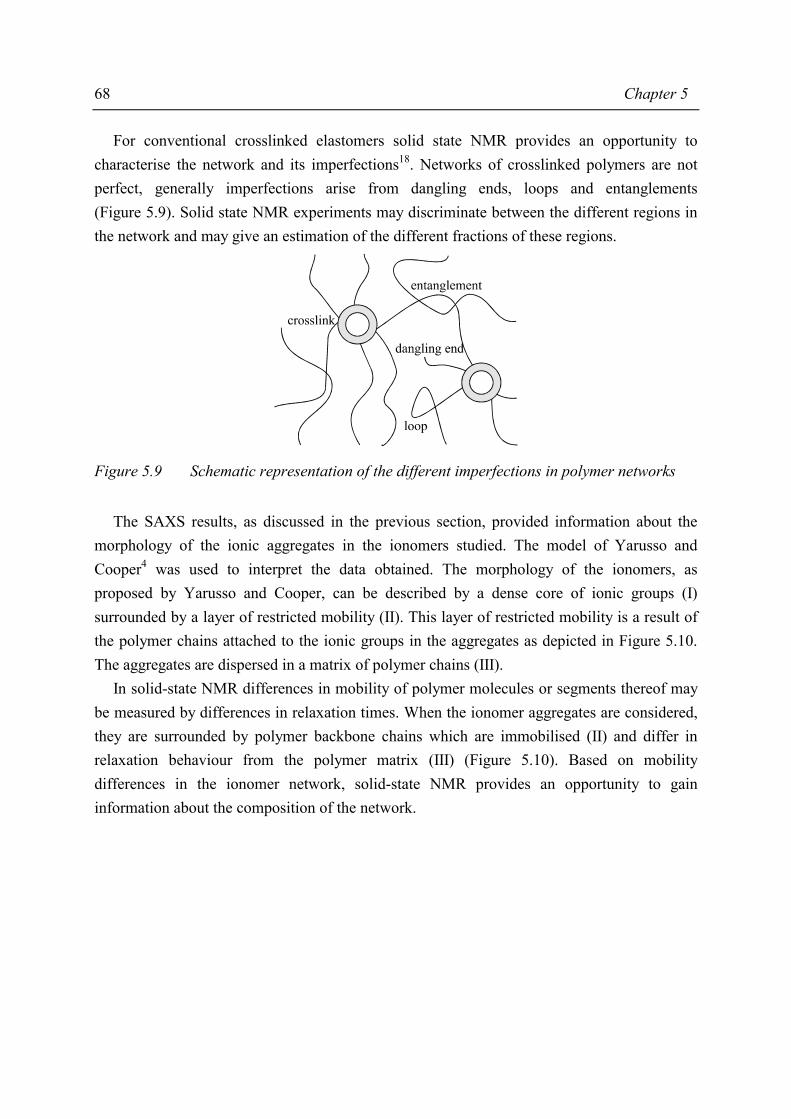
68 Chapter 5
For conventional crosslinked elastomers solid state NMR provides an opportunity to characterise the network and its imperfections18. Networks of crosslinked polymers are not perfect, generally imperfections arise from dangling ends, loops and entanglements (Figure 5.9). Solid state NMR experiments may discriminate between the different regions in the network and may give an estimation of the different fractions of these regions.
Figure 5.9 Schematic representation of the different imperfections in polymer networks The SAXS results, as discussed in the previous section, provided information about the morphology of the ionic aggregates in the ionomers studied. The model of Yarusso and Cooper4 was used to interpret the data obtained. The morphology of the ionomers, as proposed by Yarusso and Cooper, can be described by a dense core of ionic groups (I) surrounded by a layer of restricted mobility (II). This layer of restricted mobility is a result of the polymer chains attached to the ionic groups in the aggregates as depicted in Figure 5.10. The aggregates are dispersed in a matrix of polymer chains (III). In solid-state NMR differences in mobility of polymer molecules or segments thereof may be measured by differences in relaxation times. When the ionomer aggregates are considered, they are surrounded by polymer backbone chains which are immobilised (II) and differ in relaxation behaviour from the polymer matrix (III) (Figure 5.10). Based on mobility differences in the ionomer network, solid-state NMR provides an opportunity to gain information about the composition of the network.
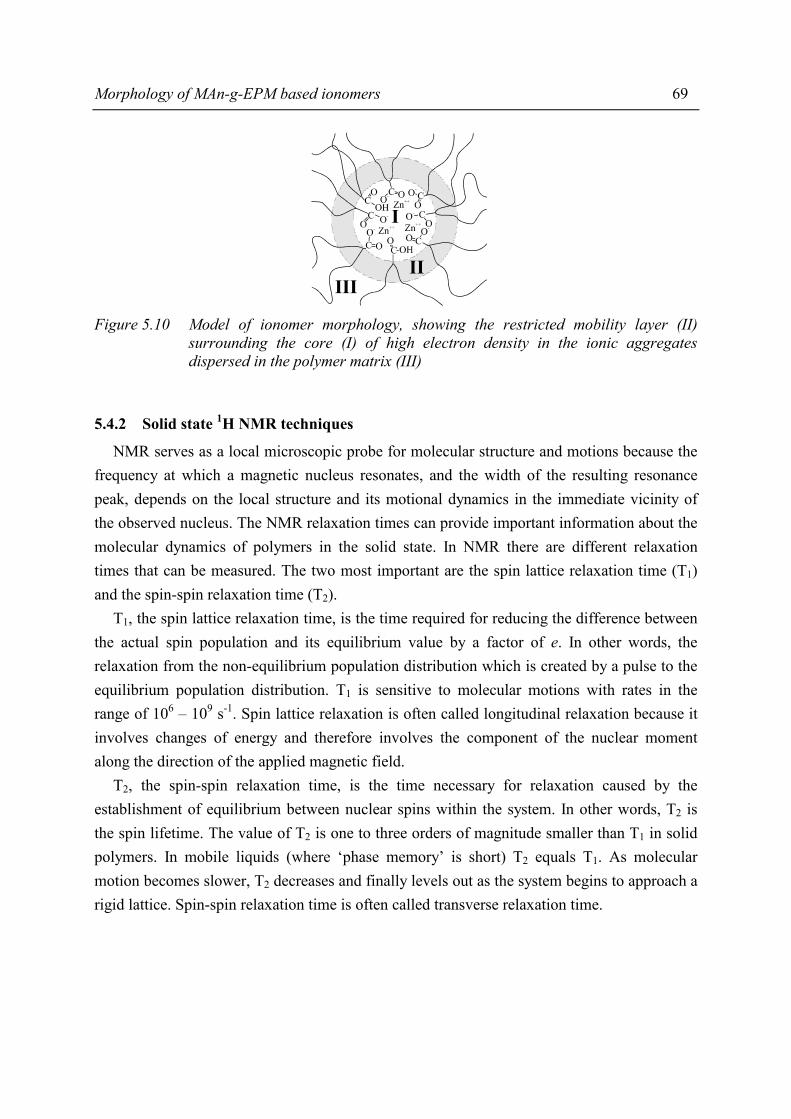
Morphology of MAn-g-EPM based ionomers 69
Figure 5.10 Model of ionomer morphology, showing the restricted mobility layer (II)
surrounding the core (I) of high electron density in the ionic aggregates dispersed in the polymer matrix (III)
5.4.2 Solid state 1H NMR techniques
NMR serves as a local microscopic probe for molecular structure and motions because the frequency at which a magnetic nucleus resonates, and the width of the resulting resonance peak, depends on the local structure and its motional dynamics in the immediate vicinity of the observed nucleus. The NMR relaxation times can provide important information about the molecular dynamics of polymers in the solid state. In NMR there are different relaxation times that can be measured. The two most important are the spin lattice relaxation time (T1) and the spin-spin relaxation time (T2). T1, the spin lattice relaxation time, is the time required for reducing the difference between the actual spin population and its equilibrium value by a factor of e. In other words, the relaxation from the non-equilibrium population distribution which is created by a pulse to the equilibrium population distribution. T1 is sensitive to molecular motions with rates in the range of 106 – 109 s-1. Spin lattice relaxation is often called longitudinal relaxation because it involves changes of energy and therefore involves the component of the nuclear moment along the direction of the applied magnetic field. T2, the spin-spin relaxation time, is the time necessary for relaxation caused by the establishment of equilibrium between nuclear spins within the system. In other words, T2 is the spin lifetime. The value of T2 is one to three orders of magnitude smaller than T1 in solid polymers. In mobile liquids (where ‘phase memory’ is short) T2 equals T1. As molecular motion becomes slower, T2 decreases and finally levels out as the system begins to approach a rigid lattice. Spin-spin relaxation time is often called transverse relaxation time.

70 Chapter 5
1H T1 NMR relaxation experiments The spin-lattice relaxation time (T1) provides gross information about the molecular dynamics of polymers. The proton spin diffusion is very efficient in the solid state, thus the measured relaxation time represents an average for the entire spin system. The differences in the relaxation times are due to differences in the molecular dynamics of the difference phases and can be used to measure the fraction of polymer in each phase. In some polymers the relaxation may proceed by a pathway such that there is not a large difference between the mobile and rigid phases. The above mentioned method cannot be used to determine the fraction of rigid material. 1H T2 NMR relaxation experiments Hydrogen dipole-dipole interactions are usually the dominant interactions in solids, and they determine the hydrogen spin-spin relaxation time (T2) of such systems. A very sensitive tool to study motional differences in elastomers is a proton T2 relaxation experiment. In the field of elastomer characterisation the use of transverse or spin-spin NMR relaxation has been a subject of research in the last decade19-24. When a polymer is heated above the glass transition temperature (Tg) extensive molecular motion occurs at a rate faster than T2
-1; thus an increase in T2 is observed when the molecular motions average the hydrogen dipole-dipole interactions. Heating increases molecular motion until the constraints of the crosslinks at each end of the chain prevent further averaging. As a result the measured T2 increases with increasing temperature to a certain plateau level (T2
p). For lightly crosslinked materials, this level has been shown to be inversely proportional to the crosslink density25. Spin diffusion NMR experiments have been valuable not only for studying the local structure or conformation of polymer chains, but also for measuring the long-range order, i.e. the organisation of polymer chains on a longer length scale (20-200Å). In a proton spin diffusion experiment the proton signals in one section of the sample (such as immobile domains) are excited and the transfer of magnetisation to other domains can be measured. For a given morphological model the sizes of domains can be calculated if the spin diffusion rate is known.
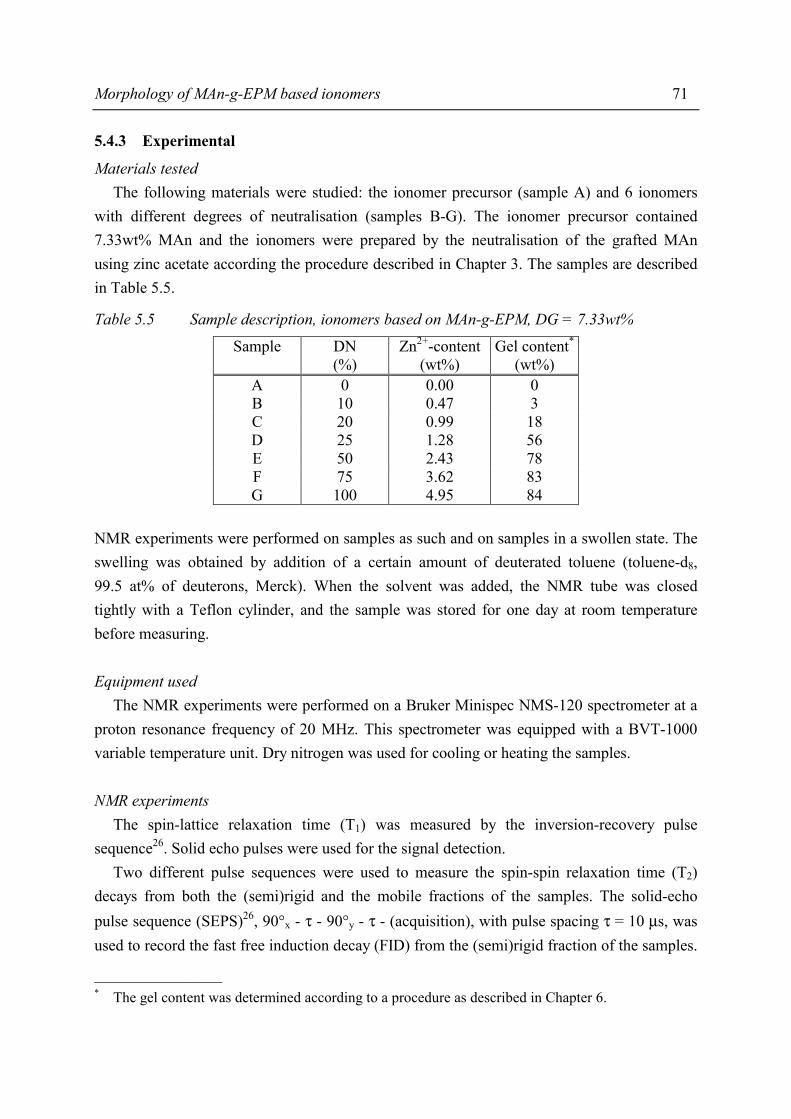
Morphology of MAn-g-EPM based ionomers 71
5.4.3 Experimental
Materials tested The following materials were studied: the ionomer precursor (sample A) and 6 ionomers with different degrees of neutralisation (samples B-G). The ionomer precursor contained 7.33wt% MAn and the ionomers were prepared by the neutralisation of the grafted MAn using zinc acetate according the procedure described in Chapter 3. The samples are described in Table 5.5.
Table 5.5 Sample description, ionomers based on MAn-g-EPM, DG = 7.33wt%
Sample DN (%)
Zn2+-content (wt%)
Gel content*
(wt%) A 0 0.00 0 B 10 0.47 3 C 20 0.99 18 D 25 1.28 56 E 50 2.43 78 F 75 3.62 83 G 100 4.95 84
NMR experiments were performed on samples as such and on samples in a swollen state. The swelling was obtained by addition of a certain amount of deuterated toluene (toluene-d8, 99.5 at% of deuterons, Merck). When the solvent was added, the NMR tube was closed tightly with a Teflon cylinder, and the sample was stored for one day at room temperature before measuring. Equipment used The NMR experiments were performed on a Bruker Minispec NMS-120 spectrometer at a proton resonance frequency of 20 MHz. This spectrometer was equipped with a BVT-1000 variable temperature unit. Dry nitrogen was used for cooling or heating the samples. NMR experiments The spin-lattice relaxation time (T1) was measured by the inversion-recovery pulse sequence26. Solid echo pulses were used for the signal detection. Two different pulse sequences were used to measure the spin-spin relaxation time (T2) decays from both the (semi)rigid and the mobile fractions of the samples. The solid-echo pulse sequence (SEPS)26, 90°x - τ - 90°y - τ - (acquisition), with pulse spacing τ = 10 µs, was used to record the fast free induction decay (FID) from the (semi)rigid fraction of the samples.
________________ * The gel content was determined according to a procedure as described in Chapter 6.
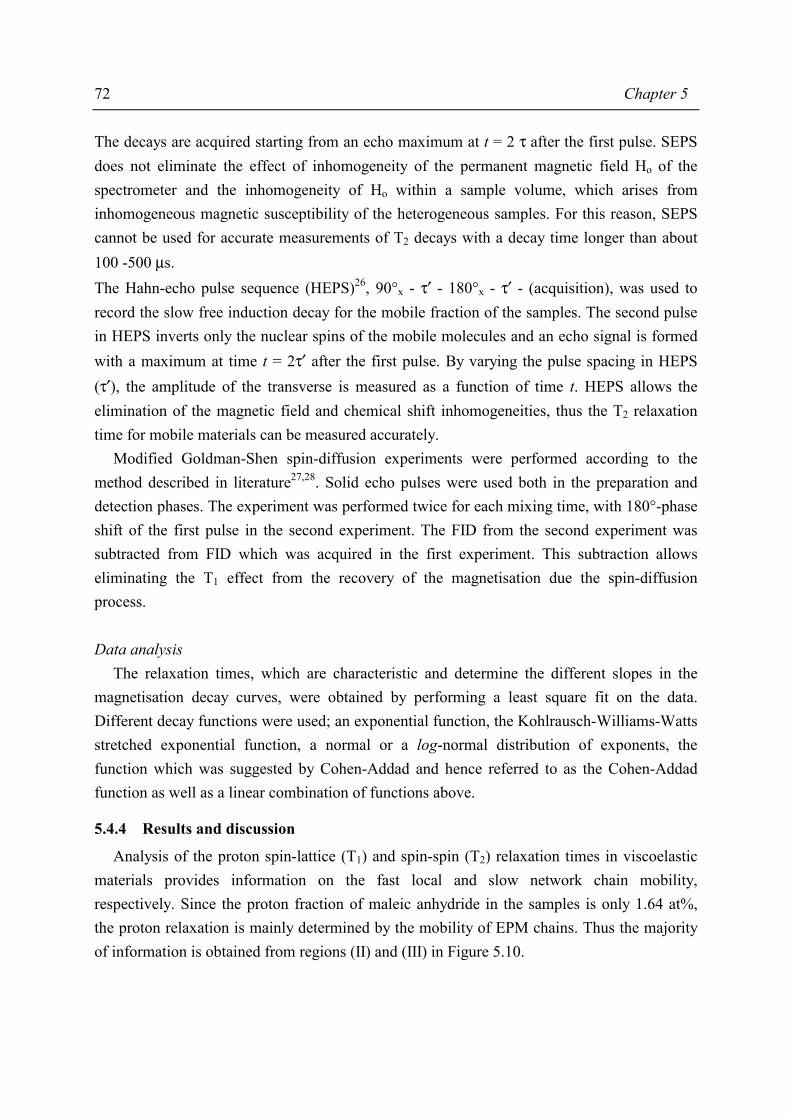
72 Chapter 5
The decays are acquired starting from an echo maximum at t = 2 τ after the first pulse. SEPS does not eliminate the effect of inhomogeneity of the permanent magnetic field Ho of the spectrometer and the inhomogeneity of Ho within a sample volume, which arises from inhomogeneous magnetic susceptibility of the heterogeneous samples. For this reason, SEPS cannot be used for accurate measurements of T2 decays with a decay time longer than about 100 -500 µs. The Hahn-echo pulse sequence (HEPS)26, 90°x - τ′ - 180°x - τ′ - (acquisition), was used to record the slow free induction decay for the mobile fraction of the samples. The second pulse in HEPS inverts only the nuclear spins of the mobile molecules and an echo signal is formed with a maximum at time t = 2τ′ after the first pulse. By varying the pulse spacing in HEPS (τ′), the amplitude of the transverse is measured as a function of time t. HEPS allows the elimination of the magnetic field and chemical shift inhomogeneities, thus the T2 relaxation time for mobile materials can be measured accurately. Modified Goldman-Shen spin-diffusion experiments were performed according to the method described in literature27,28. Solid echo pulses were used both in the preparation and detection phases. The experiment was performed twice for each mixing time, with 180°-phase shift of the first pulse in the second experiment. The FID from the second experiment was subtracted from FID which was acquired in the first experiment. This subtraction allows eliminating the T1 effect from the recovery of the magnetisation due the spin-diffusion process. Data analysis The relaxation times, which are characteristic and determine the different slopes in the magnetisation decay curves, were obtained by performing a least square fit on the data. Different decay functions were used; an exponential function, the Kohlrausch-Williams-Watts stretched exponential function, a normal or a log-normal distribution of exponents, the function which was suggested by Cohen-Addad and hence referred to as the Cohen-Addad function as well as a linear combination of functions above.
5.4.4 Results and discussion
Analysis of the proton spin-lattice (T1) and spin-spin (T2) relaxation times in viscoelastic materials provides information on the fast local and slow network chain mobility, respectively. Since the proton fraction of maleic anhydride in the samples is only 1.64 at%, the proton relaxation is mainly determined by the mobility of EPM chains. Thus the majority of information is obtained from regions (II) and (III) in Figure 5.10.

Morphology of MAn-g-EPM based ionomers 73
1H T1 NMR relaxation experiments The proton T1 relaxation time was determined as a function of temperature for samples with varying degree of neutralisation. A comparison of the temperature dependence of T1 does not reveal a significant difference between MAn-g-EPM and the completely neutralised ionomer (Figure 5.11). This means that local segmental mobility is not affected by neutralisation of maleic anhydride. It will be shown below that samples contain rigid clusters. Since a single exponent describes the T1 relaxation, the spin-diffusion is very efficient in the samples27. It is therefore suggested that the size of rigid clusters should be smaller than 50 nm. In other words: the domains are not large enough to have a separate T1 that differs from the T1 of the matrix. However, in the case of the MAn-g-EPM based materials, there is no difference expected in the spin-lattice relaxation time (T1) because of the large amount of mobile protons present in the matrix. MAn-g-EPM materials contain a large amount of methyl groups. It is known from NMR analysis of poly(methyl methacrylate) (PMMA), which also contains a large amount of methyl groups, it has been suggested that the rapidly rotating methyl groups determine the T1’s. In the case of PMMA only small differences in the relaxation times were observed for the crystalline and amorphous phases29 because of the presence of mobile methyl groups.
0
100
200
300
400
25 50 75 100 125
T (°C)
T 1
(ms)
Figure 5.11 Temperature dependence of T1 relaxation time for MAn-g-EPM (•) and its
100% neutralised ionomer (o)
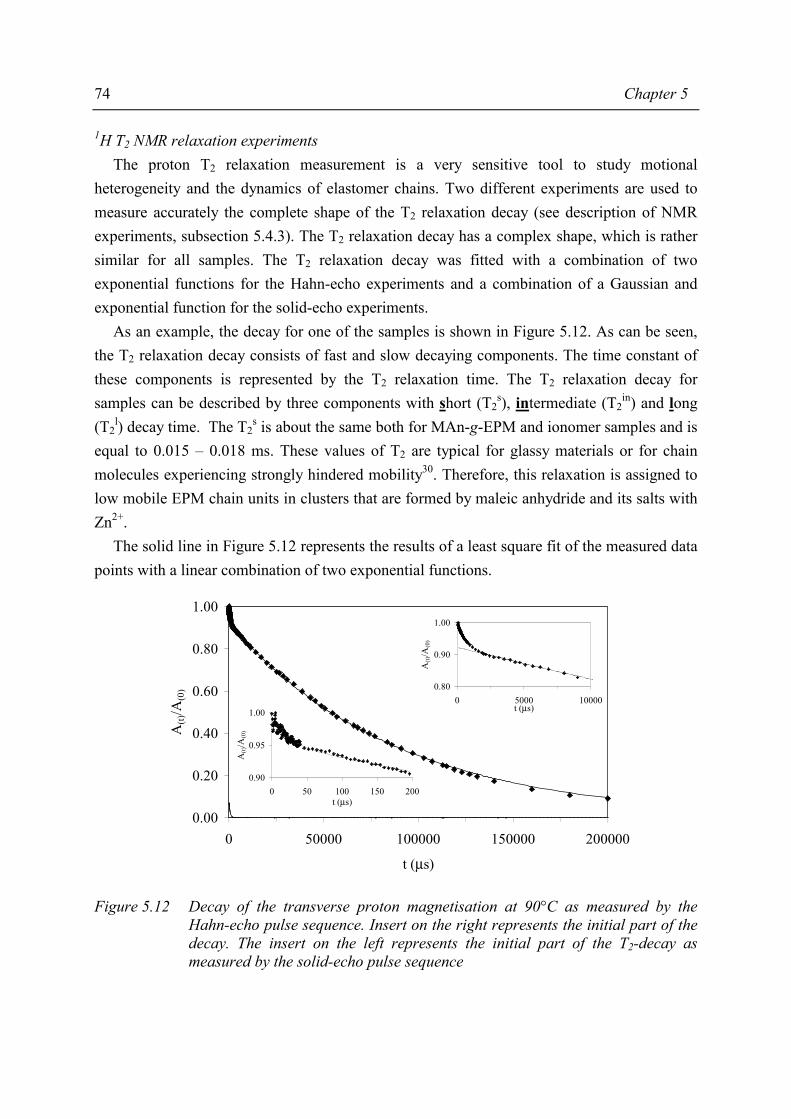
74 Chapter 5
1H T2 NMR relaxation experiments The proton T2 relaxation measurement is a very sensitive tool to study motional heterogeneity and the dynamics of elastomer chains. Two different experiments are used to measure accurately the complete shape of the T2 relaxation decay (see description of NMR experiments, subsection 5.4.3). The T2 relaxation decay has a complex shape, which is rather similar for all samples. The T2 relaxation decay was fitted with a combination of two exponential functions for the Hahn-echo experiments and a combination of a Gaussian and exponential function for the solid-echo experiments. As an example, the decay for one of the samples is shown in Figure 5.12. As can be seen, the T2 relaxation decay consists of fast and slow decaying components. The time constant of these components is represented by the T2 relaxation time. The T2 relaxation decay for samples can be described by three components with short (T2
s), intermediate (T2in) and long
(T2l) decay time. The T2
s is about the same both for MAn-g-EPM and ionomer samples and is equal to 0.015 – 0.018 ms. These values of T2 are typical for glassy materials or for chain molecules experiencing strongly hindered mobility30. Therefore, this relaxation is assigned to low mobile EPM chain units in clusters that are formed by maleic anhydride and its salts with Zn2+. The solid line in Figure 5.12 represents the results of a least square fit of the measured data points with a linear combination of two exponential functions.
0.00
0.20
0.40
0.60
0.80
1.00
0 50000 100000 150000 200000
t (µs)
A(t)
/A(0
) 0.80
0.90
1.00
0 5000 10000t (µs)
A(t)
/A(0
)
0.90
0.95
1.00
0 50 100 150 200t (µs)
A(t)
/A(0
)
Figure 5.12 Decay of the transverse proton magnetisation at 90°C as measured by the Hahn-echo pulse sequence. Insert on the right represents the initial part of the decay. The insert on the left represents the initial part of the T2-decay as measured by the solid-echo pulse sequence
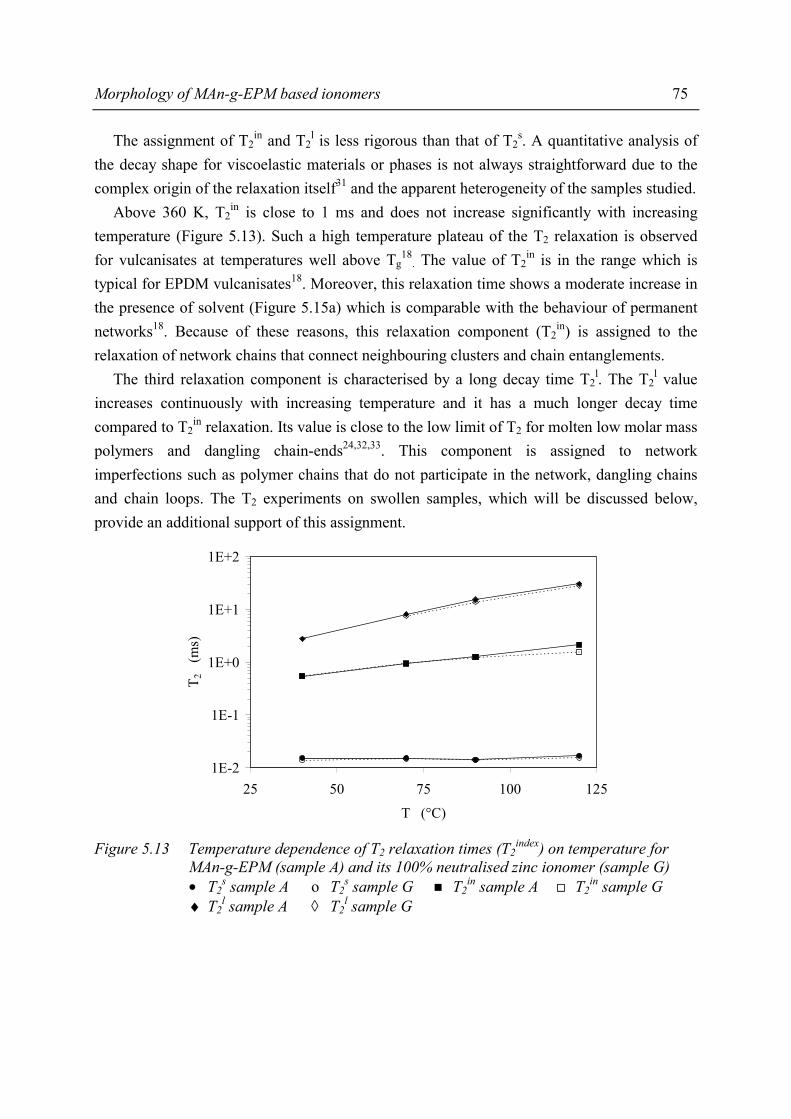
Morphology of MAn-g-EPM based ionomers 75
The assignment of T2in and T2
l is less rigorous than that of T2s. A quantitative analysis of
the decay shape for viscoelastic materials or phases is not always straightforward due to the complex origin of the relaxation itself31 and the apparent heterogeneity of the samples studied. Above 360 K, T2
in is close to 1 ms and does not increase significantly with increasing temperature (Figure 5.13). Such a high temperature plateau of the T2 relaxation is observed for vulcanisates at temperatures well above Tg
18. The value of T2
in is in the range which is typical for EPDM vulcanisates18. Moreover, this relaxation time shows a moderate increase in the presence of solvent (Figure 5.15a) which is comparable with the behaviour of permanent networks18. Because of these reasons, this relaxation component (T2
in) is assigned to the relaxation of network chains that connect neighbouring clusters and chain entanglements. The third relaxation component is characterised by a long decay time T2
l. The T2l value
increases continuously with increasing temperature and it has a much longer decay time compared to T2
in relaxation. Its value is close to the low limit of T2 for molten low molar mass polymers and dangling chain-ends24,32,33. This component is assigned to network imperfections such as polymer chains that do not participate in the network, dangling chains and chain loops. The T2 experiments on swollen samples, which will be discussed below, provide an additional support of this assignment.
1E-2
1E-1
1E+0
1E+1
1E+2
25 50 75 100 125T (°C)
T 2
(ms)
Figure 5.13 Temperature dependence of T2 relaxation times (T2
index) on temperature for MAn-g-EPM (sample A) and its 100% neutralised zinc ionomer (sample G) • T2
s sample A o T2s sample G T2
in sample A T2in sample G
♦ T2l sample A ◊ T2
l sample G
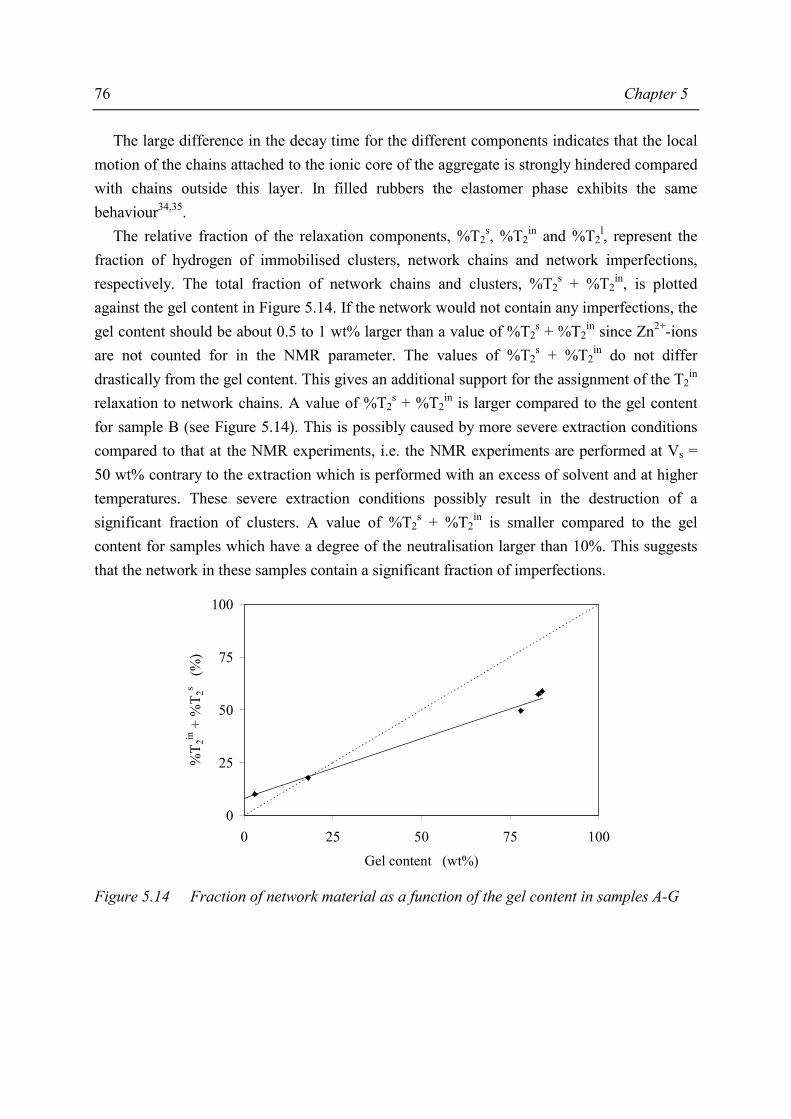
76 Chapter 5
The large difference in the decay time for the different components indicates that the local motion of the chains attached to the ionic core of the aggregate is strongly hindered compared with chains outside this layer. In filled rubbers the elastomer phase exhibits the same behaviour34,35. The relative fraction of the relaxation components, %T2
s, %T2in and %T2
l, represent the fraction of hydrogen of immobilised clusters, network chains and network imperfections, respectively. The total fraction of network chains and clusters, %T2
s + %T2in, is plotted
against the gel content in Figure 5.14. If the network would not contain any imperfections, the gel content should be about 0.5 to 1 wt% larger than a value of %T2
s + %T2in since Zn2+-ions
are not counted for in the NMR parameter. The values of %T2s + %T2
in do not differ drastically from the gel content. This gives an additional support for the assignment of the T2
in relaxation to network chains. A value of %T2
s + %T2in is larger compared to the gel content
for sample B (see Figure 5.14). This is possibly caused by more severe extraction conditions compared to that at the NMR experiments, i.e. the NMR experiments are performed at Vs = 50 wt% contrary to the extraction which is performed with an excess of solvent and at higher temperatures. These severe extraction conditions possibly result in the destruction of a significant fraction of clusters. A value of %T2
s + %T2in is smaller compared to the gel
content for samples which have a degree of the neutralisation larger than 10%. This suggests that the network in these samples contain a significant fraction of imperfections.
0
25
50
75
100
0 25 50 75 100Gel content (wt%)
%T 2
in +
%T 2
s (%
)
Figure 5.14 Fraction of network material as a function of the gel content in samples A-G

Morphology of MAn-g-EPM based ionomers 77
The relaxation data for the ionomer precursor (sample A) and the completely neutralised ionomer (sample G) as a whole are very similar. The only difference is observed in the content of immobilised clusters with increasing degree of neutralisation from about 2.5 to 5.5 at% of hydrogen, respectively (see Figure 5.16a). Since clusters are present in the ionomer precursor and the ionomers, both maleic anhydride and its ionic form are build in the clusters. The proton fraction in clusters for the ionomer precursor (sample A) equals 2.5 at% and is larger than the proton fraction of MAn in the sample, which equals 1.64 at%. This implies that besides the maleic anhydride EPM chain fragments are also present in the aggregates. According to the model, all maleic anhydride is built in the aggregates and EPM chain fragments have to surround the aggregates building a layer of restricted mobility. Molecular weight between crosslinks The T2 value for elastomer networks is quantitatively related to the number of statistical segments between chemical crosslinks and chain entanglements at temperatures about 100-150°C above Tg (at the time-scale of the T2 NMR experiments, i.e. 1-10kHz) 18,25,36,37. This determination of crosslink density is based on the assumption of the validity of Gaussian chain statistics (number of rotationable backbone bonds is larger than 50). The following equation relates the plateau T2 value (T2
p) to the number of statistical segments between crosslinks18,25,36.
ZTT rigid2
p2 ⋅⋅= a (5.5)
Here T2
p is the observed plateau value at (TgNMR +150°C) 25,36 and T2
rigid represents the T2 value for a rigid chain below Tg. T2
rigid is related to the strength of intrachain proton-proton interactions in the rigid lattice. For swollen EPDM samples below Tg the value of T2
rigid equals 10.4 ± 0.2 µs at -133°C 18. The coefficient a in equation 5.5 is a constant which has a value of about 6.2 ± 0.7 for aliphatic chains25,36. Z is the number of statistical segments between crosslinks and is related to Mc, the molar mass of the network chains, by
urigid2
p2u
c MC
TTMCZ
M ⋅⋅⋅
=⋅⋅
= ∞∞nn a
(5.6)
In this equation Mu represents the molar mass per elementary chain unit, n is the number of rotationable backbone bonds in an elementary chain unit and C∞ is the number of rotationable backbone bonds of the statistical segment. The EPM used contained 55wt% propylene and 45wt% ethylene chain units. The average molar mass per elementary chain unit (Mu) equals 34.35 g·mol-1, and n equals 2. A value of 6.62 for C∞ 38 was used for the estimation of Mc.
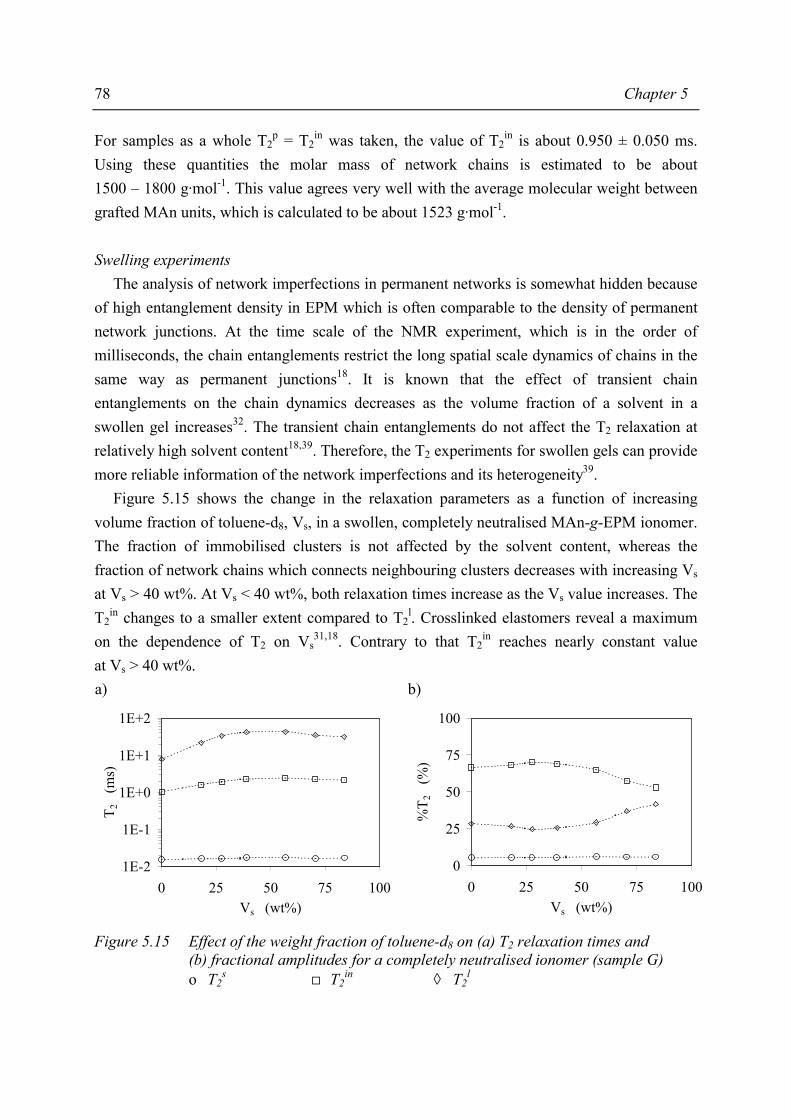
78 Chapter 5
For samples as a whole T2p = T2
in was taken, the value of T2in is about 0.950 ± 0.050 ms.
Using these quantities the molar mass of network chains is estimated to be about 1500 – 1800 g·mol-1. This value agrees very well with the average molecular weight between grafted MAn units, which is calculated to be about 1523 g·mol-1. Swelling experiments The analysis of network imperfections in permanent networks is somewhat hidden because of high entanglement density in EPM which is often comparable to the density of permanent network junctions. At the time scale of the NMR experiment, which is in the order of milliseconds, the chain entanglements restrict the long spatial scale dynamics of chains in the same way as permanent junctions18. It is known that the effect of transient chain entanglements on the chain dynamics decreases as the volume fraction of a solvent in a swollen gel increases32. The transient chain entanglements do not affect the T2 relaxation at relatively high solvent content18,39. Therefore, the T2 experiments for swollen gels can provide more reliable information of the network imperfections and its heterogeneity39. Figure 5.15 shows the change in the relaxation parameters as a function of increasing volume fraction of toluene-d8, Vs, in a swollen, completely neutralised MAn-g-EPM ionomer. The fraction of immobilised clusters is not affected by the solvent content, whereas the fraction of network chains which connects neighbouring clusters decreases with increasing Vs at Vs > 40 wt%. At Vs < 40 wt%, both relaxation times increase as the Vs value increases. The T2
in changes to a smaller extent compared to T2l. Crosslinked elastomers reveal a maximum
on the dependence of T2 on Vs31,18. Contrary to that T2
in reaches nearly constant value at Vs > 40 wt%. a) b)
1E-2
1E-1
1E+0
1E+1
1E+2
0 25 50 75 100Vs (wt%)
T 2
(ms)
0
25
50
75
100
0 25 50 75 100Vs (wt%)
%T 2
(%
)
Figure 5.15 Effect of the weight fraction of toluene-d8 on (a) T2 relaxation times and
(b) fractional amplitudes for a completely neutralised ionomer (sample G) o T2
s T2in ◊ T2
l
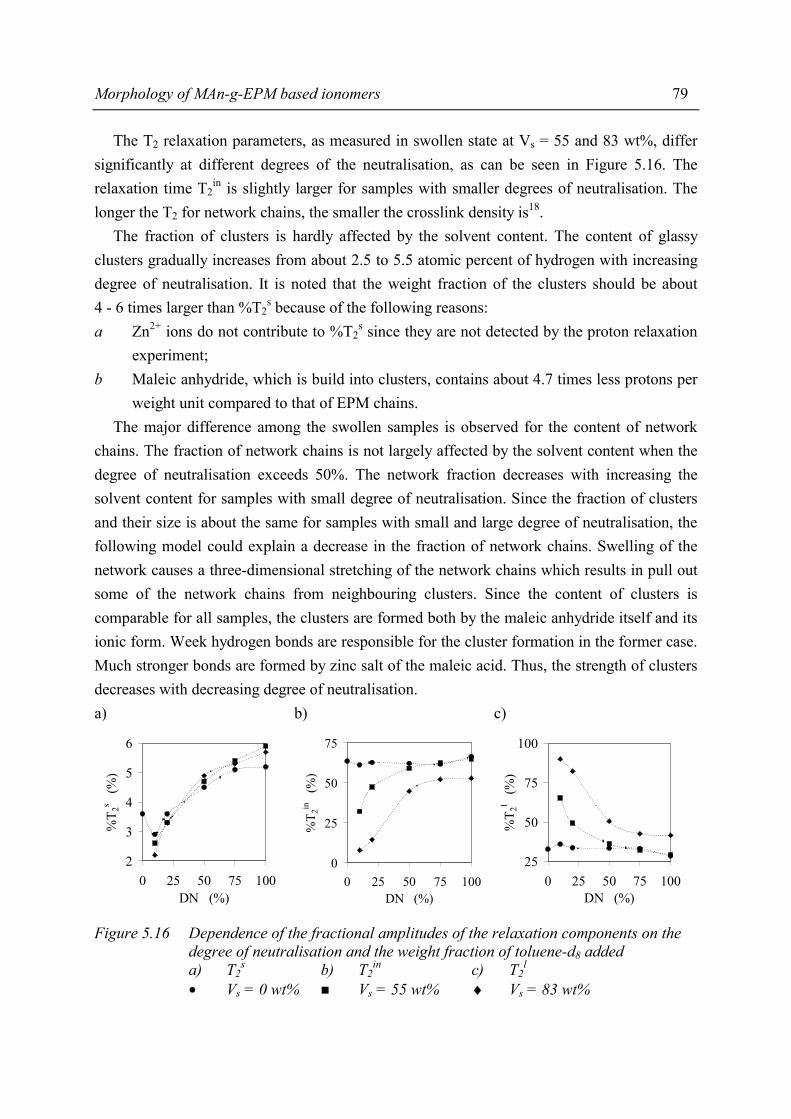
Morphology of MAn-g-EPM based ionomers 79
The T2 relaxation parameters, as measured in swollen state at Vs = 55 and 83 wt%, differ significantly at different degrees of the neutralisation, as can be seen in Figure 5.16. The relaxation time T2
in is slightly larger for samples with smaller degrees of neutralisation. The longer the T2 for network chains, the smaller the crosslink density is18. The fraction of clusters is hardly affected by the solvent content. The content of glassy clusters gradually increases from about 2.5 to 5.5 atomic percent of hydrogen with increasing degree of neutralisation. It is noted that the weight fraction of the clusters should be about 4 - 6 times larger than %T2
s because of the following reasons: a Zn2+ ions do not contribute to %T2
s since they are not detected by the proton relaxation experiment;
b Maleic anhydride, which is build into clusters, contains about 4.7 times less protons per weight unit compared to that of EPM chains.
The major difference among the swollen samples is observed for the content of network chains. The fraction of network chains is not largely affected by the solvent content when the degree of neutralisation exceeds 50%. The network fraction decreases with increasing the solvent content for samples with small degree of neutralisation. Since the fraction of clusters and their size is about the same for samples with small and large degree of neutralisation, the following model could explain a decrease in the fraction of network chains. Swelling of the network causes a three-dimensional stretching of the network chains which results in pull out some of the network chains from neighbouring clusters. Since the content of clusters is comparable for all samples, the clusters are formed both by the maleic anhydride itself and its ionic form. Week hydrogen bonds are responsible for the cluster formation in the former case. Much stronger bonds are formed by zinc salt of the maleic acid. Thus, the strength of clusters decreases with decreasing degree of neutralisation. a) b) c)
2
3
4
5
6
0 25 50 75 100DN (%)
%T 2
s (%
)
0
25
50
75
0 25 50 75 100DN (%)
%T 2
in
(%)
25
50
75
100
0 25 50 75 100DN (%)
%T 2
l (%
)
Figure 5.16 Dependence of the fractional amplitudes of the relaxation components on the degree of neutralisation and the weight fraction of toluene-d8 added a) T2
s b) T2in c) T2
l • Vs = 0 wt% Vs = 55 wt% ♦ Vs = 83 wt%
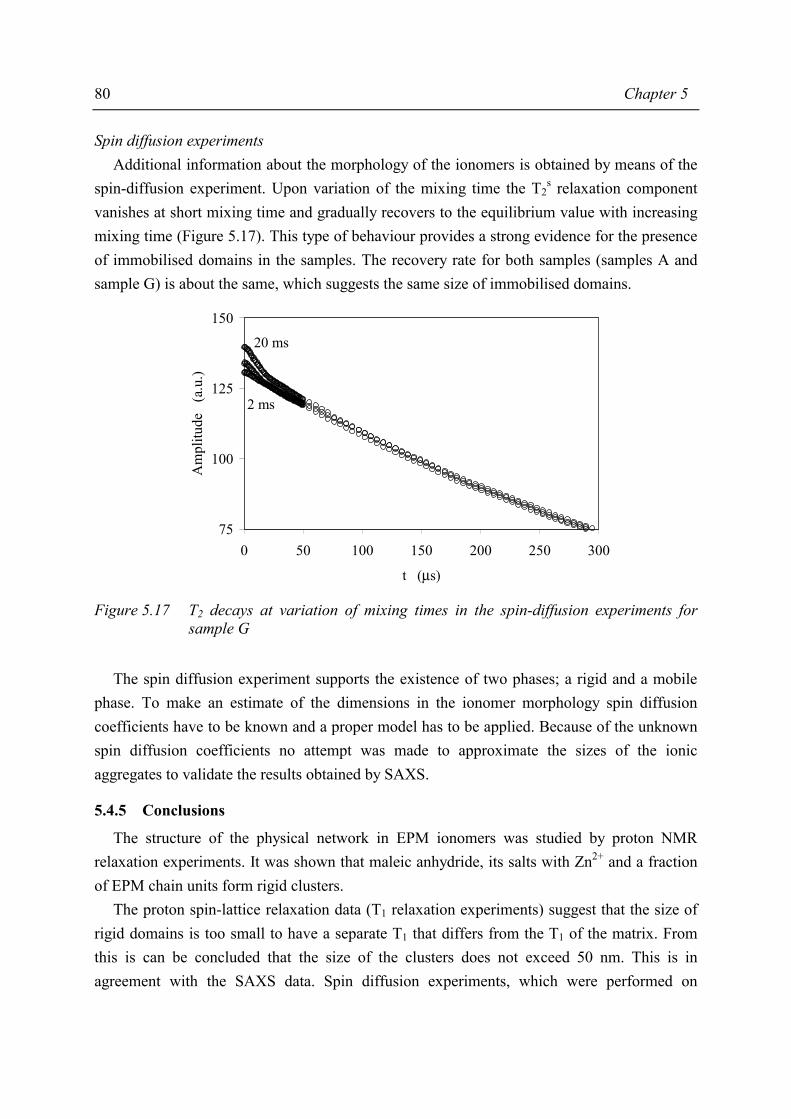
80 Chapter 5
Spin diffusion experiments Additional information about the morphology of the ionomers is obtained by means of the spin-diffusion experiment. Upon variation of the mixing time the T2
s relaxation component vanishes at short mixing time and gradually recovers to the equilibrium value with increasing mixing time (Figure 5.17). This type of behaviour provides a strong evidence for the presence of immobilised domains in the samples. The recovery rate for both samples (samples A and sample G) is about the same, which suggests the same size of immobilised domains.
75
100
125
150
0 50 100 150 200 250 300
t (µs)
Am
plitu
de
(a.u
.)
2 ms
20 ms
Figure 5.17 T2 decays at variation of mixing times in the spin-diffusion experiments for
sample G The spin diffusion experiment supports the existence of two phases; a rigid and a mobile phase. To make an estimate of the dimensions in the ionomer morphology spin diffusion coefficients have to be known and a proper model has to be applied. Because of the unknown spin diffusion coefficients no attempt was made to approximate the sizes of the ionic aggregates to validate the results obtained by SAXS.
5.4.5 Conclusions
The structure of the physical network in EPM ionomers was studied by proton NMR relaxation experiments. It was shown that maleic anhydride, its salts with Zn2+ and a fraction of EPM chain units form rigid clusters. The proton spin-lattice relaxation data (T1 relaxation experiments) suggest that the size of rigid domains is too small to have a separate T1 that differs from the T1 of the matrix. From this is can be concluded that the size of the clusters does not exceed 50 nm. This is in agreement with the SAXS data. Spin diffusion experiments, which were performed on
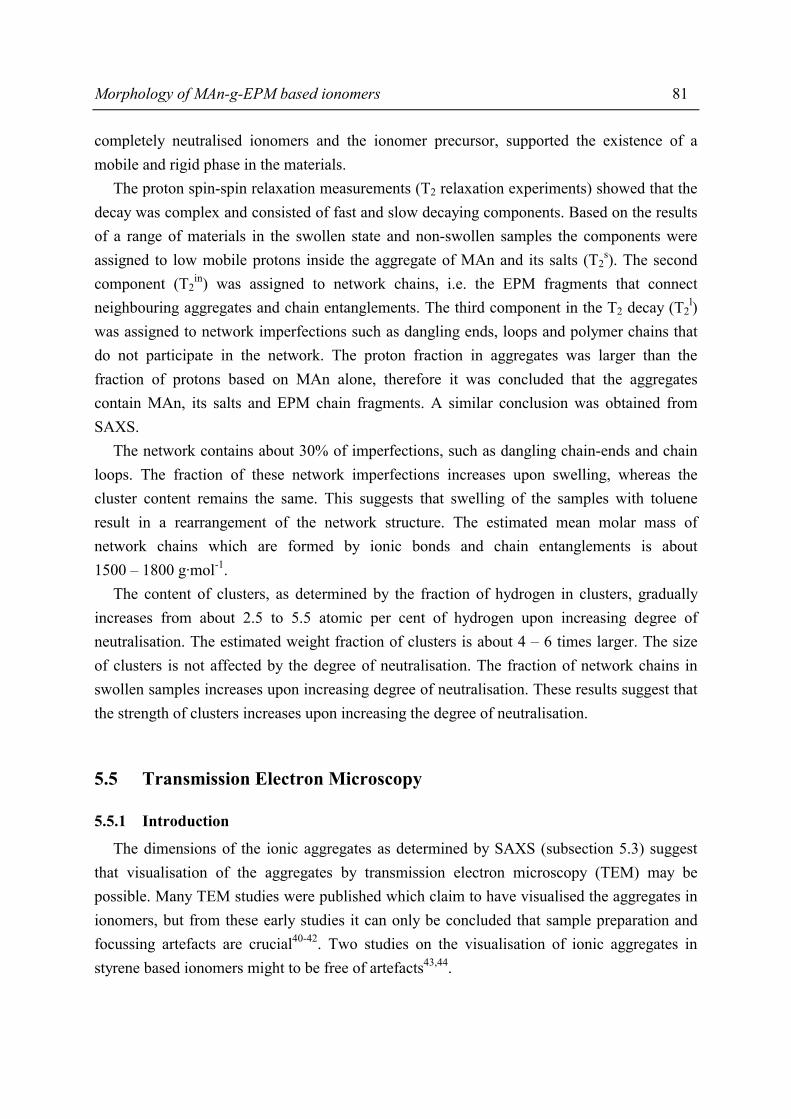
Morphology of MAn-g-EPM based ionomers 81
completely neutralised ionomers and the ionomer precursor, supported the existence of a mobile and rigid phase in the materials. The proton spin-spin relaxation measurements (T2 relaxation experiments) showed that the decay was complex and consisted of fast and slow decaying components. Based on the results of a range of materials in the swollen state and non-swollen samples the components were assigned to low mobile protons inside the aggregate of MAn and its salts (T2
s). The second component (T2
in) was assigned to network chains, i.e. the EPM fragments that connect neighbouring aggregates and chain entanglements. The third component in the T2 decay (T2
l) was assigned to network imperfections such as dangling ends, loops and polymer chains that do not participate in the network. The proton fraction in aggregates was larger than the fraction of protons based on MAn alone, therefore it was concluded that the aggregates contain MAn, its salts and EPM chain fragments. A similar conclusion was obtained from SAXS. The network contains about 30% of imperfections, such as dangling chain-ends and chain loops. The fraction of these network imperfections increases upon swelling, whereas the cluster content remains the same. This suggests that swelling of the samples with toluene result in a rearrangement of the network structure. The estimated mean molar mass of network chains which are formed by ionic bonds and chain entanglements is about 1500 – 1800 g·mol-1. The content of clusters, as determined by the fraction of hydrogen in clusters, gradually increases from about 2.5 to 5.5 atomic per cent of hydrogen upon increasing degree of neutralisation. The estimated weight fraction of clusters is about 4 – 6 times larger. The size of clusters is not affected by the degree of neutralisation. The fraction of network chains in swollen samples increases upon increasing degree of neutralisation. These results suggest that the strength of clusters increases upon increasing the degree of neutralisation.
5.5 Transmission Electron Microscopy
5.5.1 Introduction
The dimensions of the ionic aggregates as determined by SAXS (subsection 5.3) suggest that visualisation of the aggregates by transmission electron microscopy (TEM) may be possible. Many TEM studies were published which claim to have visualised the aggregates in ionomers, but from these early studies it can only be concluded that sample preparation and focussing artefacts are crucial40-42. Two studies on the visualisation of ionic aggregates in styrene based ionomers might to be free of artefacts43,44.
82 Chapter 5
In both studies, the styrene-based ionomer was solvent cast directly onto a copper grid and spherical aggregates were observed without any discernible order. The use of special techniques in electron microscopy45, i.e. dark-field imaging and scanning-TEM, are in the case of ionomers not necessary because the electron density difference between the matrix and the ionic aggregates is sufficiently large to obtain enough contrast in the bright field mode.
5.5.2 Experimental
Ionomers were prepared according to the procedure described in Chapter 3. A sample of the reaction mixture was taken just before evaporation to dryness. Films were cast by placing a drop of the reaction mixture on the surface of distilled water at room temperature46. The polymer film is formed on the water surface. Au-specimen support grids were put on top of the polymer film. The grids adhere to the polymer film and by use of a glass plate the film was applied to the grids47 (Figure 5.18).
Figure 5.18 Film and TEM-sample preparation The TEM samples were dried under nitrogen atmosphere at 100°C for at least 65 hours. Because of sufficient electron density difference in the material itself it was not necessary to use any staining. The transmission electron microscope (Jeol 2000 FX) was operated at 80 kV. To check whether zinc was present energy dispersive X-ray analysis (EDX) was performed (NORAN Series 2).
5.5.3 Results and discussion
TEM provides the most direct evidence for aggregation in real space. However, producing a sufficiently thin sample for TEM analysis proved to be difficult. The sample thickness must be in the order of the domain thickness to avoid superposition of the ionic aggregates and consequently complicated interpretation. Figure 5.19 shows a TEM-picture of the morphology of a zinc-ionomer based on MAn-g-EPM with a degree of grafting of 7.33wt% and a degree of neutralisation of 100%. The sizes of the aggregates seem to be consistent with the results obtained from SAXS.
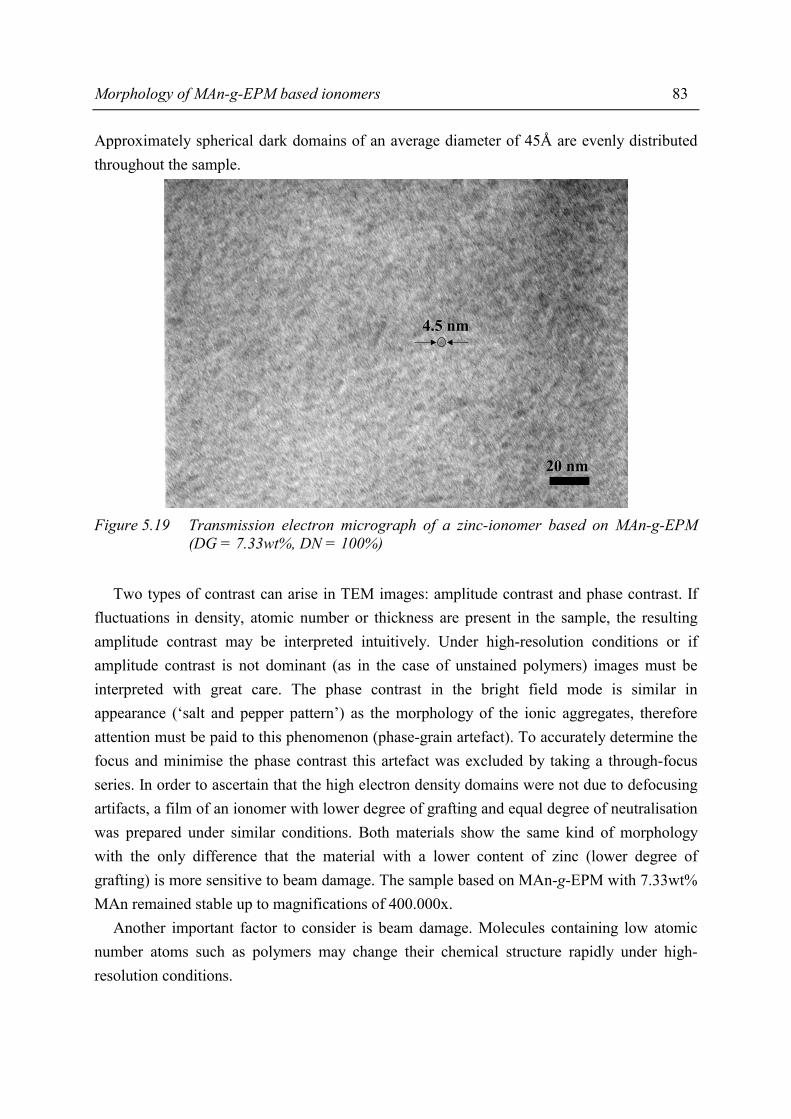
Morphology of MAn-g-EPM based ionomers 83
Approximately spherical dark domains of an average diameter of 45Å are evenly distributed throughout the sample.
2020 nm nm
4.5 4.5 nmnm
Figure 5.19 Transmission electron micrograph of a zinc-ionomer based on MAn-g-EPM
(DG = 7.33wt%, DN = 100%) Two types of contrast can arise in TEM images: amplitude contrast and phase contrast. If fluctuations in density, atomic number or thickness are present in the sample, the resulting amplitude contrast may be interpreted intuitively. Under high-resolution conditions or if amplitude contrast is not dominant (as in the case of unstained polymers) images must be interpreted with great care. The phase contrast in the bright field mode is similar in appearance (‘salt and pepper pattern’) as the morphology of the ionic aggregates, therefore attention must be paid to this phenomenon (phase-grain artefact). To accurately determine the focus and minimise the phase contrast this artefact was excluded by taking a through-focus series. In order to ascertain that the high electron density domains were not due to defocusing artifacts, a film of an ionomer with lower degree of grafting and equal degree of neutralisation was prepared under similar conditions. Both materials show the same kind of morphology with the only difference that the material with a lower content of zinc (lower degree of grafting) is more sensitive to beam damage. The sample based on MAn-g-EPM with 7.33wt% MAn remained stable up to magnifications of 400.000x. Another important factor to consider is beam damage. Molecules containing low atomic number atoms such as polymers may change their chemical structure rapidly under high-resolution conditions.
84 Chapter 5
Clusters of heavy atoms, however, have shown to remain approximately fixed during irradiation and, hence, are subject to more reliable interpretations48,49. Although the polymer matrix might be subjected to beam damage, the ionic aggregates are likely to remain unchanged50. To avoid artefacts introduced by beam damage all pictures were taken on a piece of film close to the spot where focussing was performed. To check the composition of the dark spots energy dispersive X-ray analysis (EDX) was performed. The elements present were C, O, Si and Zn. There is some Si present because of the laboratory glass used during ionomer synthesis.
5.5.4 Conclusions
From the results obtained, it is anticipated that the morphology as visualised by TEM is representative for the bulk morphology of the ionomers though they are prepared from solution. The TEM images of solvent cast films of zinc ionomers showed the presence of small domains of high electron density dispersed in a matrix of low electron density. The sizes of the aggregates appear to be consistent with the results obtained with SAXS. The experimental results of different ionomers prepared in similar conditions lead us to conclusion that ionic domains have been visualised.
5.6 Conclusions In this chapter the ionomer morphology was elucidated using different characterisation techniques. The most direct method to study the morphology of ionomers proved to be Small Angle X-ray Scattering (SAXS). The obtained SAXS data were used in combination with the modified hard-sphere model of Yarusso and Cooper. According to this model the morphology of the ionomers can be described by spherical ionic aggregates of high electron density surrounded by a layer with restricted mobility embedded in a matrix of EPM. To verify the Yarusso-Cooper model and to obtain information about the chain mobility in the ionomer network Solid-state Nuclear Magnetic Resonance (NMR) was used. 1H relaxation experiments showed that MAn, its salts with Zn2+ and a fraction of EPM chain fragments form rigid aggregates. T2 relaxation experiments revealed that three different types of protons are present in the ionomers and ionomer precursor. The network can be visualised as rigid domains connected by EPM chain fragments (network chains). It can also be concluded that the network contains about 30% of imperfections (chain segments that not participate in the network), such as dangling chain-ends and chain loops. This fraction might be of importance in the macroscopic properties of the ionomers.

Morphology of MAn-g-EPM based ionomers 85
The results from the ionomer precursor suggest that there is a critical concentration above which aggregation of the polar groups in the apolar matrix occurs, resulting in aggregates with an approximate radius of 25Å, which contain at least 40vol% MAn. Upon increasing neutralisation the number of MAn groups increases though the aggregates size changes only slightly In the case of ionomers neutralised using divalent cations it was observed that the morphology changes drastically when the degree of neutralisation exceeds 50%. Then the number of aggregates decreases and the size of the aggregates increases only slightly. The volume fraction of the ionic aggregates decreases upon increasing degree of neutralisation up to 50% after which the volume fraction reaches a plateau value. The results observed with SAXS showed a tightening of the aggregates upon increasing DN and with solid state NMR a reduced mobility upon increasing DN was observed, this suggests that the strength of aggregates increases upon increasing the degree of neutralisation. The alkali metal cations showed on increasing ionic radius an increasing ionic aggregate radius, however, the alkaline earth metal cation series showed a decreasing ionic radius upon increasing cation radius. The variation in molecular weight of the parent EPM showed that for high molecular weights the microphase separation might be less distinct, although the sizes of the aggregates were not drastically affected. The electron density difference between the ionic aggregates and the EPM matrix provided sufficient contrast for Transmission Electron Microscopy (TEM). The sizes of the aggregates, spots of high electron density with a diameter of about 45Å, are consistent with the results obtained from SAXS. The experimental results of different ionomers prepared under similar conditions lead us to believe that ionic domains have been visualised.

86 Chapter 5
5.7 References 1. This thesis, Chapter 3 2. Duval, C., Lecomte, J. and Douville, F., F. Ann. Phys. 17, 5 (1942) 3. Reerink, H., J. Colloid Sci. 20, 217 (1965) 4. Yarusso, D.J. and Cooper, S.L., Macromolecules 16, 1871 (1983) 5. Bras, W., Derbyshire, G.E., Ryan, A.J., Mant, G.R., Felton, A., Lewis, R.A., Hall, C.J. and
Greaves, G.N., Nucl. Instr. Meth. Phys. Res. A326, 587 (1993) 6. Huang, T.C., Toraya, H., Blanton, T.N. and Wu, Y., J. Appl. Cryst. 26, 180 (1993) 7. Russel, T.P., Lin, J.S., Spooner, S. and Wignall, G.D., J. Appl. Cryst. 21, 629 (1988) 8. Marx, C., Caulfield, D. and Cooper, S., Macromolecules 6, 344 (1973) 9. Eisenberg, A. and Navratil, M., Macromolecules 7, 90 (1974) 10. Roche, E.J., Stein, R.S. and MacKnight, W.J., J. Polym. Sci., Polym. Phys. Ed. 18, 1035 (1980) 11. This thesis, Chapter 2 12. Peiffer, D.G., Weiss, R.A. and Lundberg, R.D., J. Polym. Sci., Polym. Phys. Ed. 20, 1503
(1982) 13. Hogt, A.H., Compalloy '90 , 179 (1990) 14. Meltzer, A.D., Tirrell, D.A., Jones, A.A., Inglefield, P.T., Hedstrand, D.M. and Tomalia, D.A.,
Macromolecules 25, 4541 (1992) 15. Le Menestrel, C., Kenwright, A.M., Sergot, P., Lauprêtre, F., Monnerie, L., Macromolecules 25,
3020 (1992) 16. Voelkel, R., Angew. Chem. Int. Ed. Engl. 27, 1468 (1988) 17. Silvestri, R.L. and Koenig, J.L., Macromolecules 25, 2341 (1992) 18. Litvinov, V.M., Barenswaard and van Duin, M., Rubber Chem. Technol. 71, 105 (1998) 19. Cohen-Addad, J.P., J. Phys. (Paris) 43, 1509 (1982) 20. Cohen-Addad, J.P. and Schmit, C., Polymer 29, 883 (1988) 21. Kimmich, R., Schnur, G. and Köpf, M., Prog. Nucl. Magn. Reson. Spectrosc. 20, 385 (1988) 22. Brereton, M.G., Ward, I.M., Boden, N. and Wright, P., Macromolecules 24, 2068 (1991) 23. Hiller, W.G., Schneider, H. and Fedotov, V.D., J. Polym. Sci., Polym. Phys. Ed. 30, 931 (1992) 24. Weber, H.W. and Kimmich, R., Macromolecules 26, 2597 (1993) 25. Gotlib, Y.Y., Lofshits, M.I., Shevelev, V.A., Lishanski, I.A. and Balanina, I.V., Polym. Sci.
USSR 18, 2630 (1976) 26. Bovey, F.A. and Mirau, P.A., NMR of Polymers, London: Academic Press, 1996 27. Kenwight, A.M. and Say, B.J., Solid State Nuclear Magn. Res. 7, 85 (1996) 28. Zhang, S. and Mehring, M., Chem. Phys. Let. 160, 644 (1989) 29. Veeman, W.S. and Menger, E.M., Bull. Magn. Reson. 2, 77 (1980) 30. Litvinov, V.M., in Organosilicon Chemistry II. From Molecules to Materials, Auner, N. and
Weiss, J., Eds., VCM, Weinhein, 1996 p. 779 31. Cohen-Addad, J.P., Progess in NMR Spectr. 25, 1 (1993) 32. Kulagina, T.P., Litvinov, V.M. and Summanen, K.T., J. Polym. Sci.: Part B: Polym. Phys. 31,
241 (1993) 33. Kimmich, R, Köpf, M. and Callaghan, P., J. Polym. Sci.: Part B: Polym. Phys. 29, 1029 (1991) 34. Dutta, N.K., Choudhury, N.R., Haidar, B., Vidal, A., Donnet, J.B., Delmotte, L. and Chezau,
J.M., Polymer 35, 4293 (1994) 35. McBrierty, V.J. and Kenny, J.C., Kautschuk Gummi Kunststoffe 47, 342 (1994) 36. Fry, C.G. and Lind, A.C., Macromolecules 21, 1292 (1988) 37. Simon, G., Baumann, K. and Gronski, W., Macromolecules 25, 3624 (1992) 38. Richter, D., Farafo, B., Butera, R., Fetters, L.J., Huand, J.S. and Ewen, B., Macromolecules 26,
795 (1993)
Morphology of MAn-g-EPM based ionomers 87
39. Litvinov, V.M. and Steeman, P.A.M., Macromolecules 32, 8476 (1999) 40. Marx, C.L., Koutsky, J.A. and Cooper, S.L., Polymer Letters 9, 167 (1971) 41. Philips, P.J., Polymer Letters 10, 443 (1972) 42. Hsu, W.Y. and Gierke, T.D., J. Membrane Sci. 13, 307 (1983) 43. Williams, C.E., Colliex, C., Horrion, J. and Jérôme, R., Multiphase Polymers: Blends and
Ionomers (ACS Symp. Ser. 395), ed. Utracki, L.A. and Weiss, R.A., Chapter 18, Washington DC: American Chemical Society (1989)
44. Li, C., Register, R.A. and Cooper, S.L., Polymer 30, 1227 (1989) 45. Laurer, J.H. and Winey, K.I., Macromolecules 31, 9106 (1998) 46. in Practical Methods in Electron Microscopy, Volume 11, edited by Glauert, A.M., Elsevier,
Amsterdam, 1985, p.189 47. in Practical Methods in Electron Microscopy, Volume 13, edited by Glauert, A.M., Elsevier,
Amsterdam, 1991, p.212 48. Klug, A., Chem. Scr. 14, 245 (1978-1979) 49. Wall, J.S., Chem. Scr. 14, 271 (1978-1979) 50. Handlin, D.L., MacKnight, W.J. and Thomas, E.L., Macromolecules 14, 795 (1981)

88 Chapter 5
Chapter 6
Gel content of MAn-g-EPM based ionomers
6.1 Introduction In Chapter 5 it was shown that the grafting of polar maleic anhydride groups onto the EPM backbone results in the formation of MAn-rich aggregates which are phase separated from the apolar EPM matrix. Upon neutralisation these aggregates remain and by the reaction of the grafted MAn units with the neutralising base ionic junctions are formed. It was also evident that the composition of MAn-g-EPM based ionomers, i.e. the degree of neutralisation (DN), the degree of grafting (DG), the choice of cation and the molecular weight of the parent EPM, have important effects on the morphology of the ionomers. The composition of the ionomer network, viz. the size and number of ionic aggregates, appeared to be dependent on the ionomer composition. For permanent networks, the quality of the network is determined by sol-gel analysis. For example in peroxide cured elastomers sol-gel analysis is often used to gain information about the extent of chain scission that has occurred. For thermoplastic elastomers sol-gel analysis is not straightforward, most of the thermoplastic elastomers are completely soluble at the refluxing temperatures of the solvent. For the MAn-g-EPM based ionomers it is expected that a low fraction of insoluble material is present, the sol-gel analysis is a rather severe test for non-covalently crosslinked elastomers. In this chapter the effect of the ionomer composition on the gel content of the ionomer will be discussed.
6.2 Effect of ionomer composition on gel content During the neutralisation procedure a considerable increase in viscosity was observed indicating a large increase in apparent molecular weight. In some cases a gel was formed, indicating the formation of a network. To obtain the ionomer the reaction mixture was evaporated to dryness and the question arises whether the ionomer is still soluble. Sol-gel analysis can give information about the soluble fraction in the ionomers and can give insight in the quality of the network formed; the gel content will be high for a network with strong crosslinks and only a few imperfections. Therefore, in this section the results of the sol-gel analysis on ionomers of different composition will be presented and discussed.

90 Chapter 6
6.2.1 Experimental
Sol-gel analysis In order to study the gel content in MAn-g-EPM based ionomers compression moulded samples (thickness ~ 2 mm) were immersed in boiling toluene for 22 hours after which the samples were dried to constant weight in a vacuum oven (24 hours, 60°C under a nitrogen atmosphere). The gel content is expressed as the weight percentage of unextracted ionomer.
6.2.2 Results
Effect of degree of neutralisation The effect of degree of neutralisation on the gel content of a zinc ionomer based on MAn-g-EPM with a degree of grafting of 7.33wt% is shown in Figure 6.1. It can be seen that the gel content increases rapidly up to a DN of 50%, after which the increase in the gel content is not very pronounced. It is also evident that for ionomers with a high DN the gel content does not exceed a value of 85wt%; even the completely neutralised ionomers contain a considerable soluble fraction.
0
25
50
75
100
0 25 50 75 100
DN (%)
Gel
con
tent
(w
t%)
Figure 6.1 Gel content as function of the degree of neutralisation of zinc ionomers based
on MAn-g-EPM with a degree of grafting of 7.33wt% Effect of degree of grafting (MAn-concentration) and degree of neutralisation Upon neutralisation the grafted MAn units are hydrolysed and subsequently the acid groups are converted to zinc carboxylate groups. The number of carboxylate groups depends on DG and DN and may be a good quantity to compare ionomers based on MAn-g-EPM with different DG and DN. The number of carboxylate groups (ϑ) can be calculated using:
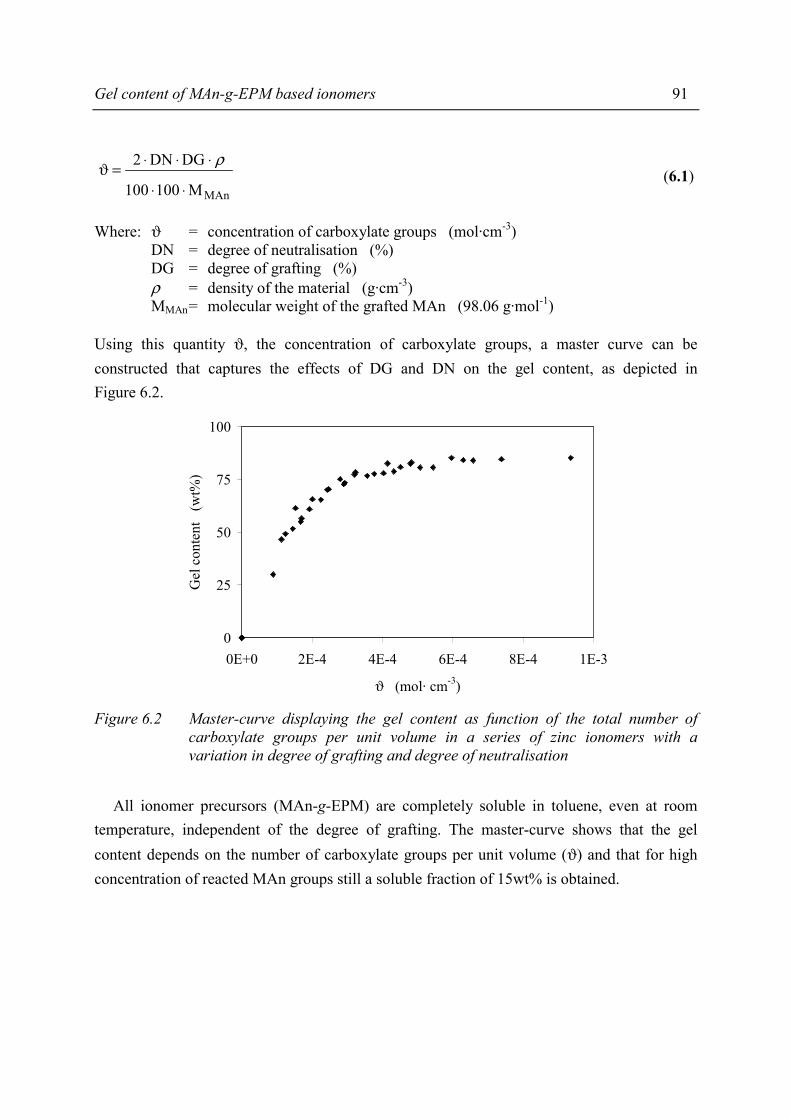
Gel content of MAn-g-EPM based ionomers 91
MAnM100100
GDDN2
⋅⋅
⋅⋅⋅=ϑ ρ (6.1)
Where: ϑ = concentration of carboxylate groups (mol·cm-3) DN = degree of neutralisation (%) DG = degree of grafting (%) ρ = density of the material (g·cm-3) MMAn = molecular weight of the grafted MAn (98.06 g·mol-1) Using this quantity ϑ, the concentration of carboxylate groups, a master curve can be constructed that captures the effects of DG and DN on the gel content, as depicted in Figure 6.2.
0
25
50
75
100
0E+0 2E-4 4E-4 6E-4 8E-4 1E-3
ϑ (mol· cm-3)
Gel
con
tent
(w
t%)
Figure 6.2 Master-curve displaying the gel content as function of the total number of
carboxylate groups per unit volume in a series of zinc ionomers with a variation in degree of grafting and degree of neutralisation
All ionomer precursors (MAn-g-EPM) are completely soluble in toluene, even at room temperature, independent of the degree of grafting. The master-curve shows that the gel content depends on the number of carboxylate groups per unit volume (ϑ) and that for high concentration of reacted MAn groups still a soluble fraction of 15wt% is obtained.
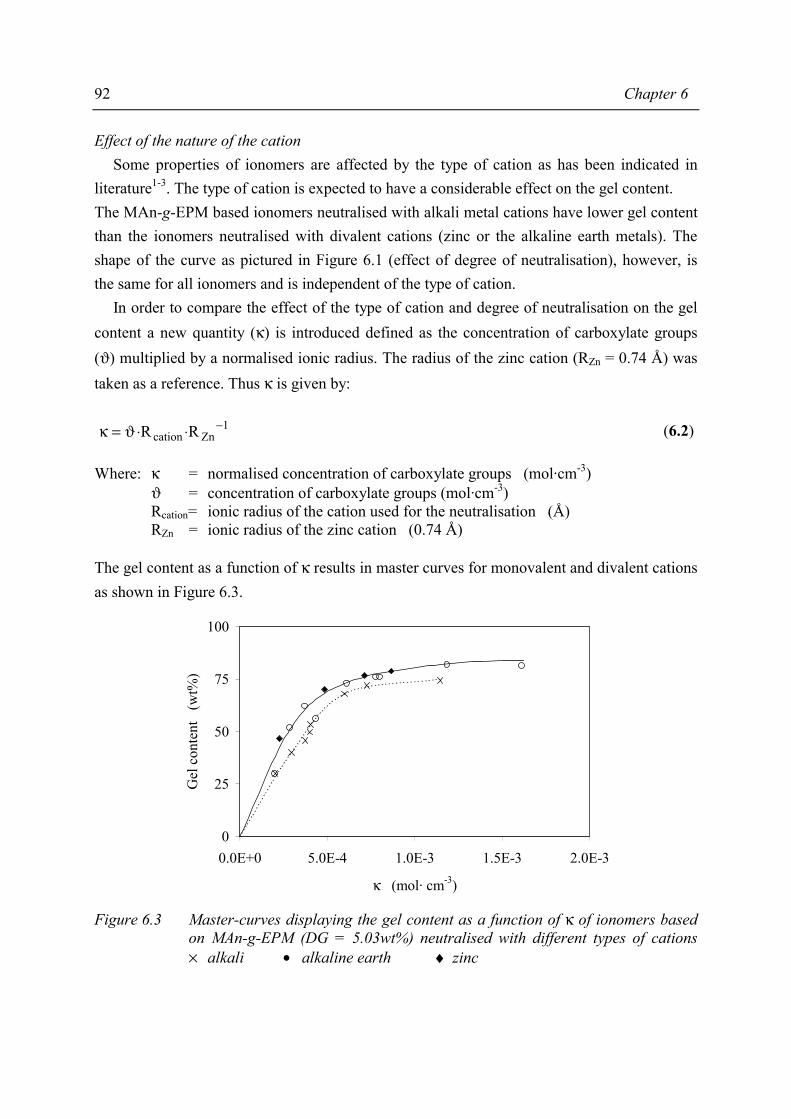
92 Chapter 6
Effect of the nature of the cation Some properties of ionomers are affected by the type of cation as has been indicated in literature1-3. The type of cation is expected to have a considerable effect on the gel content. The MAn-g-EPM based ionomers neutralised with alkali metal cations have lower gel content than the ionomers neutralised with divalent cations (zinc or the alkaline earth metals). The shape of the curve as pictured in Figure 6.1 (effect of degree of neutralisation), however, is the same for all ionomers and is independent of the type of cation. In order to compare the effect of the type of cation and degree of neutralisation on the gel content a new quantity (κ) is introduced defined as the concentration of carboxylate groups (ϑ) multiplied by a normalised ionic radius. The radius of the zinc cation (RZn = 0.74 Å) was taken as a reference. Thus κ is given by:
1Zncation RR −⋅⋅ϑ=κ (6.2)
Where: κ = normalised concentration of carboxylate groups (mol·cm-3) ϑ = concentration of carboxylate groups (mol·cm-3) Rcation= ionic radius of the cation used for the neutralisation (Å) RZn = ionic radius of the zinc cation (0.74 Å) The gel content as a function of κ results in master curves for monovalent and divalent cations as shown in Figure 6.3.
0
25
50
75
100
0.0E+0 5.0E-4 1.0E-3 1.5E-3 2.0E-3
κ (mol· cm-3)
Gel
con
tent
(w
t%)
Figure 6.3 Master-curves displaying the gel content as a function of κ of ionomers based
on MAn-g-EPM (DG = 5.03wt%) neutralised with different types of cations × alkali • alkaline earth ♦ zinc

Gel content of MAn-g-EPM based ionomers 93
Effect of molecular weight of EPM Figure 6.4 shows the effect of the degree of neutralisation on the gel content for zinc ionomers with a variation in the molecular weight of the parent EPM. In this Figure it can be seen that the gel content increases with increasing degree of neutralisation. Comparison of ionomers with equal DG and DN results in higher gel contents for the ionomers based on high molecular weight of the parent EPM.
0
25
50
75
100
0 25 50 75 100
DN (%)
Gel
con
tent
(w
t%)
Figure 6.4 Sol-gel results obtained from zinc ionomers based on MAn-g-EPM with a DG
of about 3.5wt% as function of DN for different molecular weight EPMs ♦ 20 kg·mol -1 ◊ 28 kg·mol -1 37 kg·mol -1 52 kg·mol -1 × 65 kg·mol-1
The drawn lines are only a guide to the eye
6.2.3 Discussion
Effect of degree of neutralisation Figure 6.1 shows that all ionomers exhibit a soluble fraction, including ionomers with degrees of neutralisation exceeding 50%. There are different possibilities to explain the soluble fraction. The first possibility is related to the ineffective incorporation of some part of the material in the ionomer network, because it is insufficiently linked via the ionic aggregates. Polymer chains that have a few or even no grafted MAn units are dissolved more easily than the effectively incorporated chains with higher amounts of grafted MAn. The second possibility is related to the neutralisation. It may be possible that at low degrees of neutralisation the aggregate does not contain sufficient zinc to provide a good junction between the polymer molecules. At degrees of neutralisation exceeding 50% all MAn units are bound by at least one carboxylate group which results in a stronger interaction in the aggregates, after which the change in gel content levels of. Solid state NMR experiments,

94 Chapter 6
which were performed on this series of ionomers, indicated that the ionomer network contains a considerable fraction of chain parts that do not participate in the network4. These results also revealed that the composition of the network (the ratio of elastically active network chains and ineffective network chains) does not change significantly. Considering the molecular weight distribution (Mw/Mn) of approximately 2 the low molecular weight fraction of the EPM there is a low molecular weight fraction that is more soluble than the high molecular weight fraction. The molecular weight distribution may also be a cause for the observed soluble fraction. Effect of degree of grafting and degree of neutralisation The number of reacted carboxylic acid groups (ϑ) determines the amount of insoluble material, as shown in Figure 6.2; upon increasing ϑ the gel content increases up to a maximum gel content of about 85%. As discussed above, it may be possible that there is some part of material that is ineffectively incorporated in the ionic network. The grafting of MAn onto the polyolefin takes place in a solution process5; it is assumed that the maleic anhydride is grafted onto the polymer backbone in a random fashion. However, it is possible that there are polymer chains with only one or even no MAn grafted. The polymer chains with only one MAn unit grafted are not tightly bound to the aggregates and therefore still soluble because the large polymer chain prefers the toluene environment rather than the tight ionomer network. As a result, the polymer chain will leave the ionomer network because it is only relatively loosely bound. Polymer chains without grafted MAn are part of the ionomer network via entanglements which disappear upon swelling and consequently these ‘entangled’ polymer chains are released from the network in the swollen state or under more rigorous circumstances like the extraction conditions in the gel content determination. Effect of nature of the cation The effect of type of cation was studied on ionomers prepared from MAn-g-EPM with a degree of grafting of 5.03wt%. The results of the sol-gel analysis were presented as function of the concentration of carboxylate groups multiplied by a normalised cation radius (κ). In Figure 6.3, it can be seen that the general shape of the curves is similar for the mastercurves of the mono- and divalent cations used for the neutralisation. In all series of ionomers the materials exhibit a soluble fraction of at least 15wt%. The soluble fraction of the ionomers neutralised with alkali metal cations is somewhat higher than the soluble fraction in the divalent cation neutralised ionomers.
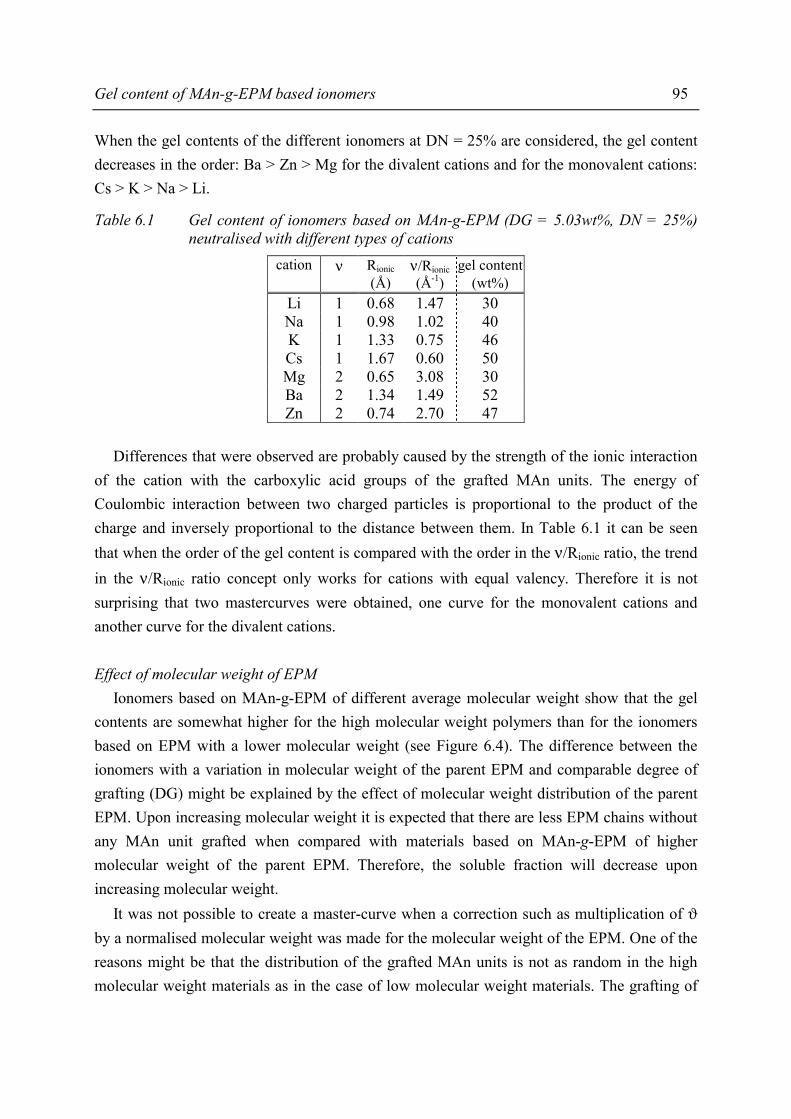
Gel content of MAn-g-EPM based ionomers 95
When the gel contents of the different ionomers at DN = 25% are considered, the gel content decreases in the order: Ba > Zn > Mg for the divalent cations and for the monovalent cations: Cs > K > Na > Li.
Table 6.1 Gel content of ionomers based on MAn-g-EPM (DG = 5.03wt%, DN = 25%) neutralised with different types of cations
cation ν Rionic ν/Rionic gel content (Å) (Å-1) (wt%)
Li 1 0.68 1.47 30 Na 1 0.98 1.02 40 K 1 1.33 0.75 46 Cs 1 1.67 0.60 50 Mg 2 0.65 3.08 30 Ba 2 1.34 1.49 52 Zn 2 0.74 2.70 47
Differences that were observed are probably caused by the strength of the ionic interaction of the cation with the carboxylic acid groups of the grafted MAn units. The energy of Coulombic interaction between two charged particles is proportional to the product of the charge and inversely proportional to the distance between them. In Table 6.1 it can be seen that when the order of the gel content is compared with the order in the ν/Rionic ratio, the trend in the ν/Rionic ratio concept only works for cations with equal valency. Therefore it is not surprising that two mastercurves were obtained, one curve for the monovalent cations and another curve for the divalent cations. Effect of molecular weight of EPM Ionomers based on MAn-g-EPM of different average molecular weight show that the gel contents are somewhat higher for the high molecular weight polymers than for the ionomers based on EPM with a lower molecular weight (see Figure 6.4). The difference between the ionomers with a variation in molecular weight of the parent EPM and comparable degree of grafting (DG) might be explained by the effect of molecular weight distribution of the parent EPM. Upon increasing molecular weight it is expected that there are less EPM chains without any MAn unit grafted when compared with materials based on MAn-g-EPM of higher molecular weight of the parent EPM. Therefore, the soluble fraction will decrease upon increasing molecular weight. It was not possible to create a master-curve when a correction such as multiplication of ϑ by a normalised molecular weight was made for the molecular weight of the EPM. One of the reasons might be that the distribution of the grafted MAn units is not as random in the high molecular weight materials as in the case of low molecular weight materials. The grafting of
96 Chapter 6
MAn onto the polyolefin takes place in a solution process5 and it is assumed that the maleic anhydride is grafted onto the polymer backbone in a random fashion. Although speculative, the use of high molecular weight polyolefins may result in a non-random grafting. As a result of the higher molecular weight of the parent EPM, and thus higher viscosity of the polymer solution, the mobility of the polymer chain fragments in solution may be lower for the higher molecular weight materials. It is imaginable that this results in a more local, or non-random, grafting onto the EPM chain fragments surrounding the MAn-rich phase. Consequently, the morphology of the ionomers differs due to the non random grafting and the creation of a master curve is not allowed because of chemical differences.
6.3 Conclusions Sol-gel analysis is usually applied for the characterisation of covalently crosslinked elastomers. From the sol-gel analysis performed on the MAn-g-EPM based ionomers it may be concluded that it is quite remarkable that the ionomers contain any gel at the severe extraction conditions applied. The presence of a gel fraction implies that at the conditions of the experiments (110°C) the network is still present. The presence of a network at these severe conditions indicates that the materials are probably still fairly good thermoplastic elastomers, even at elevated temperatures. The soluble fraction (at least 15wt%) indicates that the ionic crosslinks are not as effective as covalent crosslinks in the presence of solvent at high temperatures but at ambient temperature the properties of the material are quite satisfactory (as will be described in the next chapter). Further, it can be concluded that a degree of neutralisation of more than 50% is required for a network with considerable gel content. The sol-gel analysis showed that the observed effect can be related to the strength of the ionic interaction, but a distinction has to be made between mono- and divalent cations. At equal DN the gel content increases for higher valencies and for increasing cation radius.
6.4 References 1. Makowski, H.S., Lundberg, R.D., Westerman, L. and Bock, J., in Ions in Polymers (ACS Adv.
Chem. Ser. 187); Eisenberg, A., Ed., American Chemical Society; Washington DC, 1980, Chapter 1
2. Broze, G., Jérôme, R. and Teyssié, P., J.Polym.Sci.: Polym.Phys.Ed. 21 , 2205 (1983) 3. Eisenberg, A. and Navratil, M., Macromolecules 7, 90 (1974) 4. This thesis, Chapter 5, section 5.4 5. This thesis, Chapter 2

Chapter 7
Material properties of MAn-g-EPM based ionomers
7.1 Introduction Macroscopic properties of crosslinked elastomers are largely determined by the composition of the network, i.e. network density. For ionomers this is not necessarily straightforward, as the structure of the ionomer network is quite different from that of conventionally crosslinked elastomers. As discussed in Chapter 5, the ionomer network can be depicted as ionic aggregates in a polyolefin matrix. A complication in this description is that the ionic aggregates can be considered as small networks themselves, but then like highly crosslinked networks with high softening temperatures. The results of SAXS analysis and solid state NMR showed that the aggregates contain polymer chain fragments as well as ionic crosslinks. It was also shown that the composition of the ionomer has an important effect on the morphology of the ionomers, i.e. the size and number of ionic aggregates, and the composition of the aggregates. It is expected that the composition of the MAn-g-EPM based ionomers has also an effect on the macroscopic properties. In this chapter the most elementary properties required for a material to be termed as a thermoplastic rubber, viz. melt viscosity, tensile properties and compression set, of the ionomer as function of their composition will be discussed. First, the melt viscosity, which is an important rheological property determining the processibility, will be discussed. Subsequently, the most important mechanical properties, the hardness, the tensile modulus, tensile strength and accompanying elongation at break will be examined. In addition, the compression set, which is an important criterion for crosslinked elastomers, will be considered as function of the ionomer composition. Finally, the effect of ionomer composition on the water absorption of thin ionomer films will be studied. Considering the presence of ionic groups in the ionomers, water absorption may occur. In Chapter 8 an attempt will be made to relate the macroscopic properties of the ionomers with their morphology.
98 Chapter 7
7.2 Effect of ionomer composition on processing properties Nowhere are the effects of incorporating ionic groups into polymers as evident as in the melt flow behaviour. Though entangled polymers already have viscosities and relaxation times that are quite large compared with low molecular weight polymers, introduction of ionic groups can increase the viscosity by several orders of magnitude. In many cases this increase is undesirable, as it can make the materials difficult to process. At the same time, these ionic groups open up the possibility of producing ionic thermoplastic elastomers. The stability of the ionic aggregates at room temperatures impart rubbery behaviour while a weakening of these aggregates at elevated temperatures permits melt processing. In this section the effect of degree of neutralisation, degree of grafting and type of cation on the melt viscosity of the resulting ionomers are studied and discussed. All MAn-g-EPM precursors were based on the low molecular weight polyolefin possessing a molecular weight of Mn = 11 kg·mol-1. Rheological conditions of the different processing techniques are different, i.e. the shear rates vary between 10 and 1000 s-1. The use of a capillary rheometer allows the determination of the melt viscosity at various shear rates.
7.2.1 Experimental
Melt viscosity The rheological behaviour was studied using a Göttfert Rheograph 2002 capillary rheometer. The length to diameter ratio (L/D ratio) of the capillary used was 30:1. The preheat time for each sample was 5 min after which the samples were extruded at different shear rates at 200°C. Since a relatively long capillary was used Bagley correction was not applied. Rabinowitsch correction for the non-Newtonian character of the ionomer melt was also not applied.
7.2.2 Results
Effect of degree of grafting The log-log plots of apparent viscosity (ηapp) versus apparent shear stress (τapp) and the plots of apparent shear stress (τapp) versus shear rate ( ⋅γ) are shown in Figure 7.1. It can be
seen that an increasing degree of grafting results in an increasing apparent viscosity. The extrudates of the different ionomers tested differ in appearance. The extrudate of the ionomer based on MAn-g-EPM with the lowest degree of grafting is smoother than the extrudate of the material based on higher DG. The extrudate of the ionomer based on MAn-g-EPM with DG = 7.33wt% showed melt fracture at high shear rates (shear rates exceeding 200 s-1).

Material properties of MAn-g-EPM based ionomers 99
a) b)
1E+1
1E+2
1E+3
1E+4
1E+5
1E+3 1E+4 1E+5 1E+6 1E+7
τapp (Pa)
η app
(P
a· s)
1E+3
1E+4
1E+5
1E+6
1E+7
1E+0 1E+1 1E+2 1E+3 1E+4
γ (s-1)τ a
pp
(Pa)
·
Figure 7.1 Effect of degree of grafting on the melt flow characteristics of a zinc ionomer based on MAn-g-EPM (DN = 50%) determined at 200°C • DG = 3.51wt% DG = 5.03wt% ♦ DG = 7.33wt%
In Figure 7.1a it can be seen that at constant shear stress (τapp) the apparent viscosity (ηapp) increases with a factor of 100 for increasing the DG from 3.51wt% to 5.03wt%. While the same increase in DG shows an increase of ηapp by a factor of 3 at constant shear rate ( ⋅γ)
which is shown in Figure 7.1b. The increase in ηapp at constant τapp to the power n equals the increase in ηapp at constant ⋅γ , thus:
( ) ( )⋅
τ γη∆=η∆ app
napp
app (7.1)
This observation, in combination with the linear log-log plots of the apparent viscosity as a function of shear rate or shear stress implies that the power law of fluids is valid to describe the rheological behaviour of the ionomer melt. In subsection 7.2.3 the results will be discussed in more detail.
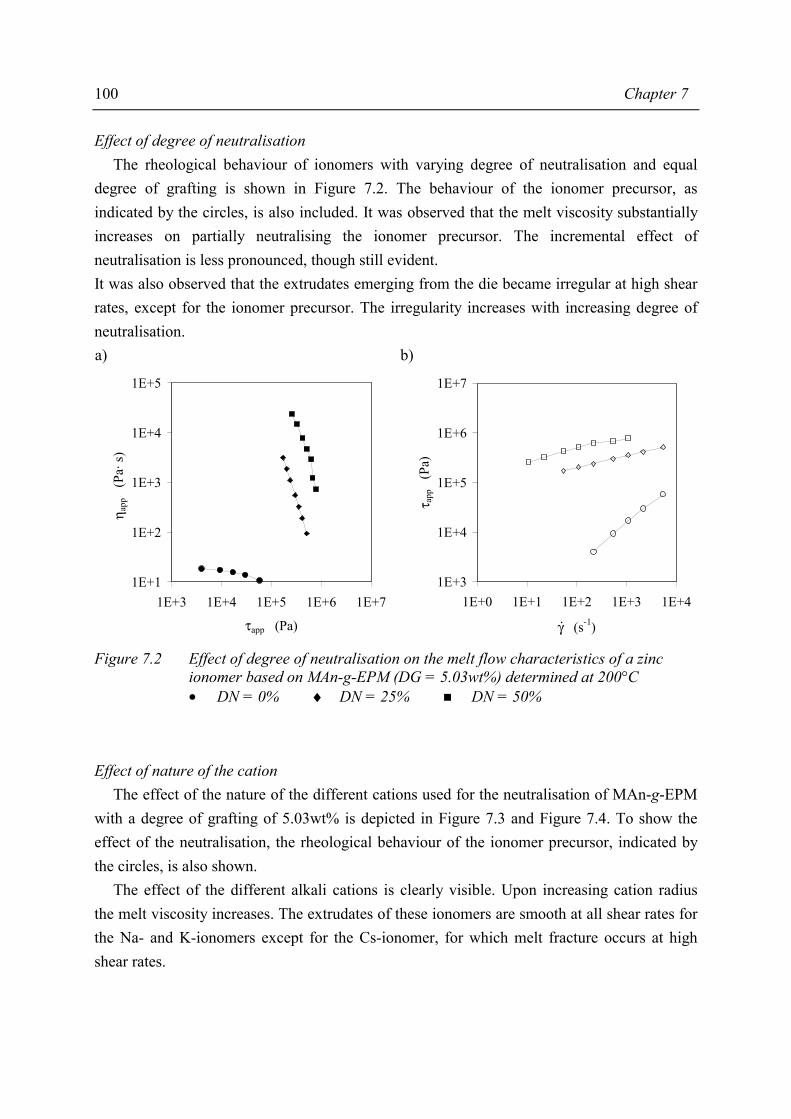
100 Chapter 7
Effect of degree of neutralisation The rheological behaviour of ionomers with varying degree of neutralisation and equal degree of grafting is shown in Figure 7.2. The behaviour of the ionomer precursor, as indicated by the circles, is also included. It was observed that the melt viscosity substantially increases on partially neutralising the ionomer precursor. The incremental effect of neutralisation is less pronounced, though still evident. It was also observed that the extrudates emerging from the die became irregular at high shear rates, except for the ionomer precursor. The irregularity increases with increasing degree of neutralisation. a) b)
1E+1
1E+2
1E+3
1E+4
1E+5
1E+3 1E+4 1E+5 1E+6 1E+7
τapp (Pa)
η app
(P
a· s)
1E+3
1E+4
1E+5
1E+6
1E+7
1E+0 1E+1 1E+2 1E+3 1E+4
γ (s-1)
τ app
(P
a)
·
Figure 7.2 Effect of degree of neutralisation on the melt flow characteristics of a zinc ionomer based on MAn-g-EPM (DG = 5.03wt%) determined at 200°C • DN = 0% ♦ DN = 25% DN = 50%
Effect of nature of the cation The effect of the nature of the different cations used for the neutralisation of MAn-g-EPM with a degree of grafting of 5.03wt% is depicted in Figure 7.3 and Figure 7.4. To show the effect of the neutralisation, the rheological behaviour of the ionomer precursor, indicated by the circles, is also shown. The effect of the different alkali cations is clearly visible. Upon increasing cation radius the melt viscosity increases. The extrudates of these ionomers are smooth at all shear rates for the Na- and K-ionomers except for the Cs-ionomer, for which melt fracture occurs at high shear rates.

Material properties of MAn-g-EPM based ionomers 101
a) b)
1E+1
1E+2
1E+3
1E+4
1E+5
1E+3 1E+4 1E+5 1E+6 1E+7
τapp (Pa)
η app
(P
a· s)
1E+3
1E+4
1E+5
1E+6
1E+7
1E+0 1E+1 1E+2 1E+3 1E+4
γ (s-1)τ a
pp
(Pa)
·
Figure 7.3 Effect of type of cation on the melt flow characteristics of an alkali ionomer based on MAn-g-EPM (DG = 5.03wt%, DN = 25%) determined at 200°C • precursor ♦ Na K Cs
Besides the variation in monovalent cations used for the neutralisation on MAn-g-EPM, divalent cations such as magnesium and barium were studied. Figure 7.4 shows the rheological behaviour of alkaline earth neutralised ionomers. It can be seen that the viscosity of the Mg ionomer is higher than the viscosity of the Ba ionomer at all shear rates. a) b)
1E+1
1E+2
1E+3
1E+4
1E+5
1E+3 1E+4 1E+5 1E+6 1E+7
τapp (Pa)
η app
(P
a· s)
1E+3
1E+4
1E+5
1E+6
1E+7
1E+0 1E+1 1E+2 1E+3 1E+4
γ (s-1)
τ app
(P
a)
·
Figure 7.4 Effect of type of cation on the melt flow characteristics of an alkaline-earth ionomer based on MAn-g-EPM (DG = 5.03wt%, DN = 25%) at 200°C • precursor Mg ♦ Ba
102 Chapter 7
The appearance of the extrudates of the alkaline earth metal cation neutralised ionomers was not as smooth as for the ionomers neutralised using alkali metal cations. Apparently, the strength of the ionic interaction is an important parameter for the melt rheology. The effect of ionic radius on the viscosity of alkaline earth metal neutralised ionomers shows an opposite behaviour when compared to the alkali metal neutralised ionomers. For the alkali metal cations the viscosity increases upon increasing cation radius, while for the alkaline-earth metal cations the viscosity decreased upon increasing cation radius.
7.2.3 Discussion
The log-log plots of apparent viscosity (ηapp) versus apparent shear stress (τapp) and plots of τapp versus shear rate ( ⋅γ ) were shown in Figure 7.1 through Figure 7.4. The log-log plots of
shear stress versus shear rate are linear. Therefore, it is assumed that a power law model of flow can describe the rheological behaviour of the ionomers. The power law of fluids describes the variation of apparent shear stress with apparent shear rate according to:
napp K ⋅γ=τ (7.2)
The values of K and n are constants characteristic for the material. The constant n is usually called non-Newtonian index or flow behaviour index. From the slope of the τapp versus ⋅γ
curves the value of n can be calculated (see Table 7.1). Common values of the flow behaviour index for polymers are 0.3 < n < 0.6. From the table it can be seen that the ionomers exhibit relatively low values for n. In the series of ionomers with a variation in degree of grafting (DG) an increase in viscosity with increasing DG was observed (Figure 7.1). Upon increasing DG the n-value slightly decreases, thus the deviation from Newtonian behaviour of the ionomer melt increases.
Table 7.1 Flow parameters at 200°C for ionomers based on MAn-g-EPM
Figure DG DN cation n (wt%) (%)
7.1 3.51 50 Zn 0.245 7.1 5.03 50 Zn 0.237 7.1 7.33 50 Zn 0.226 7.2 5.03 0 --- 0.835 7.2 5.03 25 Zn 0.238 7.2 5.03 50 Zn 0.237 7.3 5.03 25 Na 0.439 7.3 5.03 25 K 0.318 7.3 5.03 25 Cs 0.250 7.4 5.03 25 Mg 0.238 7.4 5.03 25 Ba 0.252
Material properties of MAn-g-EPM based ionomers 103
The observation of melt fracture and irregular extrudates suggests that the material did not develop laminar flow and that the material was pushed through the capillary as a plug. Though this is a normal feature in rubbers, differences were observed between the various ionomers studied which implies that ionomer composition affects the flow behaviour. It was found that the material with high degree of neutralisation exhibits a higher melt viscosity at constant shear rates than the material with lower degree of neutralisation (Figure 7.2). The higher melt viscosity of the former material is probably due to the reduction of chain mobility resulting from the strong ionic interaction. The increasing irregularity of the extrudates emerging from the die upon increasing DN is also indicative of a strong interaction in the ionomers which is present even at high temperatures. The presence of the ionic interaction at high temperatures was also reported in literature, Rees and Vaughan1 studied the melt rheology of an ethylene-methacrylic acid copolymer and its ionomer. The activation energy for viscous flow was reported for polyethylene (7-10 kcal·mol-1), the ionomer precursor (14 kcal·mol-1) and the ionomer (17-20 kcal·mol-1). From these results it can be concluded that the melt rheology of the ionomers is considerably more dependent on temperature than that of common thermoplastic processible polymers. The viscosity versus shear rate behaviour of monovalent and divalent salts at equivalent degree of neutralisation show some differences. In the case of the alkali metal ions, the viscosity increases with increasing ionic radius while in the case of the divalent alkaline earth metal ions, the viscosity decreases with increasing ionic radius.
7.2.4 Conclusions
From the results of capillary rheological measurements, it can be concluded that the MAn-g-EPM based ionomers are thermoplastic processible, though the viscosity is strongly dependent on the degree of grafting, degree of neutralisation and type of cation. The increase in viscosity, when compared with the ionomer precursor, was observed for all ionomers to be independent of the degree of grafting, degree of neutralisation or the type of cation. Neutralisation of the anhydride groups causes an increase in the melt viscosity of several orders of magnitude. From the results it can be concluded that the ionic interaction is very strong, even at temperatures as high as 200°C. This implies that the ionic interactions weaken only slightly but enough for the material to become processible. The relatively strong interaction was also evident from the surface appearance of the extrudates, which was in some cases irregular.
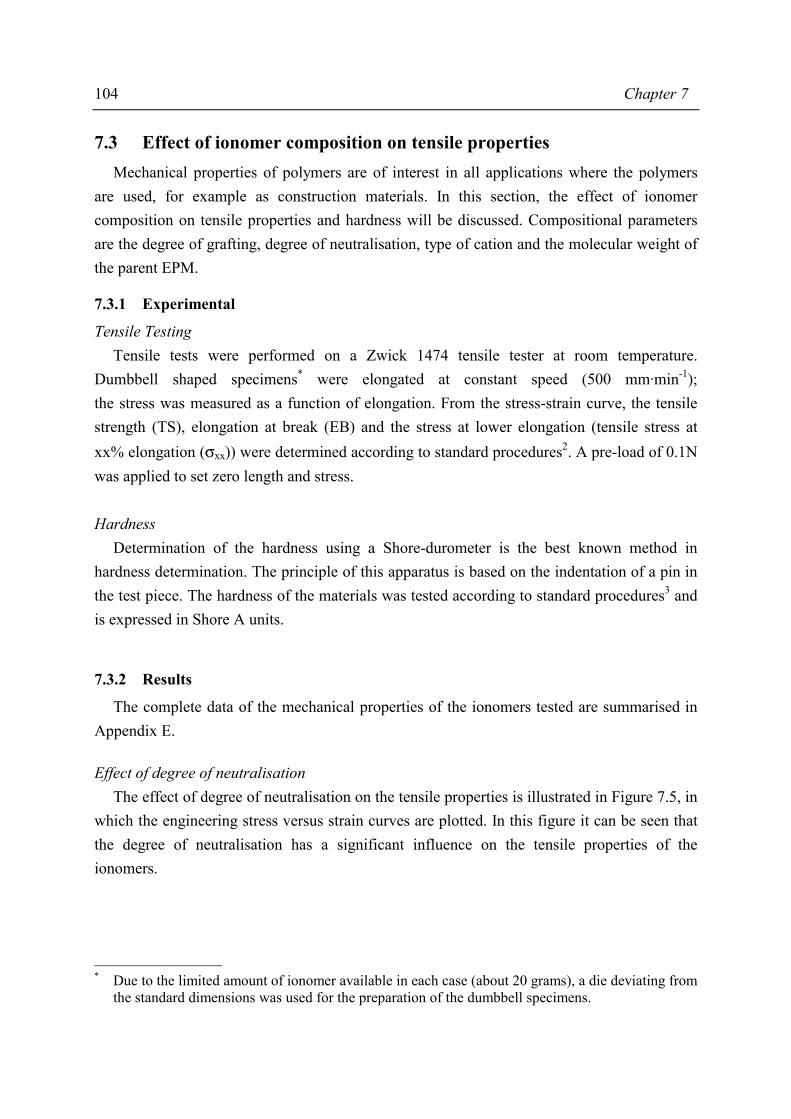
104 Chapter 7
7.3 Effect of ionomer composition on tensile properties Mechanical properties of polymers are of interest in all applications where the polymers are used, for example as construction materials. In this section, the effect of ionomer composition on tensile properties and hardness will be discussed. Compositional parameters are the degree of grafting, degree of neutralisation, type of cation and the molecular weight of the parent EPM.
7.3.1 Experimental
Tensile Testing Tensile tests were performed on a Zwick 1474 tensile tester at room temperature. Dumbbell shaped specimens* were elongated at constant speed (500 mm·min-1); the stress was measured as a function of elongation. From the stress-strain curve, the tensile strength (TS), elongation at break (EB) and the stress at lower elongation (tensile stress at xx% elongation (σxx)) were determined according to standard procedures2. A pre-load of 0.1N was applied to set zero length and stress. Hardness Determination of the hardness using a Shore-durometer is the best known method in hardness determination. The principle of this apparatus is based on the indentation of a pin in the test piece. The hardness of the materials was tested according to standard procedures3 and is expressed in Shore A units.
7.3.2 Results
The complete data of the mechanical properties of the ionomers tested are summarised in Appendix E. Effect of degree of neutralisation The effect of degree of neutralisation on the tensile properties is illustrated in Figure 7.5, in which the engineering stress versus strain curves are plotted. In this figure it can be seen that the degree of neutralisation has a significant influence on the tensile properties of the ionomers.
________________ * Due to the limited amount of ionomer available in each case (about 20 grams), a die deviating from
the standard dimensions was used for the preparation of the dumbbell specimens.
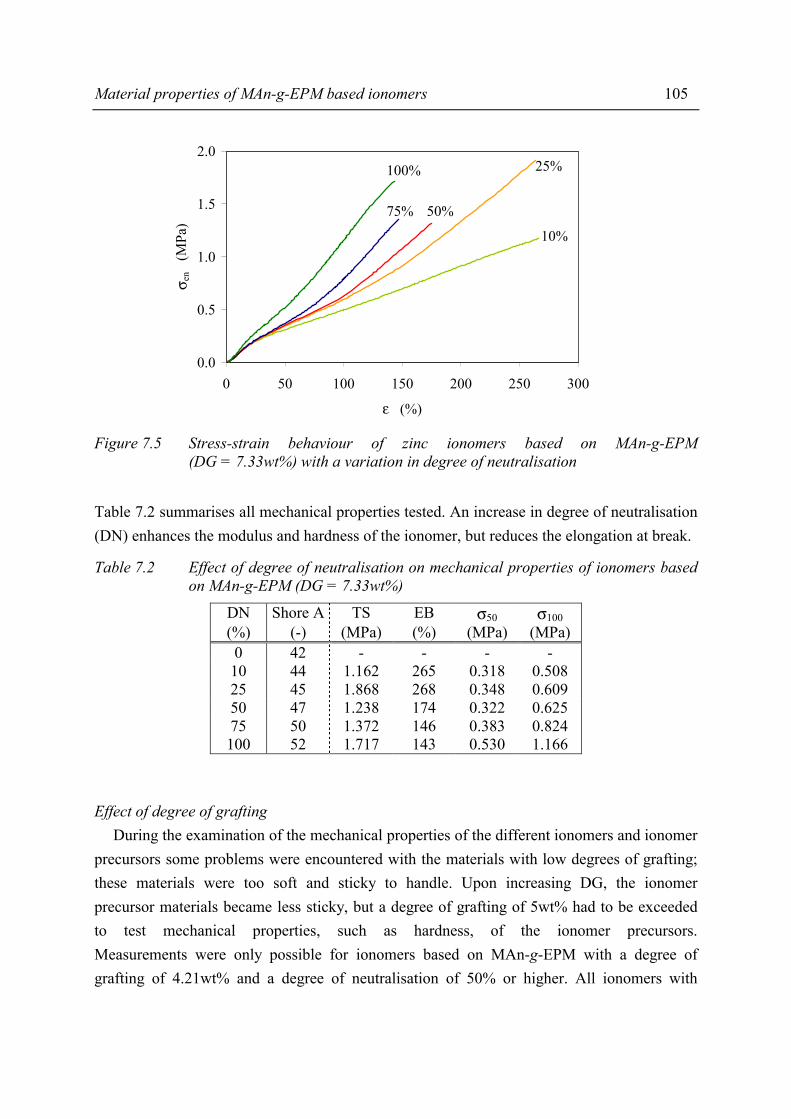
Material properties of MAn-g-EPM based ionomers 105
0.0
0.5
1.0
1.5
2.0
0 50 100 150 200 250 300
ε (%)
σ en
(MPa
)100%
75% 50%
25%
10%
Figure 7.5 Stress-strain behaviour of zinc ionomers based on MAn-g-EPM
(DG = 7.33wt%) with a variation in degree of neutralisation Table 7.2 summarises all mechanical properties tested. An increase in degree of neutralisation (DN) enhances the modulus and hardness of the ionomer, but reduces the elongation at break.
Table 7.2 Effect of degree of neutralisation on mechanical properties of ionomers based on MAn-g-EPM (DG = 7.33wt%)
DN Shore A TS EB σ50 σ100 (%) (-) (MPa) (%) (MPa) (MPa) 0 42 - - - -
10 44 1.162 265 0.318 0.508 25 45 1.868 268 0.348 0.609 50 47 1.238 174 0.322 0.625 75 50 1.372 146 0.383 0.824 100 52 1.717 143 0.530 1.166
Effect of degree of grafting During the examination of the mechanical properties of the different ionomers and ionomer precursors some problems were encountered with the materials with low degrees of grafting; these materials were too soft and sticky to handle. Upon increasing DG, the ionomer precursor materials became less sticky, but a degree of grafting of 5wt% had to be exceeded to test mechanical properties, such as hardness, of the ionomer precursors. Measurements were only possible for ionomers based on MAn-g-EPM with a degree of grafting of 4.21wt% and a degree of neutralisation of 50% or higher. All ionomers with
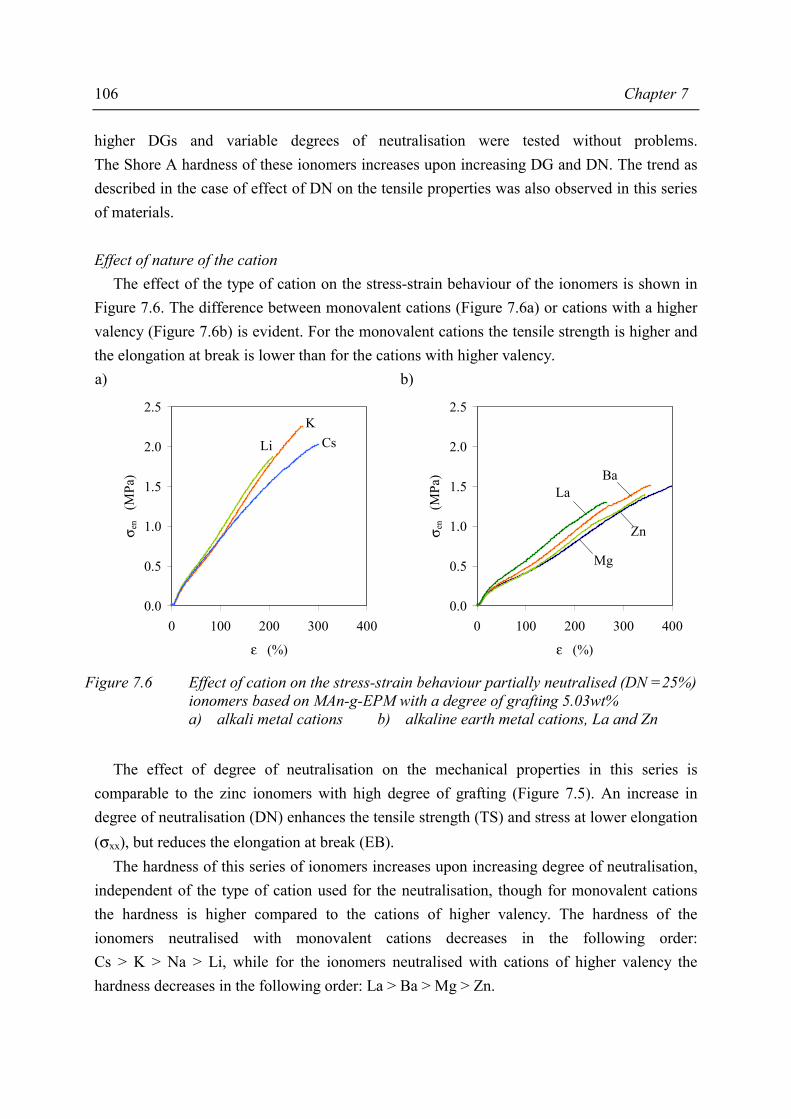
106 Chapter 7
higher DGs and variable degrees of neutralisation were tested without problems. The Shore A hardness of these ionomers increases upon increasing DG and DN. The trend as described in the case of effect of DN on the tensile properties was also observed in this series of materials. Effect of nature of the cation The effect of the type of cation on the stress-strain behaviour of the ionomers is shown in Figure 7.6. The difference between monovalent cations (Figure 7.6a) or cations with a higher valency (Figure 7.6b) is evident. For the monovalent cations the tensile strength is higher and the elongation at break is lower than for the cations with higher valency. a) b)
0.0
0.5
1.0
1.5
2.0
2.5
0 100 200 300 400
ε (%)
σ en
(MPa
)
CsLi
K
0.0
0.5
1.0
1.5
2.0
2.5
0 100 200 300 400
ε (%)
σ en
(MPa
)
La
Zn
Mg
Ba
Figure 7.6 Effect of cation on the stress-strain behaviour partially neutralised (DN =25%)
ionomers based on MAn-g-EPM with a degree of grafting 5.03wt% a) alkali metal cations b) alkaline earth metal cations, La and Zn
The effect of degree of neutralisation on the mechanical properties in this series is comparable to the zinc ionomers with high degree of grafting (Figure 7.5). An increase in degree of neutralisation (DN) enhances the tensile strength (TS) and stress at lower elongation (σxx), but reduces the elongation at break (EB). The hardness of this series of ionomers increases upon increasing degree of neutralisation, independent of the type of cation used for the neutralisation, though for monovalent cations the hardness is higher compared to the cations of higher valency. The hardness of the ionomers neutralised with monovalent cations decreases in the following order: Cs > K > Na > Li, while for the ionomers neutralised with cations of higher valency the hardness decreases in the following order: La > Ba > Mg > Zn.
Material properties of MAn-g-EPM based ionomers 107
Effect of molecular weight of EPM Figure 7.7 is illustrative for the effect of molecular weight on the tensile properties. Table 7.3 summarises the tensile properties of these zinc ionomers prepared by the neutralisation of MAn-g-EPM with varying molecular weight and a DN of 25%. The tensile strength (TS) and stress at intermediate elongations (σxx) increase with increasing molecular weight, while the elongation at break decreases. The same trends are observed for all degrees of neutralisation. As can be seen in Table 7.3, the hardness and tensile strength of the partially neutralised ionomers increases and elongation at break decreases with increasing molecular weight.
0
1
2
3
4
5
0 10 20 30 40 50 60 70 80
Mn (kg· mol-1)
TS, σ
xx
(MPa
)
0
150
300
450
600
EB
(%)
Figure 7.7 Tensile properties of partially neutralised (DN=25%) zinc ionomers based on
MAn-g-EPM with a degree of grafting of about 3.5wt% o EB ♦ σ50 ◊ σ100 σ300 × TS
Table 7.3 Effect of molecular weight of the EPM on mechanical properties of partially neutralised zinc ionomers (DN = 25%)
Mn Shore A TS EB σ50 σ100 σ300 (kg·mol-1) (-) (MPa) (%) (MPa) (MPa) (MPa)
20 40 1.89 377 0.54 0.77 1.64 28 51 3.20 519 0.76 1.07 2.02 37 55 4.12 416 1.05 1.51 3.10 52 57 4.09 359 1.17 1.72 3.65 65 59 4.66 416 1.24 1.77 2.41
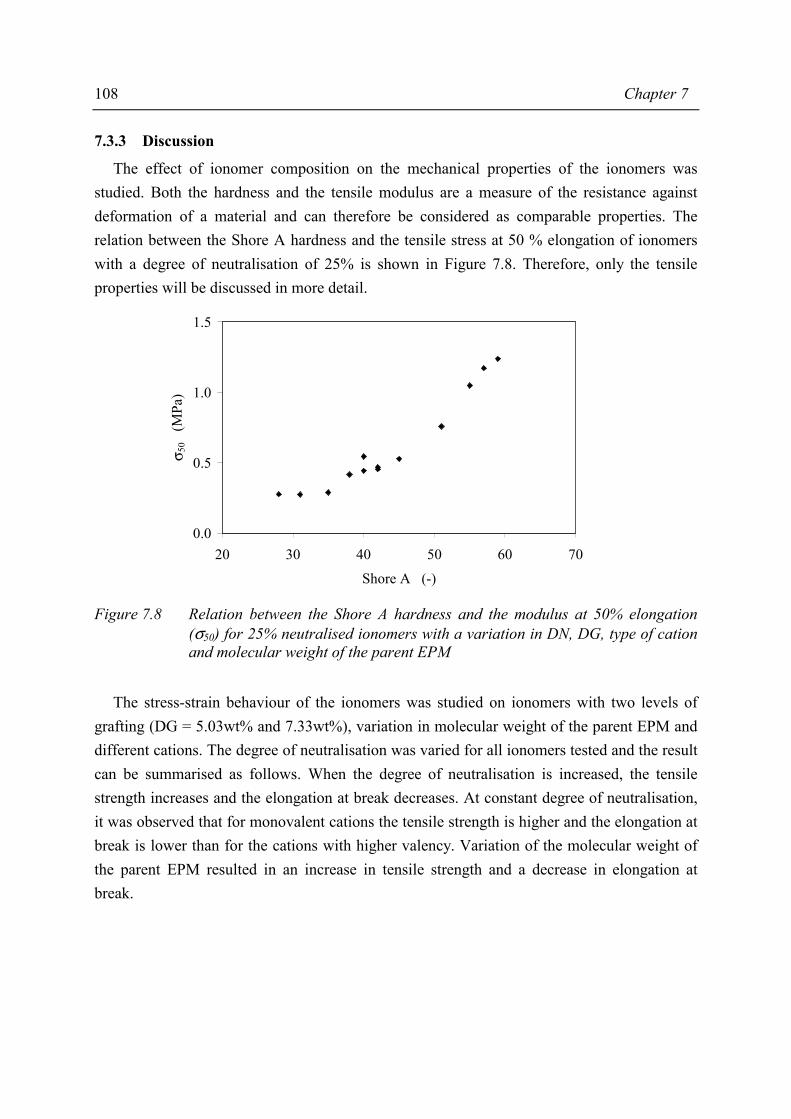
108 Chapter 7
7.3.3 Discussion
The effect of ionomer composition on the mechanical properties of the ionomers was studied. Both the hardness and the tensile modulus are a measure of the resistance against deformation of a material and can therefore be considered as comparable properties. The relation between the Shore A hardness and the tensile stress at 50 % elongation of ionomers with a degree of neutralisation of 25% is shown in Figure 7.8. Therefore, only the tensile properties will be discussed in more detail.
0.0
0.5
1.0
1.5
20 30 40 50 60 70
Shore A (-)
σ 50
(MPa
)
Figure 7.8 Relation between the Shore A hardness and the modulus at 50% elongation
(σ50) for 25% neutralised ionomers with a variation in DN, DG, type of cation and molecular weight of the parent EPM
The stress-strain behaviour of the ionomers was studied on ionomers with two levels of grafting (DG = 5.03wt% and 7.33wt%), variation in molecular weight of the parent EPM and different cations. The degree of neutralisation was varied for all ionomers tested and the result can be summarised as follows. When the degree of neutralisation is increased, the tensile strength increases and the elongation at break decreases. At constant degree of neutralisation, it was observed that for monovalent cations the tensile strength is higher and the elongation at break is lower than for the cations with higher valency. Variation of the molecular weight of the parent EPM resulted in an increase in tensile strength and a decrease in elongation at break.
Material properties of MAn-g-EPM based ionomers 109
7.3.4 Summary
The tensile properties and hardness of the resulting products were affected by the composition of the ionomer. The effect of degree of grafting was already noticeable in the appearance of the ionomer precursors. Upon increasing the degree of grafting the materials became less sticky and it became possible to determine mechanical properties for materials with a degree of grafting exceeding 5wt%. The increasing average number of grafted MAn units per polymer chain thus increasing network density can explain this effect. Upon increasing DG the tensile strength and hardness increased while the elongation at break decreased. The same trend was observed when the degree of neutralisation was increased. There was a clear difference between the monovalent cations used for the neutralisation and the cations with higher valency. For the monovalent cations the tensile strength is higher and the elongation at break is lower than for the cations with higher valency. The hardness of ionomers neutralised using different cations shows an increase upon increasing degree of neutralisation, independent of the type of cation. Shore A hardness, tensile strength and stress at intermediate elongation increase with increasing molecular weight while the elongation at break decreases.
7.4 Effect of ionomer composition on the compression set An important criterion for product quality in rubber technology is the compression set. The compression set is a measure for the long term stability of the crosslinks present in the system. In this section the compression set data of the MAn-g-EPM based ionomers as a function of DG, DN type of cation and molecular weight of the parent EPM, are presented and discussed.
7.4.1 Experimental
Compression Set (CS) The test-pieces in compression set testing have a cylindrical shape and the use of spacers between the clamps allows accurate setting of the applied deformation. The samples are compressed during 22 hours at 23°C or at 70°C with a linear deformation of 25%. The compression set is determined after a relaxation time without deformation of 30 min at ambient temperature4.

110 Chapter 7
Compression set (CS) is expressed as a percentage of the original deformation as follows:
( )( )
100tt
ttCS
no
io ×
−
−= (7.3)
Where: CS = compression set (%) to = original thickness of the sample (m) ti = final thickness of the sample (m) tn = thickness during deformation (thickness of the spacer) (m)
7.4.2 Results
The compression set of the ionomers was determined at 23°C and 70°C, in Appendix E all compression set values of the ionomers with a variation in composition are summarised. Effect of degree of neutralisation In Figure 7.9 the effect of degree of neutralisation on the compression set is presented. It can be seen that the compression set decreases upon increasing degree of neutralisation. The compression set values determined at 70°C (CS70) show a rapid decrease up to a degree of neutralisation of 50%. Upon further neutralisation, it is observed that an increasing DN results in a lowered CS but the decrease is not as pronounced. The measurements performed at 23°C do not show this pronounced effect. This observation will be discussed later.
0
25
50
75
100
0 25 50 75 100DN (%)
CS
(%
)
Figure 7.9 Effect of degree of neutralisation on the compression set of for zinc ionomers
based on MAn-g-EPM (DG = 7.33wt%) ♦ 23°C ◊ 70°C

Material properties of MAn-g-EPM based ionomers 111
Effect of the nature of the cation The experiments showed that for both temperatures the compression set decreases in the following order for the monovalent cations: Li > Na > K > Cs. In the case of the cations with higher valency the tendency at 23°C is slightly different than the order observed at 70°C. The compression set at 23°C decreases in the order: Ba > Mg > Zn > La while the order of the compression set at 70°C is: Mg > Ba > Zn > La. Effect of molecular weight of EPM The variation of molecular weight results in an increasing compression set upon decreasing molecular weight, while for a given molecular weight an increase in degree of neutralisation reduces the compression set. Effect of degree of grafting Similar to the tensile testing and hardness determination of the ionomers, compression set could only be measured for ionomers with DG higher than 4.21 wt% and variable degrees of neutralisation. Figure 7.10 shows the effect of DG and DN for the materials that were tested. It can be seen that upon increasing degree of neutralisation and degree of grafting the compression set decreases.
0
25
50
75
100
0E+0 1E-3 2E-3
ϑ (mol· cm-3)
CS
(%
)
Figure 7.10 Effect of degree of grafting and degree of neutralisation on the compression set
of MAn-g-EPM based zinc ionomers + DG = 4.21wt% DG = 5.40wt% ◊ DG = 6.35wt%
DG = 6.95wt% ♦ DG = 8.53wt% Solid line: CS23 Dashed line: CS70
112 Chapter 7
7.4.3 Discussion
The compression set of the ionomers was determined at 23°C and 70°C (CS23 and CS70). It was observed for all materials that CS70 was larger than CS23, the value of CS70 was approximately a factor of 2 larger than CS23. At elevated temperature the permanent deformation is higher. Upon deformation, the network structure is affected due to physical and chemical relaxation. At the same time, in the deformed state, a new network is formed as a result of recombination of ‘broken’ parts. After releasing the deformation, an equilibrium situation will be formed between the remains of the original network (that wants to recover) and the new network (that want to remain in the compressed state). In the next chapter this mechanism will be viewed more closely.
7.4.4 Conclusion
From the results of the compression set measurements it became clear that ionomer composition affects the compression set. Upon increasing degree of grafting, degree of neutralisation or molecular weight of the parent EPM the compression set decreases. The effect of increasing degree of neutralisation is independent of type of cation.
7.5 Effect of ionomer composition on water absorption
7.5.1 Introduction
Due to the presence of ionic aggregates in the ionomer matrix it is expected that these materials are somewhat hydrophilic. Since the EPM-matrix is rubbery and apolar, the water will reside preferentially in the ionic aggregates. Consequently, these aggregates will swell upon exposure to water. In this section the results of water absorption studies of different ionomers are presented and discussed. The composition of the ionomers was varied by changing the degree of grafting, degree of neutralisation, type of cation or the molecular weight of the parent EPM.
7.5.2 Experimental
Water absorption The samples were first hot-pressed into thin films (thickness ~ 0.5 mm), which were then cut into 1cm x 1cm pieces and weighed. The thin films were immersed in water at room temperature and removed after different time intervals. The excess water was absorbed from the surface by filtration paper and the films were weighed. Subsequently, the samples were immersed in water again for longer term data.
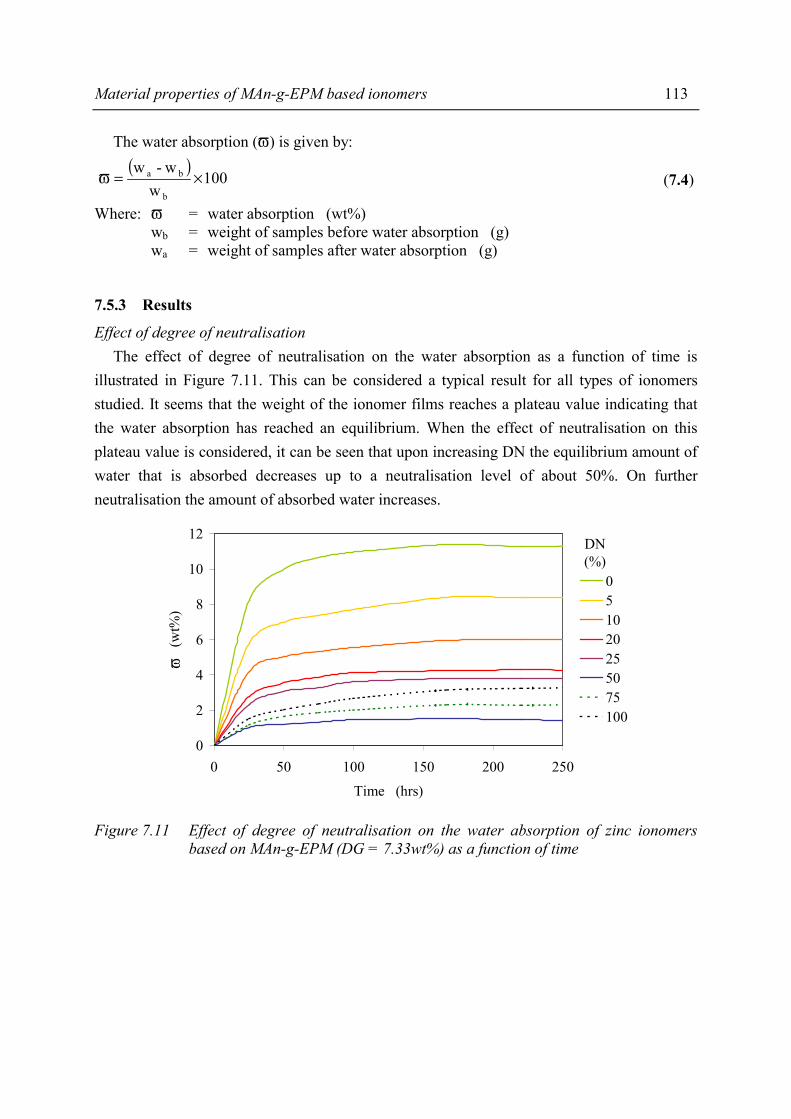
Material properties of MAn-g-EPM based ionomers 113
The water absorption (ϖ) is given by: ( )
100w
w- w
b
ba ×=ϖ (7.4)
Where: ϖ = water absorption (wt%) wb = weight of samples before water absorption (g) wa = weight of samples after water absorption (g)
7.5.3 Results
Effect of degree of neutralisation The effect of degree of neutralisation on the water absorption as a function of time is illustrated in Figure 7.11. This can be considered a typical result for all types of ionomers studied. It seems that the weight of the ionomer films reaches a plateau value indicating that the water absorption has reached an equilibrium. When the effect of neutralisation on this plateau value is considered, it can be seen that upon increasing DN the equilibrium amount of water that is absorbed decreases up to a neutralisation level of about 50%. On further neutralisation the amount of absorbed water increases.
0
2
4
6
8
10
12
0 50 100 150 200 250
Time (hrs)
ϖ
(wt%
)
051020255075100
DN(%)
Figure 7.11 Effect of degree of neutralisation on the water absorption of zinc ionomers
based on MAn-g-EPM (DG = 7.33wt%) as a function of time
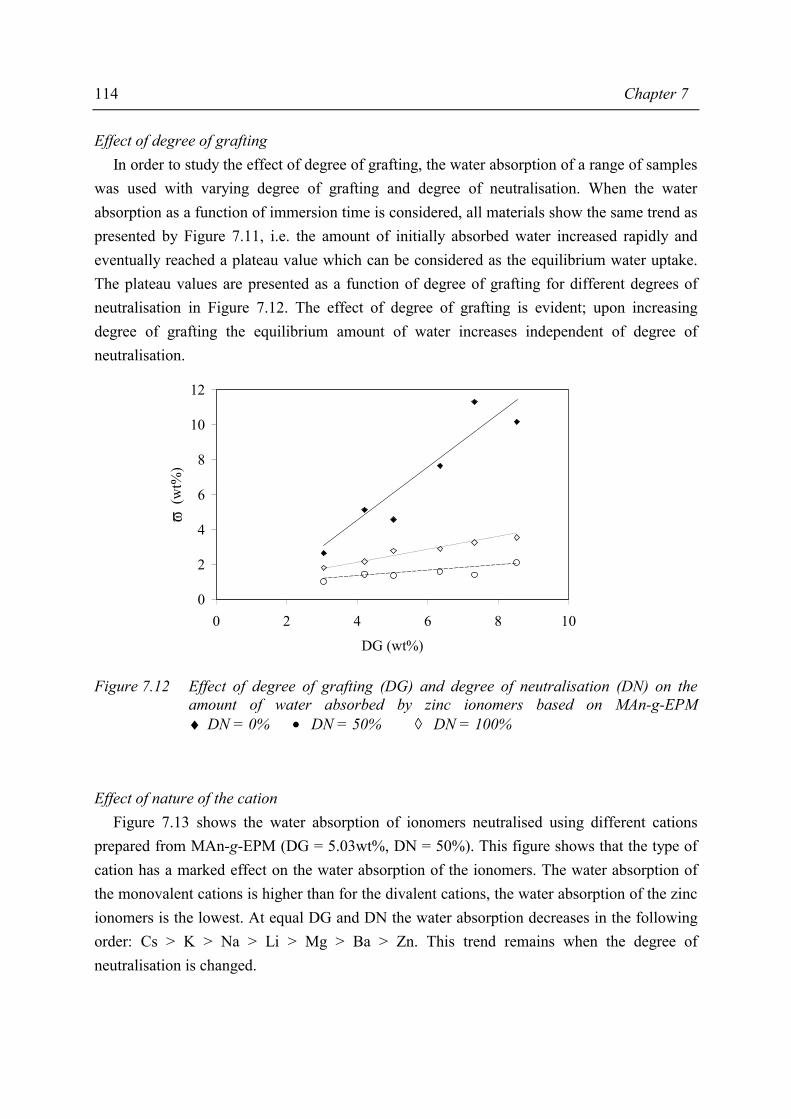
114 Chapter 7
Effect of degree of grafting In order to study the effect of degree of grafting, the water absorption of a range of samples was used with varying degree of grafting and degree of neutralisation. When the water absorption as a function of immersion time is considered, all materials show the same trend as presented by Figure 7.11, i.e. the amount of initially absorbed water increased rapidly and eventually reached a plateau value which can be considered as the equilibrium water uptake. The plateau values are presented as a function of degree of grafting for different degrees of neutralisation in Figure 7.12. The effect of degree of grafting is evident; upon increasing degree of grafting the equilibrium amount of water increases independent of degree of neutralisation.
0
2
4
6
8
10
12
0 2 4 6 8 10
DG (wt%)
ϖ (
wt%
)
Figure 7.12 Effect of degree of grafting (DG) and degree of neutralisation (DN) on the
amount of water absorbed by zinc ionomers based on MAn-g-EPM ♦ DN = 0% • DN = 50% ◊ DN = 100%
Effect of nature of the cation Figure 7.13 shows the water absorption of ionomers neutralised using different cations prepared from MAn-g-EPM (DG = 5.03wt%, DN = 50%). This figure shows that the type of cation has a marked effect on the water absorption of the ionomers. The water absorption of the monovalent cations is higher than for the divalent cations, the water absorption of the zinc ionomers is the lowest. At equal DG and DN the water absorption decreases in the following order: Cs > K > Na > Li > Mg > Ba > Zn. This trend remains when the degree of neutralisation is changed.
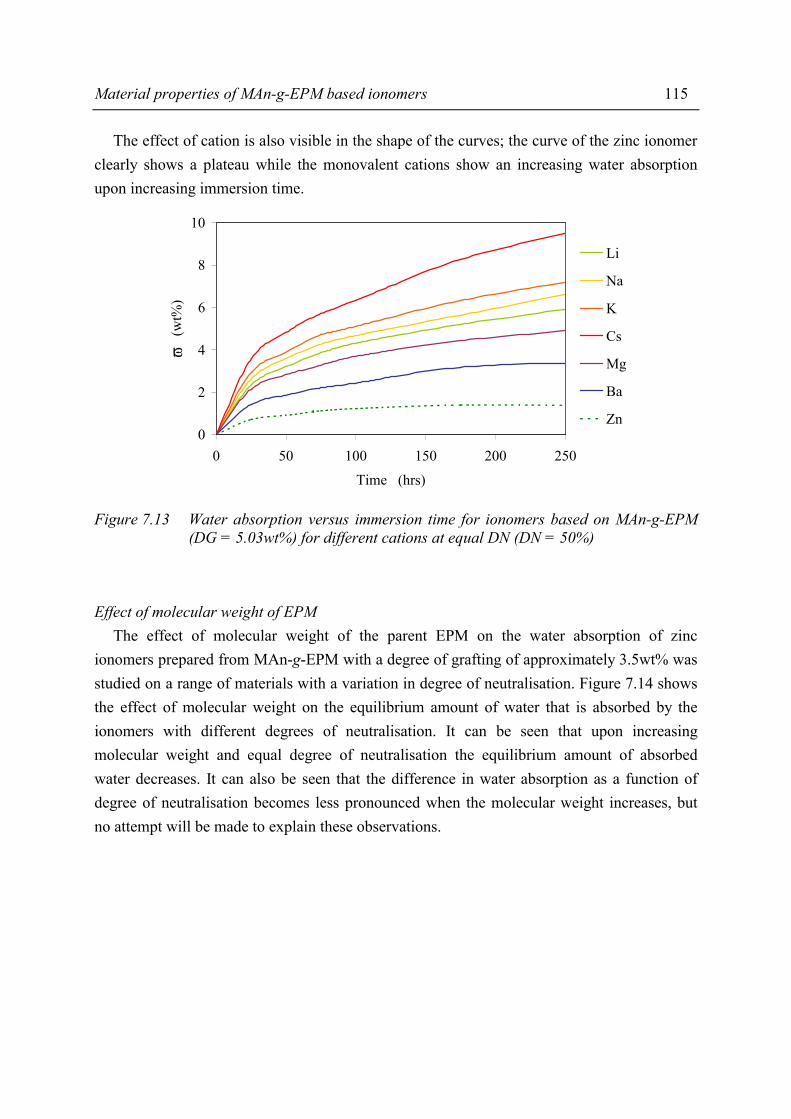
Material properties of MAn-g-EPM based ionomers 115
The effect of cation is also visible in the shape of the curves; the curve of the zinc ionomer clearly shows a plateau while the monovalent cations show an increasing water absorption upon increasing immersion time.
0
2
4
6
8
10
0 50 100 150 200 250
Time (hrs)
ϖ
(wt%
)
Li
Na
K
Cs
Mg
Ba
Zn
Figure 7.13 Water absorption versus immersion time for ionomers based on MAn-g-EPM
(DG = 5.03wt%) for different cations at equal DN (DN = 50%) Effect of molecular weight of EPM The effect of molecular weight of the parent EPM on the water absorption of zinc ionomers prepared from MAn-g-EPM with a degree of grafting of approximately 3.5wt% was studied on a range of materials with a variation in degree of neutralisation. Figure 7.14 shows the effect of molecular weight on the equilibrium amount of water that is absorbed by the ionomers with different degrees of neutralisation. It can be seen that upon increasing molecular weight and equal degree of neutralisation the equilibrium amount of absorbed water decreases. It can also be seen that the difference in water absorption as a function of degree of neutralisation becomes less pronounced when the molecular weight increases, but no attempt will be made to explain these observations.
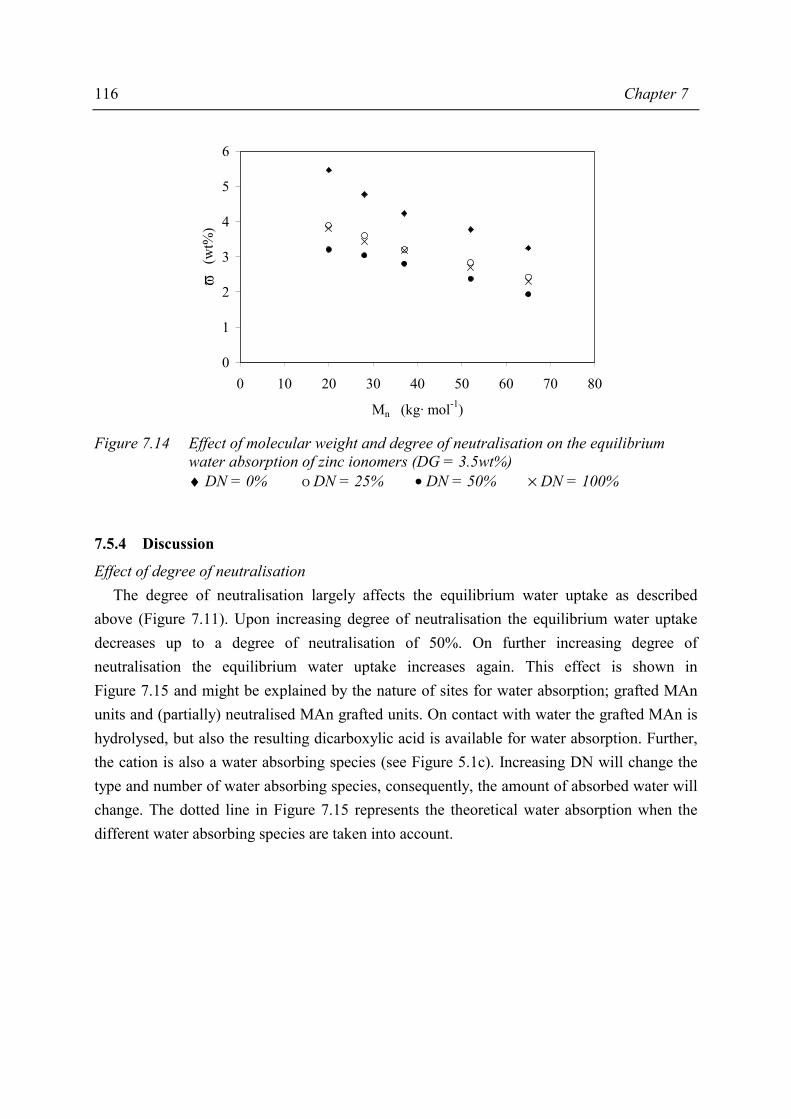
116 Chapter 7
0
1
2
3
4
5
6
0 10 20 30 40 50 60 70 80
Mn (kg· mol-1)
ϖ
(wt%
)
Figure 7.14 Effect of molecular weight and degree of neutralisation on the equilibrium
water absorption of zinc ionomers (DG = 3.5wt%) ♦ DN = 0% Ο DN = 25% • DN = 50% × DN = 100%
7.5.4 Discussion
Effect of degree of neutralisation The degree of neutralisation largely affects the equilibrium water uptake as described above (Figure 7.11). Upon increasing degree of neutralisation the equilibrium water uptake decreases up to a degree of neutralisation of 50%. On further increasing degree of neutralisation the equilibrium water uptake increases again. This effect is shown in Figure 7.15 and might be explained by the nature of sites for water absorption; grafted MAn units and (partially) neutralised MAn grafted units. On contact with water the grafted MAn is hydrolysed, but also the resulting dicarboxylic acid is available for water absorption. Further, the cation is also a water absorbing species (see Figure 5.1c). Increasing DN will change the type and number of water absorbing species, consequently, the amount of absorbed water will change. The dotted line in Figure 7.15 represents the theoretical water absorption when the different water absorbing species are taken into account.
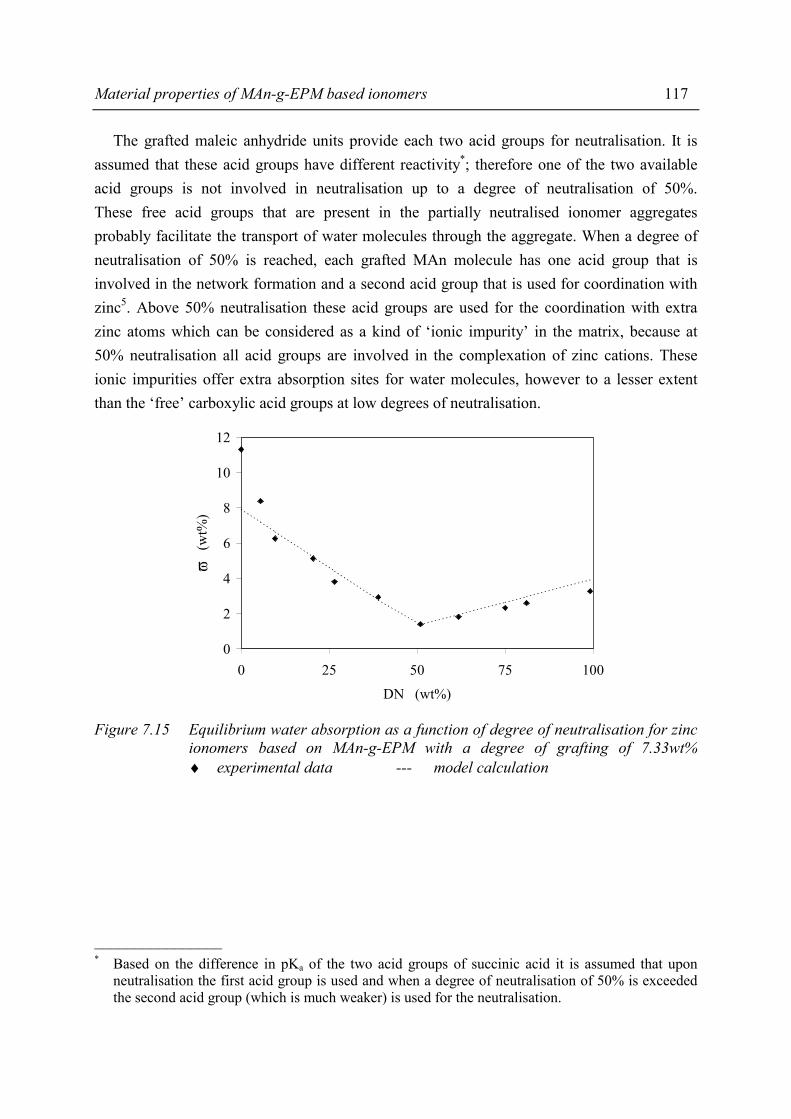
Material properties of MAn-g-EPM based ionomers 117
The grafted maleic anhydride units provide each two acid groups for neutralisation. It is assumed that these acid groups have different reactivity*; therefore one of the two available acid groups is not involved in neutralisation up to a degree of neutralisation of 50%. These free acid groups that are present in the partially neutralised ionomer aggregates probably facilitate the transport of water molecules through the aggregate. When a degree of neutralisation of 50% is reached, each grafted MAn molecule has one acid group that is involved in the network formation and a second acid group that is used for coordination with zinc5. Above 50% neutralisation these acid groups are used for the coordination with extra zinc atoms which can be considered as a kind of ‘ionic impurity’ in the matrix, because at 50% neutralisation all acid groups are involved in the complexation of zinc cations. These ionic impurities offer extra absorption sites for water molecules, however to a lesser extent than the ‘free’ carboxylic acid groups at low degrees of neutralisation.
0
2
4
6
8
10
12
0 25 50 75 100
DN (wt%)
ϖ
(wt%
)
Figure 7.15 Equilibrium water absorption as a function of degree of neutralisation for zinc
ionomers based on MAn-g-EPM with a degree of grafting of 7.33wt% ♦ experimental data --- model calculation
________________ * Based on the difference in pKa of the two acid groups of succinic acid it is assumed that upon
neutralisation the first acid group is used and when a degree of neutralisation of 50% is exceeded the second acid group (which is much weaker) is used for the neutralisation.

118 Chapter 7
Effect of degree of grafting Figure 7.12 showed the effect of degree of neutralisation and degree of grafting on the equilibrium amount of absorbed water. When this equilibrium water uptake is compared for the various ionomers, it is suggested that the water absorption is mainly determined by the amount of grafted MAn. Therefore the water absorption is plotted in Figure 7.16 as function of the concentration of carboxylate groups (ϑ), which is indicative of the equilibrium amount of reacted MAn species in the ionic aggregates.
0
1
2
3
4
0.0E+0 5.0E-4 1.0E-3 1.5E-3
ϑ (mol· cm-3)
ϖ
(wt%
)
Figure 7.16 Equilibrium amount of absorbed water as a function of the average amount of
reacted MAn units for ionomers with a variation in degree of grafting and degree of neutralisation
Effect of nature of the cation The results of water absorption of ionomers with variation in cation and equal DG and DN showed that the water absorption decreases in the following order: Cs > K > Na > Li > Mg > Ba > Zn, as can be inferred in Figure 7.13. In the absorption of water the cation interacts with the relatively negative oxygen atoms of the water molecules (due to the lone pairs on these oxygen atoms). The strength of the cation interaction with the water molecules increases with the charge on the ions (valency ν) and is inversely proportional to their sizes (Rionic) 6. In the past Eisenberg et al7 indicated that the ionic potential (valency to ionic radius ratio = ν/Rionic) of the ions is an important factor influencing the properties of ionomers. Table 7.4 shows the ionic radii of the cations used and the corresponding ν/Rionic ratio. Thus, the higher the ν/Rionic ratio of a cation, the more strongly it will be attracted to a certain anion, the denser the aggregate and the less water is absorbed.
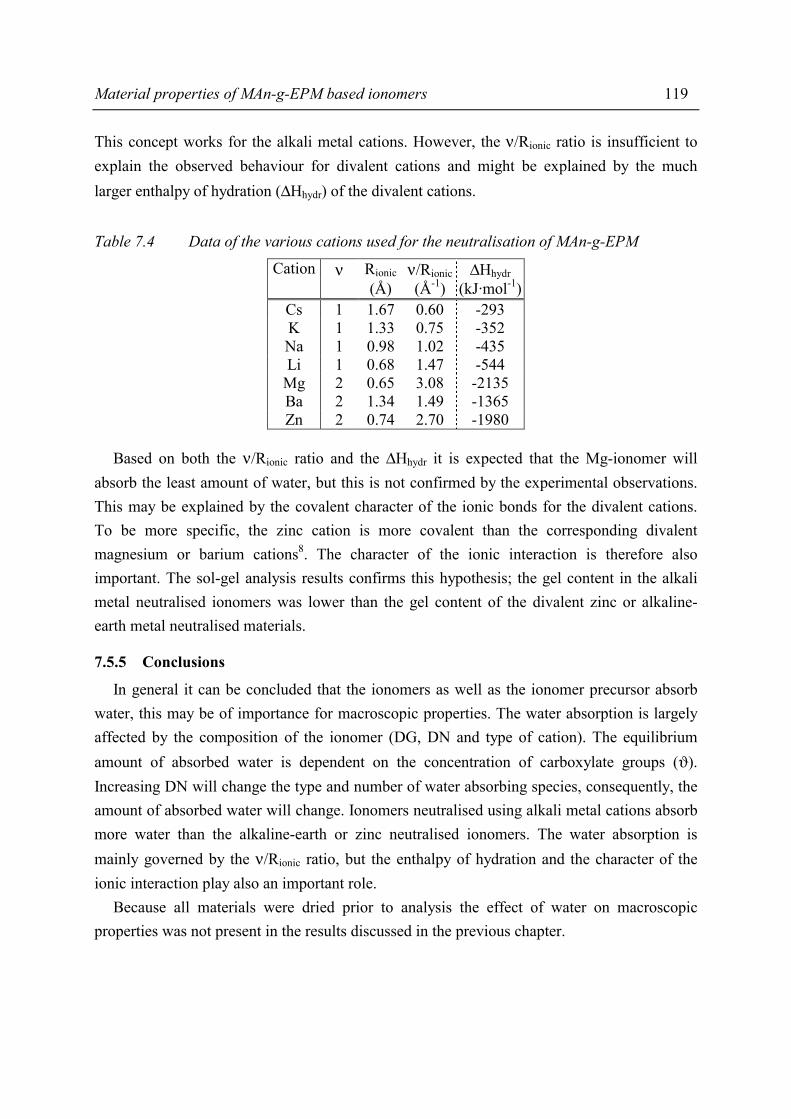
Material properties of MAn-g-EPM based ionomers 119
This concept works for the alkali metal cations. However, the ν/Rionic ratio is insufficient to explain the observed behaviour for divalent cations and might be explained by the much larger enthalpy of hydration (∆Hhydr) of the divalent cations.
Table 7.4 Data of the various cations used for the neutralisation of MAn-g-EPM
Cation ν Rionic ν/Rionic ∆Hhydr (Å) (Å-1) (kJ·mol-1)
Cs 1 1.67 0.60 -293 K 1 1.33 0.75 -352 Na 1 0.98 1.02 -435 Li 1 0.68 1.47 -544
Mg 2 0.65 3.08 -2135 Ba 2 1.34 1.49 -1365 Zn 2 0.74 2.70 -1980
Based on both the ν/Rionic ratio and the ∆Hhydr it is expected that the Mg-ionomer will absorb the least amount of water, but this is not confirmed by the experimental observations. This may be explained by the covalent character of the ionic bonds for the divalent cations. To be more specific, the zinc cation is more covalent than the corresponding divalent magnesium or barium cations8. The character of the ionic interaction is therefore also important. The sol-gel analysis results confirms this hypothesis; the gel content in the alkali metal neutralised ionomers was lower than the gel content of the divalent zinc or alkaline-earth metal neutralised materials.
7.5.5 Conclusions
In general it can be concluded that the ionomers as well as the ionomer precursor absorb water, this may be of importance for macroscopic properties. The water absorption is largely affected by the composition of the ionomer (DG, DN and type of cation). The equilibrium amount of absorbed water is dependent on the concentration of carboxylate groups (ϑ). Increasing DN will change the type and number of water absorbing species, consequently, the amount of absorbed water will change. Ionomers neutralised using alkali metal cations absorb more water than the alkaline-earth or zinc neutralised ionomers. The water absorption is mainly governed by the ν/Rionic ratio, but the enthalpy of hydration and the character of the ionic interaction play also an important role. Because all materials were dried prior to analysis the effect of water on macroscopic properties was not present in the results discussed in the previous chapter.
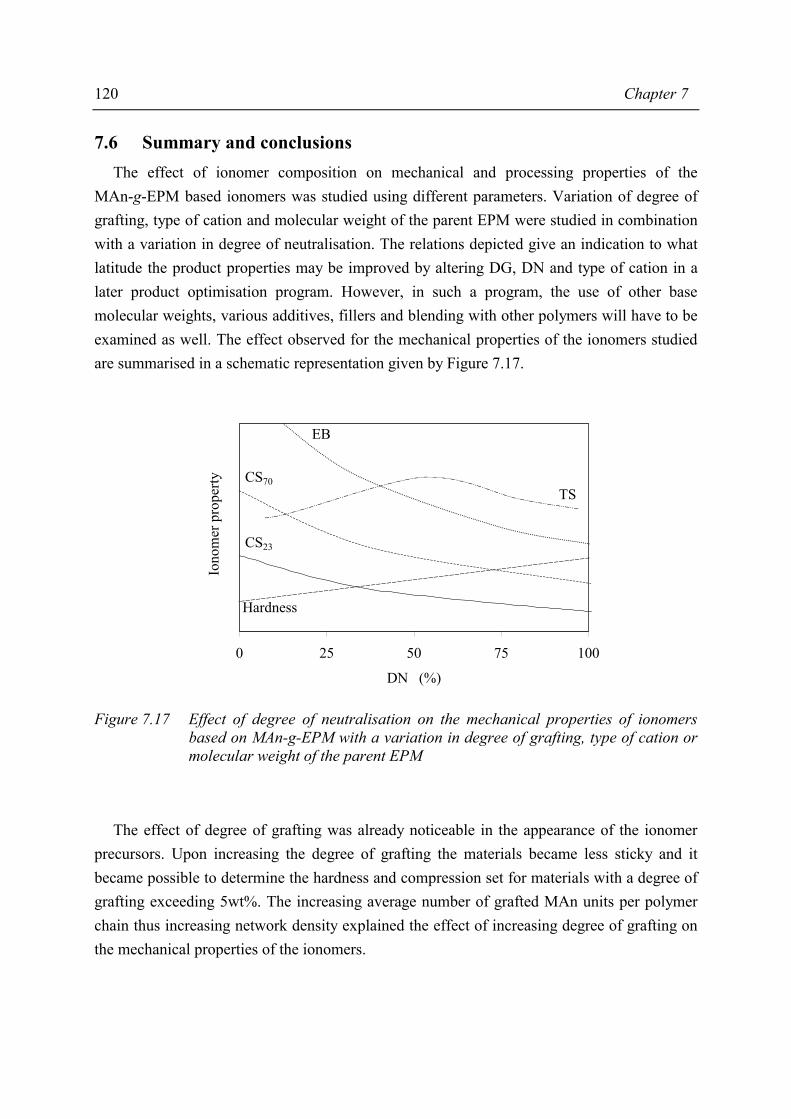
120 Chapter 7
7.6 Summary and conclusions The effect of ionomer composition on mechanical and processing properties of the MAn-g-EPM based ionomers was studied using different parameters. Variation of degree of grafting, type of cation and molecular weight of the parent EPM were studied in combination with a variation in degree of neutralisation. The relations depicted give an indication to what latitude the product properties may be improved by altering DG, DN and type of cation in a later product optimisation program. However, in such a program, the use of other base molecular weights, various additives, fillers and blending with other polymers will have to be examined as well. The effect observed for the mechanical properties of the ionomers studied are summarised in a schematic representation given by Figure 7.17.
0 25 50 75 100
DN (%)
Iono
mer
pro
perty
CS23
CS70TS
EB
Hardness
Figure 7.17 Effect of degree of neutralisation on the mechanical properties of ionomers based on MAn-g-EPM with a variation in degree of grafting, type of cation or molecular weight of the parent EPM
The effect of degree of grafting was already noticeable in the appearance of the ionomer precursors. Upon increasing the degree of grafting the materials became less sticky and it became possible to determine the hardness and compression set for materials with a degree of grafting exceeding 5wt%. The increasing average number of grafted MAn units per polymer chain thus increasing network density explained the effect of increasing degree of grafting on the mechanical properties of the ionomers.

Material properties of MAn-g-EPM based ionomers 121
The effect of type of cation was clearly observable in the mechanical properties of the ionomers. There was a clear difference between the monovalent cations used for the neutralisation and the cations with higher valency. For the monovalent cations the tensile strength is higher and the elongation at break is lower than for the cations with higher valency. The hardness of the ionomers as a function of cation and degree of neutralisation is it can be seen that upon increasing degree of neutralisation the hardness of the ionomers increases, independent of the type of cation used for the neutralisation. The compression set of the ionomers was determined at 23°C and 70°C. From the results of these experiments it became clear that the strength of the ionic interaction of the cation with the carboxylic acid groups of the grafted MAn units on the properties is evident. The effect of molecular weight of the parent EPM on the mechanical properties of the resulting ionomers was studied on grafted polyolefins with comparable degrees of grafting. The tensile strength (TS) and stress at intermediate elongation (σxx) increase with increasing molecular weight while the elongation at break decreases. The hardness of the partially neutralised ionomers increases with molecular weight while the compression set decreases. A major difference between conventionally crosslinked elastomers and ionomers is that the crosslinks in the former type of materials are time-independent; the crosslinks are stable throughout the tensile test. At this point it is useful to comment on the complex network structure of the ionomers. It has to be taken into account that the formation of ionic aggregates (as discussed in the previous chapter) complicates the characterisation of the network using conventional theories for conventional (chemically) crosslinked elastomers. In the past, some ionomers were studied as conventional crosslinked rubbers9, and the conclusion was drawn that the studied materials were different in behaviour than the conventionally crosslinked materials that were studied. In Chapter 8 an attempt has been made to relate the morphological changes with the changes in material properties for the MAn-g-EPM based ionomers that were studied.

122 Chapter 7
7.7 References 1. Rees, R.W. and Vaughan, D.J., ACS Polym.Prepr. 6, 296 (1965) 2. According to ASTM D 412-92 3. According to ASTM D 2240-91 4. According to ASTM D 395, method B 5. This thesis, Chapter 5, section 5.2 6. Mackay, K.M. and Mackay, R.A.., Introduction to Modern Inorganic Chemistry International
Textbook Company: London (1989), Chapter 5 7. Matsuura, H. and Eisenberg, A., J. Polym. Sci, Polym. Phys. Ed. 14, 1201 (1976) 8. Cotton, F.A. and Wilkinson, G., Advanced Inorganic Chemistry Wiley-Interscience: Chichester
(1999) 9. De Candia, F., Dontsov, A., Micera, G. and Pusino, A., Polymer 14, 497 (1973)
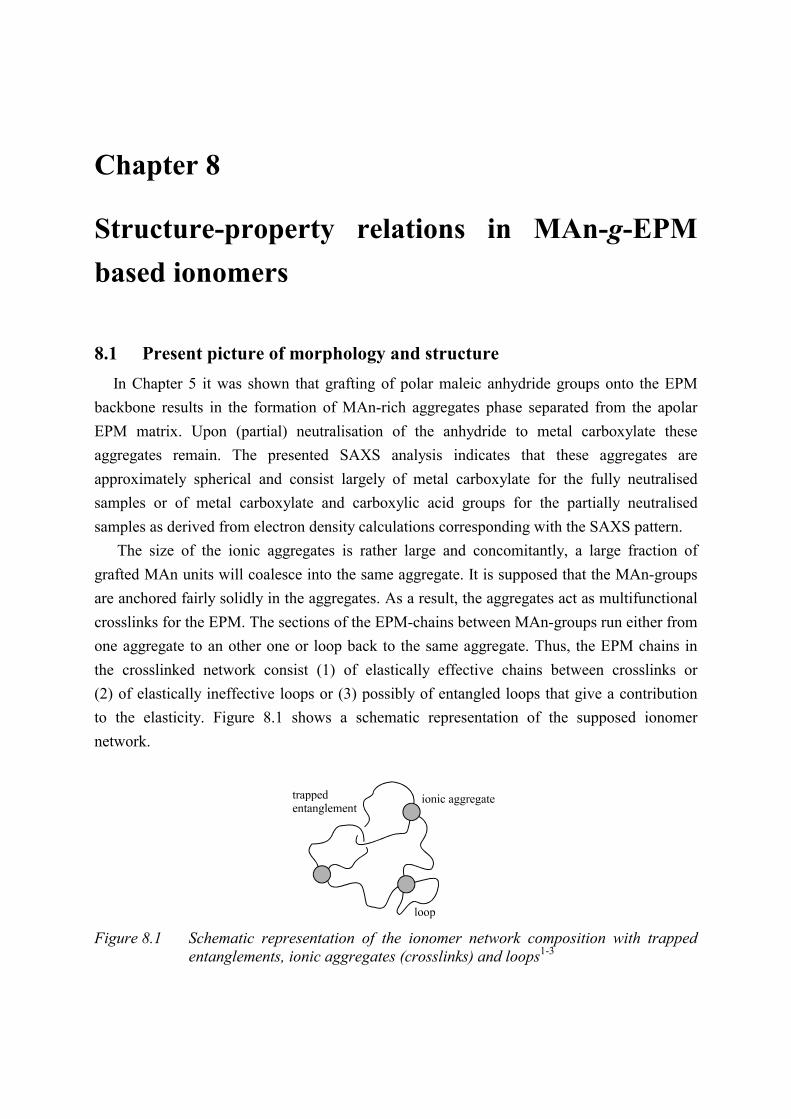
Chapter 8
Structure-property relations in MAn-g-EPM based ionomers
8.1 Present picture of morphology and structure In Chapter 5 it was shown that grafting of polar maleic anhydride groups onto the EPM backbone results in the formation of MAn-rich aggregates phase separated from the apolar EPM matrix. Upon (partial) neutralisation of the anhydride to metal carboxylate these aggregates remain. The presented SAXS analysis indicates that these aggregates are approximately spherical and consist largely of metal carboxylate for the fully neutralised samples or of metal carboxylate and carboxylic acid groups for the partially neutralised samples as derived from electron density calculations corresponding with the SAXS pattern. The size of the ionic aggregates is rather large and concomitantly, a large fraction of grafted MAn units will coalesce into the same aggregate. It is supposed that the MAn-groups are anchored fairly solidly in the aggregates. As a result, the aggregates act as multifunctional crosslinks for the EPM. The sections of the EPM-chains between MAn-groups run either from one aggregate to an other one or loop back to the same aggregate. Thus, the EPM chains in the crosslinked network consist (1) of elastically effective chains between crosslinks or (2) of elastically ineffective loops or (3) possibly of entangled loops that give a contribution to the elasticity. Figure 8.1 shows a schematic representation of the supposed ionomer network.
Figure 8.1 Schematic representation of the ionomer network composition with trapped
entanglements, ionic aggregates (crosslinks) and loops1-3
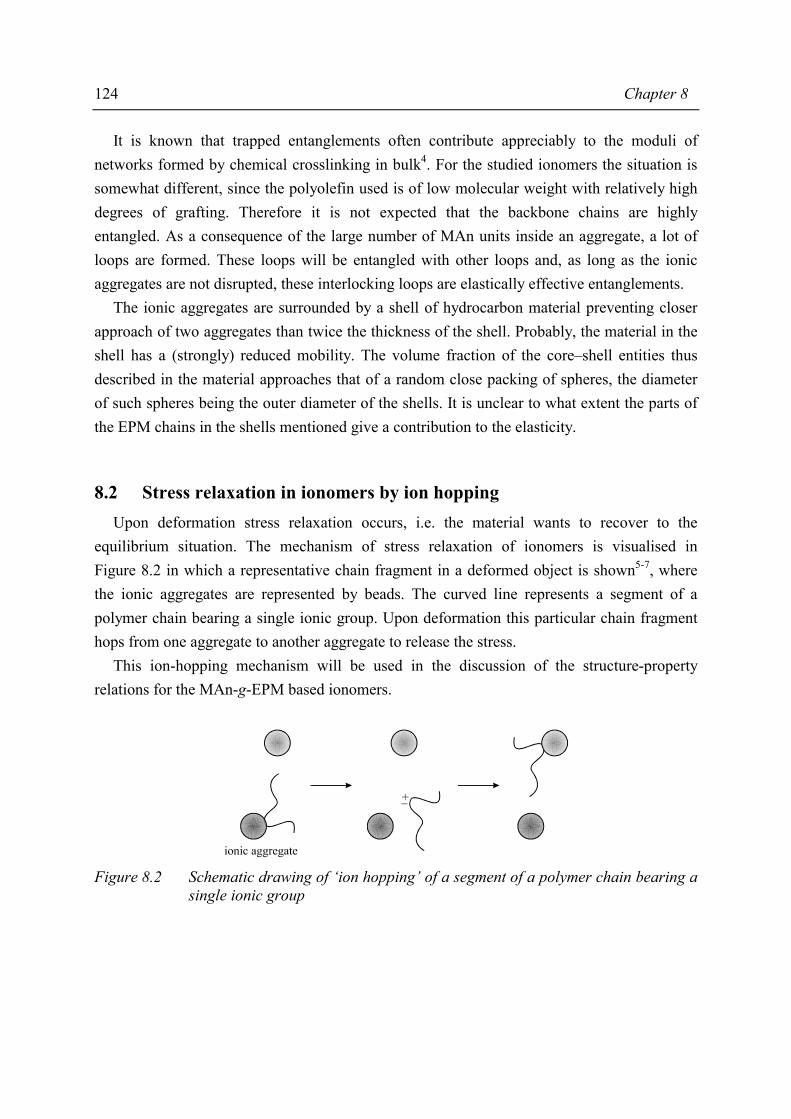
124 Chapter 8
It is known that trapped entanglements often contribute appreciably to the moduli of networks formed by chemical crosslinking in bulk4. For the studied ionomers the situation is somewhat different, since the polyolefin used is of low molecular weight with relatively high degrees of grafting. Therefore it is not expected that the backbone chains are highly entangled. As a consequence of the large number of MAn units inside an aggregate, a lot of loops are formed. These loops will be entangled with other loops and, as long as the ionic aggregates are not disrupted, these interlocking loops are elastically effective entanglements. The ionic aggregates are surrounded by a shell of hydrocarbon material preventing closer approach of two aggregates than twice the thickness of the shell. Probably, the material in the shell has a (strongly) reduced mobility. The volume fraction of the core–shell entities thus described in the material approaches that of a random close packing of spheres, the diameter of such spheres being the outer diameter of the shells. It is unclear to what extent the parts of the EPM chains in the shells mentioned give a contribution to the elasticity.
8.2 Stress relaxation in ionomers by ion hopping Upon deformation stress relaxation occurs, i.e. the material wants to recover to the equilibrium situation. The mechanism of stress relaxation of ionomers is visualised in Figure 8.2 in which a representative chain fragment in a deformed object is shown5-7, where the ionic aggregates are represented by beads. The curved line represents a segment of a polymer chain bearing a single ionic group. Upon deformation this particular chain fragment hops from one aggregate to another aggregate to release the stress. This ion-hopping mechanism will be used in the discussion of the structure-property relations for the MAn-g-EPM based ionomers.
Figure 8.2 Schematic drawing of ‘ion hopping’ of a segment of a polymer chain bearing a
single ionic group
Structure-property relations in MAn-g-EPM based ionomers 125
8.3 Relation of gel content and ionomer morphology In Chapter 6 it was shown that the concentration of carboxylate groups (ϑ) is a good measure for comparing MAn-g-EPM based zinc ionomers with varying DG and DN; the higher ϑ, the higher the gel content. The SAXS results showed that upon increasing DG and/or DN (in other words ϑ) Ξ and VMAn increase. Therefore, the strength of the aggregate increases and it becomes more difficult for a polymer chain fragment to dissolve. It was shown that the number of MAn units inside and aggregate is dependent on the type of neutralising cation and Ξ decreases in the order Cs > K > Mg > Zn > Ba > Na > Li. The gel content showed the same order for the monovalent cations (Cs > K > Na > Li), while the order for the divalent cations (Ba > Zn > Mg) is exactly the opposite. From these results it is evident that the effect of neutralising cation on gel content is a complex combination of morphology and strength of ionic interaction. Later, in section 8.8, an attempt will be made to elucidate this complex combination. Combination of the results of the morphology elucidation, as described in Chapter 5, and the gel content determination, as described in Chapter 6, resulted in a qualitative relation of the structure and the gel content for the MAn-g-EPM based ionomers. In general the tightening of the ionic aggregates in combination with the number of grafted MAn units inside an aggregate explain the results obtained for the sol-gel analysis. However, the series of ionomers neutralised using different types of neutralising cations resulted in the conclusion that a complex combination of morphology and strength of ionic interaction cause the effects observed.
8.4 Relation of melt viscosity and ionomer morphology Melt rheology is sensitive to the size and number of ionic aggregates, any factor affecting the ionic aggregation and interaction with the surrounding matrix, e.g. structure of the ionic moiety, type of neutralising ion, degree of neutralisation and the flexibility of the backbone polymer, should also influence the melt rheology of the resulting ionomer. These effects have been confirmed in many studies on a wide variety of ionomers8,9. Additional SAXS measurements have shown that the SAXS peak in the MAn-g-EPM based ionomers did not change in peak position, and intensity, as a function of temperature up to 200°C, at which the rheological measurements were performed. Therefore it is expected that the overall morphology does not change substantially. It is therefore justified to compare the results of rheological measurements performed at high temperature with overall morphology (SAXS experiments) performed at ambient temperature.
126 Chapter 8
The presence of the unaffected ionic aggregates at ambient temperature and elevated temperature does not explain the flow behaviour of the ionomers; flow does not require the elimination of ionic interactions. Results have shows that upon increasing amount of MAn units (DG) the apparent viscosity increases. When the degree of neutralisation is taken into account, the number of reacted MAn units, or the concentration of carboxylate groups, can be calculated. The results of the sol-gel analysis showed that the concentration of carboxylate groups (ϑ) is a good quantity for comparison of different ionomers with equal molecular weight of the parent EPM. The viscosity versus shear rate behaviour of monovalent and divalent salts at equivalent degree of neutralisation show some differences. When the polymer is neutralised to the same degree of neutralisation, the viscosity changes with ionic radius. In the case of the alkali metal ions the viscosity increases with ionic radius, while unexpectedly* the viscosity decreases with ionic radius in the case of the divalent alkaline earth metal ions. It is generally accepted that the ionic interactions between a carboxylate group and a cation increase with decreasing cation size, since the ionic distance becomes smaller10,11. As a result of stronger interchain ionic interactions, which still exist in the melt, the melt viscosity increases. For the ionomers studied, the melt viscosity at 200°C decreases in the order: Cs > Mg > Zn > K > Ba > Na, while the ionic radii of these cations decrease in the order: Cs > Ba > K > Na > Zn > Mg. This result suggests that the mechanism governing the flow behaviour is not only dependent on the ionic radius. The results from the sol-gel analysis, described in Chapter 6, showed that the number of grafted MAn units in an aggregate (Ξ) is a good measure for the strength of the aggregates in the ionomer network. In view of the SAXS results the increase in viscosity can be related to the number of grafted MAn units inside an ionic aggregate (Ξ). Upon increasing Ξ it is imaginable that it becomes more difficult for a grafted MAn unit to leave the aggregate. As a result, flow of the material deteriorates and the viscosity increases. In Chapter 7 it was concluded that the ionic interaction is very strong; introduction of ionic groups increased the viscosity by several orders of magnitude. Combination of the capillary rheological measurements with the composition of the ionic aggregates results in a relation of the melt viscosity and the number of grafted MAn units inside an ionic aggregate (Ξ) and the average number of ionic aggregates per unit volume (Vp
-1). The results have shown that the apparent viscosity of the ionomers decreased upon increasing number of aggregates.
________________ * the melting temperatures or enthalpy of formation of some metal carbonates or metal sulphonates
all show an increase upon increasing cation radius
Structure-property relations in MAn-g-EPM based ionomers 127
8.5 Relation of mechanical properties and ionomer morphology
8.5.1 Tensile testing
The tensile properties of the MAn-g-EPM based ionomers are determined on small dumbbell shaped tensile specimens. The small size of the test samples gives rise to early rupture of the test specimens. On the other hand, results as described in Chapter 7 show that the ionomers differ from conventionally crosslinked elastomers. The crosslinks in the latter (covalent crosslinked) materials are time-independent; the crosslinks are stable throughout the tensile test. In the case of ionomers, the ionic crosslinks may be subject to disruption by the applied stress. The results also show that the macroscopic properties of the ionomers are dependent on both morphology and strength of ionic interaction, a simple and straightforward explanation for the effect observed is not always possible12, but an attempt will be made using the ion-hopping mechanism, as discussed in section 8.2. To explain the results, the properties of a zinc ionomer with a DG = 5.03wt% and varying degree of neutralisation will be discussed in more detail. In conventional crosslinked elastomers the tensile modulus is related to the network density. The tensile data of the ionomers will be viewed in case of large deformation. The reason for this approach lies in the experimental set-up used. Due to the soft materials and the small sample sizes the use of an extensiometer was not allowed. As can be seen in the figures of the stress strain data (Figures 7.5 and 7.6), the ionomers show that at large deformations the stress-strain data are linear curves (neo-Hookean behaviour). This implies that the tensile modulus can be related to the strength of the ‘crosslinks’. To compare the tensile behaviour of the different ionomers, true stress data were used. As derived in Appendix F the true stress is given by:
( )12
c
Avtrue M
NT −λ−λ⋅⋅⋅⋅
=σkρ
(8.1)
Where: ρ = density (g·cm-3) k = Boltzmann constant (1.381·10-23 N·m·K-1·chain-1) T = temperature (K) NAv = Avogadro’s number (6.02·1023 mol-1) Mc = molecular weight between crosslinks (g·mol-1) λ = deformation ratio (-)
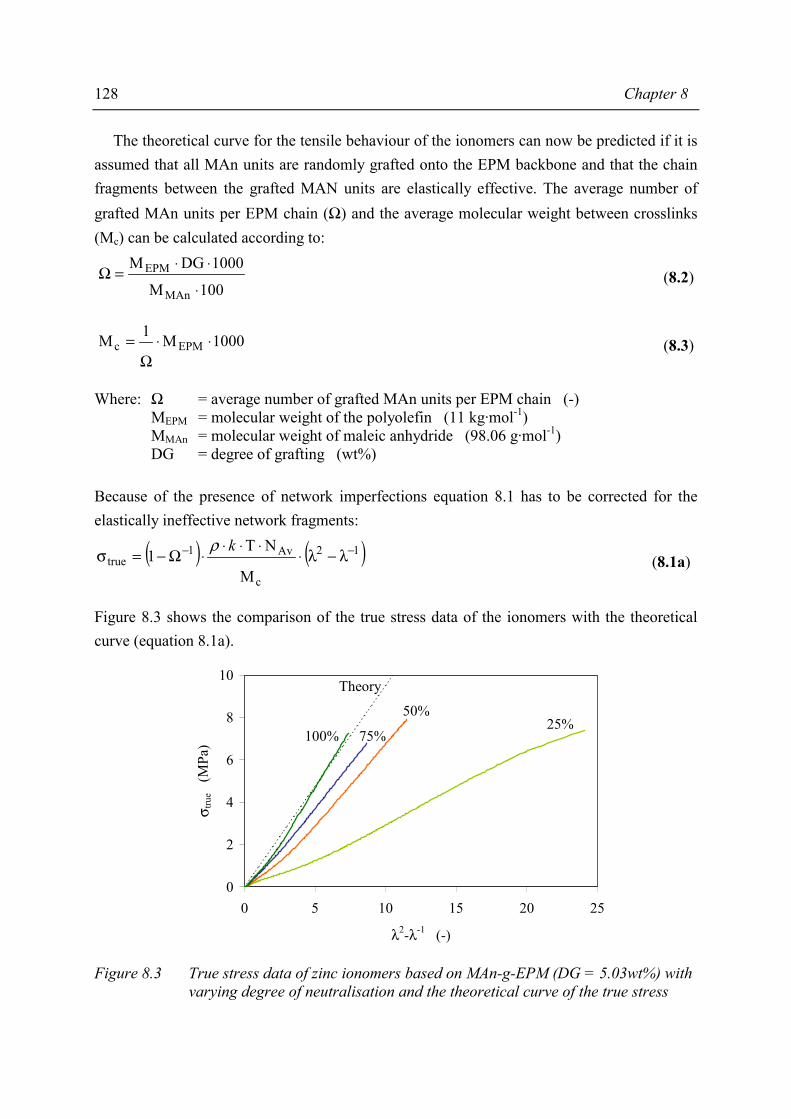
128 Chapter 8
The theoretical curve for the tensile behaviour of the ionomers can now be predicted if it is assumed that all MAn units are randomly grafted onto the EPM backbone and that the chain fragments between the grafted MAN units are elastically effective. The average number of grafted MAn units per EPM chain (Ω) and the average molecular weight between crosslinks (Mc) can be calculated according to:
100M
1000DGM
MAn
EPM
⋅
⋅⋅=Ω (8.2)
1000M1M EPMc ⋅⋅Ω
= (8.3)
Where: Ω = average number of grafted MAn units per EPM chain (-) MEPM = molecular weight of the polyolefin (11 kg·mol-1) MMAn = molecular weight of maleic anhydride (98.06 g·mol-1) DG = degree of grafting (wt%) Because of the presence of network imperfections equation 8.1 has to be corrected for the elastically ineffective network fragments:
( ) ( )12
c
Av1true
M
NT1 −− λ−λ⋅
⋅⋅⋅⋅Ω−=σ
kρ (8.1a)
Figure 8.3 shows the comparison of the true stress data of the ionomers with the theoretical curve (equation 8.1a).
0
2
4
6
8
10
0 5 10 15 20 25
λ2-λ-1 (-)
σ tru
e (M
Pa)
25%50%
75%100%
Theory
Figure 8.3 True stress data of zinc ionomers based on MAn-g-EPM (DG = 5.03wt%) with varying degree of neutralisation and the theoretical curve of the true stress
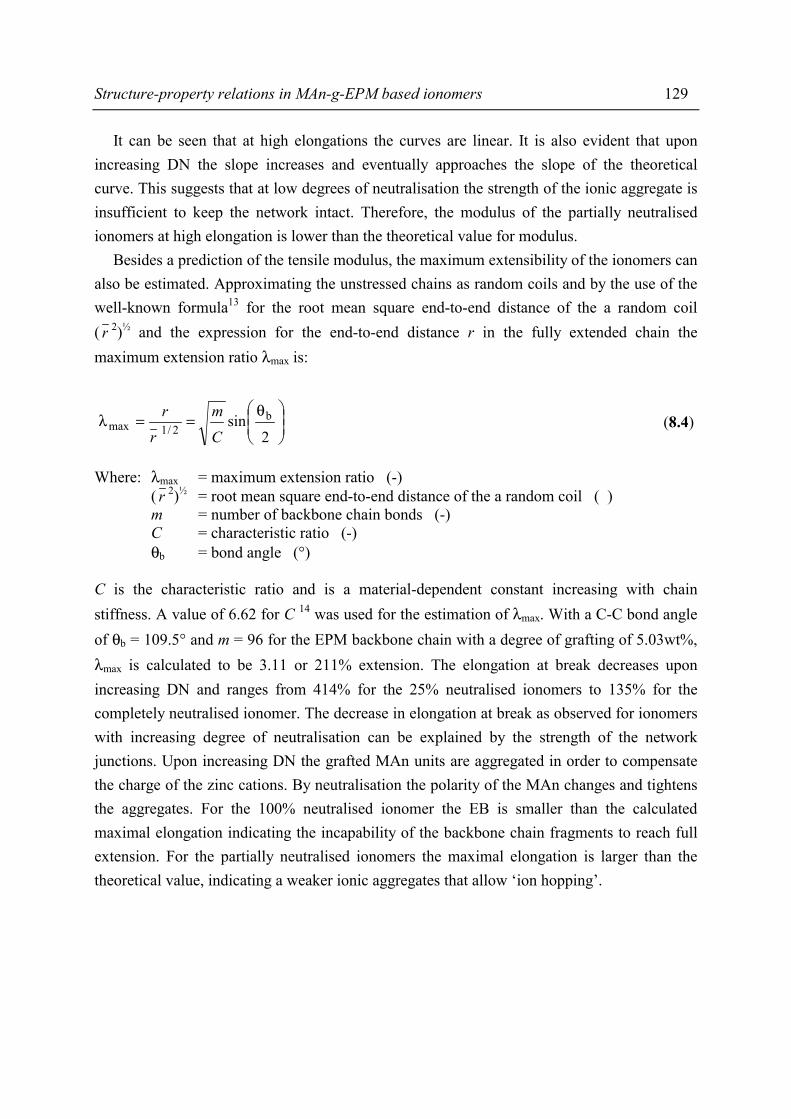
Structure-property relations in MAn-g-EPM based ionomers 129
It can be seen that at high elongations the curves are linear. It is also evident that upon increasing DN the slope increases and eventually approaches the slope of the theoretical curve. This suggests that at low degrees of neutralisation the strength of the ionic aggregate is insufficient to keep the network intact. Therefore, the modulus of the partially neutralised ionomers at high elongation is lower than the theoretical value for modulus. Besides a prediction of the tensile modulus, the maximum extensibility of the ionomers can also be estimated. Approximating the unstressed chains as random coils and by the use of the well-known formula13 for the root mean square end-to-end distance of the a random coil ( r 2)½ and the expression for the end-to-end distance r in the fully extended chain the maximum extension ratio λmax is:
θ==λ
2sin b
2/1maxCm
rr (8.4)
Where: λmax = maximum extension ratio (-) ( r 2)½ = root mean square end-to-end distance of the a random coil ( ) m = number of backbone chain bonds (-) C = characteristic ratio (-) θb = bond angle (°) C is the characteristic ratio and is a material-dependent constant increasing with chain stiffness. A value of 6.62 for C 14 was used for the estimation of λmax. With a C-C bond angle of θb = 109.5° and m = 96 for the EPM backbone chain with a degree of grafting of 5.03wt%, λmax is calculated to be 3.11 or 211% extension. The elongation at break decreases upon increasing DN and ranges from 414% for the 25% neutralised ionomers to 135% for the completely neutralised ionomer. The decrease in elongation at break as observed for ionomers with increasing degree of neutralisation can be explained by the strength of the network junctions. Upon increasing DN the grafted MAn units are aggregated in order to compensate the charge of the zinc cations. By neutralisation the polarity of the MAn changes and tightens the aggregates. For the 100% neutralised ionomer the EB is smaller than the calculated maximal elongation indicating the incapability of the backbone chain fragments to reach full extension. For the partially neutralised ionomers the maximal elongation is larger than the theoretical value, indicating a weaker ionic aggregates that allow ‘ion hopping’.
130 Chapter 8
Summarising, the ionic aggregates in the EPM matrix can be connected by interlocking loops. These loops will be entangled with other loops and, as long as the ionic aggregates are not disrupted, these interlocking loops are elastically effective entanglements and contribute to the rubber elasticity. At a given extension, the polymer chain fragments that form the interlocking loops will be completely stretched, while for polymer chains without loops full extension is not yet reached. Upon stretching, one of two effects may occur. If the ionic aggregates are highly cohesive and do not rupture, the polymer chains must break. When the aggregates are weakly cohesive, the stressed entanglements can relax by ‘ion hopping’ or pulling the ionic groups out of the aggregates. The decrease in elongation at break for increasing neutralisation levels can also be explained by the cohesive strength of the aggregates. The proposed network structure, as shown in Figure 8.1, is probably the correct representation of the ionomer network.
8.5.2 Hardness
Based on the results presented in section 7.3 it is obvious that the type of cation used for the neutralisation of the MAn-g-EPM is an important parameter that affects the hardness of these ionomers. In the past Eisenberg et al.15 indicated that the ionic potential (valency to ionic radius ratio = ν/Rionic) of the ions is an important factor influencing the properties of ionomers. The ν/Rionic ratio alone is inadequate to explain the observed behaviour for the MAn-g-EPM based ionomers. From the sol-gel analysis it was evident that the concentration of carboxylate groups ϑ is also an important factor, while for different cations a normalised ϑ (κ) was used. For the comparison of the hardness and the morphology a new quantity, viz. the average number of carboxylate groups per aggregate (κ·Vp·NAv), is introduced and it is expected to be representative for the strength of the aggregates. Figure 8.4 shows the relation between this new quantity and the Shore A hardness for the series of ionomers with a variation in neutralising cation, and it can be seen that a good correlation is found. Besides the ionic interaction of cation and carboxyl group of MAn the number of groups per aggregate seems to govern the hardness.
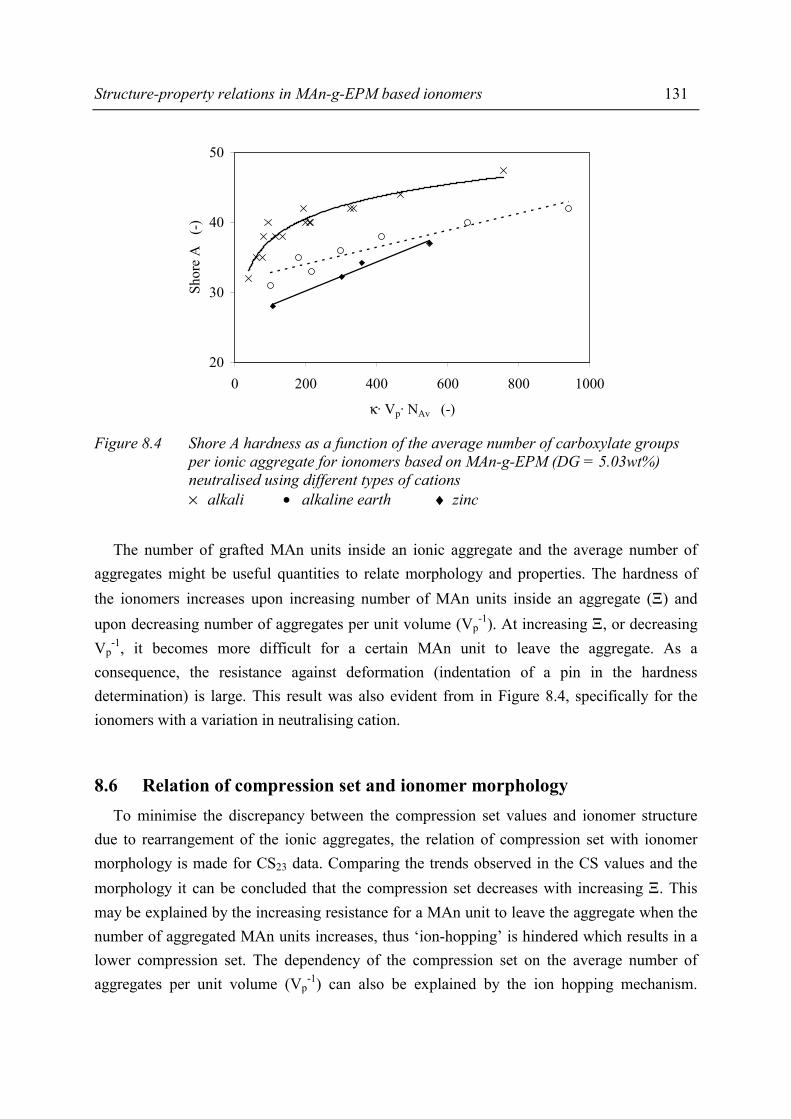
Structure-property relations in MAn-g-EPM based ionomers 131
20
30
40
50
0 200 400 600 800 1000
κ· Vp· NAv (-)
Shor
e A
(-
)
Figure 8.4 Shore A hardness as a function of the average number of carboxylate groups
per ionic aggregate for ionomers based on MAn-g-EPM (DG = 5.03wt%) neutralised using different types of cations × alkali • alkaline earth ♦ zinc
The number of grafted MAn units inside an ionic aggregate and the average number of aggregates might be useful quantities to relate morphology and properties. The hardness of the ionomers increases upon increasing number of MAn units inside an aggregate (Ξ) and upon decreasing number of aggregates per unit volume (Vp
-1). At increasing Ξ, or decreasing Vp
-1, it becomes more difficult for a certain MAn unit to leave the aggregate. As a consequence, the resistance against deformation (indentation of a pin in the hardness determination) is large. This result was also evident from in Figure 8.4, specifically for the ionomers with a variation in neutralising cation.
8.6 Relation of compression set and ionomer morphology To minimise the discrepancy between the compression set values and ionomer structure due to rearrangement of the ionic aggregates, the relation of compression set with ionomer morphology is made for CS23 data. Comparing the trends observed in the CS values and the morphology it can be concluded that the compression set decreases with increasing Ξ. This may be explained by the increasing resistance for a MAn unit to leave the aggregate when the number of aggregated MAn units increases, thus ‘ion-hopping’ is hindered which results in a lower compression set. The dependency of the compression set on the average number of aggregates per unit volume (Vp
-1) can also be explained by the ion hopping mechanism.
132 Chapter 8
For high aggregate densities, the charged chain fragment hops quickly from one aggregate to another because the average distance between neighbouring aggregates is smaller. Because of this easy hopping, the permanent deformation (compression set) is large. This is confirmed by the effect of degree of neutralisation and type of neutralising cation. Upon increasing DN the cohesive strength of the ionic aggregates increases and relaxation by ion hopping becomes more difficult, because the chain fragments are bound stronger. Upon increasing ionic radius, the cohesive strength will decrease. Consequently, the compression set will be affected. The ion hopping mechanism was also evident from the compression set measurements on zinc ionomers with a variation of DG and DN. Upon increasing DG the compression set decreased because the size and volume fraction of the ionic aggregates increases (section 5.3). Therefore, hopping of a chain fragment becomes more difficult.
8.7 Effect of ionomer composition on water absorption
8.7.1 Introduction
In this section the results of water absorption studies of different ionomers, as presented in the previous chapter, are discussed in relation to the morphology of the MAn-g-EPM based ionomers. The effect of water on the dimensions of aggregates in the somewhat hydrophilic ionomers was studied with SAXS on a range of materials with variation in degree of neutralisation and constant degree of grafting.
8.7.2 Experimental
SAXS measurements on water saturated zinc ionomers The study of the morphological changes in water saturated zinc ionomers was performed on zinc ionomers of MAn-g-EPM with a degree of grafting of 7.33wt% and various degrees of neutralisation. The experimental set-up and data analysis are described in subsection 5.3.2.
8.7.3 Results and discussion of SAXS measurements on water saturated zinc ionomers
The presence of ionic aggregates causes ionomers to be hydrophilic. Therefore, it can be expected that water migrates preferentially into the ionic aggregates. The effect of water absorption on the ionomer morphology was studied by measuring water-saturated samples. For this purpose, thin films of the ionomers were immersed in water at room temperature for two months before SAXS analysis. The SAXS-curves of water-saturated MAn-g-EPM based zinc ionomers are shown in Figure 8.5.

Structure-property relations in MAn-g-EPM based ionomers 133
0
20
40
60
80
100
0.00 0.05 0.10 0.15 0.20
q (Å-1)
Abs
olut
e in
tens
ity
(Å-3
)
026.450.3100
DN (%)
Figure 8.5 SAXS profiles of zinc ionomers based on MAn-g-EPM (DG = 7.33wt%) with a
variation in degree of neutralisation, after immersion in water for 2 months It can be observed for all water-saturated specimens that the SAXS maxima are displaced to lower q-values compared to the dry samples of the same composition. In addition, the SAXS peak sharpens and the intensity of the peaks reduces compared to the dry ionomers. The shift in peak position is given in Table 8.1.
Table 8.1 Peak positions in the SAXS profile for zinc ionomers based on MAn-g-EPM with a variation in degree of neutralisation (DG = 7.33wt%, χ = 1.50 eq·kg -1, VMAn = 0.043)
DN = 0% DN = 25% DN = 50% DN = 100% ϖ (wt%) 11.3 3.81 1.40 3.27
Water saturated 0.041 0.048 0.048 0.051 Dry 0.061 0.061 0.053 0.052
Peak shift 0.020 0.013 0.005 0.001 The absorbed water has a pronounced effect on the dimension of the scattering entities (R1) in the ionomer precursor but is less pronounced when DN increases. This may be explained as follows. Upon neutralisation, the aggregate becomes tighter and the accessibility of the aggregates is hindered. Consequently, the ionic aggregates are not allowed to swell as much as in the precursor materials, even after long immersion times. The fitting shows an increase in the domain radius R1 as shown in Table 8.2.
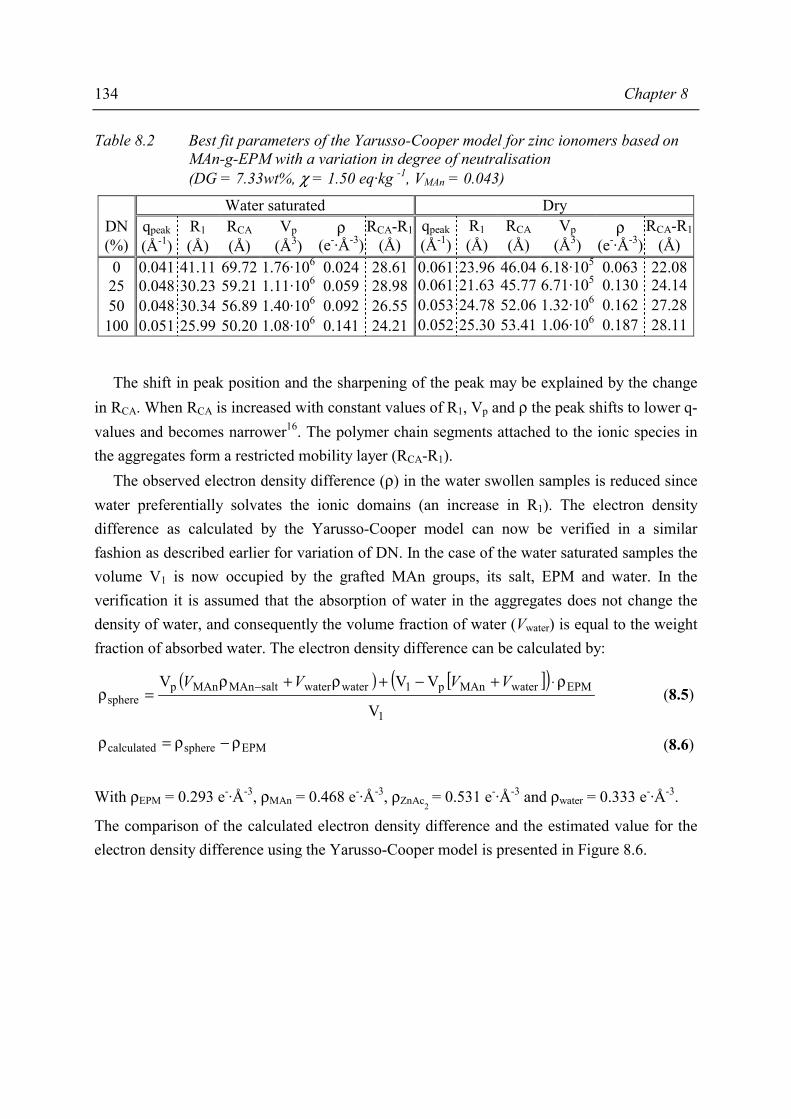
134 Chapter 8
Table 8.2 Best fit parameters of the Yarusso-Cooper model for zinc ionomers based on MAn-g-EPM with a variation in degree of neutralisation (DG = 7.33wt%, χ = 1.50 eq·kg -1, VMAn = 0.043)
Water saturated Dry DN qpeak R1 RCA Vp ρ RCA-R1 qpeak R1 RCA Vp ρ RCA-R1(%) (Å-1) (Å) (Å) (Å3) (e-·Å-3) (Å) (Å-1) (Å) (Å) (Å3) (e-·Å-3) (Å) 0 0.041 41.11 69.72 1.76·106 0.024 28.61 0.061 23.96 46.04 6.18·105 0.063 22.08 25 0.048 30.23 59.21 1.11·106 0.059 28.98 0.061 21.63 45.77 6.71·105 0.130 24.14 50 0.048 30.34 56.89 1.40·106 0.092 26.55 0.053 24.78 52.06 1.32·106 0.162 27.28 100 0.051 25.99 50.20 1.08·106 0.141 24.21 0.052 25.30 53.41 1.06·106 0.187 28.11
The shift in peak position and the sharpening of the peak may be explained by the change in RCA. When RCA is increased with constant values of R1, Vp and ρ the peak shifts to lower q-values and becomes narrower16. The polymer chain segments attached to the ionic species in the aggregates form a restricted mobility layer (RCA-R1). The observed electron density difference (ρ) in the water swollen samples is reduced since water preferentially solvates the ionic domains (an increase in R1). The electron density difference as calculated by the Yarusso-Cooper model can now be verified in a similar fashion as described earlier for variation of DN. In the case of the water saturated samples the volume V1 is now occupied by the grafted MAn groups, its salt, EPM and water. In the verification it is assumed that the absorption of water in the aggregates does not change the density of water, and consequently the volume fraction of water (Vwater) is equal to the weight fraction of absorbed water. The electron density difference can be calculated by:
( ) [ ]( )1
EPMwaterMAnp1waterwatersaltMAnMAnpsphere
V
VVV ρ⋅+−+ρ+ρ=ρ − VVVV
(8.5)
EPMspherecalculated ρ−ρ=ρ (8.6)
With ρEPM = 0.293 e-·Å-3, ρMAn = 0.468 e-·Å-3, ρZnAc2
= 0.531 e-·Å-3 and ρwater = 0.333 e-·Å-3.
The comparison of the calculated electron density difference and the estimated value for the electron density difference using the Yarusso-Cooper model is presented in Figure 8.6.
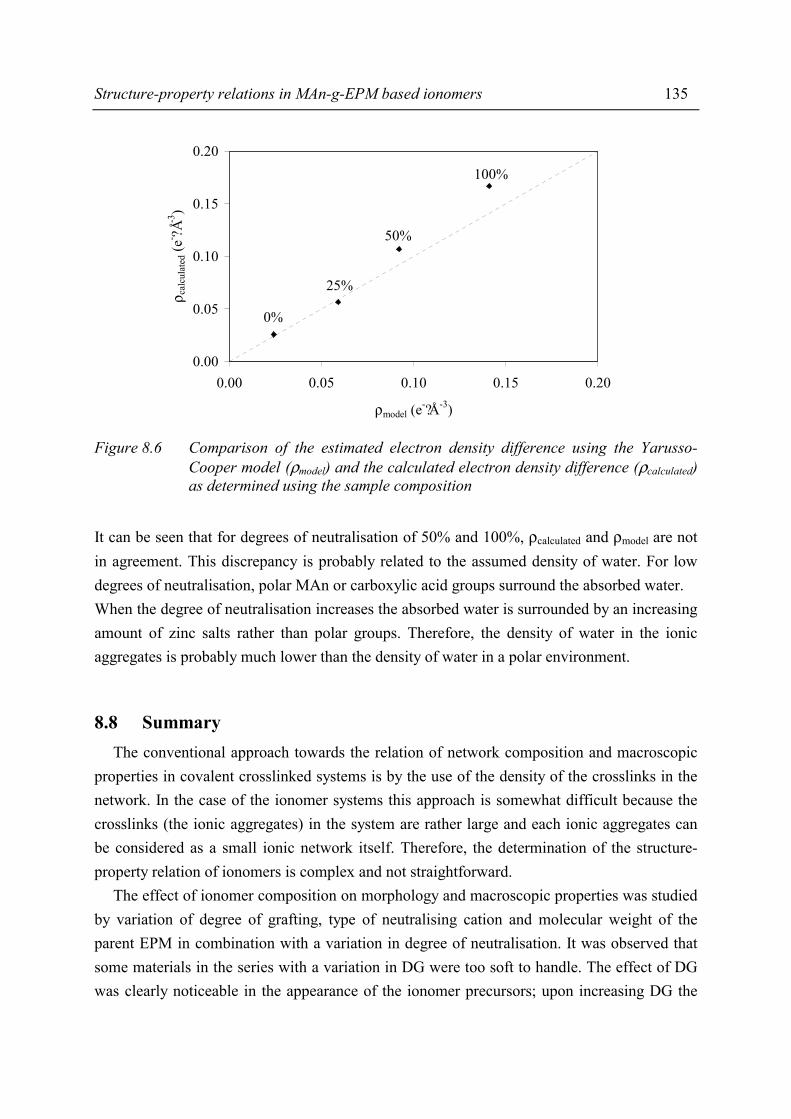
Structure-property relations in MAn-g-EPM based ionomers 135
0.00
0.05
0.10
0.15
0.20
0.00 0.05 0.10 0.15 0.20
ρmodel (e-?Å-3)
ρ cal
cula
ted (
e- ?Å-3
)
0%
25%
50%
100%
Figure 8.6 Comparison of the estimated electron density difference using the Yarusso-
Cooper model (ρmodel) and the calculated electron density difference (ρcalculated) as determined using the sample composition
It can be seen that for degrees of neutralisation of 50% and 100%, ρcalculated and ρmodel are not in agreement. This discrepancy is probably related to the assumed density of water. For low degrees of neutralisation, polar MAn or carboxylic acid groups surround the absorbed water. When the degree of neutralisation increases the absorbed water is surrounded by an increasing amount of zinc salts rather than polar groups. Therefore, the density of water in the ionic aggregates is probably much lower than the density of water in a polar environment.
8.8 Summary The conventional approach towards the relation of network composition and macroscopic properties in covalent crosslinked systems is by the use of the density of the crosslinks in the network. In the case of the ionomer systems this approach is somewhat difficult because the crosslinks (the ionic aggregates) in the system are rather large and each ionic aggregates can be considered as a small ionic network itself. Therefore, the determination of the structure-property relation of ionomers is complex and not straightforward. The effect of ionomer composition on morphology and macroscopic properties was studied by variation of degree of grafting, type of neutralising cation and molecular weight of the parent EPM in combination with a variation in degree of neutralisation. It was observed that some materials in the series with a variation in DG were too soft to handle. The effect of DG was clearly noticeable in the appearance of the ionomer precursors; upon increasing DG the
136 Chapter 8
materials became less sticky and it became possible to determine the hardness and compression set for materials with a DG exceeding 5wt%. Upon increasing DG, more physical crosslinks are introduced by the aggregation of the polar MAn groups (as confirmed by the SAXS results). From the SAXS results it also was concluded that a minimum DG has to be exceeded to obtain microphase separation of the grafted MAn units. Besides the SAXS confirmation, the gel-content of the materials that were tested for the macroscopic properties showed that the materials were tested all contained a considerable fraction of insoluble material (gel). The overall morphology, i.e. the size, number and composition of the ionic aggregates, is affected by the composition of the ionomers. The composition of the aggregates determines the strength of the aggregate. The strength of the ionic aggregates is mainly determined by the number of grafted MAn units inside the aggregate (Ξ) and the ionic potential, i.e. strength of the ionic interaction (ν/Rionic ratio). Summarising, the parameters that affect the overall morphology and the macroscopic properties are: R1, RCA, Vp
-1, Ξ and the ν/Rionic ratio. The valency (ν) of the neutralising cation showed to be an important parameter affecting the macroscopic properties of the MAn-g-EPM based ionomers. In the series of ionomers neutralised using different types of cations some properties could be explained by the overall morphology (size and volume fraction of the ionic aggregates) independent of the valency of the cation used for the neutralisation. In some cases, the comparison of properties resulted in some discrepancy. The reason for this discrepancy might be explained by the strength of the ionic aggregate that also affects the macroscopic property. The time-scale, and condition, of the experiment to determine a certain property, sets the parameter that affects the structure-property relationship. In the case of a tensile test, the cohesive strength of the ionic aggregates (ν/Rionic ratio) affects the tensile strength. In the case of the rheological properties or the determination of the gel-content both the ionic strength and overall morphology determine the results obtained. The changes in the gel-content of the ionomers were easily related to changes in morphology. The gel-content increased when the ionic aggregates tightened and the number of grafted MAn units inside an aggregate increased. However, for the different types of neutralising cations the effect of ionic strength played also an important role. In the case of the divalent cations studied, the gel-content decreased upon increasing Ξ, which was unexpected. The rheological properties showed also a remarkable dependency of the apparent viscosity on the type of neutralising cations. The apparent viscosity of the alkaline-earth metal neutralised ionomers showed an increase in ηapp upon decreasing Rionic while the alkaline metal neutralised ionomers showed an increasing ηapp upon increasing Rionic.
Structure-property relations in MAn-g-EPM based ionomers 137
But the overall conclusion concerning the rheological behaviour can be drawn on the decreasing in ηapp upon increasing number of ionic aggregates. This effect might be explained by the ion-hopping mechanism as depicted in Figure 8.2. Upon increasing number of aggregates it is easier for a chain fragment to hop from one aggregate to another, because the relative exposure to a non-ionic environment is the least for a dense system. On the other hand, when the number of aggregates is high, the size of the aggregates is generally small thus the strength is less, which makes it easier for a chain fragment to hop. The tensile properties and hardness of the ionomers was explained by the ion hopping mechanism and the morphology as depicted by Figure 8.1. The hardness of the ionomers increases upon increasing Ξ which can be explained by the strength of one ionic aggregate. In the case the ionic aggregates contains a large number of grafted MAn units, the resistance against deformation is large, thus the ionomer material is harder than a comparable ionomer with lower Ξ. The compression set of the ionomers can be related best to the morphology by the use of the stress relaxation mechanism, or the ion hopping mechanism. Upon deformation the ‘stressed’ chain fragment hops to another aggregate to release the stress. A thermodynamic favourable and new situation is created, when the stress is released, the newly created network remains and the ionomer material does not recover. Upon increasing number of grafted MAn groups inside an aggregate (Ξ) it becomes more difficult for a chain fragment to hop and the compression set decreases. The compression set increases upon increasing number of ionic aggregates. When the number of aggregates is high, the size of the aggregates is generally small thus the strength is less, which makes it easier for a chain fragment to hop. The effect of water absorption was studied on water-saturated samples and it was observed that due to the presence of water the dimensions of the ionic aggregates increase. This confirmed our idea that water resides preferentially in the ionic aggregates. The results also indicated that hydrophilic ionic groups are strong absorption sites of water molecules and therefore the water absorption primarily affects the structure of the ionic aggregates. SAXS studies confirmed that the water is preferentially present in the ionic aggregates17. Depending on degree of neutralisation, degree of grafting, cation or molecular weight of the parent EPM the water absorption changes. The mechanism of water absorption by the grafted MAn groups is determined by a combination of the tightening of the network upon increasing DG and DN and the amount of species that are able to attract water (Meν+ and/or COOH-groups).
138 Chapter 8
In general it may be concluded that the ionomers as well as the ionomer precursor absorb water, this behaviour may be of importance for the macroscopic properties. Because all materials were dried prior to analysis the effect of water on macroscopic properties was not present in the results discussed in the previous sections.
8.9 Conclusions Although the relation between macroscopic properties and morphology is a complex one, the overall conclusion might be drawn that the zinc ionomers are the materials with a good balance between mechanical and processing properties in combination with a relatively low water absorption. Although the mechanical properties of the alkali metal neutralised ionomers are better than the properties of the alkaline-earth metal neutralised materials, the water absorption is larger. SAXS results have shown that water absorption has a drastic effect on the morphology and probably also on the material properties, based on the relationship as discussed above. Therefore, the zinc salts of MAn-g-EPM based ionomer precursors are preferred, and their properties can be adjusted by the ionomer composition according to the relation described in the previous subsection.
8.10 References 1. Eisenberg, A., Macromolecules 3, 147 (1970) 2. Forsmann, W.C., Macromolecules 15, 1032 (1982) 3. Dreyfus, B., Macromolecules 18, 284 (1985) 4. Mark, J.E., Rubber Chem. Technol. 48, 495 (1975) 5. Ward, T.C. and Tobolsy, A.V., J. Appl. Polym. Sci. 11, 2903 (1967) 6. Sakamoto, K., MacKnight, W.J. and Porter, R.S., J. Polym. Sci., Polym. Phys. Ed. 8, 277 (1970) 7. Eisenberg A., Bailey, F., Eds. Coulombic Interaction in Macomolecular Systems; ACS
Symposium Series No. 302, American Chemical Society, Washington D.C., 1986 8. Eisenberg, A. and King, M., Ion-Containing Polymers; Academic Press: New York, 1977; p. 15 9. MacKnight, W.J. and Earnest, T., J. Macromol. Sci., Rev. Macromol. Chem. 16, 41 (1981) 10. Holliday, L., Ionic Polymers, Holliday, L., Ed., Applied Science, London, 1975, Chapter 1 11. Eisenberg, A. and King, M., Ion-Containing Polymers; Academic Press: New York, 1977;
Chapters 3 and 4 12. De Candia, F., Dontsov, A., Micera, G. and Pusino, A., Polymer 14, 497 (1973) 13. Flory, P.J., Principles of Polymer Chemistry, Ithaca NY: Cornell University Press, 1953 14. Richter, D., Farafo, B., Butera, R., Fetters, L.J., Huand, J.S. and Ewen, B., Macromolecules 26,
795 (1993) 15. Martsuura, H. and Eisenberg, A., J. Polym. Sci, Polym. Phys. Ed. 14, 1201 (1976) 16. This thesis, Chapter 5 17. Marx,C.L., Claufield, D.F., Cooper, S.L., Macromolecules 6, 344 (1973)
Chapter 9
Balance between mechanical and processing properties of MAn-g-EPM based ionomers
9.1 Introduction As already discussed in Chapter 1, the combination of the thermoreversible crosslink based on ionic interactions and the use of a low-cost elastomer were the basis of the proposed concept of an ionomeric thermoplastic rubber. In the past, attempts have been made to produce ionomeric rubbers but these materials possessed high melt viscosities and needed considerable amounts of additives (zinc stearate) when processed1-3. In all cases the ionomer precursor was an elastomer of conventional (high) molecular weight. From these attempts one important parameter in ionomer synthesis became clear: the use of a low molecular weight elastomer. In this research a low molecular weight ethylene-propylene copolymer was used as base polymer which results in a saturated thermoplastic elastomer. In Chapter 7 the effect of ionomer composition on material properties was discussed. The melt viscosity of the ionomers and mechanical properties such as hardness, tensile properties and compression set were discussed in relation to ionomer composition in Chapter 8. In this chapter these properties will be compared with the properties of suitable and analogous materials. Comparison of properties is somewhat difficult because the data presented in literature is the data of optimised materials that are blended with other polyolefins or materials that contain additives such as carbon black or zinc stearate. Therefore it has to be taken into account that the comparison made is a rough and quantitative one. Moreover, the comparison will give insight whether the new ionomeric thermoplastic rubber based on MAn-g-EPM may compete with commercially available products.
140 Chapter 9
9.2 Comparing macroscopic properties of MAn-g-EPM based ionomers with suitable other systems
9.2.1 Overview of comparable systems
The choice of suitable systems to compare the MAn-g-EPM based ionomers is somewhat difficult because most of the materials are optimised materials that contain additives such as carbon black (CB) or zinc stearate (ZnSt). Therefore the reported compositions of the materials that were used in the comparison is given in Table 9.1, for the TPVs that were used the composition is unknown.
Table 9.1 Composition of the materials used in the comparison of the macroscopic properties of the MAn-g-EPM based ionomers
Material Mn χ ZnSt CB Oil * Ref. (kg·mol-1) (eq·kg-1) (phr) (phr) (phr) (phr)
Sulpho-EPDM ~100 0.15-0.45 10-30 4 MAn-g-EPDM ~116 0.18 30 0-30 5
Blend of ’’ with * ~116 0.18 0-30 0 0-100 6,7 Sulphur cured EPDM ~100 - 50-130 50-130 8
* poly(ethylene-co-acrylic acid), 6% acrylic acid, Mn~ 35 kg·mol-1 As can be seen in the table, some MAn-g-EPDM based ionomer were reported in literature. It can also be seen that all materials contain additives such as zinc stearate (ZnSt) or extender oils to enhance processibility and carbon black (CB) to enhance tensile properties. Besides the use of additives, the molecular weight of the parent polyolefin is rather high when compared to the molecular weight of the polyolefin that was used for the MAn-g-EPM based ionomers (Mn of 11 kg·mol-1). Although the MAn-g-EPDM based ionomers that were used for comparison5-7 have good tensile properties, the compression set values were not reported. As discussed in Chapter 7, compression set is an important criterion for product quality. It is generally accepted that compression set is very sensitive towards fillers. The compression set of filled elastomers can be rather high, therefore it can be understood that the values for compression set are not reported for the materials with such extends of filler. The new approach, as proposed in Chapter 1 of this thesis, still stands. As can be seen in Table 9.1, the acid contents of the reported systems are lower than for the ionomer presented in this thesis. And all materials that were reported in literature needed additives such as zinc stearate or oil to obtain processible materials. The large number of publications on ionomer compounds in literature shows that for these special networks compounding (filling9-14 or blending15-18) is a nice tool to adjust some properties.

Balance between mechanical and processing properties 141
9.2.2 Processing properties
Comparison of processibility of the ionomeric thermoplastic rubbers based on MAn-g-EPM with other systems (ionomers and thermoplastic elastomers) is difficult because most of the materials contain additives that may affect the melt flow behaviour. Only a rough and quantitative comparison is allowed. In literature some comparable systems were found and Figure 9.1 shows the data of the MAn-g-EPM based ionomers, as presented above, and the data of other systems. The data presented in this figure are the results of capillary rheological measurements at about 200°C.
1E+0
1E+1
1E+2
1E+3
1E+4
1E+5
1E+6
1E-1 1E+0 1E+1 1E+2 1E+3 1E+4 1E+5
γ (1/s)
η app
(Pa.
s)
1
4
3
2
.
MAn-g -EPM ionomers
Figure 9.1 Comparison of the melt viscosity of the MAn-g-EPM based ionomeric
thermoplastic rubbers with the melt viscosity of other systems 1 Sulphonated EPDM 4 2 Thermoplastic vulcanisate (TPV) 19 3 Carbon black filled zinc ionomer of MAn-g-EPDM containing ZnSt 5 4 Blend of zinc ionomer of MAn-g-EPDM and poly(ethylene-co-acrylic acid) containing ZnSt6,7
Figure 9.1 shows that the data of the MAn-g-EPM based ionomers are comparable with the data from literature. It has to be taken into account that the materials that were used in literature consist of high molecular weight polymers that are all mixed with zinc stearate or extender oils to plasticise the polymer melt and reduce the melt viscosity. The figure also shows that the sulphonated EPDMs show much higher viscosities than the MAn-g-EPM based ionomers.
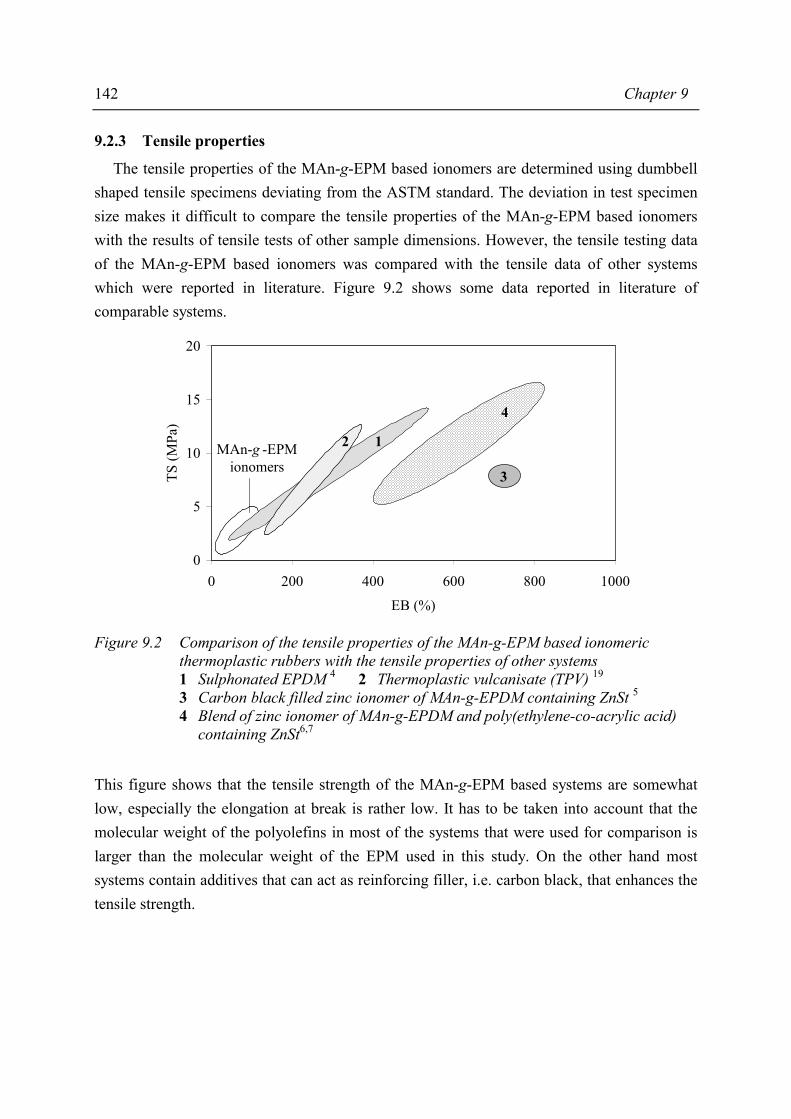
142 Chapter 9
9.2.3 Tensile properties
The tensile properties of the MAn-g-EPM based ionomers are determined using dumbbell shaped tensile specimens deviating from the ASTM standard. The deviation in test specimen size makes it difficult to compare the tensile properties of the MAn-g-EPM based ionomers with the results of tensile tests of other sample dimensions. However, the tensile testing data of the MAn-g-EPM based ionomers was compared with the tensile data of other systems which were reported in literature. Figure 9.2 shows some data reported in literature of comparable systems.
0
5
10
15
20
0 200 400 600 800 1000
EB (%)
TS (M
Pa)
12
4
3
MAn-g -EPM ionomers
Figure 9.2 Comparison of the tensile properties of the MAn-g-EPM based ionomeric
thermoplastic rubbers with the tensile properties of other systems 1 Sulphonated EPDM 4 2 Thermoplastic vulcanisate (TPV) 19 3 Carbon black filled zinc ionomer of MAn-g-EPDM containing ZnSt 5 4 Blend of zinc ionomer of MAn-g-EPDM and poly(ethylene-co-acrylic acid) containing ZnSt6,7
This figure shows that the tensile strength of the MAn-g-EPM based systems are somewhat low, especially the elongation at break is rather low. It has to be taken into account that the molecular weight of the polyolefins in most of the systems that were used for comparison is larger than the molecular weight of the EPM used in this study. On the other hand most systems contain additives that can act as reinforcing filler, i.e. carbon black, that enhances the tensile strength.
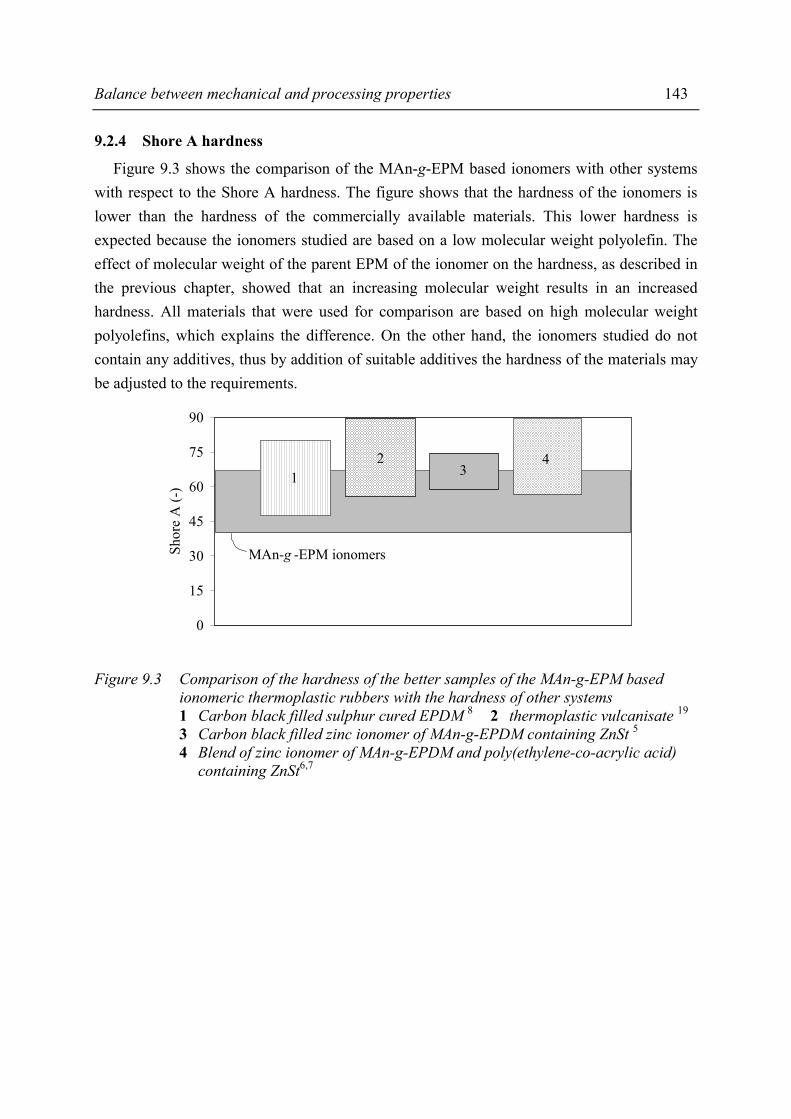
Balance between mechanical and processing properties 143
9.2.4 Shore A hardness
Figure 9.3 shows the comparison of the MAn-g-EPM based ionomers with other systems with respect to the Shore A hardness. The figure shows that the hardness of the ionomers is lower than the hardness of the commercially available materials. This lower hardness is expected because the ionomers studied are based on a low molecular weight polyolefin. The effect of molecular weight of the parent EPM of the ionomer on the hardness, as described in the previous chapter, showed that an increasing molecular weight results in an increased hardness. All materials that were used for comparison are based on high molecular weight polyolefins, which explains the difference. On the other hand, the ionomers studied do not contain any additives, thus by addition of suitable additives the hardness of the materials may be adjusted to the requirements.
0
15
30
45
60
75
90
Shor
e A
(-)
431
2
MAn-g -EPM ionomers
Figure 9.3 Comparison of the hardness of the better samples of the MAn-g-EPM based
ionomeric thermoplastic rubbers with the hardness of other systems 1 Carbon black filled sulphur cured EPDM 8 2 thermoplastic vulcanisate 19 3 Carbon black filled zinc ionomer of MAn-g-EPDM containing ZnSt 5 4 Blend of zinc ionomer of MAn-g-EPDM and poly(ethylene-co-acrylic acid) containing ZnSt6,7
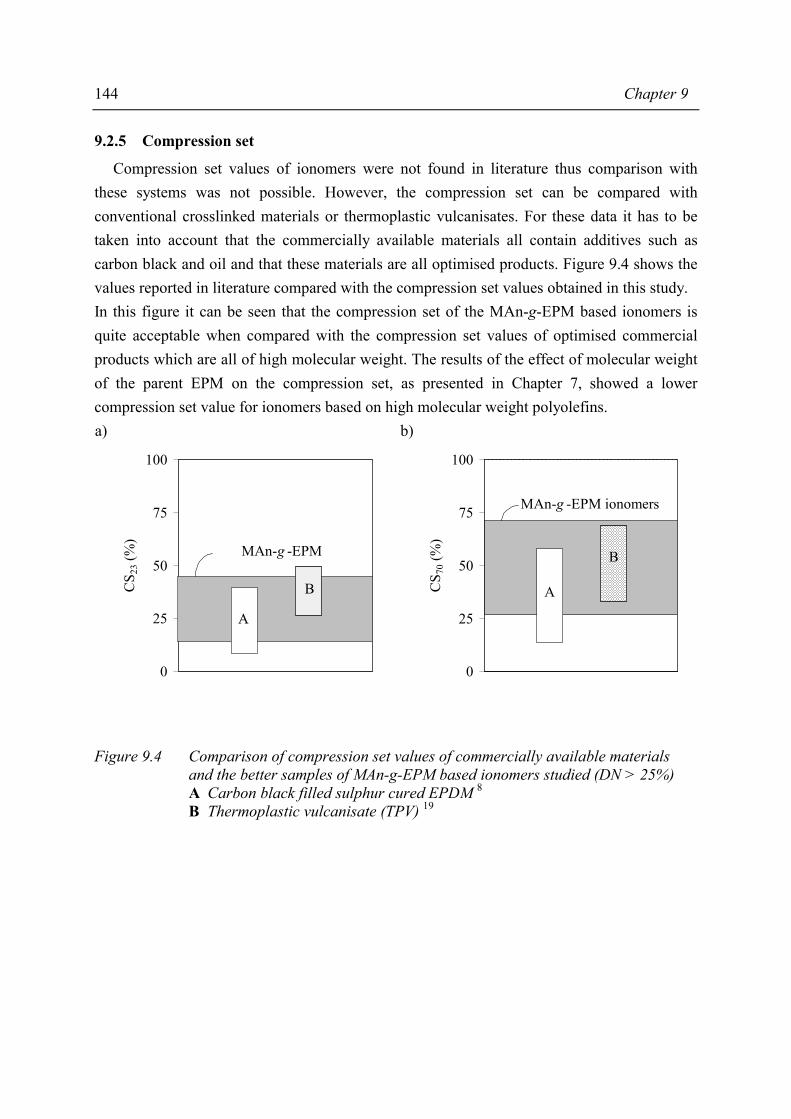
144 Chapter 9
9.2.5 Compression set
Compression set values of ionomers were not found in literature thus comparison with these systems was not possible. However, the compression set can be compared with conventional crosslinked materials or thermoplastic vulcanisates. For these data it has to be taken into account that the commercially available materials all contain additives such as carbon black and oil and that these materials are all optimised products. Figure 9.4 shows the values reported in literature compared with the compression set values obtained in this study. In this figure it can be seen that the compression set of the MAn-g-EPM based ionomers is quite acceptable when compared with the compression set values of optimised commercial products which are all of high molecular weight. The results of the effect of molecular weight of the parent EPM on the compression set, as presented in Chapter 7, showed a lower compression set value for ionomers based on high molecular weight polyolefins. a) b)
0
25
50
75
100
0 1 2 3
CS 2
3 (%
)
A
B
MAn-g -EPM
0
25
50
75
100
0 1 2 3
CS 7
0 (%
)
MAn-g -EPM ionomers
A
B
Figure 9.4 Comparison of compression set values of commercially available materials
and the better samples of MAn-g-EPM based ionomers studied (DN > 25%) A Carbon black filled sulphur cured EPDM 8 B Thermoplastic vulcanisate (TPV) 19
Balance between mechanical and processing properties 145
9.3 Summary and conclusions In the previous chapters was shown that the morphology and macroscopic properties are dependent on the composition of the ionomers. It was also shown that by changing the degree of neutralisation the properties changed, for example the hardness increased upon increasing DN. The composition of the ionomer is thus an important tool in product development. It was shown that a degree of grafting of 4wt% has to be exceeded to obtain materials with measurable properties. The type of neutralising cation has an important effect on the properties of the materials. The most important effect was observed in the water absorption of the ionomers. The zinc ionomers absorbed the least amounts of water. This is an important phenomenon that has to be taken into account, but by the degree of neutralisation the water absorption of the ionomers can be controlled. In this chapter, the different macroscopic properties of the MAn-g-EPM based ionomers were compared with properties of comparable systems. The comparison of the properties of the MAn-g-EPM based ionomers studied in this thesis with the properties of commercially available, thus optimised, products revealed that the MAn-g-EPM based ionomers might compete with the comparable systems. From the results of capillary rheological measurements it can be concluded that the processibility of the ionomers based on MAn-g-EPM competes with materials that were reported in literature but that needed additives, i.e. zinc stearate or oil, to obtain processible products. The comparison of results of tensile testing and hardness determination of the MAn-g-EPM based ionomers lead to the conclusion that the ionomers studied are interesting materials which have the capability to compete with other type of thermoplastic elastomers or ionomers. The required hardness of a product is determined by the application for the end product. The use of reinforcing fillers, i.e. carbon black, will eventually result in improved material properties that meet the requirements for a certain application and thus more competitive materials. The compression set values of the MAn-g-EPM based ionomers are rather good for an ionomer based on a low molecular weight amorphous polyolefin. The values of the compression set are somewhat high when compared with commercially available thermoplastic vulcanisates (TPV) or sulphur cured EPDM which are all compounded. The use of proper additives or the use of somewhat higher molecular weight of the parent EPM might improve the value for the compression set. In most of the systems that were used for comparison of the macroscopic properties the molecular weight of the polyolefins is larger than the molecular weight of the EPM used in this study. Besides the difference in molecular weight it has to be taken into account that most systems contain additives that can act as reinforcing filler, i.e. carbon black that enhances the tensile strength. When product optimisation, such as compounding with carbon black or

146 Chapter 9
blending with a suitable polymer, will be studied in the future the properties of the ionomers may improve to such an extent that the properties will be in the range of the properties of the extensively optimised commercially available products. For product optimisation the proper balance between the type and amount of reinforcing filler and plasticiser has to be found. Overall the conclusion may be drawn that the MAn-g-EPM based ionomers exhibit an acceptable balance between processing and mechanical properties. Optimisation of the product is nevertheless necessary and an optimisation study has to be performed.
9.4 References 1. Makowski, H.S. and Lundberg, R.D., Polym. Prepr. 19, 304 (1978) 2. Kurian, T., Khastgir, D., De, P.P., Tripathy, D.K. and De, S.K., Rubber World 41 (1995) 3. Datta, S., De, S.K., Kontos, E.G. and Wefer, J.M., J. Appl. Polym. Sci. 61, 177 (1996) 4. Makowski, H.S., Lundberg, R.D., Westerman, L. and Bock, J., Polym. Prepr. 19, 292 (1978) 5. Datta, S., De, S.K., Kontos, E.G., Wefer, J.M., Wagner, P. and Vidal, A., Polymer 37, 3431
(1996) 6. Anthony, P. and De, S.K., J. Appl. Polym. Sci. 71, 1247 (1999) 7. Anthony, P., Bhattacharya, A.K. and De, S.K., J. Appl. Polym. Sci. 71, 1257 (1999) 8. Keltan properties folder 9. Kurian, T., Bhattacharya, A.K., De, P.P., Tripathy, D.K., De, S.K. and Peiffer, D.G., Plast.
Rubber, Comp. Proc. Appl. 24, 285 (1995) 10. Kurian, T., De, P.P., Khastgir, D., Tripathy, D.K., De, S.K. and Peiffer, D.G., Polymer 36, 3785
(1995) 11. Kurian, T. De, P.P., Tripathy, D.K., De, S.K. and Peiffer, D.G., J. Appl. Polym. Sci. 62, 1729
(1996) 12. Datta, S., Bhattacharya, A.K., De, S.K., Kontos, E.G. and Wefer, J.M., Polymer 37, 2581 (1996) 13. Kurian, T., Khastgir, D., De, P.P., Tripathy, D.K., De, S.K. and Peiffer, D.G., Polymer 37, 5597
(1996) 14. Kurian, T., Khastgir, D., De, P.P., Tripathy, D.K., De, S.K. and Peiffer, D.G., Polymer 37, 413
(1996) 15. Anthony, P. and De, S.K., Polymer 40, 1487 (1999) 16. Anthony, P., Bandyopadhyay, S. and De, S.K., Polym. Eng. Sci. 39, 963 (1999) 17. Xu, X., Zheng, X. and Li, H., J. Appl. Polym. Sci. 44, 2225 (1992) 18. Datta, S., De, P.P. and De, S.K., J. Appl. Polym. Sci. 61, 1839 (1996) 19. Product specification folder SARLINK
Technology Assessment The aim of this study was to investigate whether it is possible to obtain an ionomeric thermoplastic elastomer based on a low-cost polymer, in this case an ethylene-propylene copolymer (EPM). In the past, various attempts have been made to produce ionomeric rubbers but these materials proved to be improcessible, due to high melt viscosities, and various additives (such as zinc stearate) were needed for processing1-3. In all cases the ionomer precursor was an elastomer of conventional (high) molecular weight resulting in intractable material and, consequently, in this thesis a low molecular weight elastomer was used as the parent polyolefin. It is demonstrated in this thesis that it is possible to obtain ionomeric thermoplastic elastomers based on MAn-g-EPM with an acceptable balance between processing and mechanical properties, see for example Chapter 9 for further details. A comparison of properties of the virgin MAn-g-EPM based ionomers, prepared in this thesis work, with commercially available products leads to the conclusion that the ionomers studied are interesting materials which have the capability to compete with other type of thermoplastic elastomers or ionomers. The use of specific additives could eventually result in improved structure-processing-performance relationships to meet the requirements for certain specific applications and thus more competitive materials. However, an important remark has to be made concerning ‘technology assessment’. The properties, as described in the thesis, were all based on (a) materials prepared via solution grafting, and (b) measured in the fully dried state. In the thesis, the results of an academic study on the relation between ionomer structure, mechanical- and processing properties are presented. The materials were synthesised and prepared via a small-scale solution preparation route (with a maximum of about 20g of final product). The bottlenecks for a successful commercial product are pointed out in this technology assessment and potential solutions and recommendations for future research are suggested. The objective of the grafting study, as described in Chapter 2, was to investigate the conditions of grafting that allow the preparation of a range of ethylene-propylene copolymers grafted with maleic anhydride. These maleated products (MAn-g-EPM) were used for the synthesis of ionomers. By variation of the concentrations of the different reactants (free radical initiator, maleic anhydride and polyolefin) the optimal recipe was composed, and it was possible to obtain materials with the desired degrees of grafted MAn.

148
In industry, however, it is important to obtain large quantities of material at the lowest production costs. Solution-polymerisation/grafting implies an additional purification step. Every extra purification step or removal of solvent costs a lot of time, energy and money. When for example the grafting of MAn is considered, it is commercially not attractive to graft MAn in a polymer solution because of the enormous amounts of solvent and the use of acetone (this thesis) to obtain the grafted product. It is commercially attractive to graft MAn in the polymer melt but this route has proven to result in maleated products with a low amount of grafted MAn. Even repetitive grafting or the addition of additives during grafting didn’t seem to be adequate to increase the degree of grafting4. Consequently, from a future technological point of view, it is of utmost interest to improve the solution grafting method is such a way that high degree of grafting are possible with considerable smaller amounts of solvent. Another possibility is that the subsequent neutralisation step takes place in the grafting reaction mixture to avoid a solvent removal step in the production process (see Figure T.1b). When this route is chosen, it has to be taken into account that all unreacted MAn will be incorporated in the ionic aggregates and, consequently, the mechanical and processing properties might be affected. The preparation of ionomers prepared from MAn-g-EPM has been discussed in Chapter 3. In this study the neutralisation of the ionomer precursor was also performed in a solvent medium (see Figure T.1a). As described above, the use of a preparation route in solution is commercially not attractive. Especially in the case of ionomer synthesis because of the formation of a polymer gel which intensifies the removal of the solvent from the reaction mixture. From literature it is known that the neutralisation of the acid functionality in the ionomer precursor also takes place in the polymer melt. Commercially this is also very attractive for our system; the difficult solvent-removal step in the synthesis is now only necessary after completion of the grafting procedure. The melt neutralisation has a few advantages above solution neutralisation; one of these advantages is the possibility to add additives to the ionomer (see Figure T.1c). The preparation of the parent polyolefin takes place in a solvent medium, this provides another route for obtaining the ionomeric thermoplastic elastomer. When the medium of polymerisation is also used for the grafting reaction the maleated product can be obtained in one step and the neutralisation and compounding step can be performed afterwards, as presented in Figure T.1d. This route is probably the most attractive route because solvent removal is only one step in the whole synthesis procedure.
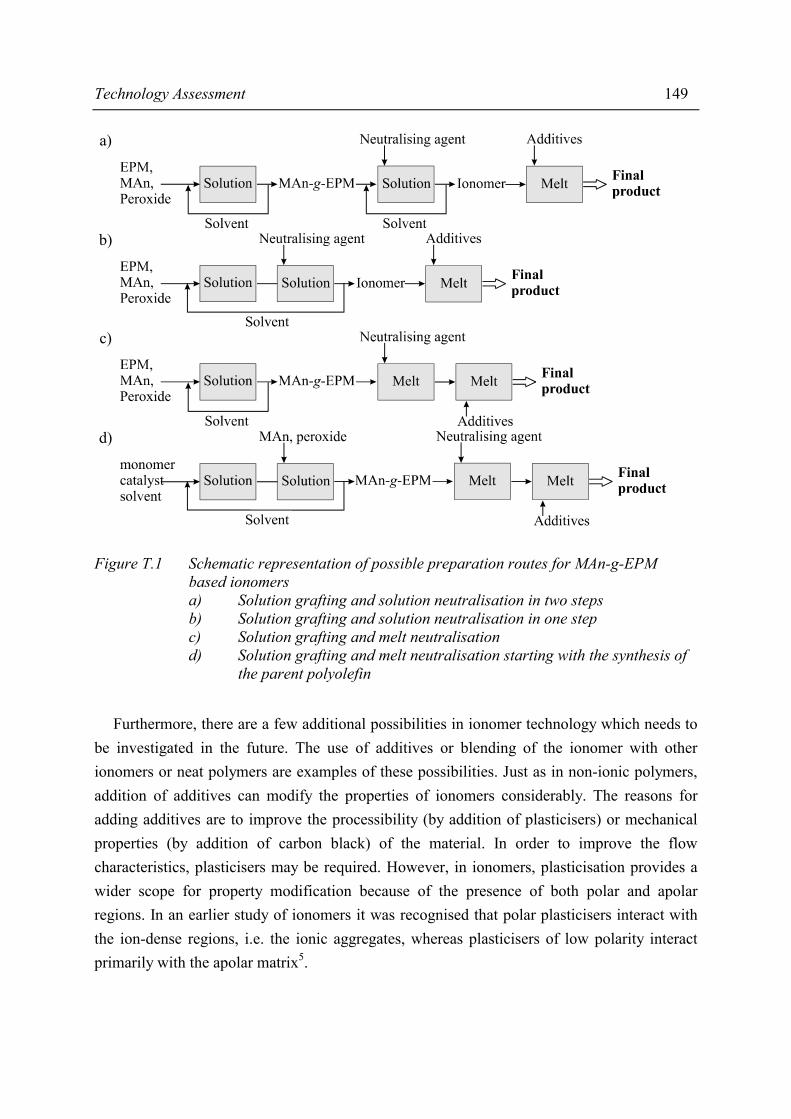
Technology Assessment 149
a)
b)
c)
d)
Figure T.1 Schematic representation of possible preparation routes for MAn-g-EPM based ionomers a) Solution grafting and solution neutralisation in two steps b) Solution grafting and solution neutralisation in one step c) Solution grafting and melt neutralisation d) Solution grafting and melt neutralisation starting with the synthesis of the parent polyolefin
Furthermore, there are a few additional possibilities in ionomer technology which needs to be investigated in the future. The use of additives or blending of the ionomer with other ionomers or neat polymers are examples of these possibilities. Just as in non-ionic polymers, addition of additives can modify the properties of ionomers considerably. The reasons for adding additives are to improve the processibility (by addition of plasticisers) or mechanical properties (by addition of carbon black) of the material. In order to improve the flow characteristics, plasticisers may be required. However, in ionomers, plasticisation provides a wider scope for property modification because of the presence of both polar and apolar regions. In an earlier study of ionomers it was recognised that polar plasticisers interact with the ion-dense regions, i.e. the ionic aggregates, whereas plasticisers of low polarity interact primarily with the apolar matrix5.

150
In this respect, the role of water has to be investigated in more detail. Water could act as plasticiser, on one hand but on the other hand can also have a profound effect on the physical properties. The water absorption studies in this thesis revealed that, due to the presence of ionic groups the water absorption is an important phenomenon that has to be taken into account. As demonstrated in Chapter 7, the uptake of water caused a change in ionomer morphology and will probably also result in a change in the mechanical and processing properties. From the results of the water absorption of the MAn-g-EPM based ionomers it is evident that the amount of water that is absorbed by the ionomer film can be controlled by the compositional parameters of the ionomer. In conclusion, MAn-g-EPM based ionomers are promising materials but further optimisation is needed for commercialisation.
References 1. Makowski, H.S. and Lundberg, R.D., Polym. Prepr. 19, 304 (1978) 2. Kurian, T., Khastgir, D., De, P.P., Tripathy, D.K. and De, S.K., Rubber World 41 (1995) 3. Datta, S., De, S.K., Kontos, E.G. and Wefer, J.M., J. Appl. Polym. Sci. 61, 177 (1996) 4. Wouters, M.E.L and Lie, E., Unpublished results 5. Lundberg, R.D., Makowski, H.S., Westerman, L., in Ions in Polymers (ACS Adv. Chem. Ser.
187); Eisenberg, A., Ed., American Chemical Society; Washington DC, 1980, Chapter 5

Appendix A
Determination of the degree of grafting
A.1 Introduction The titration procedure described in this appendix is based on the direct titration of the grafted maleic anhydride using a quaternary ammonium hydroxide as the base. This quaternary ammonium hydroxide, tetrabutylammonium hydroxide (TBAOH), is an organic soluble very strong base1. The use of TBAOH in the determination of maleic anhydride results in the titration of only one carboxylic acid group of the anhydride2,3. The maleated products are all free of non-reacted maleic anhydride; after the grafting reaction the free maleic anhydride is removed by means of the precipitation step (acetone is a good solvent for maleic anhydride and it is a non-solvent for the polymer). The titration is carried out in a water-free solvent system (a solvent mixture composed of toluene and isopropanol in a 9 to 1 volume ratio) and was followed potentiometrically. To obtain a stable signal during the titration an alcohol was added. Isopropanol was chosen because this alcohol does not esterify the maleic anhydride4.
A.2 Titration procedure
A.2.1 Reagents
The titrant, tetrabutylammonium hydroxide solution (TBAOH-solution, Merck, 0.1N in isopropanol/methanol) was diluted to the desired concentration using isopropanol (Fluka, >99%). The titrant was standardised against benzoic acid (Jansen, 99%) using thymol blue (thymol sulfonphtalein, Merck, 1 % in THF) as end-point indicator. As medium for the titrations a toluene/isopropanol mixture (9/1 v/v) was used.
A.2.2 Equipment
The experimental set-up for the potentiometric measurement consists of a Methrom E670 Titroprocessor equipped with a Methrom 713 pH meter, a Dosimat 665 titrator, Ag-titrode and Ag/Ag,AgCl reference electrode (electrolyte: LiCl sat. in ethanol).
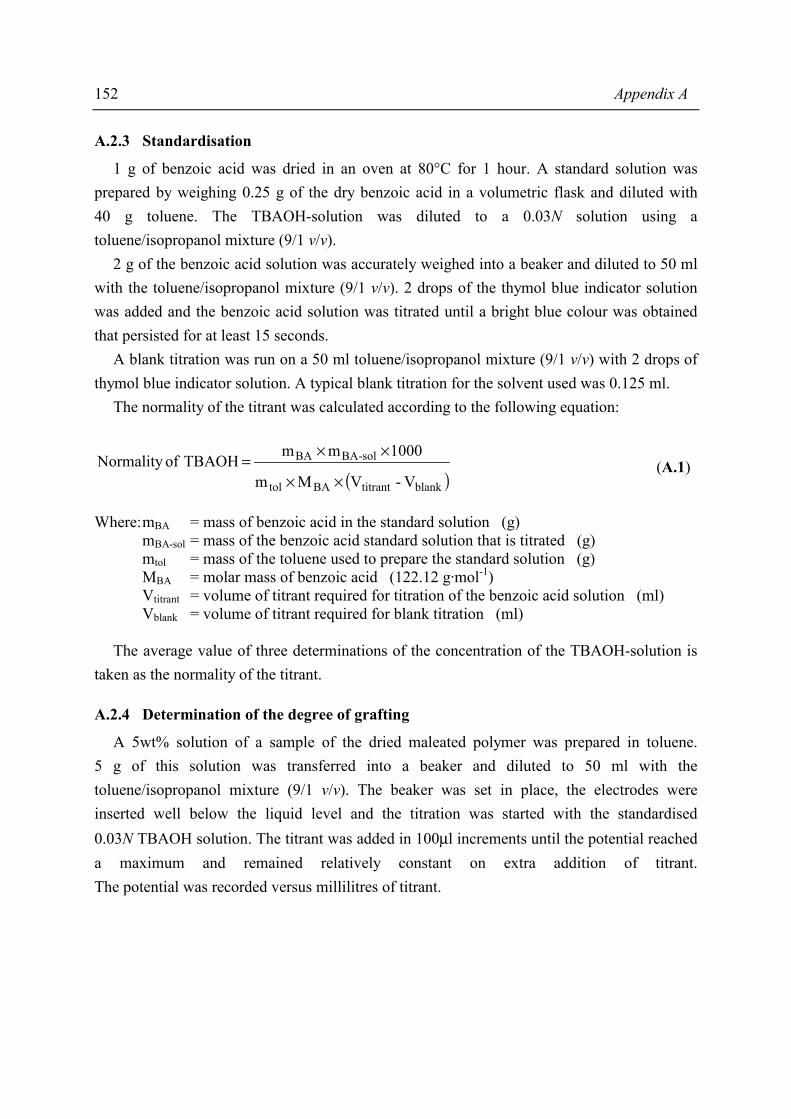
152 Appendix A
A.2.3 Standardisation
1 g of benzoic acid was dried in an oven at 80°C for 1 hour. A standard solution was prepared by weighing 0.25 g of the dry benzoic acid in a volumetric flask and diluted with 40 g toluene. The TBAOH-solution was diluted to a 0.03N solution using a toluene/isopropanol mixture (9/1 v/v). 2 g of the benzoic acid solution was accurately weighed into a beaker and diluted to 50 ml with the toluene/isopropanol mixture (9/1 v/v). 2 drops of the thymol blue indicator solution was added and the benzoic acid solution was titrated until a bright blue colour was obtained that persisted for at least 15 seconds. A blank titration was run on a 50 ml toluene/isopropanol mixture (9/1 v/v) with 2 drops of thymol blue indicator solution. A typical blank titration for the solvent used was 0.125 ml. The normality of the titrant was calculated according to the following equation:
( )blanktitrantBAtol
sol-BABA
V-VMm
1000mm TBAOH ofNormality
××
××= (A.1)
Where: mBA = mass of benzoic acid in the standard solution (g) mBA-sol = mass of the benzoic acid standard solution that is titrated (g) mtol = mass of the toluene used to prepare the standard solution (g) MBA = molar mass of benzoic acid (122.12 g·mol-1) Vtitrant = volume of titrant required for titration of the benzoic acid solution (ml) Vblank = volume of titrant required for blank titration (ml) The average value of three determinations of the concentration of the TBAOH-solution is taken as the normality of the titrant.
A.2.4 Determination of the degree of grafting
A 5wt% solution of a sample of the dried maleated polymer was prepared in toluene. 5 g of this solution was transferred into a beaker and diluted to 50 ml with the toluene/isopropanol mixture (9/1 v/v). The beaker was set in place, the electrodes were inserted well below the liquid level and the titration was started with the standardised 0.03N TBAOH solution. The titrant was added in 100µl increments until the potential reached a maximum and remained relatively constant on extra addition of titrant. The potential was recorded versus millilitres of titrant.
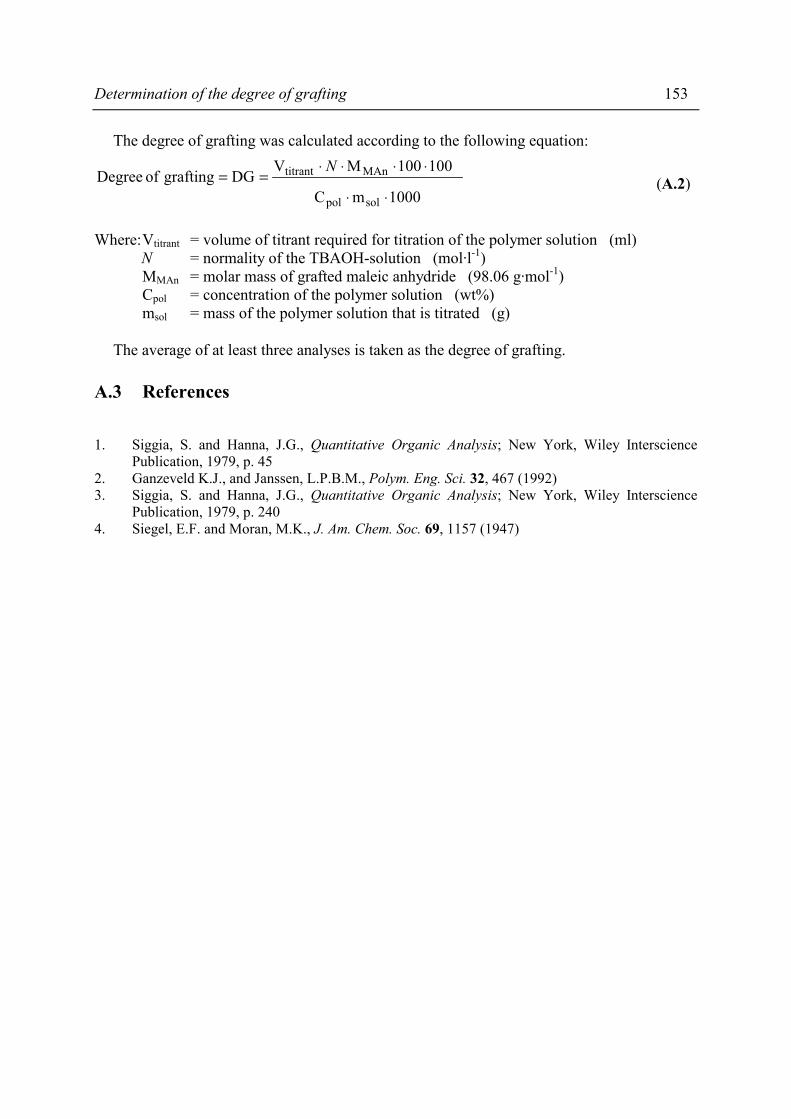
Determination of the degree of grafting 153
The degree of grafting was calculated according to the following equation:
1000mC
100100MVDGgrafting of Degree
solpol
MAntitrant
⋅⋅
⋅⋅⋅⋅==
N (A.2)
Where: Vtitrant = volume of titrant required for titration of the polymer solution (ml) N = normality of the TBAOH-solution (mol·l-1) MMAn = molar mass of grafted maleic anhydride (98.06 g·mol-1) Cpol = concentration of the polymer solution (wt%) msol = mass of the polymer solution that is titrated (g) The average of at least three analyses is taken as the degree of grafting.
A.3 References 1. Siggia, S. and Hanna, J.G., Quantitative Organic Analysis; New York, Wiley Interscience
Publication, 1979, p. 45 2. Ganzeveld K.J., and Janssen, L.P.B.M., Polym. Eng. Sci. 32, 467 (1992) 3. Siggia, S. and Hanna, J.G., Quantitative Organic Analysis; New York, Wiley Interscience
Publication, 1979, p. 240 4. Siegel, E.F. and Moran, M.K., J. Am. Chem. Soc. 69, 1157 (1947)

154 Appendix A
Appendix B
Side reactions during grafting
B.1 Introduction The mechanism of grafting has been a subject of many studies. Grafting mechanisms of polyolefins have been studied in a solvent medium1-4 and in the bulk state5-8. A grafting reaction in a solvent medium can eliminate heterogeneity problems (high melt viscosities, diffusion problems, immiscibility due to polarity differences, etcetera) and therefore results in higher degrees of grafting. However, grafting efficiencies* are low due to many factors including a possible solvent effect. In this appendix, GC-MS is used to trace the type of reaction product species to get insight in the competition of polymer and solvent during the grafting reaction and the type of side reactions that occur during the grafting of MAn to EPM dissolved in xylene.
B.2 Experimental
B.2.1 Grafting reaction in xylene
In a double walled glass reactor equipped with N2 inlet, septum and helical-impeller EPM (45 wt% ethylene, 55 wt% propylene, Mn 11 kg·mol-1) was dissolved in xylene (mixture of isomers, Aldrich) at the reaction temperature (130°C). When the dissolution was complete MAn (Merck, >99%) was added. Then, after complete dissolution, TxC (Akzo Nobel) was added to the system. After the required reaction time of 2 hours the polymer was precipitated in acetone of reagent grade (Merck, >99%). The precipitated polymer was dried in a vacuum oven at 80°C. The acetone soluble reaction products were analysed with GC-MS. Table B.1 shows the detailed recipes of the reactions studied.
* Grafting efficiency is defined as the amount of MAn grafted compared to the amount of MAn added to the
reaction mixture
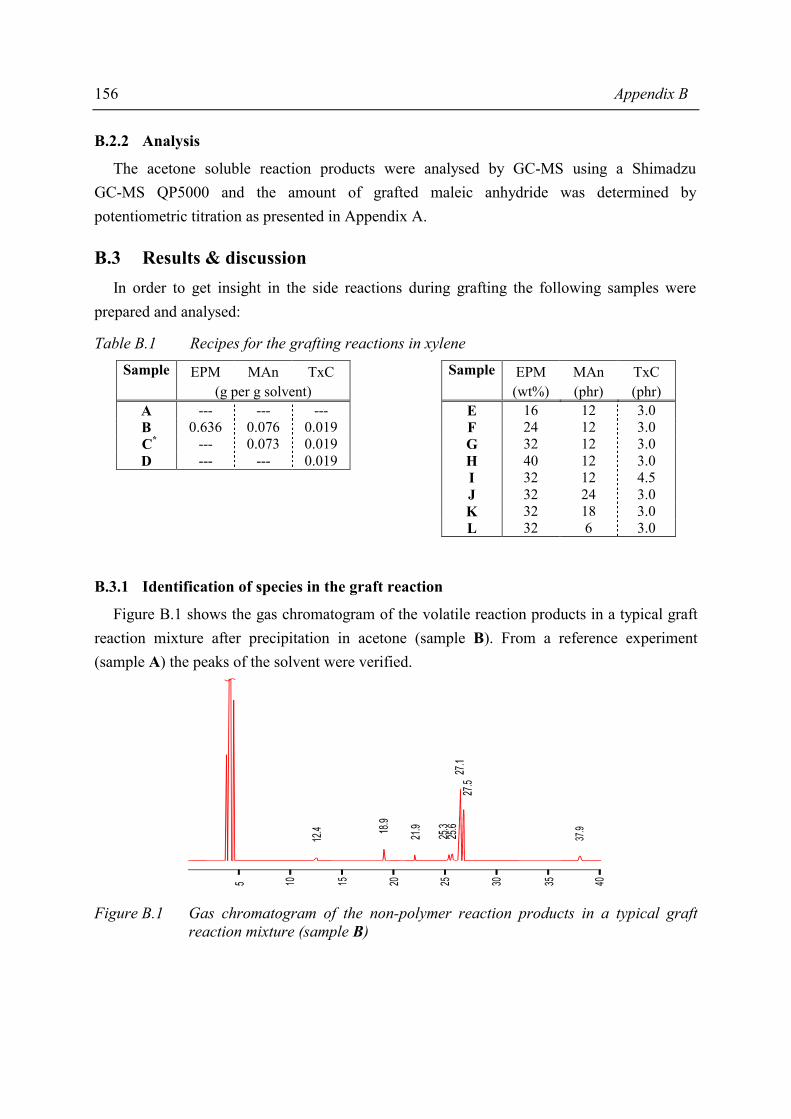
156 Appendix B
B.2.2 Analysis
The acetone soluble reaction products were analysed by GC-MS using a Shimadzu GC-MS QP5000 and the amount of grafted maleic anhydride was determined by potentiometric titration as presented in Appendix A.
B.3 Results & discussion In order to get insight in the side reactions during grafting the following samples were prepared and analysed:
Table B.1 Recipes for the grafting reactions in xylene Sample EPM MAn TxC
(g per g solvent) A --- --- --- B 0.636 0.076 0.019 C* --- 0.073 0.019 D --- --- 0.019
Sample EPM MAn TxC (wt%) (phr) (phr)
E 16 12 3.0 F 24 12 3.0 G 32 12 3.0 H 40 12 3.0 I 32 12 4.5 J 32 24 3.0 K 32 18 3.0 L 32 6 3.0
B.3.1 Identification of species in the graft reaction
Figure B.1 shows the gas chromatogram of the volatile reaction products in a typical graft reaction mixture after precipitation in acetone (sample B). From a reference experiment (sample A) the peaks of the solvent were verified.
Figure B.1 Gas chromatogram of the non-polymer reaction products in a typical graft reaction mixture (sample B)
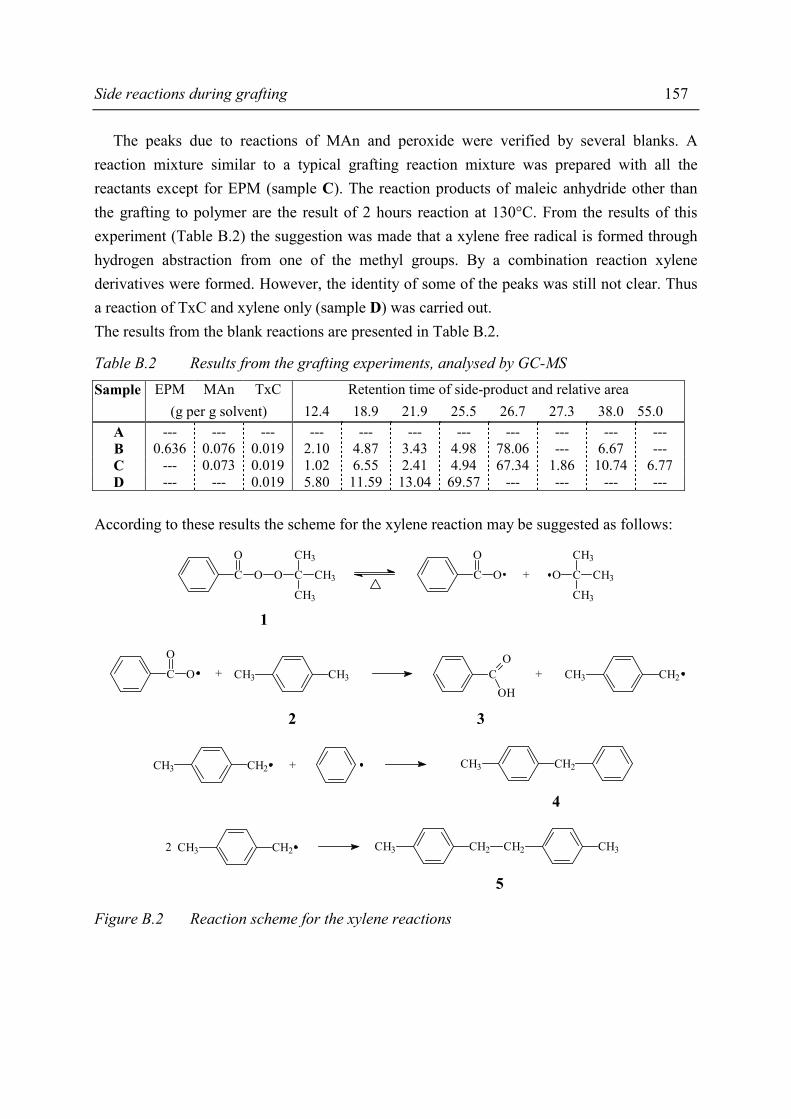
Side reactions during grafting 157
The peaks due to reactions of MAn and peroxide were verified by several blanks. A reaction mixture similar to a typical grafting reaction mixture was prepared with all the reactants except for EPM (sample C). The reaction products of maleic anhydride other than the grafting to polymer are the result of 2 hours reaction at 130°C. From the results of this experiment (Table B.2) the suggestion was made that a xylene free radical is formed through hydrogen abstraction from one of the methyl groups. By a combination reaction xylene derivatives were formed. However, the identity of some of the peaks was still not clear. Thus a reaction of TxC and xylene only (sample D) was carried out. The results from the blank reactions are presented in Table B.2.
Table B.2 Results from the grafting experiments, analysed by GC-MS Sample EPM MAn TxC Retention time of side-product and relative area (g per g solvent) 12.4 18.9 21.9 25.5 26.7 27.3 38.0 55.0
A --- --- --- --- --- --- --- --- --- --- --- B 0.636 0.076 0.019 2.10 4.87 3.43 4.98 78.06 --- 6.67 --- C --- 0.073 0.019 1.02 6.55 2.41 4.94 67.34 1.86 10.74 6.77 D --- --- 0.019 5.80 11.59 13.04 69.57 --- --- --- ---
According to these results the scheme for the xylene reaction may be suggested as follows:
C
O
O O C
CH3
CH3
CH3
O C
CH3
CH3
CH3
+C
O
O
1
C
O
O + CH3CH3 CO
OH+ CH2CH3
2 3
CH2CH3 + CH3 CH2
4
CH2CH32 CH3 CH2 CH2 CH3
5
Figure B.2 Reaction scheme for the xylene reactions

158 Appendix B
The results showed that benzoic acid (3) was one of the products present. From the decomposition of tert-butylperoxybenzoate (1) 9, it can be seen that benzoic acid is a product of hydrogen abstraction from a substrate by a free radical from the initiator decomposition (Figure B.2, product 3). In summary, for the graft reaction using xylene as solvent, the primary radical and MAn were consumed not only by the main graft reaction but also by side reactions with the solvent. In order to get insight in the influence of the different reactants (MAn, TxC and EPM) on the type of side products formed some other experiments were performed.
B.3.2 Effect of variation of reactant concentration
To study the effect of the concentration of the reactants on the side reactions during grafting, a systematic study was performed. The results of the different grafting experiments are presented below (Table B.3).
Table B.3 Results from the grafting experiments, analysed by titration (DG) and GC-MS Sample EPM MAn TxC DG Retention time of side-product and relative area
(wt%) (phr) (phr) (wt%) 12.4 18.9 21.9 25.5 26.7 27.3 38.0
E 24 12 3.0 5.48 1.00 4.24 1.71 5.46 84.07 --- 3.51 F 32 12 3.0 6.26 1.24 4.70 2.93 5.13 80.15 --- 5.86 G 40 12 3.0 6.98 2.10 4.87 3.43 4.98 78.06 --- 6.67 H 32 12 4.5 5.39 1.37 6.51 3.31 4.72 78.05 --- 5.35 I 32 24 3.0 7.95 1.46 3.89 3.01 4.47 71.85 --- 15.3 J 32 18 3.0 7.37 1.37 3.90 2.73 4.97 76.13 --- 10.91 K 32 6 3.0 3.29 1.06 9.64 3.11 5.17 80.31 1.96 1.57
As can be seen from this table, the effect of the concentration of different reactants in the system on the amount side products formed is observable. Effect of EPM concentration From experiments E,F and G the effect of the concentration EPM on the formation of side products was studied. When the relative areas of the different peaks were plotted as a function of the EPM concentration (Figure B.4) it became clear that on increasing EPM concentration some peaks were present with reduced intensity (RT = 25.5 and 26.7). On the other hand some other peaks appeared with increasing intensity (RT = 12.4 and 21.9).
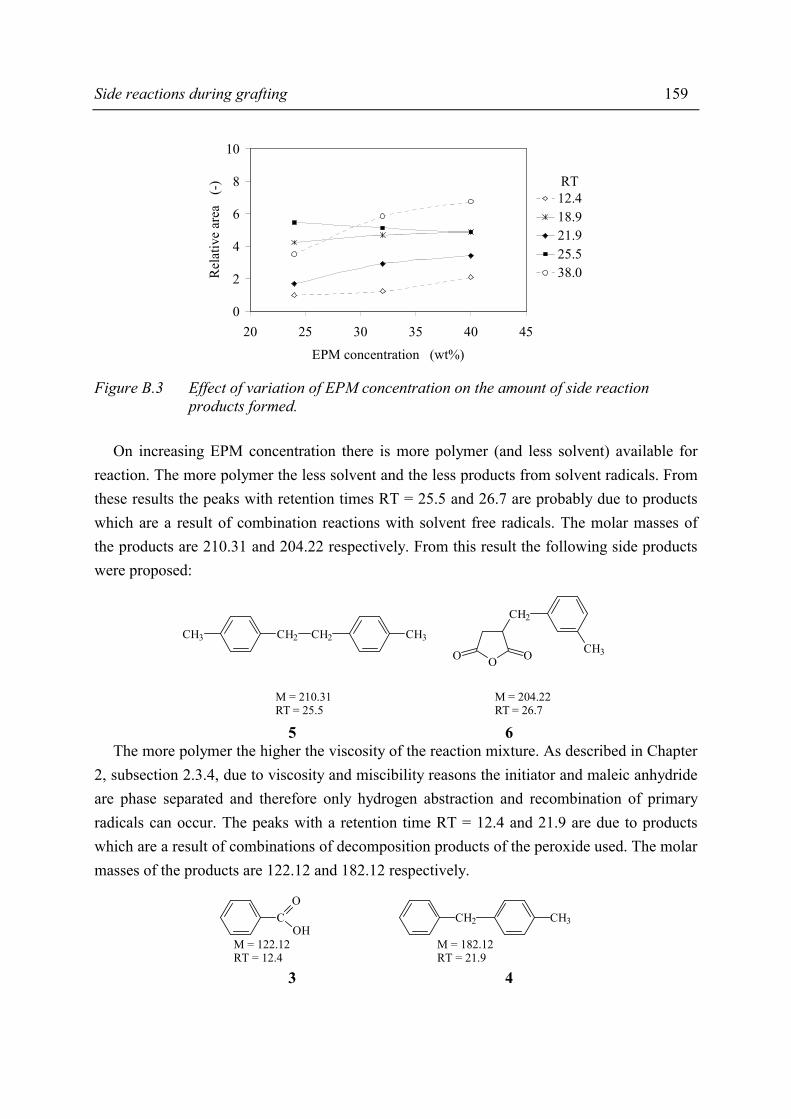
Side reactions during grafting 159
0
2
4
6
8
10
20 25 30 35 40 45
EPM concentration (wt%)
Rel
ativ
e ar
ea
(-)
12.418.921.925.538.0
RT
Figure B.3 Effect of variation of EPM concentration on the amount of side reaction
products formed. On increasing EPM concentration there is more polymer (and less solvent) available for reaction. The more polymer the less solvent and the less products from solvent radicals. From these results the peaks with retention times RT = 25.5 and 26.7 are probably due to products which are a result of combination reactions with solvent free radicals. The molar masses of the products are 210.31 and 204.22 respectively. From this result the following side products were proposed:
CH3
CH2
O OO
M = 204.22RT = 26.7
CH3 CH2 CH2 CH3
M = 210.31RT = 25.5
5 6 The more polymer the higher the viscosity of the reaction mixture. As described in Chapter 2, subsection 2.3.4, due to viscosity and miscibility reasons the initiator and maleic anhydride are phase separated and therefore only hydrogen abstraction and recombination of primary radicals can occur. The peaks with a retention time RT = 12.4 and 21.9 are due to products which are a result of combinations of decomposition products of the peroxide used. The molar masses of the products are 122.12 and 182.12 respectively.
CO
OHM = 122.12RT = 12.4
CH2 CH3
M = 182.12RT = 21.9
3 4
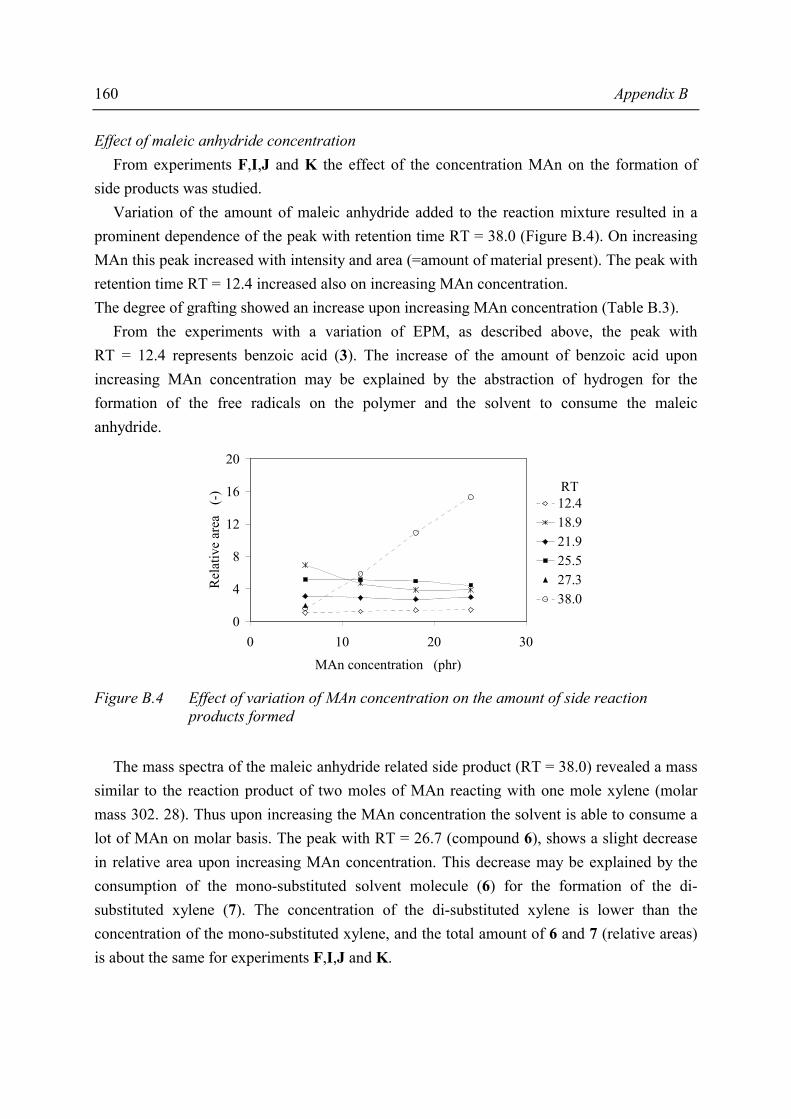
160 Appendix B
Effect of maleic anhydride concentration From experiments F,I,J and K the effect of the concentration MAn on the formation of side products was studied. Variation of the amount of maleic anhydride added to the reaction mixture resulted in a prominent dependence of the peak with retention time RT = 38.0 (Figure B.4). On increasing MAn this peak increased with intensity and area (=amount of material present). The peak with retention time RT = 12.4 increased also on increasing MAn concentration. The degree of grafting showed an increase upon increasing MAn concentration (Table B.3). From the experiments with a variation of EPM, as described above, the peak with RT = 12.4 represents benzoic acid (3). The increase of the amount of benzoic acid upon increasing MAn concentration may be explained by the abstraction of hydrogen for the formation of the free radicals on the polymer and the solvent to consume the maleic anhydride.
0
4
8
12
16
20
0 10 20 30
MAn concentration (phr)
Rel
ativ
e ar
ea
(-)
12.418.921.925.527.338.0
RT
Figure B.4 Effect of variation of MAn concentration on the amount of side reaction
products formed The mass spectra of the maleic anhydride related side product (RT = 38.0) revealed a mass similar to the reaction product of two moles of MAn reacting with one mole xylene (molar mass 302. 28). Thus upon increasing the MAn concentration the solvent is able to consume a lot of MAn on molar basis. The peak with RT = 26.7 (compound 6), shows a slight decrease in relative area upon increasing MAn concentration. This decrease may be explained by the consumption of the mono-substituted solvent molecule (6) for the formation of the di-substituted xylene (7). The concentration of the di-substituted xylene is lower than the concentration of the mono-substituted xylene, and the total amount of 6 and 7 (relative areas) is about the same for experiments F,I,J and K.
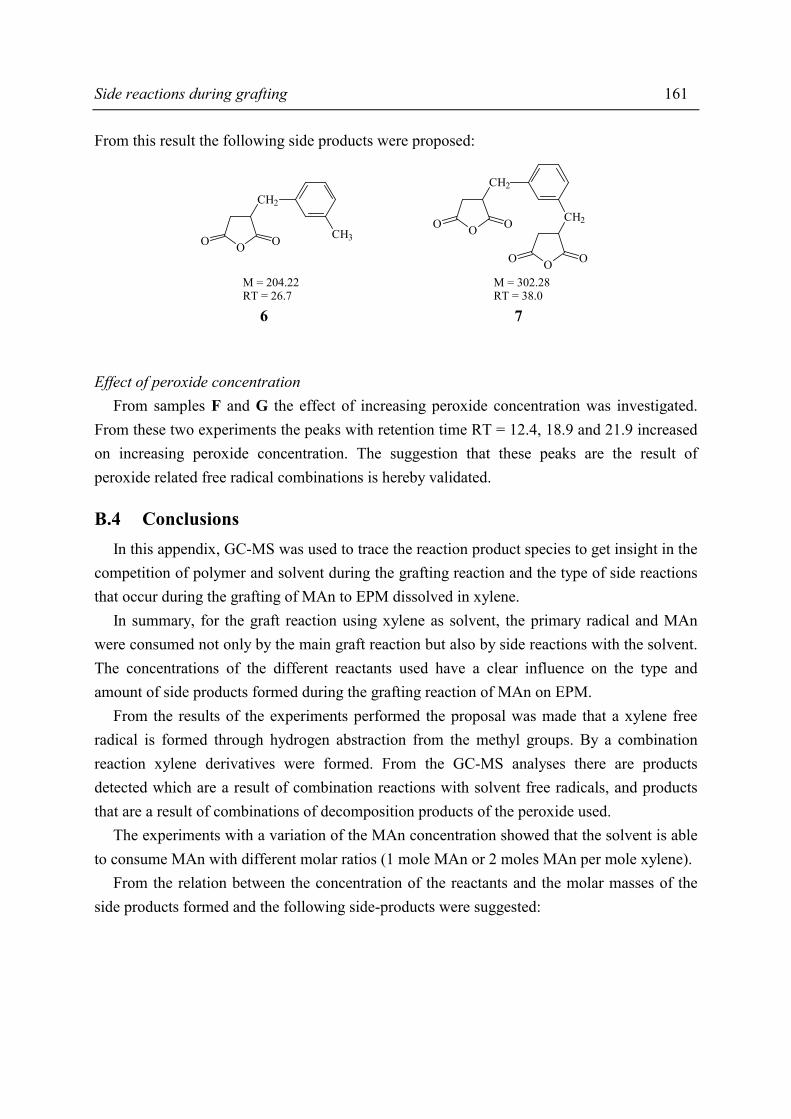
Side reactions during grafting 161
From this result the following side products were proposed:
CH2
CH2
O
O OO
O O
M = 302.28RT = 38.0
CH3
CH2
O OO
M = 204.22RT = 26.7
6 7 Effect of peroxide concentration From samples F and G the effect of increasing peroxide concentration was investigated. From these two experiments the peaks with retention time RT = 12.4, 18.9 and 21.9 increased on increasing peroxide concentration. The suggestion that these peaks are the result of peroxide related free radical combinations is hereby validated.
B.4 Conclusions In this appendix, GC-MS was used to trace the reaction product species to get insight in the competition of polymer and solvent during the grafting reaction and the type of side reactions that occur during the grafting of MAn to EPM dissolved in xylene. In summary, for the graft reaction using xylene as solvent, the primary radical and MAn were consumed not only by the main graft reaction but also by side reactions with the solvent. The concentrations of the different reactants used have a clear influence on the type and amount of side products formed during the grafting reaction of MAn on EPM. From the results of the experiments performed the proposal was made that a xylene free radical is formed through hydrogen abstraction from the methyl groups. By a combination reaction xylene derivatives were formed. From the GC-MS analyses there are products detected which are a result of combination reactions with solvent free radicals, and products that are a result of combinations of decomposition products of the peroxide used. The experiments with a variation of the MAn concentration showed that the solvent is able to consume MAn with different molar ratios (1 mole MAn or 2 moles MAn per mole xylene). From the relation between the concentration of the reactants and the molar masses of the side products formed and the following side-products were suggested:
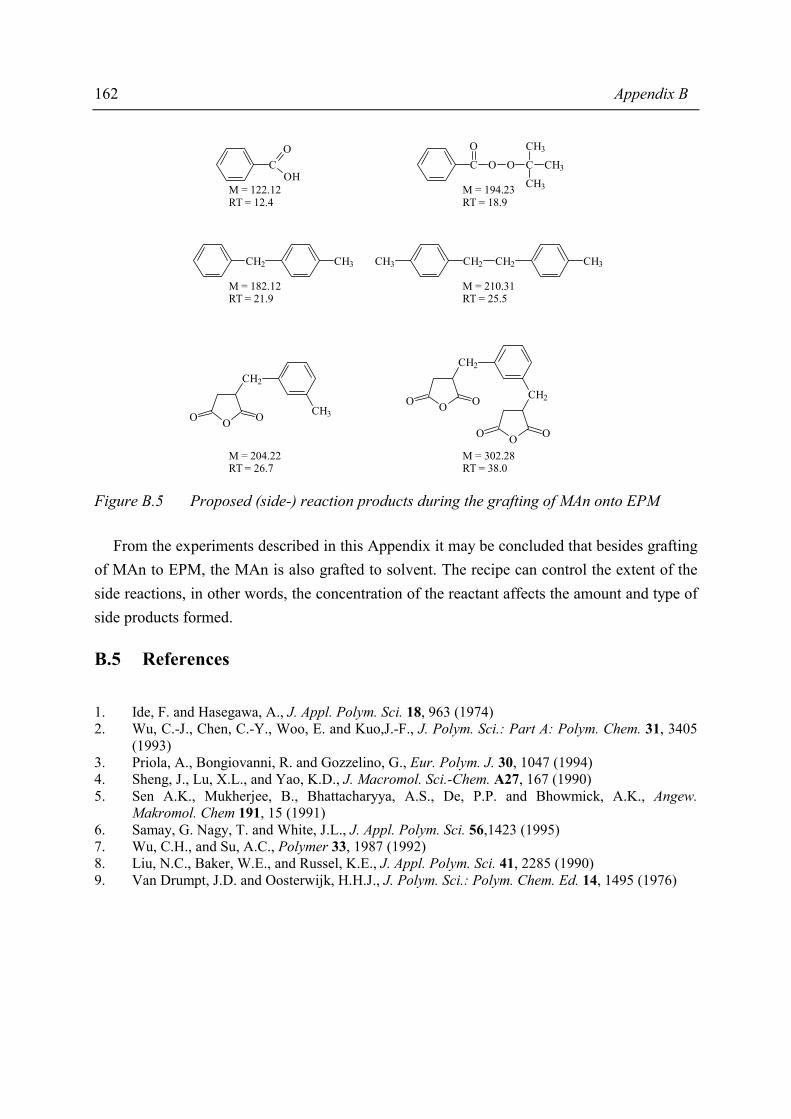
162 Appendix B
CO
OHM = 122.12RT = 12.4
C
O
O O C
CH3
CH3
CH3M = 194.23RT = 18.9
CH3 CH2 CH2 CH3
M = 210.31RT = 25.5
CH2 CH3
M = 182.12RT = 21.9
CH2
CH2
O
O OO
O O
M = 302.28RT = 38.0
CH3
CH2
O OO
M = 204.22RT = 26.7
Figure B.5 Proposed (side-) reaction products during the grafting of MAn onto EPM From the experiments described in this Appendix it may be concluded that besides grafting of MAn to EPM, the MAn is also grafted to solvent. The recipe can control the extent of the side reactions, in other words, the concentration of the reactant affects the amount and type of side products formed.
B.5 References 1. Ide, F. and Hasegawa, A., J. Appl. Polym. Sci. 18, 963 (1974) 2. Wu, C.-J., Chen, C.-Y., Woo, E. and Kuo,J.-F., J. Polym. Sci.: Part A: Polym. Chem. 31, 3405
(1993) 3. Priola, A., Bongiovanni, R. and Gozzelino, G., Eur. Polym. J. 30, 1047 (1994) 4. Sheng, J., Lu, X.L., and Yao, K.D., J. Macromol. Sci.-Chem. A27, 167 (1990) 5. Sen A.K., Mukherjee, B., Bhattacharyya, A.S., De, P.P. and Bhowmick, A.K., Angew.
Makromol. Chem 191, 15 (1991) 6. Samay, G. Nagy, T. and White, J.L., J. Appl. Polym. Sci. 56,1423 (1995) 7. Wu, C.H., and Su, A.C., Polymer 33, 1987 (1992) 8. Liu, N.C., Baker, W.E., and Russel, K.E., J. Appl. Polym. Sci. 41, 2285 (1990) 9. Van Drumpt, J.D. and Oosterwijk, H.H.J., J. Polym. Sci.: Polym. Chem. Ed. 14, 1495 (1976)

Appendix C
Absorbance ratio to determine the degree of neutralisation Figure C.1 shows the FTIR spectra of ionomer samples based on a maleated ethylene-propylene copolymer (MAn-g-EPM) which were neutralised to different degrees.
50075010001250150017502000Wavenumber (cm-1)
Abs
orba
nce
Figure C.1 Infra-red spectra of MAn-g-EPM neutralised to different extents with zinc The absorbance of the vibrations due to the presence of the polar group (MAn) decreases gradually upon neutralisation while the absorbance due to methylene vibration (EPM-backbone) remains almost the same upon neutralisation. A relationship between the degree of neutralisation (DN) and the absorbance ratio of the different peaks of interest to the internal reference peak (EPM-backbone, 723 cm-1) can be obtained. The relationship between the quantity measured in absorption (A) and a quantity sought (concentration c) is known as Beer’s law and can be written as: A = a·b·c (C.1) Where: A = absorbance (-) a = absorptivity (e.g. in cm2⋅mol-1) b = thickness of the sample (e.g. in cm) c = concentration of the substance (e.g. in mol⋅cm-3) Since absorbance is a unit-less quantity, the absorptivity has units that make the right side of equation C.1 dimensionless.
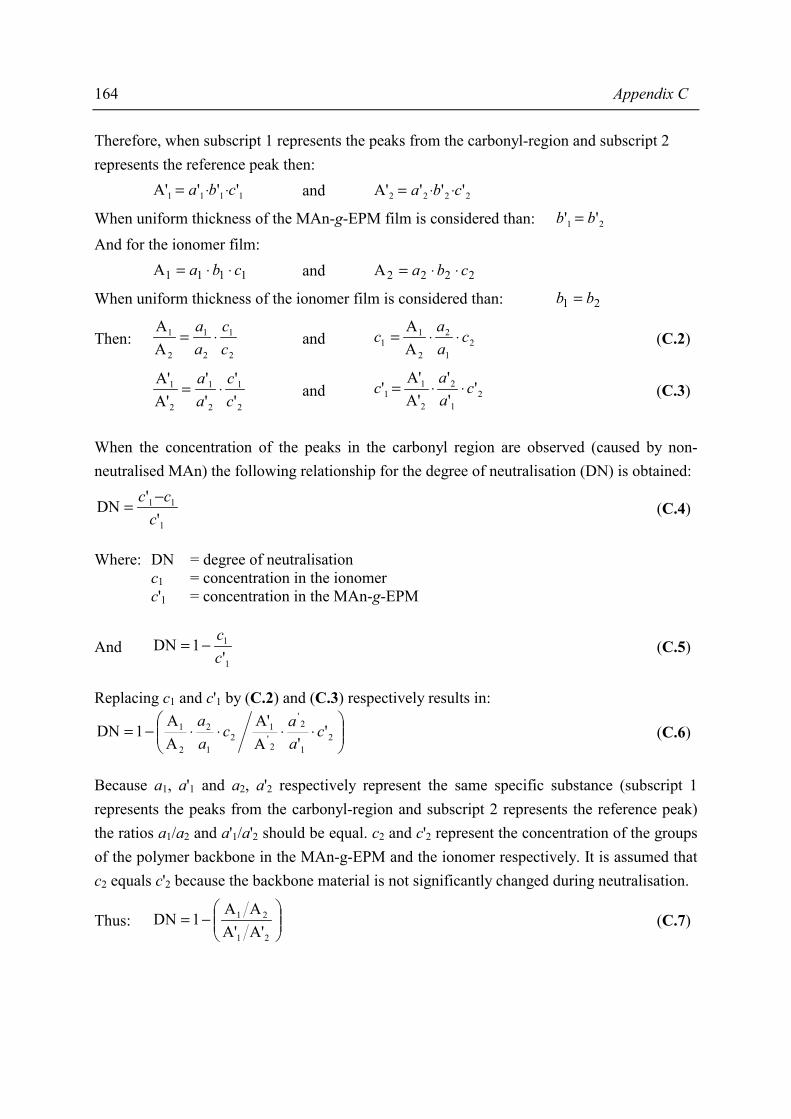
164 Appendix C
Therefore, when subscript 1 represents the peaks from the carbonyl-region and subscript 2 represents the reference peak then:
1111 '''A' cba ⋅⋅= and 2222 '''A' cba ⋅⋅= When uniform thickness of the MAn-g-EPM film is considered than: 21 '' bb = And for the ionomer film:
1111A cba ⋅⋅= and 2222A cba ⋅⋅= When uniform thickness of the ionomer film is considered than: 21 bb =
Then: 2
1
2
1
2
1
AA
cc
aa
⋅= and 21
2
2
11 A
A caac ⋅⋅= (C.2)
2
1
2
1
2
1
''
''
A'A'
cc
aa
⋅= and 21
2
2
11 '
''
A'A'' c
aac ⋅⋅= (C.3)
When the concentration of the peaks in the carbonyl region are observed (caused by non-neutralised MAn) the following relationship for the degree of neutralisation (DN) is obtained:
1
11
''
DNc
cc −= (C.4)
Where: DN = degree of neutralisation c1 = concentration in the ionomer c'1 = concentration in the MAn-g-EPM
And 1
1
'1DN
cc
−= (C.5)
Replacing c1 and c'1 by (C.2) and (C.3) respectively results in:
⋅⋅⋅⋅−= 2
1
2'
2'1
21
2
2
1 ''A
A'AA
1DN caac
aa
(C.6)
Because a1, a'1 and a2, a'2 respectively represent the same specific substance (subscript 1 represents the peaks from the carbonyl-region and subscript 2 represents the reference peak) the ratios a1/a2 and a'1/a'2 should be equal. c2 and c'2 represent the concentration of the groups of the polymer backbone in the MAn-g-EPM and the ionomer respectively. It is assumed that c2 equals c'2 because the backbone material is not significantly changed during neutralisation.
Thus:
−=
21
21
A'A'AA
1DN (C.7)

Appendix D
Paracrystalline lattice model
D.1 Introduction In Chapter 4 the SAXS profiles were fitted using different kinds of morphological models. One of the morphological models, often used for systems with intermediate degree of order (distorted crystals, liquids and in short paracrystalline structures), is the paracrystalline lattice model1. In such a model, the scattering particles are arranged on a lattice that is disordered from perfect periodicity by allowing the lattice basis vectors to fluctuate in some way. In addition to the fluctuation of the lattice basis vectors, the particle positions and orientations in each lattice cell can fluctuate. The distortion of the position and orientation of the scattering particle is called distortion of the first kind. Distortion of the second kind is the lattice distortion. Hosemann and Bagchi described the mathematical analysis of the paracrystalline lattice model in detail2. This appendix deals with the derivation of the equations used for the fitting of the model to the experimental data.
D.2 Derivation of the paracrystalline lattice model equations
D.2.1 General equations
For the ionomer systems a paracrystal is considered where only the disorder from perfect periodicity is allowed (distortion of the second kind). The scattered intensity is then given by:
(q)(q)V
1
)Vq(
)q( 2c
ce
ZFI
I = (D.1)
where Vc is the average volume per lattice cell, Fc is the structure factor of a lattice cell and Z is the lattice statistics factor. The three fundamental lattice vectors <a1>, <a2> and <a3> are assumed to form an orthogonal lattice and the scattering particles are spheres of radius R, having an electron density difference with the matrix of ρ.

166 Appendix D
For this case, the averaging over all possible particle orientations results in:
∫∫ππ
φθθφθΦρπ
=⋅
2/
0
2/
0
2220
ce
ddsin),,q()qR(VV
2
V)q(
)q( ZI
I (D.2)
Where θ and φ define the orientation of the vector q with respect to the lattice coordinate system. In other words,
φ⋅θ⋅><⋅>=<⋅ cossinqq 11 aa (D.3) φ⋅θ⋅><⋅>=<⋅ cossinqq 22 aa (D.4)
θ⋅><⋅>=<⋅ cosqq 33 aa (D.5) For the case of an ideal paracrystal, in which all of the cells are parallelepipeds and the three lattice vectors fluctuate independently from cell to cell with a spherically symmetric Gaussian distribution about the mean, an analytical expression exists for Z(q):
)q(1
)q(1Re)q(
k
k3
1k F
FZ−
+∏==
(D.6)
where [ ]><⋅−≅ kkk )q(exp)q()q( aiFF (D.7)
and
−≅
2
qexp)q(
2k
2
ksF (D.8)
where s is a measure of the breadth of distribution of lattice vectors. In order to use the complex paracrystalline lattice model a simplification was introduced: the lattice was considered as a cubic lattice (<a1> = <a2> = <a3> = a ) with equal disorder in all three basic vectors (s1 = s2 = s3 = s ). The scattering particles are considered as identical spherical particles, with radius R, present on each lattice point.
D.2.2 Z(q) for the case of a simple-cubic (sc) lattice
For the case of a sc lattice equations D.3 through D.8 are used to obtain the equations for Z(q) for the three different directions.
),q,(),q,(),q,()q(1
)q(1Re)q( 321
k
k3
1kφθ⋅φθ⋅φθ=
−
+∏==
ZZZF
FZ (D.9)
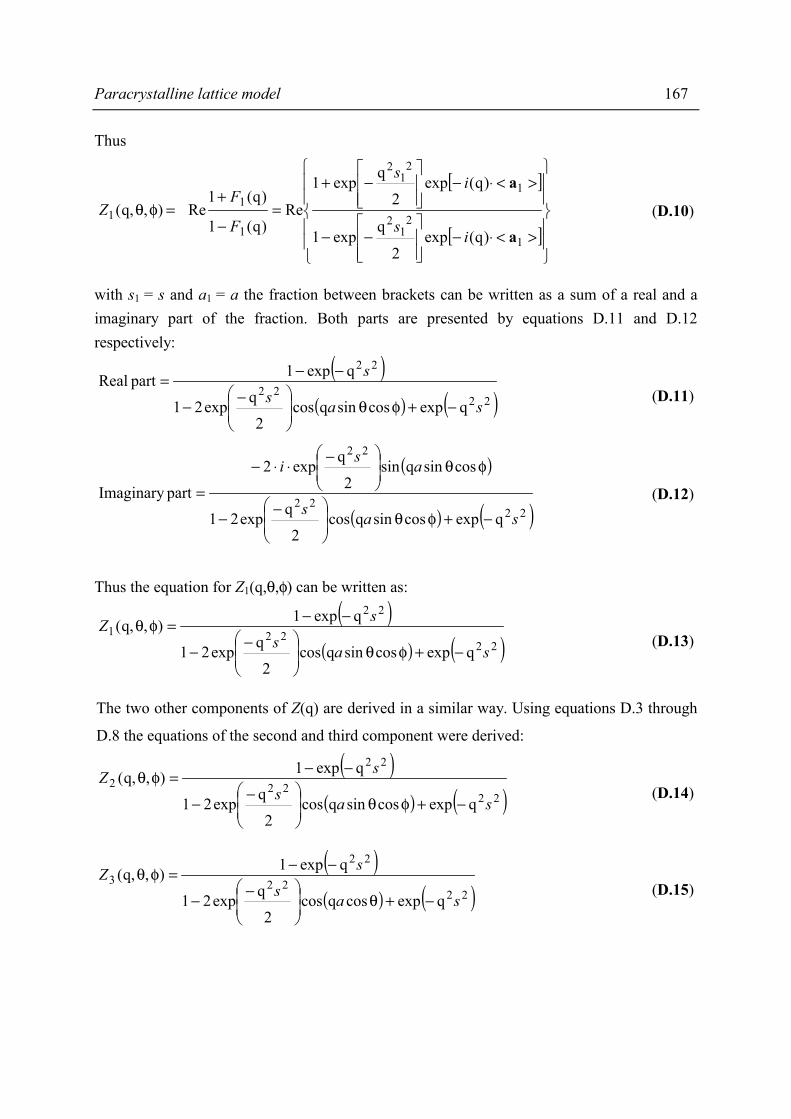
Paracrystalline lattice model 167
Thus
[ ]
[ ]
><⋅−
−−
><⋅−
−+
=−
+=φθ
1
21
2
1
21
2
1
11
)q(exp2
qexp1
)q(exp2
qexp1
Re)q(1
)q(1Re ),q,(
a
a
is
is
F
FZ (D.10)
with s1 = s and a1 = a the fraction between brackets can be written as a sum of a real and a imaginary part of the fraction. Both parts are presented by equations D.11 and D.12 respectively:
( )( ) ( )22
22
22
qexpcossinqcos2
qexp21
qexp1part Real
sass
−+φθ
−−
−−= (D.11)
( )
( ) ( )2222
22
qexpcossinqcos2
qexp21
cossinqsin2
qexp2
partImaginary sas
asi
−+φθ
−−
φθ
−⋅⋅−
= (D.12)
Thus the equation for Z1(q,θ,φ) can be written as:
( )( ) ( )22
22
22
1
qexpcossinqcos2
qexp21
qexp1),q,(
sassZ
−+φθ
−−
−−=φθ (D.13)
The two other components of Z(q) are derived in a similar way. Using equations D.3 through
D.8 the equations of the second and third component were derived:
( )( ) ( )22
22
22
2
qexpcossinqcos2
qexp21
qexp1),q,(
sassZ
−+φθ
−−
−−=φθ (D.14)
( )( ) ( )22
22
22
3
qexpcosqcos2
qexp21
qexp1),q,(
sassZ
−+θ
−−
−−=φθ (D.15)
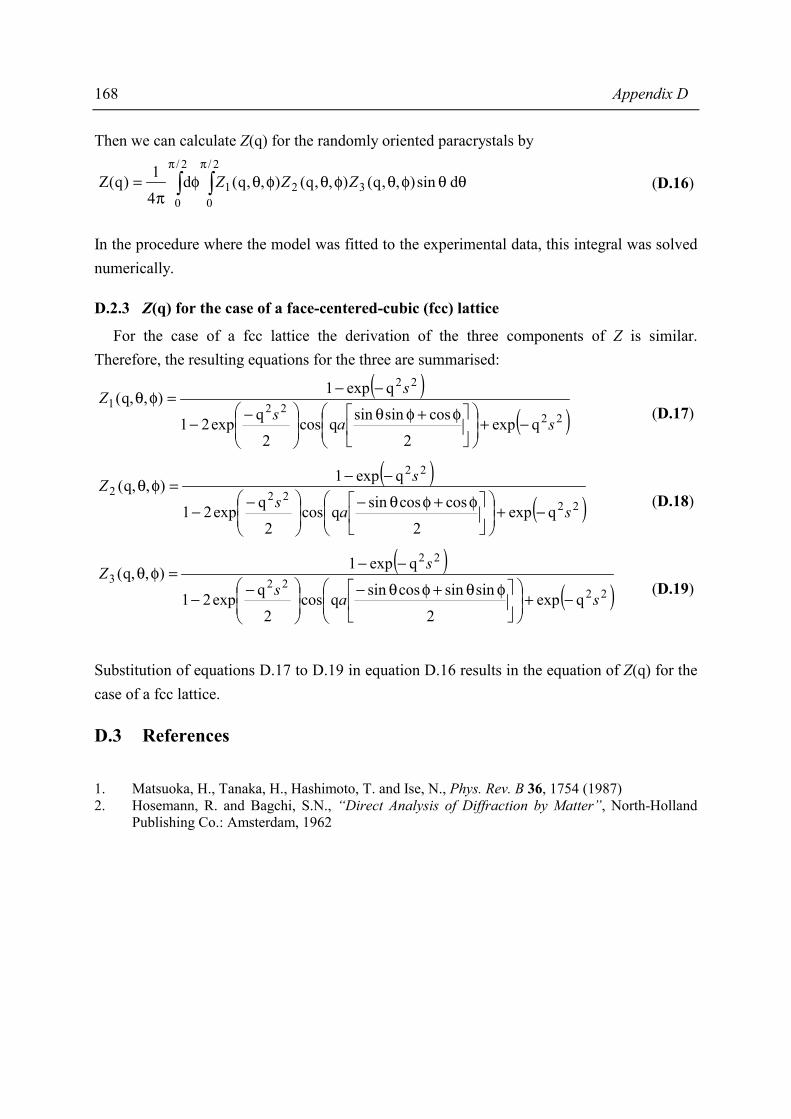
168 Appendix D
Then we can calculate Z(q) for the randomly oriented paracrystals by
∫∫ππ
θθφθφθφθφπ
=2/
0321
2/
0
dsin),,q(),,q(),,q(d4
1)q(Z ZZZ (D.16)
In the procedure where the model was fitted to the experimental data, this integral was solved numerically.
D.2.3 Z(q) for the case of a face-centered-cubic (fcc) lattice
For the case of a fcc lattice the derivation of the three components of Z is similar. Therefore, the resulting equations for the three are summarised:
( )( )22
22
22
1
qexp2
cossinsinqcos2
qexp21
qexp1),q,(
sassZ
−+
φ+φθ
−−
−−=φθ (D.17)
( )( )22
22
22
2
qexp2
coscossinqcos2
qexp21
qexp1),q,(
sassZ
−+
φ+φθ−
−−
−−=φθ (D.18)
( )( )22
22
22
3
qexp2
sinsincossinqcos2
qexp21
qexp1),q,(
sassZ
−+
φθ+φθ−
−−
−−=φθ (D.19)
Substitution of equations D.17 to D.19 in equation D.16 results in the equation of Z(q) for the case of a fcc lattice.
D.3 References 1. Matsuoka, H., Tanaka, H., Hashimoto, T. and Ise, N., Phys. Rev. B 36, 1754 (1987) 2. Hosemann, R. and Bagchi, S.N., “Direct Analysis of Diffraction by Matter”, North-Holland
Publishing Co.: Amsterdam, 1962
Appendix E
Mechanical properties of MAn-g-EPM based ionomers
E.1 Introduction In Chapter 7 the macroscopic properties of the ionomers based on MAn-g-EPM were discussed. For clarity reasons not all results were presented. To give an example, the variation in degree of neutralisation was present in all other variations (DG, type of cation and molecular weight of the parent EPM). To give an idea about the trends that were observed a suitable example was given. This appendix presents an overview of the complete data of the mechanical properties of the ionomers.
E.2 Experimental Tensile Testing Tensile tests were performed on a Zwick 1474 tensile tester in a conditioned laboratory at a temperature of 23°C. Due to the limited amounts of ionomer available a special die deviating from the norm was used for the preparation of the dumbbell specimens. The stress was measured as a function of elongation at a constant elongation speed of 500 mm·min-1. From the stress-strain curve the tensile strength (TS), elongation at break (EB) and the strength at lower elongation were determined according to ASTM D 412-92. A pre-load of 0.1N was applied to set zero length and stress. Compression Set (CS) Cylindrical test pieces are compressed between two parallel plates during 22 hours at 23°C or at 70°C with a linear deformation of 25%. The compression set (or permanent set) is determined after a relaxation time without deformation of half an hour at ambient temperature according to ASTM D 395, method B. Shore-Hardness The hardness of the materials was tested according to ASTM D 2240-91 and is expressed in Shore A units.
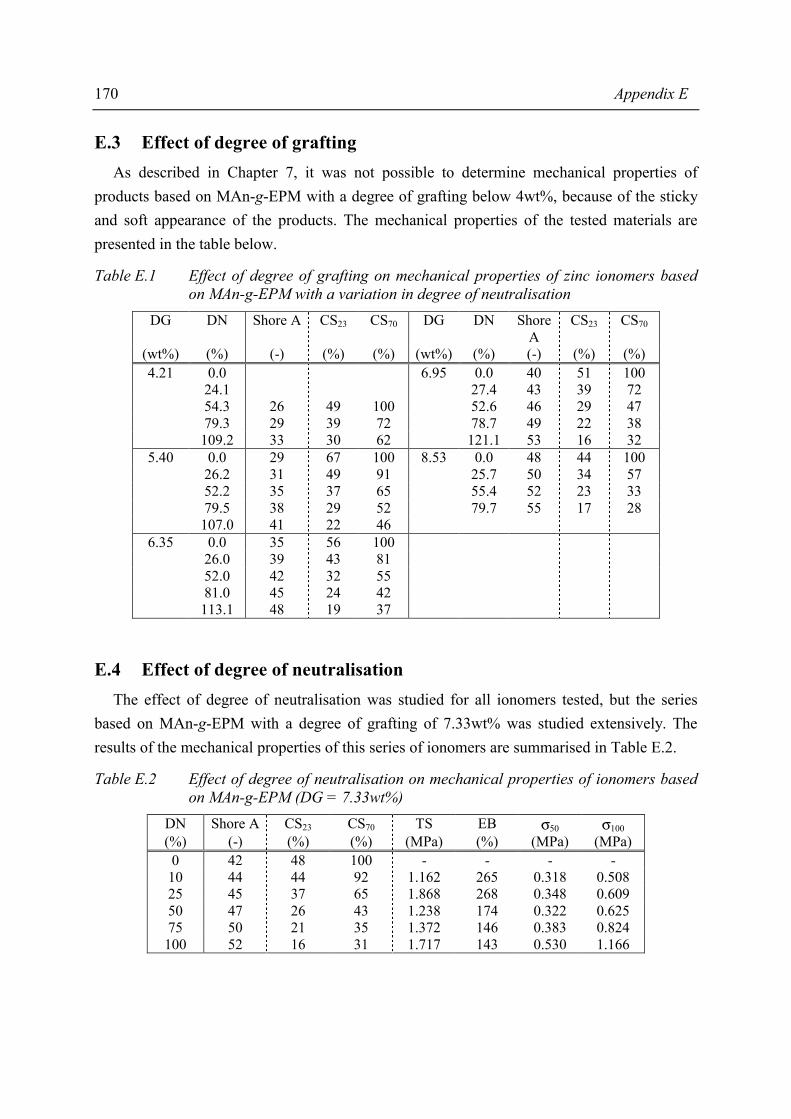
170 Appendix E
E.3 Effect of degree of grafting As described in Chapter 7, it was not possible to determine mechanical properties of products based on MAn-g-EPM with a degree of grafting below 4wt%, because of the sticky and soft appearance of the products. The mechanical properties of the tested materials are presented in the table below.
Table E.1 Effect of degree of grafting on mechanical properties of zinc ionomers based on MAn-g-EPM with a variation in degree of neutralisation
DG DN Shore A CS23 CS70 DG DN Shore A
CS23 CS70
(wt%) (%) (-) (%) (%) (wt%) (%) (-) (%) (%) 4.21 0.0 6.95 0.0 40 51 100
24.1 27.4 43 39 72 54.3 26 49 100 52.6 46 29 47 79.3 29 39 72 78.7 49 22 38 109.2 33 30 62 121.1 53 16 32
5.40 0.0 29 67 100 8.53 0.0 48 44 100 26.2 31 49 91 25.7 50 34 57 52.2 35 37 65 55.4 52 23 33 79.5 38 29 52 79.7 55 17 28 107.0 41 22 46
6.35 0.0 35 56 100 26.0 39 43 81 52.0 42 32 55 81.0 45 24 42 113.1 48 19 37
E.4 Effect of degree of neutralisation The effect of degree of neutralisation was studied for all ionomers tested, but the series based on MAn-g-EPM with a degree of grafting of 7.33wt% was studied extensively. The results of the mechanical properties of this series of ionomers are summarised in Table E.2.
Table E.2 Effect of degree of neutralisation on mechanical properties of ionomers based on MAn-g-EPM (DG = 7.33wt%)
DN Shore A CS23 CS70 TS EB σ50 σ100 (%) (-) (%) (%) (MPa) (%) (MPa) (MPa) 0 42 48 100 - - - - 10 44 44 92 1.162 265 0.318 0.508 25 45 37 65 1.868 268 0.348 0.609 50 47 26 43 1.238 174 0.322 0.625 75 50 21 35 1.372 146 0.383 0.824
100 52 16 31 1.717 143 0.530 1.166
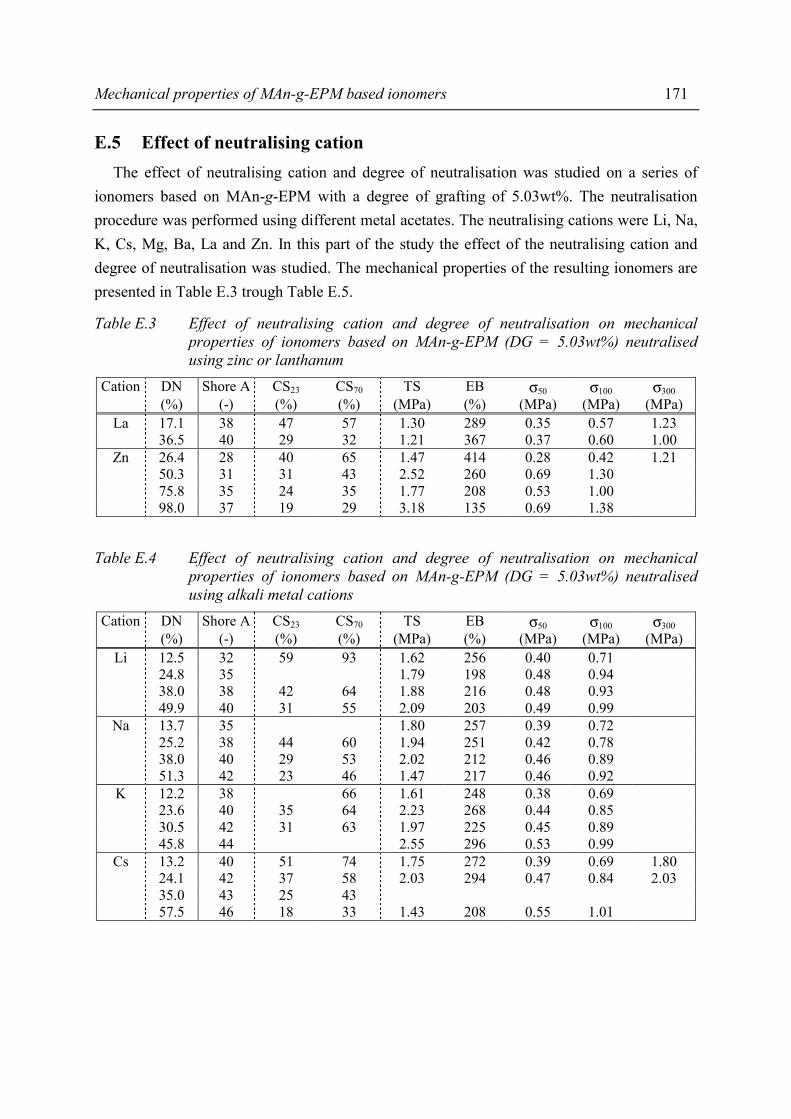
Mechanical properties of MAn-g-EPM based ionomers 171
E.5 Effect of neutralising cation The effect of neutralising cation and degree of neutralisation was studied on a series of ionomers based on MAn-g-EPM with a degree of grafting of 5.03wt%. The neutralisation procedure was performed using different metal acetates. The neutralising cations were Li, Na, K, Cs, Mg, Ba, La and Zn. In this part of the study the effect of the neutralising cation and degree of neutralisation was studied. The mechanical properties of the resulting ionomers are presented in Table E.3 trough Table E.5.
Table E.3 Effect of neutralising cation and degree of neutralisation on mechanical properties of ionomers based on MAn-g-EPM (DG = 5.03wt%) neutralised using zinc or lanthanum
Cation DN Shore A CS23 CS70 TS EB σ50 σ100 σ300 (%) (-) (%) (%) (MPa) (%) (MPa) (MPa) (MPa)
La 17.1 38 47 57 1.30 289 0.35 0.57 1.23 36.5 40 29 32 1.21 367 0.37 0.60 1.00
Zn 26.4 28 40 65 1.47 414 0.28 0.42 1.21 50.3 31 31 43 2.52 260 0.69 1.30 75.8 35 24 35 1.77 208 0.53 1.00 98.0 37 19 29 3.18 135 0.69 1.38
Table E.4 Effect of neutralising cation and degree of neutralisation on mechanical properties of ionomers based on MAn-g-EPM (DG = 5.03wt%) neutralised using alkali metal cations
Cation DN Shore A CS23 CS70 TS EB σ50 σ100 σ300 (%) (-) (%) (%) (MPa) (%) (MPa) (MPa) (MPa)
Li 12.5 32 59 93 1.62 256 0.40 0.71 24.8 35 1.79 198 0.48 0.94 38.0 38 42 64 1.88 216 0.48 0.93 49.9 40 31 55 2.09 203 0.49 0.99
Na 13.7 35 1.80 257 0.39 0.72 25.2 38 44 60 1.94 251 0.42 0.78 38.0 40 29 53 2.02 212 0.46 0.89 51.3 42 23 46 1.47 217 0.46 0.92
K 12.2 38 66 1.61 248 0.38 0.69 23.6 40 35 64 2.23 268 0.44 0.85 30.5 42 31 63 1.97 225 0.45 0.89 45.8 44 2.55 296 0.53 0.99
Cs 13.2 40 51 74 1.75 272 0.39 0.69 1.80 24.1 42 37 58 2.03 294 0.47 0.84 2.03 35.0 43 25 43 57.5 46 18 33 1.43 208 0.55 1.01
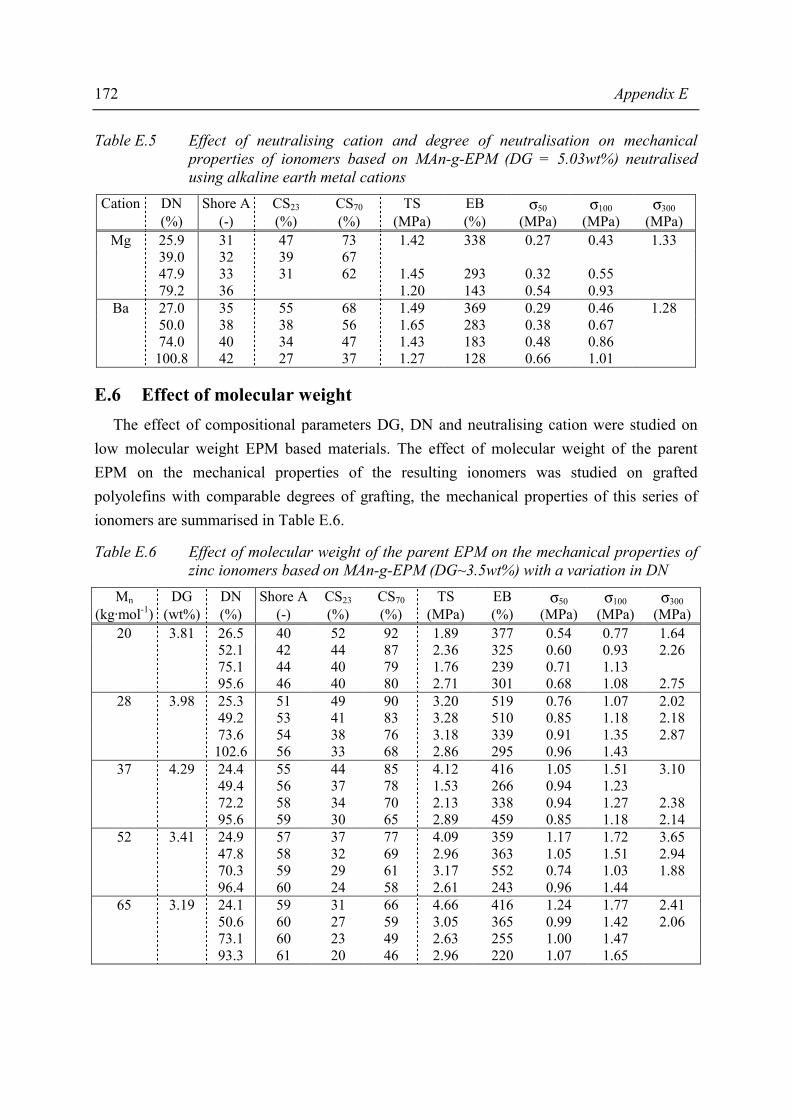
172 Appendix E
Table E.5 Effect of neutralising cation and degree of neutralisation on mechanical properties of ionomers based on MAn-g-EPM (DG = 5.03wt%) neutralised using alkaline earth metal cations
Cation DN Shore A CS23 CS70 TS EB σ50 σ100 σ300 (%) (-) (%) (%) (MPa) (%) (MPa) (MPa) (MPa)
Mg 25.9 31 47 73 1.42 338 0.27 0.43 1.33 39.0 32 39 67 47.9 33 31 62 1.45 293 0.32 0.55 79.2 36 1.20 143 0.54 0.93
Ba 27.0 35 55 68 1.49 369 0.29 0.46 1.28 50.0 38 38 56 1.65 283 0.38 0.67 74.0 40 34 47 1.43 183 0.48 0.86 100.8 42 27 37 1.27 128 0.66 1.01
E.6 Effect of molecular weight The effect of compositional parameters DG, DN and neutralising cation were studied on low molecular weight EPM based materials. The effect of molecular weight of the parent EPM on the mechanical properties of the resulting ionomers was studied on grafted polyolefins with comparable degrees of grafting, the mechanical properties of this series of ionomers are summarised in Table E.6.
Table E.6 Effect of molecular weight of the parent EPM on the mechanical properties of zinc ionomers based on MAn-g-EPM (DG~3.5wt%) with a variation in DN
Mn DG DN Shore A CS23 CS70 TS EB σ50 σ100 σ300 (kg·mol-1) (wt%) (%) (-) (%) (%) (MPa) (%) (MPa) (MPa) (MPa)
20 3.81 26.5 40 52 92 1.89 377 0.54 0.77 1.64 52.1 42 44 87 2.36 325 0.60 0.93 2.26 75.1 44 40 79 1.76 239 0.71 1.13 95.6 46 40 80 2.71 301 0.68 1.08 2.75
28 3.98 25.3 51 49 90 3.20 519 0.76 1.07 2.02 49.2 53 41 83 3.28 510 0.85 1.18 2.18 73.6 54 38 76 3.18 339 0.91 1.35 2.87 102.6 56 33 68 2.86 295 0.96 1.43
37 4.29 24.4 55 44 85 4.12 416 1.05 1.51 3.10 49.4 56 37 78 1.53 266 0.94 1.23 72.2 58 34 70 2.13 338 0.94 1.27 2.38 95.6 59 30 65 2.89 459 0.85 1.18 2.14
52 3.41 24.9 57 37 77 4.09 359 1.17 1.72 3.65 47.8 58 32 69 2.96 363 1.05 1.51 2.94 70.3 59 29 61 3.17 552 0.74 1.03 1.88 96.4 60 24 58 2.61 243 0.96 1.44
65 3.19 24.1 59 31 66 4.66 416 1.24 1.77 2.41 50.6 60 27 59 3.05 365 0.99 1.42 2.06 73.1 60 23 49 2.63 255 1.00 1.47 93.3 61 20 46 2.96 220 1.07 1.65
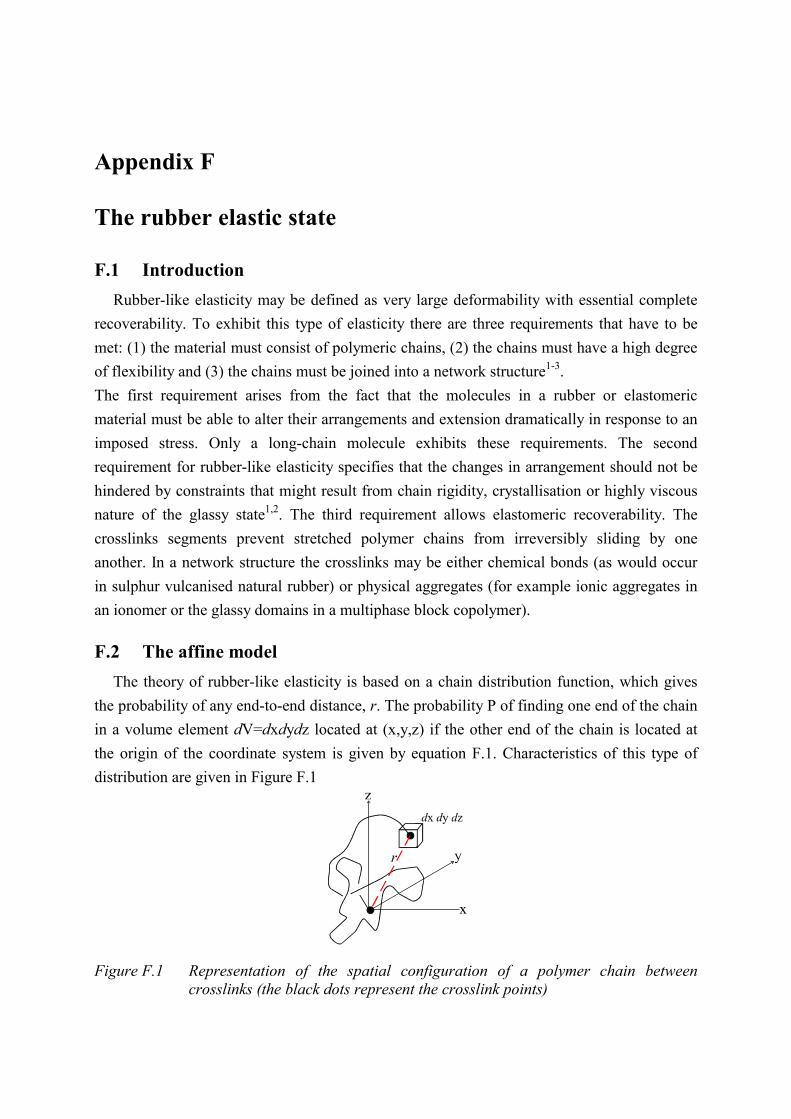
Appendix F
The rubber elastic state
F.1 Introduction Rubber-like elasticity may be defined as very large deformability with essential complete recoverability. To exhibit this type of elasticity there are three requirements that have to be met: (1) the material must consist of polymeric chains, (2) the chains must have a high degree of flexibility and (3) the chains must be joined into a network structure1-3. The first requirement arises from the fact that the molecules in a rubber or elastomeric material must be able to alter their arrangements and extension dramatically in response to an imposed stress. Only a long-chain molecule exhibits these requirements. The second requirement for rubber-like elasticity specifies that the changes in arrangement should not be hindered by constraints that might result from chain rigidity, crystallisation or highly viscous nature of the glassy state1,2. The third requirement allows elastomeric recoverability. The crosslinks segments prevent stretched polymer chains from irreversibly sliding by one another. In a network structure the crosslinks may be either chemical bonds (as would occur in sulphur vulcanised natural rubber) or physical aggregates (for example ionic aggregates in an ionomer or the glassy domains in a multiphase block copolymer).
F.2 The affine model The theory of rubber-like elasticity is based on a chain distribution function, which gives the probability of any end-to-end distance, r. The probability P of finding one end of the chain in a volume element dV=dxdydz located at (x,y,z) if the other end of the chain is located at the origin of the coordinate system is given by equation F.1. Characteristics of this type of distribution are given in Figure F.1
Figure F.1 Representation of the spatial configuration of a polymer chain between crosslinks (the black dots represent the crosslink points)

174 Appendix F
The simplest theories of rubber-like elasticity are based on the Gaussian distribution function for the end-to-end distance in the network:1-3
><++−
><π=
02
22223
02 2
)zyx(3exp2
3)z,y,x(Prr
(F.1)
The Gaussian distribution function that contains the term <r2>0, the average squared end-to-end distance, is applied to the network chains in both the stretched and unstretched states. The number of conformations is then equal to
)z,y,x(P)z,y,x(Z ⋅Ω= (F.2)
where Ω is the total number of conformations available to the chain. The entropy of the polymer chain can be calculated from
ZlnS k= (F.3) where k is the Boltzmann constant Thus the entropy of the chain as depicted in Figure F.1 is given by
( )222
020 zyx
23Sz)y,S(x, ++
><−=
rk (F.4)
Consider now the stretching of a single chain with deformation ratios λx, λy and λz. The entropy in the undeformed state is then given by
( )
++
><−= 222
020u zyx
23SSrk (F.5)
The entropy in the deformed state can be calculated from
( )
λ+λ+λ
><−= 22
z22
y22
x0
20d zyx2
3SSrk (F.6)
The change in entropy upon deformation is then given by
( ) ( )[ ]222222
rk zyxzyx
23SSS 2
z2y
2x
02ud ++−λ+λ+λ
><−=−=∆ (F.7)
The rubber elastic state 175
Because the elastic response is essentially intramolecular1-3 the entropy change for ν network chains is just ν times the result from equation (F.7)
( ) ( ) ( )[ ]><−λ+><−λ+><−λ
><ν−=∆ 222
rk z1y1x1
23S 2
z2y
2x
02 (F.8)
In equation (F.8), <x2> specifies the average value of x when averaged over ν chains. The displacements of the crosslinks are assumed to be affine (linear) on the strain applied. In this case the deformation ratios (λx, λy and λz) are obtained directly from the dimensions of the sample in the strained state (Lx, Ly and Lz) and in the unstrained state (Lxu, Lyu and Lzu):
xu
xx L
L=λ
yu
yy L
L=λ
zu
zz L
L=λ (F.9)
The dimensions of the crosslinked chains in the undeformed state are given by:
><+><+><=>< 2222 zyxr i (F.10) The isotropy of the undeformed state requires that the average values of x2, y2 and z2 are the same:
><>=<>=< 222 zyx (F.11) Thus, the chain dimensions are given by:
><>=<>=<=>< 2222 z3y3x3r i (F.12) In the simplest theories it is assumed that <r2>i equals <r2>0, that is when the chain dimensions of the uncrosslinked chains are not changed by the presence of crosslinks. And equation (F.8) reduces to:
( )32
S 2z
2y
2x −λ+λ+λ
ν−=∆ k (F.13)
Equation (F.8) is the basis of the theories of rubber-like elasticity theories and can be used to obtain elastic equations of state for any type of deformation1-3.

176 Appendix F
Application of the affine model for the case of elongation The application of the theory is best illustrated for the case of elongation, which is the type of deformation used in majority of experimental studies. This deformation occurs at essentially constant volume, and thus, a network stretched by the amount λx = λ > 1 would have its perpendicular dimensions compressed by λy = λz = λ-1/2 < 1. Thus the change in entropy for elongation of a rubber strip is given by
( )322
S 12 −λ+λ
ν−=∆ −k (F.14)
The number of elastically effective network chains per unit volume (ν/V) equals ρNAv/Mc with Mc is the average molecular weight of the elastically effective network chain. Thus equation F.14 can be rewritten as follows
( )32M2
VNS 12
c
Av −λ+λ
ρ−=∆ −k
(F.15)
The force required for a deformation λ is then obtained from the differentiation of the Gibbs free energy:
T,pT,pT,p
STHGFλ
−λ
=λ
=dd
dd
dd (F.16)
In elastic networks the entropic changes dominate the mechanical response rather than the changes in internal energy. This is because the response of the rubber strip to loads largely depends on the changes in conformations of the chains. If the energetic contribution is neglected, thus assuming that the rubber strip exhibits an ‘ideal’ behaviour, the entropic term of equation F.16 is the force required for extension of the rubber strip. Thus
( )2
uc
Av
T,p LMVNTSTF −λ−λ⋅
⋅ρ
=λ
−=k
dd (F.17)
The true stress is then obtained by dividing both sides of equation by A, the cross-sectional area of the sample with length L.
( )12
c
Avtrue M
NT −λ−λ⋅ρ
=σk
(F.18)
F.3 References 1. Flory, P.J., Principles of Polymer Chemistry, Ithaca NY: Cornell University Press, 1953 2. Treloar, L.R.G., The Physics of Rubber Elasticity, 2nd ed., Oxford: Clarendon Press, 1958 3. Mark, J.E., J. Chem. Ed. 58, 898 (1981)
Samenvatting Het kenmerk van thermoplastische elastomeren (TPEs) is de combinatie van goede mechanische eigenschappen en verwerkbaarheid. De mechanische eigenschappen van TPEs bij kamertemperatuur zijn grotendeels vergelijkbaar met die van conventioneel vernette elastomeren maar ze hebben de goede verwerkbaarheid van thermoplasten bij verhoogde temperatuur. Bijkomende voordelen zijn de eenvoudige verwerkbaarheid van TPEs door middel van relatief goedkope conventionele plastic verwerkende apparatuur en het ontbreken van de vulcanisatie stap in vergelijk met conventionele vernette elastomeren. Ionomeren zijn polymere materialen met hydrofobe organische ketens waaraan een klein gehalte ionische groepen is gebonden. Door de thermoreversibele binding van de ionische groepen zijn ionomeren potentieel interessante TPEs. Ionomeren worden voornamelijk gesynthetiseerd door co-polymerisatie van functionele monomeren met onverzadigde monomeren. Op dit moment is er slechts één ionomeer commercieel beschikbaar, nl. Surlyn®, een semi-kristallijne thermoplast gebaseerd op een random co-polymeer van etheen en methacrylzuur, dat gedeeltelijk geneutraliseerd is tot een zink- of natrium zout. De sterk polaire zout groepen verenigen zich in kleine clusters, die kunnen optreden als tijdelijke vernettingspunten bij kamertemperatuur, maar die voldoende verweken bij verhoogde temperatuur om thermoplastische verwerking mogelijk te maken. In het verleden zijn er pogingen gedaan om dit ionomere principe toe te passen om thermoplastische elastomeren te produceren, i.e. introductie van thermo-reversibele vernettingspunten die actief zijn bij kamertemperatuur en toch thermoplastische verwerking toestaan. Echter, de uitgangsmaterialen waarvan deze ionomeren gemaakt waren, zijn polymeren met conventioneel hoog molecuulgewicht. Blijkbaar heeft dit een slechte verwerkbaarheid tot gevolg; grote hoeveelheden van specifieke weekmakers (die afbreuk doen aan de mechanische eigenschappen) werden geïntroduceerd om een acceptabele verwerkbaarheid te verkrijgen. De combinatie van thermo-reversibele vernettingspunten gebaseerd op ionische interacties en het gebruik van een elastomeer met een laag molecuulgewicht is de basis van deze studie naar een ionomeer TPE. Om dit doel te bereiken werd maleïnezuuranhydride (MAn) geënt aan een etheen-propeen co-polymeer (EPM) om zo het uitgangsmateriaal van het ionomeer (MAn-g-EPM) te verkrijgen. De anhydride functionaliteit in het uitgangsmateriaal werd gehydrolyseerd en vervolgens gedeeltelijk geneutraliseerd met een geschikte base. Het effect van de samenstelling van het uitgangsmateriaal (de entgraad en het molecuul gewicht van het gebruikte EPM), de neutralisatiegraad en het type tegenion op de morfologie, mechanische eigenschappen en verwerkbaarheid van de ionomere TPE zijn onderwerp van de studie.
178 Samenvatting
Bovendien is de morfologie van de verkregen materialen bestudeerd met als doel deze te relateren aan de gemeten praktische eigenschappen. Ionomeer bereiding bestaat uit twee stappen: (1) de synthese van het uitgangsmateriaal voor het ionomeer en (2) de neutralisatie van de functionele groepen die aanwezig zijn in het uitgangsmateriaal. In deze studie is het uitgangsmateriaal voor het ionomeer verkregen door het enten van MAn aan de EPM keten. Enten van MAn kan worden uitgevoerd in de polymere smelt of in oplossing. Daar gebleken dat de eerstgenoemde route leidt tot onvoldoend hoge entgraden, is de tweede route gekozen voor deze studie. Optimalisatie van het enten in oplossing resulteerde in een algemeen recept dat gebruikt kan worden om een serie van uitgangsmaterialen met variabele en voldoende hoge entgraden te verkrijgen. Welliswaar heeft deze studie uitgewezen dat het MAn en het peroxide geconsumeerd werden in zijreacties, zoals het enten van MAn aan oplosmiddel, en dus leidde tot een afname van de ent-efficiëntie van MAn aan EPM. De tweede stap ter verkrijging van een ionomeer, de neutralisatie, kan eveneens worden uitgevoerd in een polymere smelt of in oplossing. In deze studie werden de uitgangsmaterialen voor de ionomeren geneutraliseerd in oplossing. De neutralisatie reactie in oplossing bleek een stoichiometrische reactie te zijn. Gedetailleerde kennis van de morfologie van de verschillende ionomeren zou helpen bij de begripsvorming van de relatie tussen de samenstelling en de eigenschappen. Het is algemeen geaccepteerd dat de ionische groepen van de ionomeren kleine aggregaten vormen in een apolaire koolwaterstof matrix. Deze aggregaten dienen als verstrooiende centra voor invallende Röntgenstralen. Kleine-hoek Röntgen verstrooiing (SAXS) bleek de beste karakteriseringstechniek te zijn voor de ionomere morfologie. Combinatie van de gemeten SAXS data met een geschikte morfologische modelvoorstelling resulteerde in informatie over de grootte, het aantal en de samenstelling van de ionische aggregaten. De beste morfologische modelvoorstelling bleek een model te zijn waarbij de ionische aggregaten worden voorgesteld als bollen van hoge elektronen dichtheid in een koolwaterstof matrix van lage elektronendichtheid. Als gevolg van sterische hindering zal de koolwaterstof schil grotendeels geïmmobiliseerd zijn. De ‘ionische bollen’ hebben een vloeistof-achtige pakking en hebben een minimale naderingsafstand als gevolg de aanwezigheid van een koolwaterstof laag rondom het aggregaat. Uit de meetresultaten bleek dat het aantal polaire groepen in een ionisch aggregaat redelijk groot is, nl. tussen 100 and 500, veel hogere aantallen dan in de literatuur gevonden zijn voor andere typen ionomeren.
Samenvatting 179
Variatie van de samenstelling van het uitgangsmateriaal (entgraad en molecuulgewicht van het EPM) beïnvloeden de grootte, het aantal en de samenstelling van de aggregaten in het uiteindelijke materiaal. Het was opmerkelijk om waar te nemen dat het uitgangsmateriaal ook al een verstrooiingsprofiel vertoonde vergelijkbaar met dat van de ionomeren. Dit betekent dus dat ook het niet geneutraliseerde materiaal reeds aggregaten bevat. Uit de variatie van de entgraad is gebleken dat er een kritische concentratie van geënt MAn bestaat waarboven aggregatie van de polaire groepen plaats vindt. Door combinatie van resultaten van SAXS en vaste stof NMR werd geconcludeerd dat de aggregaten kunnen worden beschouwd als starre domeinen in een beweeglijke matrix en dat de aggregaten, naast de ionische groepen, ook geïmmobiliseerde EPM ketenfragmenten bevatten. De aanwezigheid van ionische aggregaten, die optreden als (thermo-reversibele) vernettingspunten, veranderen de eigenschappen van uiteindelijke materialen sterk. Uit sol-gel analyse blijkt dat het ionische netwerk van de op MAn-g-EPM gebaseerde ionomeren nogal sterk is. In sommige gevallen blijft het netwerk gedeeltelijk intact, zelfs bij de extreme condities van extractie. Een neutralisatiegraad van 50% moet worden overschreden om een netwerk te verkrijgen met aanzienlijk gelgehalte, onafhankelijk van de entgraad en het type tegenion of het molecuulgewicht van het gebruikte EPM. De studie van de mechanische eigenschappen en smelt-verwerkbaarheid onthulde dat de op MAn-g-EPM gebaseerde ionomeren goede mechanische eigenschappen en een acceptabele smelt-viscositeit bezitten. Het bleek dat de samenstelling van de ionomeren deze eigenschappen beïnvloeden. Een aanzienlijke toename in smeltviscositeit bleek één van de meest uitgesproken effecten van neutralisatie te zijn. Uit de capillair reologische metingen werd duidelijk dat de ionische interactie nogal sterk was. De belangrijkste mechanische eigenschappen zoals treksterkte, hardheid en compressie-set werden bestudeerd als een functie van de samenstelling van het ionomeer. Beneden een kritische entgraad (5gew%) was de bepaling van deze eigenschappen niet mogelijk. De materialen waren te zacht en te plakkerig. Toename van de neutralisatie- en/of entgraad resulteerde in een toename van de smeltviscositeit, treksterkte, hardheid en een afname van de rek bij breuk en de compressie-set. De resultaten van de verschillende karakterisering- en test-methoden voor mechanische eigenschappen onthulde dat de structuur-eigenschap-relatie nogal complex is voor de bestudeerde ionomeren. Doorgaans, in het geval van covalente netwerken, zijn de eigenschappen gerelateerd aan de netwerkdichtheid. Echter, het ionomere netwerk is erg complex en simpele verklaringen zijn niet mogelijk, aangezien niet alleen het aantal verknopingspunten, i.e. de ionische aggregaten, maar ook de sterkte van het verknopingspunt een functie van de ionomeren samenstelling is. In het algemeen werd waargenomen dat zowel
180 Samenvatting
de sterkte van de anion-cation interactie in het ionische aggregaat en de volume-fractie van ionische aggregaten de mechanische eigenschappen van de ionomeren bepalen. Water-absorptie metingen lieten zien dat verschillende ionomeren nogal hydrofiel waren. Aangezien de grootte van de ionische aggregaten aanzienlijk toenam met de water absorptie, werd geconcludeerd dat het water bij voorkeur in de ionische aggregaten verblijft. De hoeveelheid geabsorbeerd water is sterk afhankelijk van het type tegenion. Vergeleken met aard-alkali of zink ionomeren, absorberen de alkali geneutraliseerde ionomeren het meeste water. De zink ionomeren absorberen het minste water. Positionering van de meest belovende producten uit deze studie tussen bestaande, commerciële TPEs is moeilijk omdat de in commerciële brochures veel relevante eigenschappen niet worden vermeld. Data van de compressie-set van die produkten ontbreken helaas in veel gevallen. Met name de compressie-set is een belangrijke parameter om de kwaliteit van het vernette elastomeer (rubber) te bepalen. Uit de gegevens van in de literatuur beschreven vergelijkbare TPEs blijkt dat de eigenschappen aanzienlijk verbeterd worden door blenden met additieven en/of andere polymeren. Een toekomstige produkt optimalisering moet dan ook, naast de variatie van entgraad, neutralisatiegraad en de variatie van molecuul gewicht van het polyolefine, als toevoeging de effecten van versterkende vulstoffen of anderen additieven bevatten.
Dankwoord Deze bladzijden zijn gereserveerd om iedereen te bedanken die een bijdrage hebben geleverd aan het behaalde resultaat.
In de eerste plaats wil ik prof. Binsbergen en prof. Lemstra bedanken voor de geboden mogelijkheid om als AiO in dienst van de Technische Universiteit Eindhoven het promotieonderzoek te verrichten dat grotendeels in dit proefschrift beschreven staat.
Gedurende de eerste fase van het onderzoek hebben Jelle Terpsma, Toine Moors en Elmer Lie bijgedragen aan het uiteindelijke resultaat in de vorm van hun afstudeeropdracht. Al is er niet veel van jullie resultaten terug te vinden in dit proefschrift, het is voor mij niet minder waardevol geweest! Zo is vlak na de start van het promotieonderzoek dankzij het afstudeerwerk van Jelle een keuze gemaakt met betrekking tot de samenstelling van het uiteindelijk gebruikte polyolefine. De titratie procedure is geoptimaliseerd tijdens het afstudeerwerk van Toine. Het verhogen van het rendement van het enten van MAn in de polymere smelt is onderzocht door Elmer. Ondanks alle inspanningen die zijn verricht bleek dat het niet mogelijk was om de entgraad voldoende hoog te krijgen om met de verkregen materialen ionomeren te maken.
Eind 1997 was dan eindelijk de volgende stap aan de orde: het maken van de ionomeren. Dit bleek niet zo complex te zijn, in tegenstelling tot de karakterisering van de uiteindelijke materialen. Dankzij het intensieve contact met Herman Dikland en Martin van Duin (beiden DSM Research, Geleen) is een en ander gerealiseerd. Herman & Martin hartelijk dank voor de leerzame discussies.
De SAXS analyse van de ionomeren was een spannende tijd. Bij deze wil ik ook Han Goossens en Ilse van Casteren bedanken, jullie hebben mij in Daresbury steeds weer weten te overtuigen dat het in die 20 uur toch allemaal te meten zou zijn. Ook voor het omzetten van de ruwe data naar bruikbare bestanden wil ik Han hartelijk danken.
De waarde van vaste stof NMR experimenten was al duidelijk geworden tijdens een reeks experimenten in Eindhoven. Maar ondanks verschillende soorten experimenten in samenwerking met Jan de Haan en Pieter Magusin bleek het in Eindhoven niet mogelijk om bij voldoende hoge temperaturen te meten in aanvaardbare meettijd. Vandaar de samenwerking met Victor Litvinov (DSM Research, Geleen), hartelijk dank voor de meettijd bij DSM. Dankzij de NMR exprimenten werd het ‘abstracte’ SAXS model geverifieerd en is het ionomere netwerk duidelijker geworden.
Op dit punt wil ik ook graag Anne Govaert en Dick Klepper hartelijk bedanken voor de inspanningen die verricht zijn op het gebied van de visualisering van de aggregaten in de ionomeren (het waren niet de gemakkelijkste preparaten).

182 Dankwoord
Dankzij de hulp van Paul Steeman en Wilbert Janssen (beiden DSM Research, Geleen) zijn de ionomeren gekarakteriseerd op reologisch gedrag. Leon Govaert en Erik van de Ven ben ik erkentelijk voor de hulp bij de DMTA metingen. Naast DMTA experimenten zijn de ionomeren ook onderworpen aan dielectrische spectroscopie. Hiervoor wil ik prof. van Turnhout en dr. Wubbenhorst hartelijk danken. Al waren de resultaten niet spectaculair, de samenwerking met TU Delft was niet minder leerzaam.
Nadat alle ionomeren waren gekarakteriseerd zijn er nog pogingen gedaan om roet in te mengen. Peter Koets, bedankt voor de hulp op het ‘processing lab’ en dat ik eens mocht ervaren dat het inmengen van roet toch iets speciaals is.
Het zou niet eerlijk zijn om op het gebied van de experimentele ondersteuning het werk van de werkplaats niet te vernoemen. De redders in nood waren vaak te vinden in de werkplaats in de ‘oude CT-hal’ en in de nieuwbouw ‘Suze’s Open Shop’. Suze, zonder jouw creatieve oplossingen was het niet zover gekomen.
Het doen van experimenten is niet altijd even gemakkelijk, maar het schrijven van een proefschrift is iets dat je van te voren niet kan overzien! Frits, Annemiek en Han wil ik bij deze nogmaals hartelijk danken voor het kritisch doorlezen van de verschillende stukken. Het is voor mij niet altijd gemakkelijk geweest om afstand te nemen van dit werk, daarom waren jullie opmerkingen des te waardevoller!
Tenslotte wil ik mijn ouders, Nico-Jan en Paul hartelijk danken voor hun belangstelling en betrokkenheid. Ik weet niet of ik het ooit met zoveel woorden heb gezegd of kunnen uitleggen, maar het was voor mij veel waard! Paul, ook al had ik me voorgenomen om het anders te doen, jouw steun tijdens de periode van schrijven en de rationele benadering van zaken hebben mij erg geholpen. Op dit punt moet ik toch wel eerlijk toegeven dat je het toch vaak bij het rechte eind had!
Curriculum Vitae
Mariëlle Wouters is geboren op 12 maart 1970 te ‘s-Hertogenbosch. In 1987 behaalde zij haar diploma HAVO en in 1989 het diploma Atheneum B aan het Mgr. Zwijsencollege te Veghel. Vervolgens studeerde zij Scheikundige Technologie aan de Technische Universiteit Eindhoven, waar zij in 1995 afstudeerde bij prof.dr. P.J. Lemstra op het onderzoek ‘Ruthenium catalysed ROMP of 7-oxanorbornene derivatives in water’. September 1995 begon zij met haar promotie onderzoek aan dezelfde faculteit en binnen de vakgroep Polymeer en Kunststoftechnologie (TPK, later SKT) onder leiding van prof.dr. F.L. Binsbergen. Het onderzoek werd verricht in samenwerking met DSM Research in Geleen. De belangrijkste resultaten van dit onderzoek staan beschreven in dit proefschrift. Tijdens het promotie onderzoek is de cursus ‘Register Polymeerkundige’, georganiseerd door Polymeertechologie Nederland (PTN), met goed gevolg afgelegd en is de titel RPK behaald.

184