Chapter 5 INSTRUMENTATION FOR Kevin L. McNesby, Ph.D
36
Chapter 5: INSTRUMENTATION FOR BENCH- AND LARGE-SCALE TEST FIXTURES Kevin L. McNesby, Ph.D. U.S. Army Research Laboratory TABLE OF CONTENTS 5.1 Introduction ......................................................................................................................482 5.2 Laser Induced Breakdown Spectroscopy for Measurement of Fire Suppressants...........483 5.3 Tunable Diode Laser Absorption Spectroscopy (TDLAS) for Measurement of Combustion products, Fuels, and Oxygen .......................................................................485 5.3.1 General ..................................................................................................................485 5.3.2 HF ..........................................................................................................................486 5.3.3 Oxygen ..................................................................................................................490 5.3.4 Fuels ......................................................................................................................490 5.3.5 Observations ..........................................................................................................501 5.4 Measurement of Fire Suppressant Concentration Using a Differential Infrared Rapid Agent Concentration Sensor (DIRRACS) .......................................................................502 5.4.1 Introduction ...........................................................................................................502 5.4.2 Original Instrument Design – DIRRACS I ...........................................................502 5.4.3 Improved Hardware Design – DIRRACS II .........................................................505 5.4.4 Data Acquisition and Analysis ..............................................................................507 5.4.5 Calibration Experiments .......................................................................................507 5.4.6 Release Tests of HFC-125 in the TARPF Facility ................................................508 5.4.7 HFC-125 Release Tests in a Bradley Vehicle .......................................................509 5.4.8 Assessment ............................................................................................................513 5.5 Conclusion .......................................................................................................................513 5.6 References ........................................................................................................................514
Transcript of Chapter 5 INSTRUMENTATION FOR Kevin L. McNesby, Ph.D

Chapter 5: INSTRUMENTATION FOR BENCH- AND LARGE-SCALE TEST FIXTURES
Kevin L. McNesby, Ph.D. U.S. Army Research Laboratory
TABLE OF CONTENTS 5.1 Introduction......................................................................................................................482 5.2 Laser Induced Breakdown Spectroscopy for Measurement of Fire Suppressants...........483 5.3 Tunable Diode Laser Absorption Spectroscopy (TDLAS) for Measurement of
Combustion products, Fuels, and Oxygen .......................................................................485 5.3.1 General ..................................................................................................................485 5.3.2 HF..........................................................................................................................486 5.3.3 Oxygen ..................................................................................................................490 5.3.4 Fuels ......................................................................................................................490 5.3.5 Observations..........................................................................................................501
5.4 Measurement of Fire Suppressant Concentration Using a Differential Infrared Rapid Agent Concentration Sensor (DIRRACS) .......................................................................502 5.4.1 Introduction ...........................................................................................................502 5.4.2 Original Instrument Design – DIRRACS I ...........................................................502 5.4.3 Improved Hardware Design – DIRRACS II .........................................................505 5.4.4 Data Acquisition and Analysis ..............................................................................507 5.4.5 Calibration Experiments.......................................................................................507 5.4.6 Release Tests of HFC-125 in the TARPF Facility ................................................508 5.4.7 HFC-125 Release Tests in a Bradley Vehicle .......................................................509 5.4.8 Assessment ............................................................................................................513
5.5 Conclusion .......................................................................................................................513 5.6 References........................................................................................................................514

Instrumentation for Bench- and Large-scale Test Fixtures 482
5.1 INTRODUCTION
A projectile penetrating the hull and fuel cell of a land combat vehicle may result in a fine mist of fuel being dispersed into the crew compartment. By military specification, the ensuing “mist fireball explosion” must be extinguished within 250 ms of detection, using the onboard chemical fire suppression system.1 A similar hazard occurs upon the penetration of a projectile into an aircraft dry bay and adjacent fuel cell. The fire extinguishing agent must be distributed throughout the interior region surrounding the fuel tank and flame extinguishment accomplished within a time interval similar to that for ground vehicles. This speed is necessary to prevent structural damage to the aircraft wing or fuselage to the point where the plane would crash.
Live-fire tests of ground vehicles and aircraft (or representations of sections of these) are frequently conducted in order to characterize the performance of a fire suppression system in quenching such fires. In these tests, it is particularly important to monitor the distribution of the fire suppressant agent in real time. This enables judgment on the extent to which the time to flame extinguishment was limited by the effectiveness of the agent, the agent dispersion system, or both. To obtain the desired information from these very short duration tests, it is necessary to use instrumentation that provides data that are resolved on a time scale shorter than the suppression event, generally in tens of milliseconds.
The instruments currently used for monitoring the concentration of halon 1301 are the Statham analyzer and the Halonyzer.2 Each has a time response on the order of 200 ms or longer. Clearly they are not capable of monitoring the rapid distribution of the agent in a dry bay or crew compartment environment.
There are additional gases whose time-dependent concentrations reflect on the efficacy of the fire suppression process. These include the local oxygen and fuel concentrations, which control the extent of the burning. They also include the concentrations of toxic or corrosive combustion products. Chief among these, for both halon 1301 and most of the halocarbon replacement chemicals, is hydrogen fluoride (HF).3 As various fluorine-containing suppressants emerged, minimization of HF gas production during fire suppression became an important design criterion.4 The extreme reactivity of this gas dictated the additional requirement that the measurement be made in-situ, which, in turn, mandated the use of optical techniques.
The NGP performed research to develop and adapt measurement techniques, apparatus and procedures for real-time, in-situ measurements of combustible gases, combustion by-products, and suppressant concentrations during the quenching of deflagrations in ground vehicles and aircraft.
Each of the techniques was based on the absorption of light from infrared sources: near-infrared tunable diode lasers (NIR-TDL), near infrared pulsed lasers, and resistively-heated coils (or “Nernst” glowers). In the following text, the infrared region of the spectrum is considered to encompass wavelengths from 1 µm to 30 µm. Table 5–1 lists the techniques used, the gases measured, the absorption wavelengths, and the approximate limits of detection (LoD). All LoD values listed are the best achievable laboratory values. Experience indicated that the LoDs in field measurement were at least one order of magnitude worse than in laboratory measurements.
Limited descriptions of the methods appear in the following sections, with more extensive detail available in the references. In each case, the procedure was studied in a laboratory to determine the measurement

Laser Induced Breakdown for Measurement of Fire Suppressants 483
linearity and the limits of detection. Some of the apparatus were then hardened and installed for use on a real-scale test fixture.
Table 5–1. Optical Diagnostics for Fire Species.
Method Molecule Wavelength
(µm) LoD
(µL/L) Tunable Diode Laser Absorption Spectroscopy (TDLAS) HF 1.31 0.04 TDLAS O2 0.76 100 TDLAS CH4 1.65 0.6 TDLAS CO 1.55 5 TDLAS JP-8
DF-2 gasoline
1.71 100
Laser-induced Breakdown Spectroscopy (LIBS) O2 Emission 1000 LIBS CF3Br Emission 1000 LIBS CF3H Emission 1000 Differential Infrared Rapid Concentration Sensor (DIRRACS) C2HF5 8.3 to 9.0 5000
5.2 LASER INDUCED BREAKDOWN SPECTROSCOPY FOR MEASUREMENT OF FIRE SUPPRESSANTS
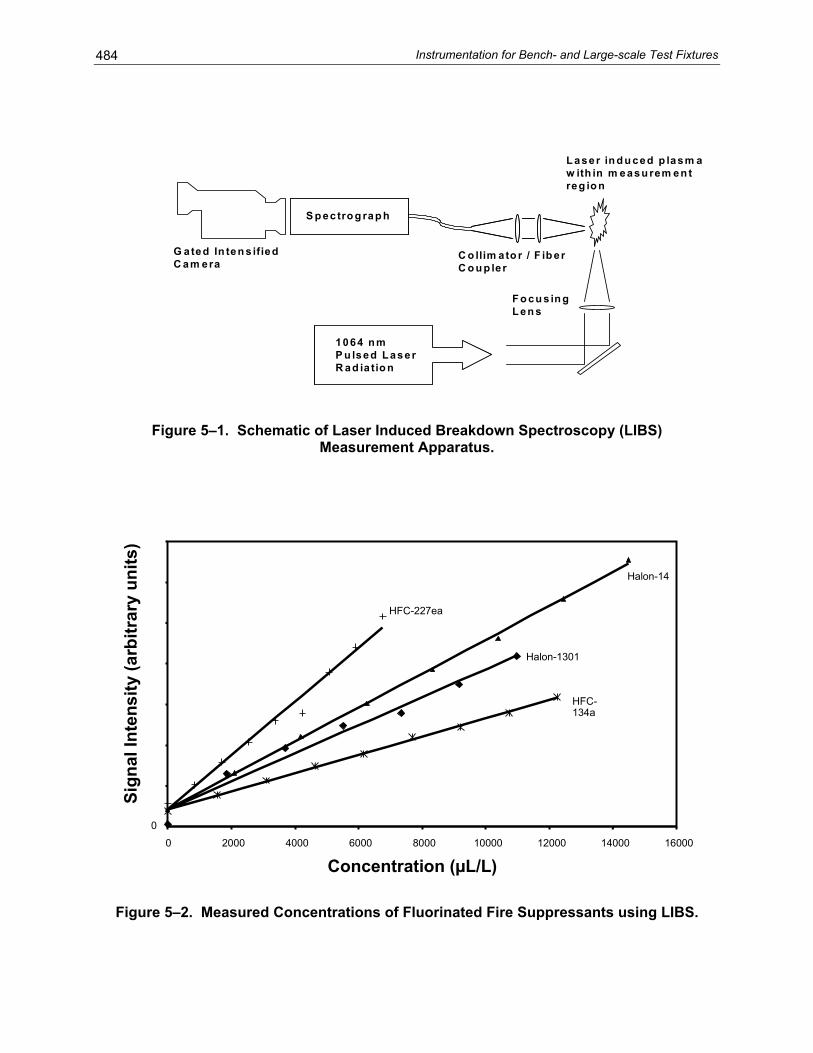
In this technique, a pulsed Nd:YAG laser, typically with pulse energy > 50 mJ, is focused onto a gas mixture with sufficient intensity that molecular breakdown takes place in the focal volume of the laser. The high electric field at the laser focus causes an ionization of a small number of gas molecules (usually air). Free electrons within this plasma then absorb laser radiation (inverse Brehmstrahlung5), resulting in further ionization accompanied by collisional heating. Temperatures within the laser focal volume may reach 20,000 K, resulting in atomization of any molecules within the focal volume. After the laser pulse, rapid deceleration of the electrons within the plasma leads to an initial emission of broadband radiation (Brehmstrahlung5) lasting tens to hundreds of nanoseconds, followed by emission of discrete wavelengths of light as the atomic species present in the plasma return to their ground states (in tens to hundreds of microseconds). A schematic showing the application of LIBS to laboratory measurements is shown in Figure 5–1.
First, the technique was used for measurement of linearity and determination of limits of detection for mixtures of halogenated fire suppressants in air.6,7 Figure 5−2 shows that the intensity of F atom emission near 400 nm, measured using LIBS is nearly directly proportional to vapor concentration. The limit of detection for each gas, using LIBS, was approximately 1000 µL/L. Following these tests, a series of experiments was performed to determine if the LIBS measurement process could initiate combustion in combustible hydrocarbon/air mixtures. Tests were performed on flowing streams of pure methane and pure propane in air. In most cases, the LIBS spark provided sufficient energy to cause the gas mixture to begin burning. Following these tests, it was decided that the LIBS technique was inappropriate for use in enclosed areas that may contain hydrocarbon/air mixtures approaching the lower explosion limit (LEL), and was therefore inappropriate for measurement of oxygen concentrations immediately following fire suppression, when reflash conditions may exist.
Instrumentation for Bench- and Large-scale Test Fixtures 484
1064 nm P u lsed Laser R ad ia tio n
1064 nm P u lsed Laser R ad ia tio n
S p ectro g rap hS p ectro g rap h
G ated In ten s ified C am era
L aser in d u ced p lasm a w ith in m easu rem en t reg io n
F o cu s in g L en s
C o llim ato r / F ib er C o u p ler
Figure 5–1. Schematic of Laser Induced Breakdown Spectroscopy (LIBS)
Measurement Apparatus.
0
0 2000 4000 6000 8000 10000 12000 14000 16000
Concentration (µL/L)
Sign
al In
tens
ity (a
rbitr
ary
units
)
HFC-227ea
Halon-1301
Halon-14
HFC-134a
Figure 5–2. Measured Concentrations of Fluorinated Fire Suppressants using LIBS.

Tunable Diode Laser Absorption Spectoscopy (TDLAS) for Measurement of Combustion Products, Fuels and Oxygen
485
As of the date of this book, laser induced breakdown spectroscopy (LIBS) has not been transitioned to field measurement of suppressant concentrations (in non-flammable environments) in armored vehicles at the Aberdeen Test Center. The main reason for this is that optical fibers necessary for delivering pulsed radiation to the measurement site were found to be unreliable, failing at fewer than 200 shots. However, several manufacturers are now offering fibers for delivering pulsed radiation at 1.06 µm. These high power delivery fibers can transmit a pulse of up to 80 mJ at 10 ns, which may enable LIBS of gases at remote locations.
5.3 TUNABLE DIODE LASER ABSORPTION SPECTROSCOPY (TDLAS) FOR MEASUREMENT OF COMBUSTION PRODUCTS, FUELS, AND OXYGEN
5.3.1 General
In static laboratory environments, a widely used standard method for detection and measurement of gases has been Fourier transform infrared (FTIR) spectroscopy.8 In conventional Fourier transform spectrometers, each “discrete” wavelength of light emitted by the glowbar source, generally a resistively heated tungsten coil, is power modulated by a Michelson interferometer. As a result, the output at any individual wavelength, as measured at the detector, is cosinusoidal, with a frequency in the kHz (acoustic) range. The signal measured at the detector is a superposition of cosinusoidal waveforms called an interferogram. The amplitude and frequency of each cosine wave composing the interferogram is a function of the moving mirror displacement and of the wavelength of the incident light. The measurement interval is ultimately determined by the velocity of the moving mirror, and may only approach 20 ms for a single scan. Spectral resolution is a function of the moving mirror displacement, and gas sensitivities may exceed parts per million. Although highly refined, the net effect of this design is to necessitate complicated electromechanical mirror transport systems, limit measurement applications to repeatable or static events, and thus limit the use of these instruments to the laboratory.
To overcome these limitations for in-situ gas measurement during and following a ballistic event on board a land-based vehicle, NGP researchers at the Army Research Laboratory pursued a solid-state measurement system, while attempting to maintain the sensitivity and broad spectral coverage of interferometer-based infrared spectroscopy. The design criteria for gas detection and measurement employing infrared light sources and detectors were mid-range sensitivity (50 µL/L to 5000 µL/L)9, time for collection of a full spectrum of 10 ms or less, and, in the near infrared, the ability to use low replacement cost optics, optical fibers, and detectors necessary for data sampling in hostile environments. For example, commercially available diode lasers, initially produced for optical communication, began to see use for measurement of HF gas in the early 1980s.10 By 2000, relatively low cost narrow band diode lasers emitting near-infrared radiation (near-infrared tunable diode lasers, NIR-TDL) at wavelengths absorbed by most atmospheric gases and many radical species (e.g., HF gas near a wavelength of 1.3 µm) were commercially available. Use of NIR-TDLs for gas measurement became a widely accepted method for industrial applications.10,11 Wavelength modulation techniques and the ability of inexpensive optical fibers to deliver light to hostile environments allowed sensitive optical components and electronics to be remotely located.
There were significant challenges to be overcome for these NIR-TDLs to become practical. The first involved the ability to measure and store data continuously with a new data point acquired every 10 ms. Secondly, it was unclear how the sensor equipment would perform in the harsh environment for field

Instrumentation for Bench- and Large-scale Test Fixtures 486
testing, in which the sensor assembly in the vehicle was subjected to shock (explosion) and heat (fire). The third involved developing a method that enabled the narrow band light source (the diode laser) to measure a broad band absorber (JP-8 vapor), while maintaining the signal to noise enhancement achievable with phase sensitive detection.12,9
The following sections describe the technique and results for the detection of HF, various fuels, and molecular oxygen.
5.3.2 HF
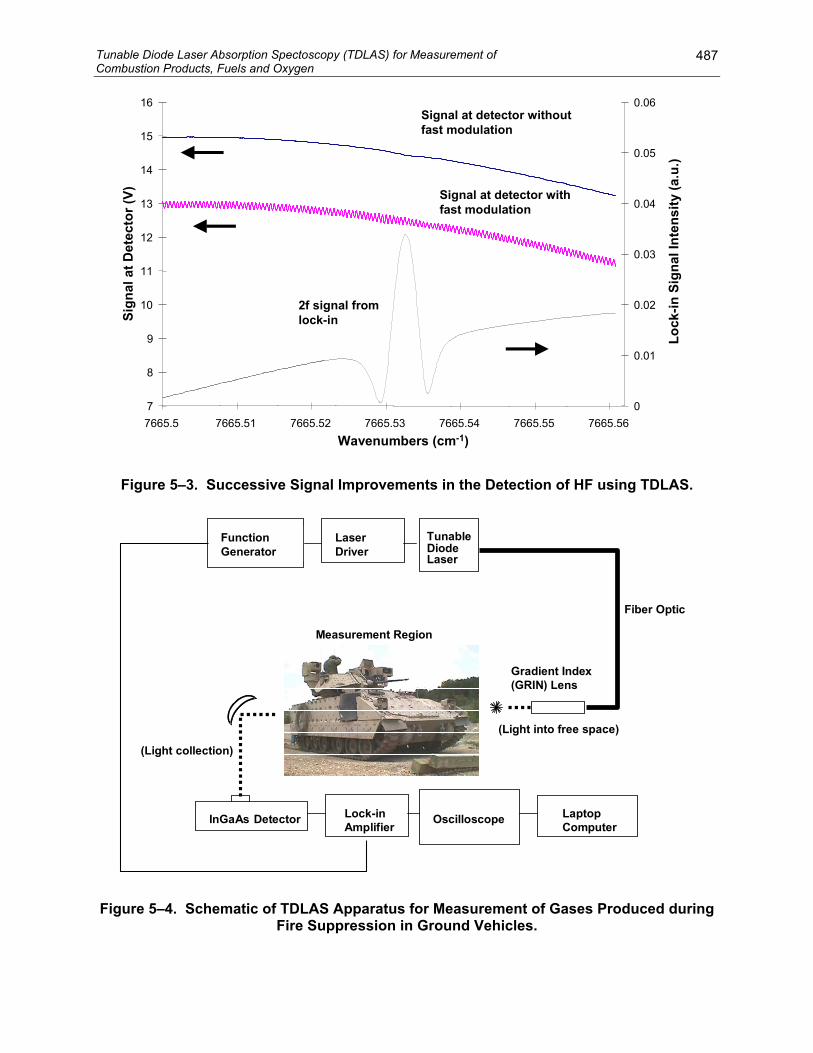
HF gas concentrations were measured using a stand-alone spectrometer system assembled at the Army Research Laboratory.13 This system used a single, distributed feedback (DFB) tunable diode laser emitting near infrared radiation at a wavelength near 1.31 µm. This wavelength coincides with the P2 line of the first overtone absorption of HF gas, and is free of overlap by water lines present in most combustion environments [10]. Typically, the laser was modulated (wavelength tuned) at 100 Hz for a range of approximately 0.5 cm-1, such that the center of this tuning range coincided with the center of the absorption by the P2 transition in HF gas (absorption linewidth approximately 0.1 cm-1). Superimposed upon this “slow” modulation was a fast (50 kHz to 100 kHz) sinusoidal wavelength modulation. The wavelength range of the fast modulation was adjusted so that it was a small (< 0.25) fraction of the absorption linewidth of the P2 transition (1st overtone) in HF gas. This dual modulated light beam was then launched onto an optical fiber, and the fiber used to transmit the beam from a control room (located a safe distance from the measurement site) to the measurement site. For field work, this usually meant the beam was transported approximately 100 m to the measurement site. At the measurement site, the fiber was terminated with a gradient index (GRIN) lens, causing the light beam to be collimated while it passed through free space (the measurement region). After passing through free space for approximately 10 cm to 15 cm, the modulated light beam impinged upon a room temperature operation semiconductor light detector (typically InGaAs). The signal from the biased (12 V) photodetector was returned to the control room via a BNC cable, demodulated using a lock-in amplifier, and recorded on a laptop computer running LabView software. The amplitude (height) of the second derivative-like signal output by the lock-in amplifier was proportional to the amount of light-absorbing gas (HF) present in the measurement region. The steps involved in laser modulation and demodulation are shown in Figure 5–3.
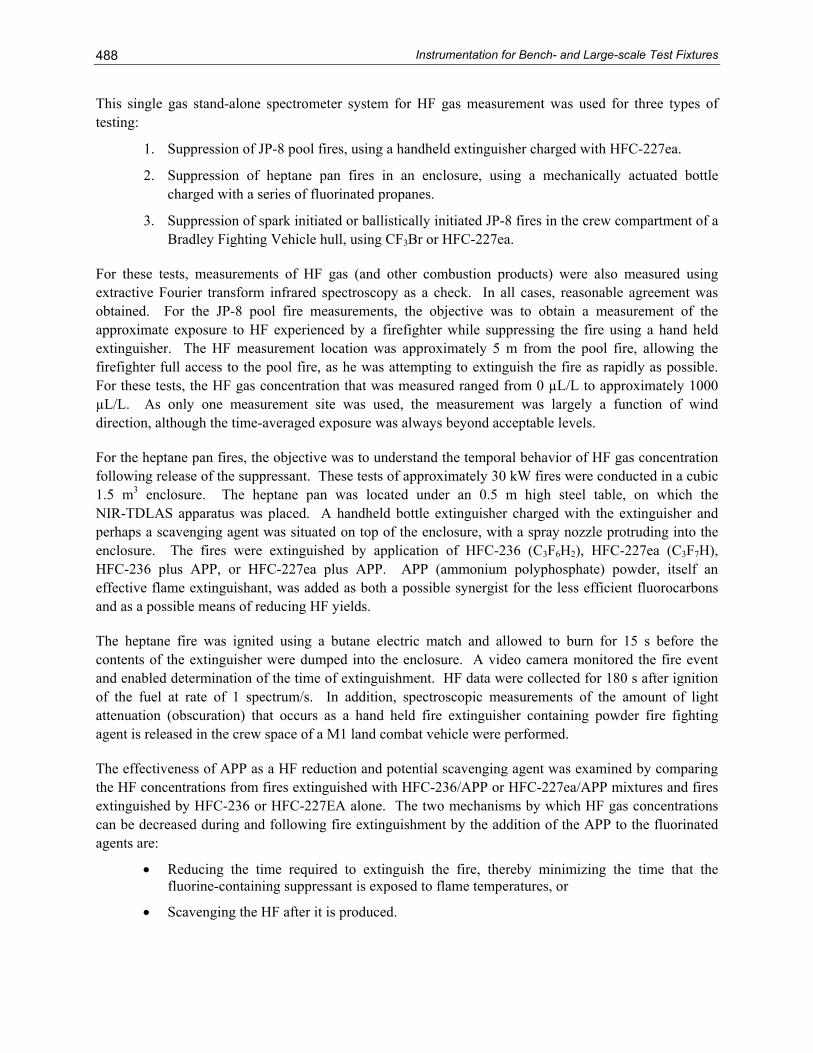
The experimental protocol, lab results, field results, and data analysis methods are detailed in several publications.14, , , , ,15 16 17 18 19 Early in the experimental cycle, an effort was made to use a second optical fiber to capture the light after it had passed through the measurement region, allowing the photodetector to remain in the control room. However, it was found that the alignment of the two optical fibers for the “pitch and catch” setup at the site (typically, the crew compartment of a Bradley Fighting Vehicle) was extremely sensitive. So, it was decided to place the photodetector at the measurement site, since tests showed that small misalignments in the open path fiber-to-detector line of sight were less important than small misalignments in open path fiber-to-fiber line of sight. Additionally, the costs associated with replacing either the fiber-to-detector or fiber-to-fiber setup within the vehicle were similar (hundreds of dollars). Using this system, the measurement duration was 10 ms (100 scan/s); however, the time between measurements was approximately 100 ms, caused by the delay in transferring information from the lock-in amplifier to an oscilloscope, and from the oscilloscope to the laptop computer running LabView software. Figure 5–4 shows the equipment used for monitoring the real-scale fires in ground vehicles.
Tunable Diode Laser Absorption Spectoscopy (TDLAS) for Measurement of Combustion Products, Fuels and Oxygen
487
7
8
9
10
11
12
13
14
15
16
7665.5 7665.51 7665.52 7665.53 7665.54 7665.55 7665.56Wavenumbers (cm-1)
Sign
al a
t Det
ecto
r (V)
0
0.01
0.02
0.03
0.04
0.05
0.06
Lock
-in S
igna
l Int
ensi
ty (a
.u.)
Signal at detector withoutfast modulation
Signal at detector with fast modulation
2f signal from lock-in
Figure 5–3. Successive Signal Improvements in the Detection of HF using TDLAS.
LaptopComputer
OscilloscopeLock-inAmplifier
Gradient Index(GRIN) Lens
InGaAs Detector
TunableDiodeLaser
FunctionGenerator
LaserDriver
Fiber Optic
Measurement Region
(Light into free space)
(Light collection)
Figure 5–4. Schematic of TDLAS Apparatus for Measurement of Gases Produced during Fire Suppression in Ground Vehicles.
Instrumentation for Bench- and Large-scale Test Fixtures 488
This single gas stand-alone spectrometer system for HF gas measurement was used for three types of testing:
1. Suppression of JP-8 pool fires, using a handheld extinguisher charged with HFC-227ea.
2. Suppression of heptane pan fires in an enclosure, using a mechanically actuated bottle charged with a series of fluorinated propanes.
3. Suppression of spark initiated or ballistically initiated JP-8 fires in the crew compartment of a Bradley Fighting Vehicle hull, using CF3Br or HFC-227ea.
For these tests, measurements of HF gas (and other combustion products) were also measured using extractive Fourier transform infrared spectroscopy as a check. In all cases, reasonable agreement was obtained. For the JP-8 pool fire measurements, the objective was to obtain a measurement of the approximate exposure to HF experienced by a firefighter while suppressing the fire using a hand held extinguisher. The HF measurement location was approximately 5 m from the pool fire, allowing the firefighter full access to the pool fire, as he was attempting to extinguish the fire as rapidly as possible. For these tests, the HF gas concentration that was measured ranged from 0 µL/L to approximately 1000 µL/L. As only one measurement site was used, the measurement was largely a function of wind direction, although the time-averaged exposure was always beyond acceptable levels.
For the heptane pan fires, the objective was to understand the temporal behavior of HF gas concentration following release of the suppressant. These tests of approximately 30 kW fires were conducted in a cubic 1.5 m3 enclosure. The heptane pan was located under an 0.5 m high steel table, on which the NIR-TDLAS apparatus was placed. A handheld bottle extinguisher charged with the extinguisher and perhaps a scavenging agent was situated on top of the enclosure, with a spray nozzle protruding into the enclosure. The fires were extinguished by application of HFC-236 (C3F6H2), HFC-227ea (C3F7H), HFC-236 plus APP, or HFC-227ea plus APP. APP (ammonium polyphosphate) powder, itself an effective flame extinguishant, was added as both a possible synergist for the less efficient fluorocarbons and as a possible means of reducing HF yields.
The heptane fire was ignited using a butane electric match and allowed to burn for 15 s before the contents of the extinguisher were dumped into the enclosure. A video camera monitored the fire event and enabled determination of the time of extinguishment. HF data were collected for 180 s after ignition of the fuel at rate of 1 spectrum/s. In addition, spectroscopic measurements of the amount of light attenuation (obscuration) that occurs as a hand held fire extinguisher containing powder fire fighting agent is released in the crew space of a M1 land combat vehicle were performed.
The effectiveness of APP as a HF reduction and potential scavenging agent was examined by comparing the HF concentrations from fires extinguished with HFC-236/APP or HFC-227ea/APP mixtures and fires extinguished by HFC-236 or HFC-227EA alone. The two mechanisms by which HF gas concentrations can be decreased during and following fire extinguishment by the addition of the APP to the fluorinated agents are:
• Reducing the time required to extinguish the fire, thereby minimizing the time that the fluorine-containing suppressant is exposed to flame temperatures, or
• Scavenging the HF after it is produced.

Tunable Diode Laser Absorption Spectoscopy (TDLAS) for Measurement of Combustion Products, Fuels and Oxygen
489
Figure 5–5 shows the results of one such test. The application of 7 % APP clearly affects a significant reduction in HF. What is important is that a nominal doubling of the APP level virtually eliminated the HF. If this were principally a scavenging effect, one would expect that the green line in Figure 5–5 would rise further initially and then decline more steeply than the red curve. The observed behavior favors enhanced quenching of the flames and the accompanying reduction in the thermal generation of the HF.
-200
0
200
400
600
800
1000
1200
1400
0 50 100 150 200
Time (s)
Ave
rage
HF
Con
cent
ratio
n, µ
L/L
HFC-236HFC-236 + 7 % APPHFC-236 + 15 % APP
HFC-236HFC-236 + 7 % APPHFC-236 + 15 % APP
-200
0
200
400
600
800
1000
1200
1400
0 50 100 150 200
Time (s)
Ave
rage
HF
Con
cent
ratio
n, µ
L/L
HFC-236HFC-236 + 7 % APPHFC-236 + 15 % APP
HFC-236HFC-236 + 7 % APPHFC-236 + 15 % APP
Figure 5–5. HF Gas Produced during Suppression of Heptane Pan Fires by HFC-236 with and without the Addition of Ammonium Polyphosphate).
In the tests conducted in the ground vehicles, the HF measurement location approximated the seating location of a passenger within the vehicle. The results indicated that HF concentrations produced from fires extinguished by HFC-236 plus APP and HFC-227ea plus APP were reduced in the test facility and that the presence of APP accelerated the reductions. Production of HF gas ranged from hundreds to thousands of (µL/L)-min, depending on how quickly the fire was extinguished. For successful tests (fires extinguished within 250 ms of the suppressant being deployed), HF levels were typically in the hundreds of µL/L. For tests where the fire was not extinguished or suppression was not complete after 250 ms (resulting in suppressant being burned), the HF levels were often beyond the measurement range of both instruments (usually 5000 µL/L for TDLAS). Visibility reduction during extinguisher deployment was

Instrumentation for Bench- and Large-scale Test Fixtures 490
measured inside the combat vehicle for extinguishers containing HFC-236 plus APP and NaHCO3 plus N2. (HFC-227ea was not available for these tests.)
5.3.3 Oxygen
Measurement of the fuel and oxygen concentrations is especially important after the suppression event in order to predict the possibility of reignition. Minimum acceptable detection limits for fuel/oxygen gas mixtures were projected to be about 600 µL/L (0.06 %) for the fuel and 3000 µL/L oxygen (0.3 %), for a 10 cm optical path length at room temperature. These values would ensure the ability to make accurate concentration measurements near the lean flammability limit. The oxygen measurements are described in this section, the fuel measurements in the next.
A fully automated, multi-position, multi-laser instrument, built by Southwest Sciences, Inc., was originally designed to measure concentrations of CO, O2, HF, and NO2 gases at four different locations within the crew compartment of a Bradley Fighting Vehicle, achieving near continuous measurement with data points every 10 ms. Housed in a trailer adjacent to the control room at the test site, this instrument used the same technique of dual modulation spectroscopy employed by the stand alone HF measurement system described earlier. However, it used a 10 kHz ramp for the “slow” modulation and a 1MHz sine wave for the “fast” modulation. During the course of development of this instrument, it was decided to focus exclusively on measuring HF and O2 within the Bradley hull, during suppression by HFC-227ea of spark initiated JP-8 fires.
For these fires, a heated (≈ 70 °C) spray of JP-8 liquid was begun within the crew compartment of the Bradley hull. The fuel nozzles were located along one interior wall. About 1 s later, this fuel spray was ignited by a series of spark plugs located along the wall of the interior of the vehicle. Approximately 1 s after ignition, two onboard bottles containing the pressurized suppressant (HFC-236, HFC-227ea, or FC-36, C3F8) were released.
At the crew seating location, a sharp drop in O2 concentration occurred during the fire and suppression event. Following suppression, O2 levels returned to ambient in a few seconds. It was not clear whether the decrease in O2 levels during the fire and suppression event was due to depletion of oxygen by combustion or displacement of oxygen by the hot fuel vapors/expanding HFC-227ea vapor. Results from a typical test measuring oxygen concentration as a function of time in the crew compartment of the Bradley fighting vehicle are shown in Figure 5–6.
Test difficulties related to reliability of the visible diode lasers operating near 760 nm limited the data obtained in spray fires in vehicles. During the course of this project, fiber pigtailed lasers became commercially unobtainable at this wavelength.
5.3.4 Fuels
The third measurement capability to be developed was for the quantification of hydrocarbon fuels in fuel/air mixtures: heptane (C7H16), as a model fuel, and two realistic fuels: DF-2 (a diesel fuel), and JP-8. The apparatus was a multi-point, field worthy, fiber-coupled, near-infrared tunable diode laser-based sensor. The system was to provide concentration data before (minimum five data points prior to agent

Tunable Diode Laser Absorption Spectoscopy (TDLAS) for Measurement of Combustion Products, Fuels and Oxygen
491
release), during, and after the suppression event, for a nominal event time of 250 ms, with a time resolution better than 10 ms.
Oxygen Concentration
10
12
14
16
18
20
22
24
0 100 200 300 400 500 600 700 800 900
Time (ms)
% O
xyge
n
Figure 5–6. Oxygen Concentration Measured Within the Crew Compartment of a Bradley Fighting Vehicle During Suppression by C3F8 of a Spark-Initiated JP-8 Spray Fire.
Field worthy detectors for hydrocarbon vapor measurements typically rely upon infrared techniques: DOAS (differential optical absorption spectrometry), FT-IR (Fourier transform infrared emission/absorption)20, ,21 22 or electrochemical/electrothermal techniques.23 These methods give good results, but have found limited use for measurements in fires. FT-IR and DOAS spectrometers are usually bulky, require careful placement/alignment of interferometer/source optics and detector or retro-reflector, and are generally limited to a single line of sight. Placement of the instrument within the test environment (crew compartment) is not feasible (potential damage), looking across the entire measurement space does not isolate the region of interest, and although extractive sampling has been shown to be useful,24 it does not provide the necessary temporal information. Additionally, the interferometer temporal resolution is limited by the mirror scan speed (although some new designs are approaching scan rates near 1 kHz).25
Nevertheless, use of FT-IR and DOAS for measurement of the fundamental C-H stretch in hydrocarbon fuels near 3.4 µm can yield sensitivities in the nL/L (ppb) range, and because the full spectrum may be measured (when using FT-IR), it is often possible to determine species of hydrocarbons present in a simple mixture. For stable, relatively safe sampling sites with an accessible line of sight, incoherent
Instrumentation for Bench- and Large-scale Test Fixtures 492
infrared absorption techniques (FT-IR, DOAS) are often the techniques of choice. Electrothermal/electrochemical detectors are generally inexpensive ($2000 to $5000), are often transportable by a single person, and have sensitivities (≈ 100s µL/L) well below lower explosion limits for most hydrocarbon vapors.26, , ,27 28 29 Time sensitivity is typically from 1 s to 15 s. Some units may have accuracy problems when used in the presence of methane gas, and may be less sensitive to heavier hydrocarbon vapors.23 For measurement sites requiring full portable instrumentation with time resolution from one second to tens of seconds, these instruments can also provide excellent results.
Gas detection methods using near-infrared tunable diode lasers can use optical fibers and relatively
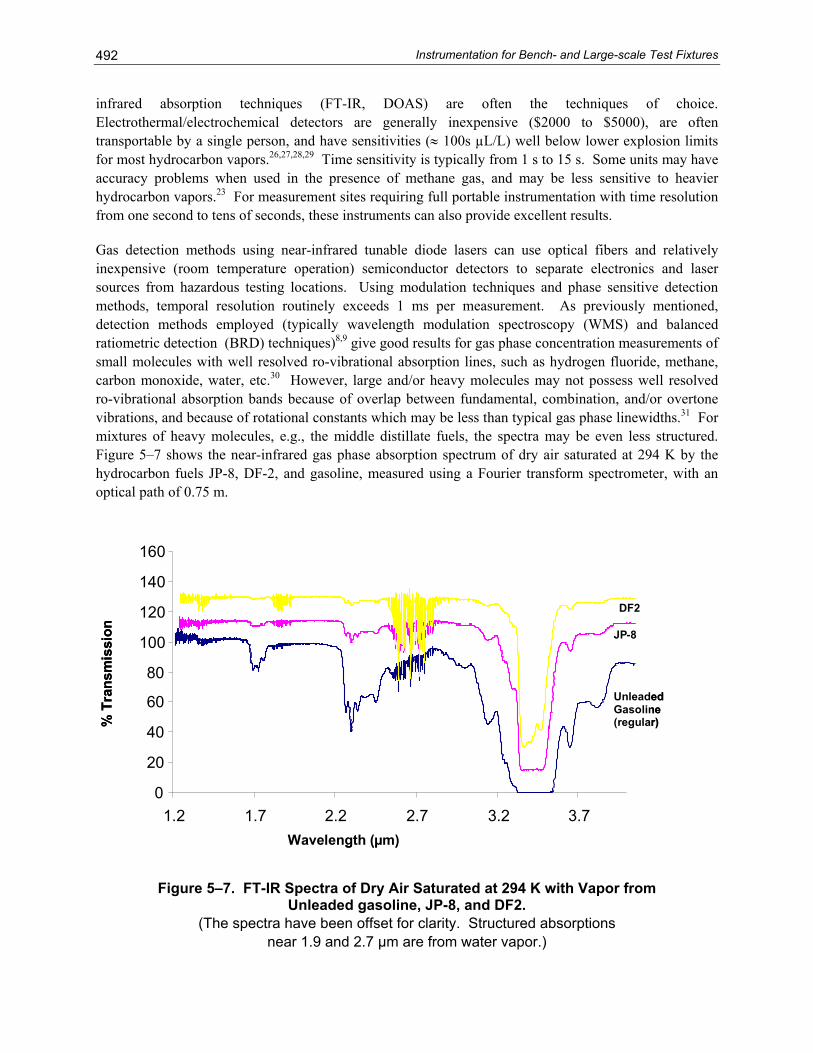
Figure 5–7. FT-IR Spectra of Dry Air Saturated at 294 K with Vapor from
(The spectra have been offset for clarity. Structured absorptions near 1.9 and 2.7 µm are from water vapor.)
inexpensive (room temperature operation) semiconductor detectors to separate electronics and laser sources from hazardous testing locations. Using modulation techniques and phase sensitive detection methods, temporal resolution routinely exceeds 1 ms per measurement. As previously mentioned, detection methods employed (typically wavelength modulation spectroscopy (WMS) and balanced ratiometric detection (BRD) techniques)8,9 give good results for gas phase concentration measurements of small molecules with well resolved ro-vibrational absorption lines, such as hydrogen fluoride, methane, carbon monoxide, water, etc.30 However, large and/or heavy molecules may not possess well resolved ro-vibrational absorption bands because of overlap between fundamental, combination, and/or overtone vibrations, and because of rotational constants which may be less than typical gas phase linewidths.31 For mixtures of heavy molecules, e.g., the middle distillate fuels, the spectra may be even less structured. Figure 5–7 shows the near-infrared gas phase absorption spectrum of dry air saturated at 294 K by the hydrocarbon fuels JP-8, DF-2, and gasoline, measured using a Fourier transform spectrometer, with an optical path of 0.75 m.
0
20
40
60
80
100
120
140
160
1.2 1.7 2.2 2.7 3.2 3.7
UnleadedGasoline(regular)
JP-8
DF2
Wavelength (µm)
% T
rans
mis
sion
0
20
40
60
80
100
120
140
160
1.2 1.7 2.2 2.7 3.2 3.70
20
40
60
80
100
120
140
160
1.2 1.7 2.2 2.7 3.2 3.7
UnleadedGasoline(regular)
JP-8
DF2
Wavelength (µm)
% T
rans
mis
sion
Unleaded gasoline, JP-8, and DF2.

Tunable Diode Laser Absorption Spectoscopy (TDLAS) for Measurement of Combustion Products, Fuels and Oxygen
493
As suggested by be classified as a gas having unstructured a sorber"). Both WMS and BRD, as usually employed, are not suitable for gases that exhibit broad, unstructured absorption
approaching the sensitivity and time response of WMS and BRD methods. The approach took advantage of the residual amplitude modulation (RAM) that occurs as the wavelength of a
he absorption coefficient (cm2/molecule) at the most intense region of absorption (the resonant wavelength,
If the incident radiation at the resonant wavelength is now power modulated sinusoidally at frequency a, d time t, with depth of modulation tion at the resonant wavelength after
xiting the gas becomes:
To get a measurement of transmission off resonance (important to generate a differential signal and to iscriminate against scattering laser source at a wavelength ot absorbed by the gas, λ . This non-resonant wavelength is mixed with the resonant wavelength,
the spectra shown in Figure 5–7, the vapors from each fuel fit criteria32 tobsorption spectra (often called a "broad band ab
spectra.8,9,30 For both techniques, the main limitation for fuel sensing is the narrow tuning range of the diode laser. Because the tuning range of the DFB lasers is usually several orders of magnitude smaller than the width of the spectral feature in broad band absorbers (0.4 cm-1 vs. > 100 cm-1), it is not possible using commercially available DFB lasers to tune from the region of maximum absorption to a region of zero absorption.
McNesby and co-workers developed a technique to overcome this limitation for measurement of such molecules, while
semiconductor tunable diode laser is varied by modulating the laser injection current. Typically (for WMS and BRD), RAM is a nuisance, and what is important is the wavelength modulation. For this method, the RAM is what enables the technique to work, and the relatively small variation of wavelength during the modulation is largely ignored (but will be commented upon below). For this method, two different DFB lasers are driven using a sinusoidally varying injection current. Each laser injection current is modulated at the same frequency, but the two lasers are out of phase by 180°.32 The light output of the two lasers is combined to produce the probe beam used for the line-of-sight measurement. When the power output amplitudes of each sinusoidally modulated laser are the same, the combined output of the two lasers will have an amplitude that is (ideally) invariant with time. The key to the method is selection of one laser wavelength coincident with a wavelength absorbed by the gas of interest, and selection of the second laser wavelength in a region where no absorption is anticipated. When the mixed, modulated probe beam is passed through a gas which preferentially absorbs the laser radiation from only one of the lasers, the signal at the detector is modulated at the injection current modulation frequency and, for small absorptions, has an amplitude whose magnitude is proportional to the concentration of absorbing gas.
The simple mathematical description begins by considering Beer's law for narrow band laser radiation exiting an absorbing sample gas of concentration c molecules per cm3, for a path length of l cm. T
λR), is α(λR). I0(λR) is the intensity of the incident radiation at the resonant wavelength. I(λR) is the intensity of radiation at the resonant wavelength after exiting the sample gas:
I(λR)=I0(λR) exp(-α(λR)cl) (5-1)
an DR, the intensity of the radiae
I(λR)=I0(λR)(1+DR sin(at)) exp(-α(λR)cl) (5-2)
d by particles such as smoke), we add a secondn NR
power modulated at the same frequency but 180 degrees out of phase with the resonant wavelength

Instrumentation for Bench- and Large-scale Test Fixtures 494
modulation, and has a depth of modulation DNR. If the radiation exiting the gas is now focused on an (ideally) wavelength-insensitive detector, the power at this detector, I(λR +λNR), may be given by:
I(λR +λNR)=[I0(λR)(1+DRsin(at)) exp(-α(λR)cl) +I0(λNR)(1+DNRsin(at+π))] (5-3)
o process this signal, we multiply by a reference sine wave of amplitude p in phase with and at the same
C 0π∫ {[I0(λR) (1+DR) exp(-α(λR)cl) -I0(λNR) (1+DNR)] sin(at) psin(at)}dt (5-4)
earranging, assuming exp(-α(λR)cl) <<1 and using A (Absorbance) equal to α(λR)cl :
2C 0 ∫ {[I0(λR) (1+DR) exp(-α(λR)cl) -I0(λNR) (1+DNR)] sin(at) psin(at)}dt (5-5)
or the special case where the power and depth of modulation of the two lasers are equal, Equation 5-5
2C 0π∫ {[I0(λR) (1+DR) exp(-α(λR)cl) -I0(λNR) (1+DNR)] sin(at) psin(at)}dt (5-6)
quation 5-6 is just the output of a lock-in amplifier operating on the first harmonic for measurement of
A diagram of the experimental apparatus employing this method is shown in Figure 5–8. The two DFB
Tfrequency, a, as the power modulation of the two lasers. We then integrate over C periods of power modulation:
=(C/2)pπ [I0(λR) (1+DR) exp(-α(λR)cl) -I0(λNR) (1+DNR)]
R
π
=Cpπ [I0 R R 0 NR NR 0 R R(λ ) (1+D ) -I (λ ) (1+D ) - I (λ ) (1+D )A]
Fbecomes:
=-Cpπ [I0(λR) (1+DR)A]
Ethe amplitude of the sine wave created by the differential absorption (for small absorptions) of the mixed laser beam by the gas at concentration c and path length l. This output is proportional to the number of periods, C, over which the integration is carried, the amplitude, p, of the reference sine wave, the incident power, I0(λR), of the laser at the resonant wavelength, and the Absorbance, A (and hence gas concentration when pressure broadening of the spectral feature is not important). It is worth noting that Equation 5-6 also indicates that the lock-in output is increased by increasing depth of modulation (DR). As will also be discussed later, Equation 5-5 shows that it is important that the two laser power amplitudes and depths of modulation are as equal as possible, especially for small values of Absorbance. As mentioned previously, and implied by Equation 5-6, because the measurement relies on differential absorption to quantify gas concentrations, division of the raw signal at the detector by the average laser power should account for pseudo wavelength-independent signal intensity extinction from scatterers, such as smoke particles. However, it should also be mentioned that decreases in overall signal voltage will result in similar decreases in the signal to noise ratio of the measurement.
laser diodes (Sensors Unlimited) used to produce the mixed wavelength probe beam have nominal wavelengths of 1.307 µm and 1.71 µm. The laser diodes are driven using an ILX LDC-3900 modular laser diode controller. The variable phase sinusoidal injection currents are supplied by two SRS Model DS345 function generators operating on a common time base, Sinusoidally modulated (100 kHz, modulation depth adjusted to near 100 %) laser diode radiation from each diode laser is mixed onto a common fiber using a fiber optic coupler (Gould Fiberoptics) and launched into free space using a single mode fiber that is terminated by a gradient index (GRIN) lens (Sentech Corp.). The output beam is
Tunable Diode Laser Absorption Spectoscopy (TDLAS) for Measurement of Combustion Products, Fuels and Oxygen
495
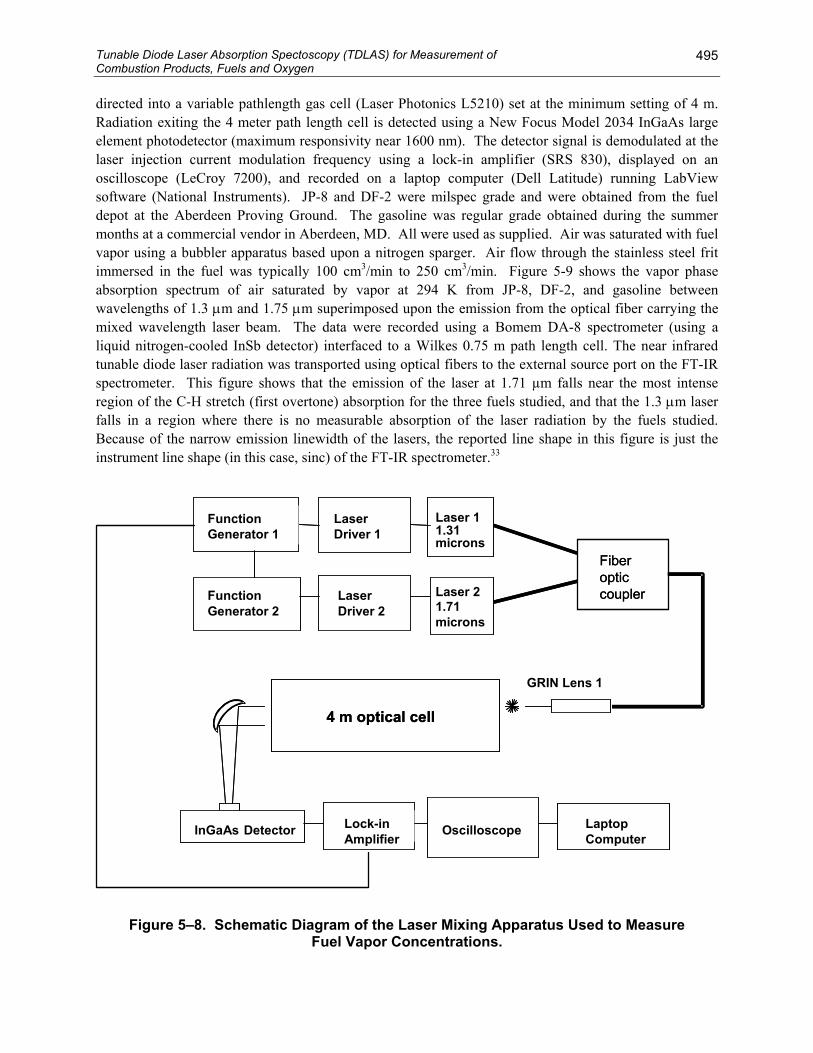
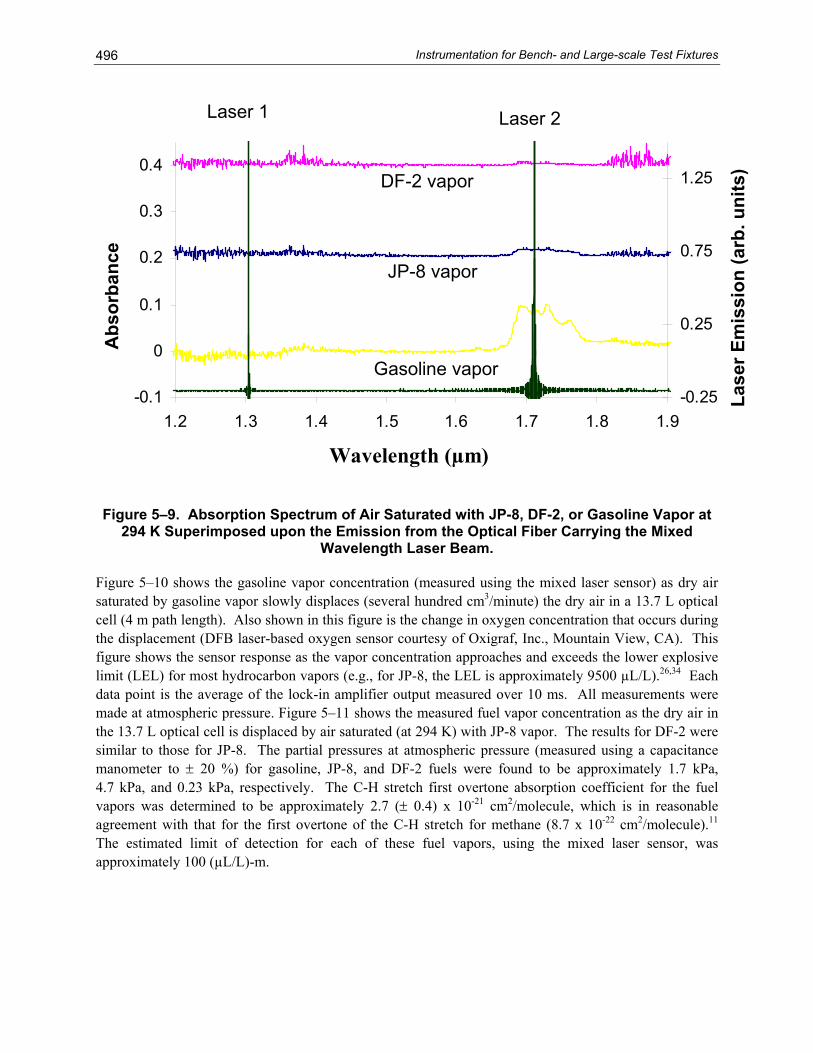
directed into a variable pathlength gas cell (Laser Photonics L5210) set at the minimum setting of 4 m. Radiation exiting the 4 meter path length cell is detected using a New Focus Model 2034 InGaAs large element photodetector (maximum responsivity near 1600 nm). The detector signal is demodulated at the laser injection current modulation frequency using a lock-in amplifier (SRS 830), displayed on an oscilloscope (LeCroy 7200), and recorded on a laptop computer (Dell Latitude) running LabView software (National Instruments). JP-8 and DF-2 were milspec grade and were obtained from the fuel depot at the Aberdeen Proving Ground. The gasoline was regular grade obtained during the summer months at a commercial vendor in Aberdeen, MD. All were used as supplied. Air was saturated with fuel vapor using a bubbler apparatus based upon a nitrogen sparger. Air flow through the stainless steel frit immersed in the fuel was typically 100 cm3/min to 250 cm3/min. Figure 5-9 shows the vapor phase absorption spectrum of air saturated by vapor at 294 K from JP-8, DF-2, and gasoline between wavelengths of 1.3 µm and 1.75 µm superimposed upon the emission from the optical fiber carrying the mixed wavelength laser beam. The data were recorded using a Bomem DA-8 spectrometer (using a liquid nitrogen-cooled InSb detector) interfaced to a Wilkes 0.75 m path length cell. The near infrared tunable diode laser radiation was transported using optical fibers to the external source port on the FT-IR spectrometer. This figure shows that the emission of the laser at 1.71 µm falls near the most intense region of the C-H stretch (first overtone) absorption for the three fuels studied, and that the 1.3 µm laser falls in a region where there is no measurable absorption of the laser radiation by the fuels studied. Because of the narrow emission linewidth of the lasers, the reported line shape in this figure is just the instrument line shape (in this case, sinc) of the FT-IR spectrometer.33
LaptopComputer
OscilloscopeLock-inAmplifier
GRIN Lens 1
InGaAs Detector
4 m optical cell
Laser 11.31microns
FunctionGenerator 1
LaserDriver 1
Laser 21.71microns
FunctionGenerator 2
LaserDriver 2
Fiberoptic coupler
LaptopComputer
OscilloscopeLock-inAmplifier
GRIN Lens 1
InGaAs Detector
4 m optical cell
Laser 11.31microns
FunctionGenerator 1
LaserDriver 1
Laser 21.71microns
FunctionGenerator 2
LaserDriver 2
Fiberoptic coupler
Figure 5–8. Schematic Diagram of the Laser Mixing Apparatus Used to Measure Fuel Vapor Concentrations.
Instrumentation for Bench- and Large-scale Test Fixtures 496
Figure 5–9. Absorption Spectrum of Air Saturated with JP-8, DF-2, or Gasoline Vapor at 294 K Superimposed upon the Emission from the Optical Fiber Carrying the Mixed
Wavelength Laser Beam.
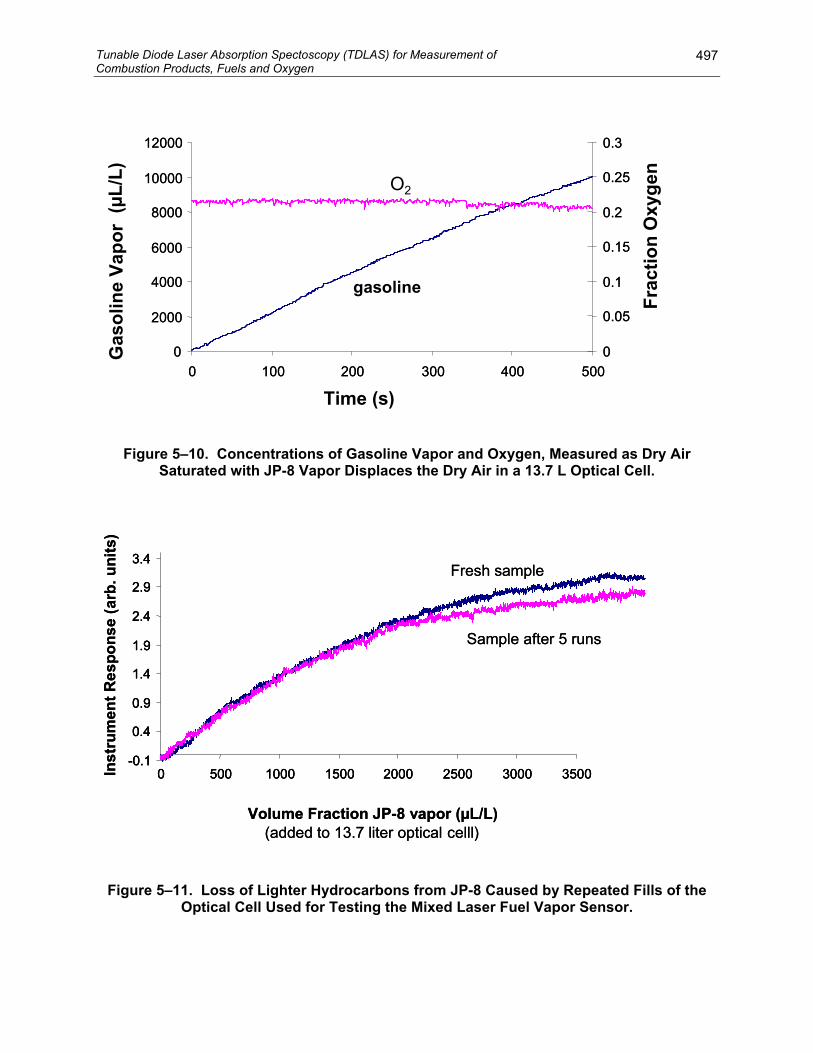
Figure 5–10 shows the gasoline vapor concentration (measured using the mixed laser sensor) as dry air saturated by gasoline vapor slowly displaces (several hundred cm3/minute) the dry air in a 13.7 L optical cell (4 m path length). Also shown in this figure is the change in oxygen concentration that occurs during the displacement (DFB laser-based oxygen sensor courtesy of Oxigraf, Inc., Mountain View, CA). This figure shows the sensor response as the vapor concentration approaches and exceeds the lower explosive limit (LEL) for most hydrocarbon vapors (e.g., for JP-8, the LEL is approximately 9500 µL/L).26,34 Each data point is the average of the lock-in amplifier output measured over 10 ms. All measurements were made at atmospheric pressure. Figure 5–11 shows the measured fuel vapor concentration as the dry air in the 13.7 L optical cell is displaced by air saturated (at 294 K) with JP-8 vapor. The results for DF-2 were similar to those for JP-8. The partial pressures at atmospheric pressure (measured using a capacitance manometer to ± 20 %) for gasoline, JP-8, and DF-2 fuels were found to be approximately 1.7 kPa, 4.7 kPa, and 0.23 kPa, respectively. The C-H stretch first overtone absorption coefficient for the fuel vapors was determined to be approximately 2.7 (± 0.4) x 10-21 cm2/molecule, which is in reasonable agreement with that for the first overtone of the C-H stretch for methane (8.7 x 10⁻²² cm2/molecule).11 The estimated limit of detection for each of these fuel vapors, using the mixed laser sensor, was approximately 100 (µL/L)-m.
-0.1
0
0.1
0.2
0.3
0.4
1.2 1.3 1.4 1.5 1.6 1.7 1.8 1.9-0.25
0.25
0.75
1.25
Abs
orba
nce
Lase
r Em
issi
on (a
rb. u
nits
)
aser 2
Gasoline vapor
JP-8 vapor
DF-2 vapor
Wavelength (µm)
Laser 1 L
Tunable Diode Laser Absorption Spectoscopy (TDLAS) for Measurement of Combustion Products, Fuels and Oxygen
497
Air
0
2000
4000
6000
8000
10000
12000
0 100 200 300 400 5000
0.05
0.1
0.15
0.2
0.25
0.3
0
2000
4000
6000
8000
10000
12000
0 100 200 300 400 5000
0.05
0.1
0.15
0.2
0.25
0.3
Time (s)
Gas
olin
e Va
por
(µL/
L)
Frac
tion
Oxy
gen
gasoline
O2
Figure 5–10. Concentrations of Gasoline Vapor and Oxygen, Measured as Dry Saturated with JP-8 Vapor Displaces the Dry Air in a 13.7 L Optical Cell.
-0.1
0.4
0.9
1.4
1.9
2.4
2.9
0 500 1000 1500 2000 2500 3000 3500
Volume Fraction JP-8 vapor (µL/L)(added to 13.7 liter optical celll)
Inst
rum
ent R
espo
nse
( arb
. Fresh sample
Sample after 5 runs
3.4
uni
ts)
-0.1
0.4
0.9
1.4
1.9
2.4
2.9
0 500 1000 1500 2000 2500 3000 3500
3.4
-0.1
0.4
0.9
1.4
1.9
2.4
2.9
0 500 1000 1500 2000 2500 3000 3500
Volume Fraction JP-8 vapor (µL/L)(added to 13.7 liter optical celll)
Inst
rum
ent R
espo
nse
( arb
. Fresh sample
Sample after 5 runs
3.4
uni
ts)
Figure 5–11. Loss of Lighter Hydrocarbons from JP-8 Caused by Repeated Fills of the Optical Cell Used for Testing the Mixed Laser Fuel Vapor Sensor.
Instrumentation for Bench- and Large-scale Test Fixtures 498
Two factors led to the decision that measurement of the full absorption envelope for the C-H stretching vibration was necessary, and that the first generation sensor system was inadequate for general fuel vapor sensing:
• Careful examination of the C-H overtone bands for each of the fuels tested (JP-8, DF-2, and gasoline) shows that the contours of the absorption features, when normalized to each other, were not superimposable. So, being limited to sampling vapors from different fuels using the same single wavelength would be a potential source of error.
• Changes in temperature, storage conditions (aging) and changes in fuel composition between vendors may cause changes in the contour of the unstructured absorption envelope.
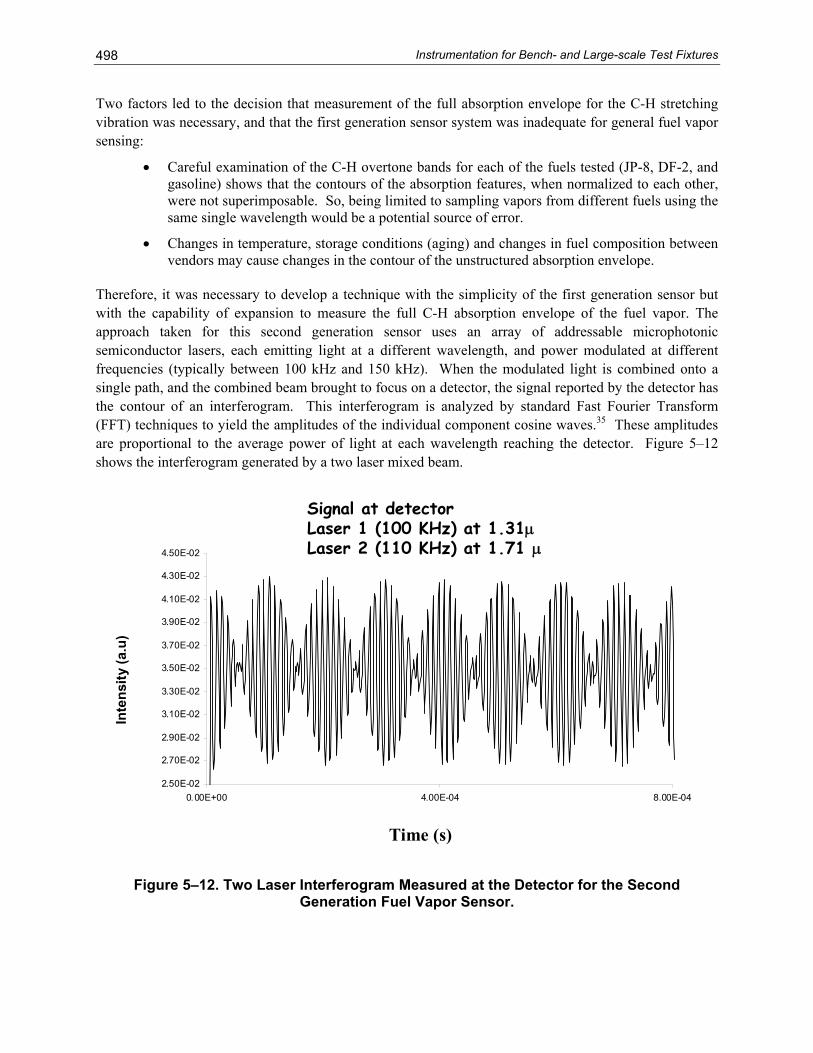
Therefore, it was necessary to develop a technique with the simplicity of the first generation sensor but with the capability of expansion to measure the full C-H absorption envelope of the fuel vapor. The approach taken for this second generation sensor uses an array of addressable microphotonic semiconductor lasers, each emitting light at a different wavelength, and power modulated at different frequencies (typically between 100 kHz and 150 kHz). When the modulated light is combined onto a single path, and the combined beam brought to focus on a detector, the signal reported by the detector has the contour of an interferogram. This interferogram is analyzed by standard Fast Fourier Transform
FT) techniques to yield the amplitudes of the individual component cosine waves.35 These amplitudes are proportional to the average power of light at each wavelength reaching the detector. Figure 5–12 hows the interferogram generated by a two laser mixed beam.
Figure 5–12. Two Laser Interferogram Measured at the Detector for the Second Generation Fuel Vapor Sensor.
(F
s
2.50E-02
2.70E-02
2.90E-02
3.10E-02
3.30E-02
3.50E-02
3.70E-02
3.90E-02
4.10E-02
4.30E-02
4.50E-02
0.00E+00 4.00E-04 8.00E-04
Signal at detectorLaser 1 (100 KHz) at 1.31µLaser 2 (110 KHz) at 1.71 µ
Inte
nsity
(a.u
)
Time (s)

Tunable Diode Laser Absorption Spectoscopy (TDLAS) for Measurement of Combustion Products, Fuels and Oxygen
499
L of modulation en because it is not absorbed by hydrocarbon vapor or by water vapor. Laser 2 emits laser radiation near a wavelength
f 1.71 µm and was power modulated at 110 kHz, with a depth of modulation near 95 %. Also as with
ut from each fiber coupled laser is launched onto a single, common, single mode optical fiber using a at a differenon a commthe transmi ) detector. The signal at the detector manner si s. The time for each measurement is user controlled by varying the frequency of power modulation. Resolution
the demodulated signal prior to the onset of fuel vapor flow. The flow apparatus was characterized using the first generation sensor, and using that calibration the absorbance reported here is reasonably linear with concentration (within 5 %), but was not explicitly measured for these experiments. All of the factors that determine quality of conventionally measured FT-IR spectra are of importance here (modulation depth, apodization, phase, etc.).33 Most of the efforts for the prototype were focused on making sure the lasers were modulated in phase, using a common time base. Any effects of varying the modulation depth or of varying the laser power were not investigated. Dynamic range effects were also not investigated, although some improvement was anticipated relative to Michelson interferometer based instruments because the Fourier frequencies for each laser are no longer coupled to the laser wavelength. The time for each measurement point was approximately 1 s. All measurements were made at atmospheric pressure.
The absorption coefficients for most VOCs in the near-infrared spectral region (≈ 1 µm to 2 µm wavelength, two (or more) vibrational quanta per transition) are typically lower by an order of magnitude than for the mid-infrared spectral region (≈ 2 µm – 30 µm wavelength, typically 1 vibrational quantum per transition).36 As indicated in Figure 5–7, the ARL team determined the near infrared absorption coefficients between wavelengths of 1.0 µm and 30 µm for JP-8, finding the maximum absorption coefficient to occur between a wavelength of 1.6 µm and 1.825 µm, with a value of about 3 x 10-21 cm2/molecule. Using the prototype FT-LS instrument described above, the detection limit was approximately 200µL/L m-1, or approximately 50 times worse than the detection limit using a commercial FT-IR spectrometer.37 It is worth noting that for the prototype sensor described here, the power modulation of each diode laser was not purely cosinusoidal (harmonics in the FFT output), even though
aser 1 emits radiation near a wavelength of 1.31 :m and was power modulated at 100 kHz, with a depth near 95 %. As with the first generation sensor, this laser wavelength was chos
othe first generation sensor, this laser wavelength was chosen because it is approximately at the center of the 1st overtone C-H stretching vibration of most middle distillate fuel vapors.
The outpcommercially available fiber coupler (Gould Fiber Optics). Each laser is power modulated, each
t frequency, using digital function generators (Stanford Research Systems DS-345) operating on time base. This modulated light beam is passed through a GRIN lens into free space, and tted light detected using an InGaAS (New Focus model 2011
is demodulated (Agilent Infinium Oscilloscope) using a Fast Fourier Transform (FFT), in a milar to that of commercially available Fourier transform infrared (FT-IR) spectrometer 35
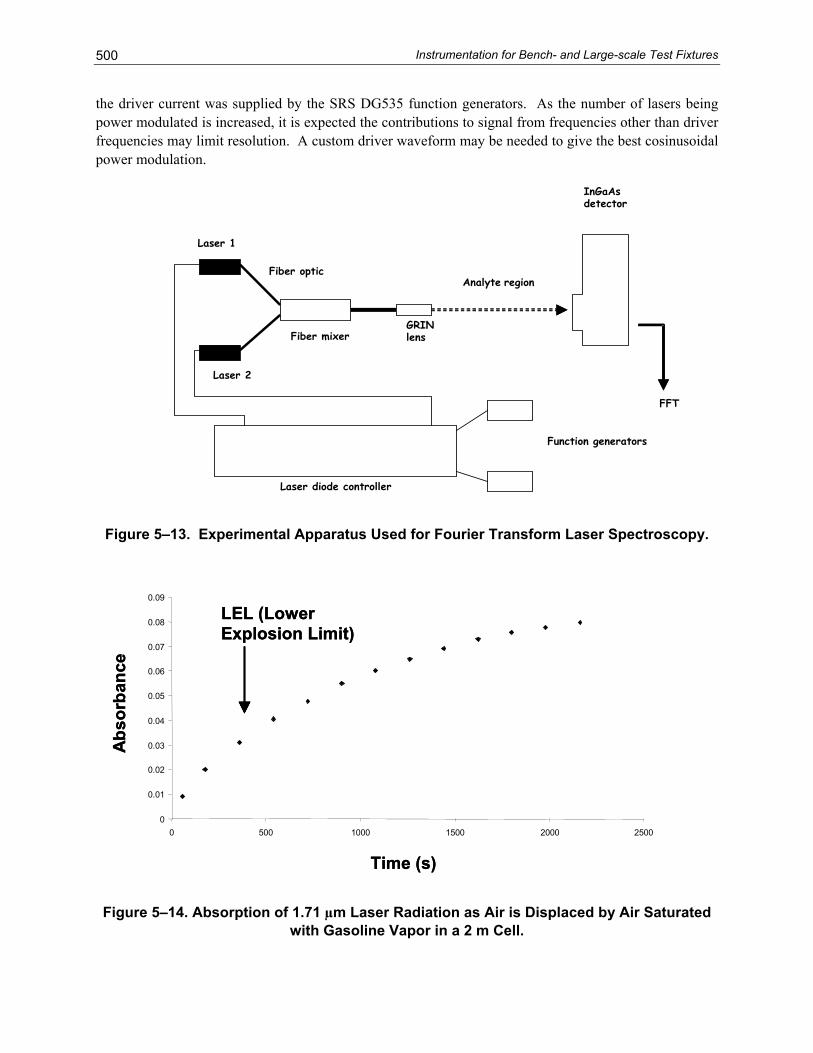
is user controlled by varying the number of periods of power modulation measured per “scan.” Figure 5–13 is a schematic drawing of the experimental apparatus for the Fourier transform laser spectroscopy (FT-LS) system.
As with the first generation sensor, the second generation sensor was tested by measuring gasoline vapor concentration as dry air saturated by gasoline vapor slowly displaced (several hundred cm3/minute) the dry air in a 13.7 L optical cell (4 m path length). Figure 5–14 shows the sensor response as the vapor concentration approaches and exceeds the lower explosive limit (LEL). For most hydrocarbon vapors (i.e., for JP-8 and most other middle distillate fuels), the LEL is approximately 0.1 % by volume.26,34 For the absorbance measurement, the background for each laser was
Instrumentation for Bench- and Large-scale Test Fixtures 500
the dr eing power modulated is increased, it is rom frequencies other than driver frequencies may limit resolution. A custom driver waveform may be needed to give the best cosinusoidal
iver current was supplied by the SRS DG535 function generators. As the number of lasers b expected the contributions to signal f
power modulation.
Laser 1
InGaAsdetector
Laser 2
Analyte region
FFT
Laser diode controller
Function generators
GRINlensFiber mixer
Fiber optic
Figure 5–13. Experimental Apparatus Used for Fourier Transform Laser Spectroscopy.
0.01
0.02
0.03
0.04
0.05
0.06
0.07
0.08
0.09
Figure 5–14. Absorption of 1.71 µm Laser Radiation as Air is Displaced by Air Saturated with Gasoline Vapor in a 2 m Cell.
00 500 1000 1500 2000 2500
0.01
0.02
0.03
0.04
0.05
0.06
0.07
0.08
0.09
Abs
orba
nce
LEL (Lower Explosion Limit)
00 500 1000 1500 2000 2500
Time (s)
0.01
0.02
0.03
0.04
0.05
0.06
0.07
0.08
0.09
00 500 1000 1500 2000 2500
0.01
0.02
0.03
0.04
0.05
0.06
0.07
0.08
0.09
Abs
orba
nce
LEL (Lower Explosion Limit)LEL (Lower Explosion Limit)
00 500 1000 1500 2000 2500
Time (s)

Tunable Diode Laser Absorption Spectoscopy (TDLAS) for Measurement of Combustion Products, Fuels and Oxygen
501
At the time of publication of this book, the ARL team was developing a 10-laser FT-LS source in the near infrared, providing reasonable coverage of the full overtone C-H absorption envelope for hydrocarbon vapors. The basic idea for this sensor is illustrated in Figure 5–15. Analysis similar to PLS techniques already employed for FT-IR spectral data could be used to identify mixture components.38 Such an instrument may be readily assembled from commercially available telecommunications equipment. The main challenge is finding a vendor for the individual laser diodes, since there is low demand for lasers outside of the fiber windows near 1350 nm and 1550 nm. Provided that the cost of addressable light sources continues to decrease, arrays covering larger spectral windows may become available. While several options exist for wavelength separation, the highly developed FT-IR market may influence the design of new solid state spectrometers, and this approach may warrant further consideration.
Figure 5–15. Schematic of a 10-laser FT-LS Source in the Near Infrared.
5.3.5 Observations
Gas sensing using near-infrared lasers will probably increase steadily in popularity. This is in large part due to the ease of transmission of the IR signals through optical fibers, room temperature operation, high signal to noise ratio through phase sensitive detection techniques, and the large telecommunications infrastructure that continues development of electronics that may easily be adapted to gas sensing. Nonetheless, some changes are potentially at hand:
• The replacement of a single laser detecting a single gas by either an addressable source or by a single, broadly tunable laser.
• The use of room temperature operation, mid-infrared lasers (quantum cascade and interband cascade designs). These offer all of the advantages of phase sensitive detection available
0
0.02
0.04
0.06
0.08
0.1
0.12
1.625 1.675 1.725 1.775 1.825 1.875
Wavelength position of 10 diode laseraddressable source
Wavelength (µm)
Abs
orba
nce
(ai
atur
ated
by
gaso
line
vapo
r)r s

Instrumentation for Bench- and Large-scale Test Fixtures 502
with near-infrared DFBs, and have a huge advantage of gas sensing using the fundamental.
vibrational transition
• Microphotonic sensors will employ suites of arrays of near- and mid-infrared devices, and that these devices will gradually displace conventional Michelson interferometer based systems in the laboratory and in the field.
The main technical difficulties associated with this technology center on the availability of DFB lasers. With the contraction of the telecommunications market at the beginning of the 21st century, many fabrication facilities discontinued manufacture of lasers at user-specified wavelengths, producing lasers only within the telecommunications bands near 1330 nm and 1550 nm. Although there has been some supply from foreign manufacturers, obtaining lasers for gas sensing (in particular, O2 near 760 nm) remains challenging. This difficulty exacerbates the main challenge for gas sensing using near infrared DFB lasers, namely, sensing of molecules and mixtures of gases that do not present well resolved vibrational spectra.
5.4 MEASUREMENT OF FIRE SUPPRESSANT CONCENTRATION USING A DIFFERENTIAL INFRARED RAPID AGENT CONCENTRATION SENSOR (DIRRACS)
5.4.1 Introduction
In addition to the LIBS technique described earlier, the NGP developed a second technique for monitoring the concentration of a fire suppressant chemical during a rapidly extinguishment event. This non-dispersive apparatus, the Differential Infrared Rapid Agent Concentration Sensor (DIRRACS), employs a resistively heated source and directly measures the broad, fundamental absorption of the chemical. The design goal was an instrument with a response time of 3 ms that could be used with a variety of fire suppression agents over a concentration range from 1 % to 20 %, with an expanded uncertainty of approximately 10 % of the nominal value. Following an initial design, DIRRACS I, the design goal was met for the fire suppressant HFC-125 (C2HF5) with the improved DIRRACS II.
5.4.2 Original Instrument Design – DIRRACS I
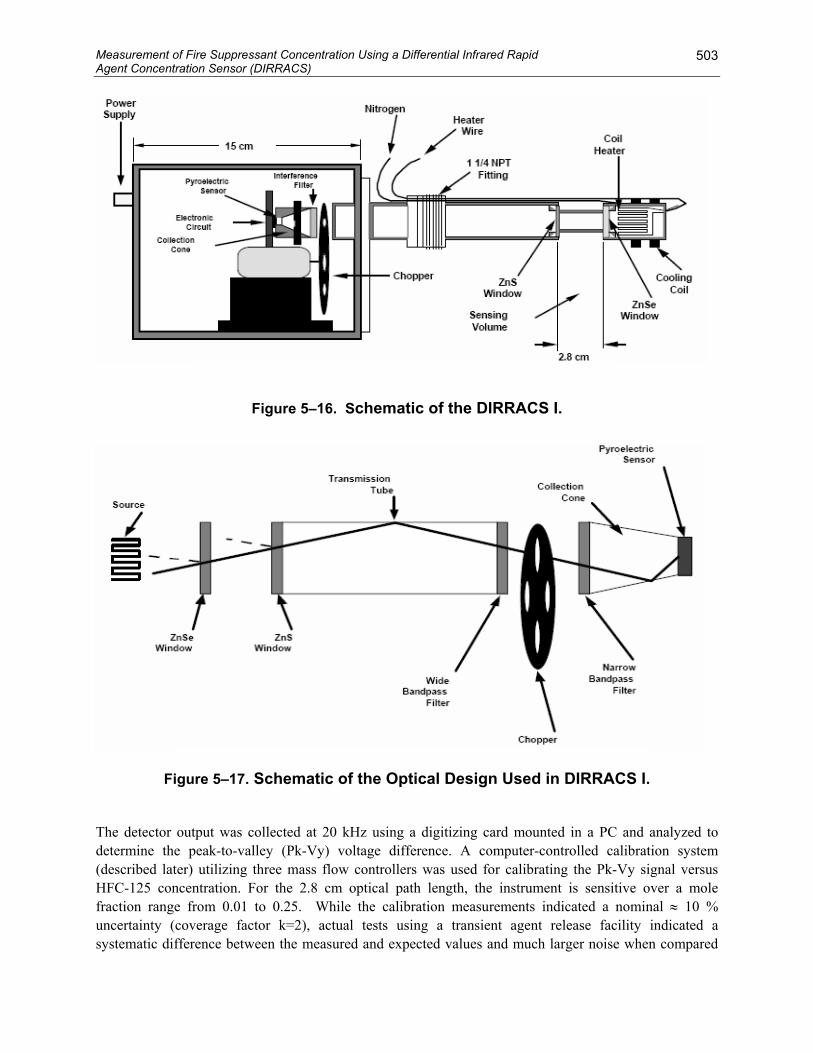
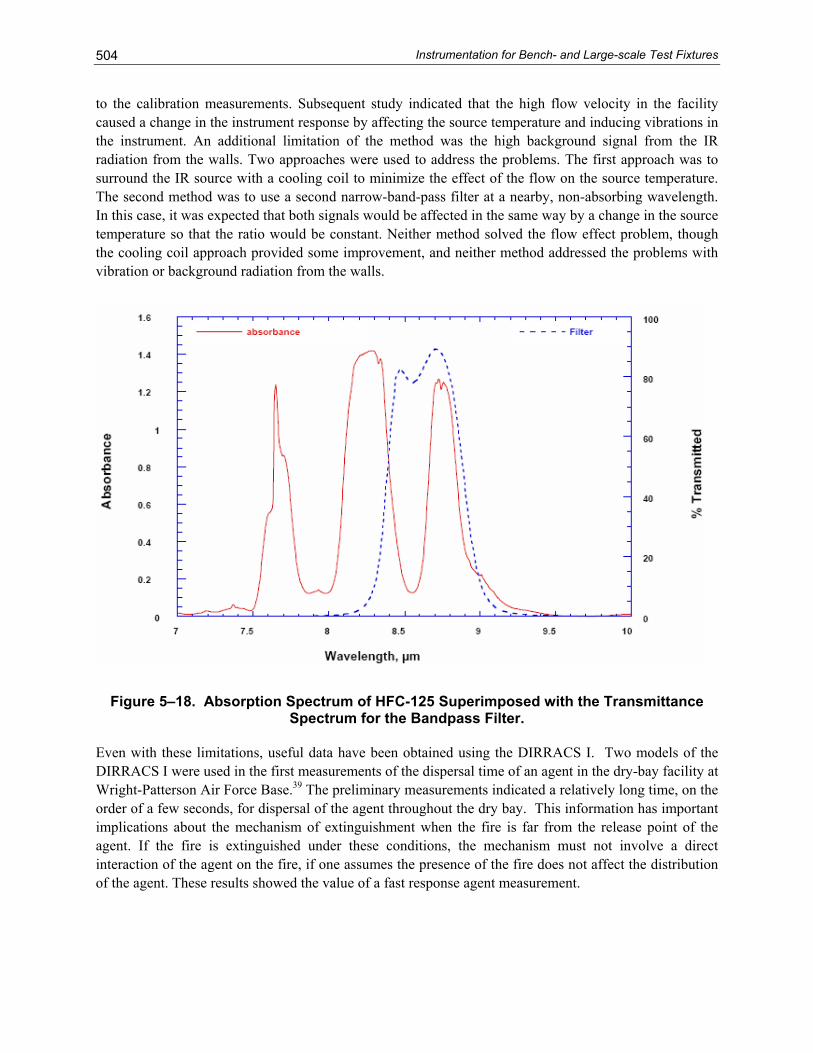
Figure 5–16 is a schematic drawing of the DIRRACS I. Figure 5–17 depicts the optics. A detailed description of the instrument design and theory of operation is given by Pitts et al. at the National Institute of Standards and Technology (NIST).39 Briefly, IR radiation from a coil heater source heated to 500 °C is directed through a 2.8 cm long sample volume. The transmitted beam passes through a long- wavelength cut-off filter to remove IR radiation with wavelength longer than 14 µm, through a chopper operating at 500 Hz, a narrow-band-pass filter transmitting from 8.4 to 8.9 µm, to a LiTaO3 pyroelectric sensor. As shown in Figure 5–18, a narrow-bandpass filter was selected that overlaps with a strong absorption feature for HFC-125. There is also strong IR absorption, resulting from the C-F stretch vibrational modes, in the same spectral region for other agents with C-F bonds including HFC-227ea (C3HF7), FC-218 (C3F8), halon 1301 (CF3Br), and CF3I. The pyroelectric sensor has a built-in FET amplifier. The output signal was increased with a 100x, low-noise amplifier; and frequencies below about 300 Hz were filtered out.
Measurement of Fire Suppressant Concentration Using a Differential Infrared Rapid Agent Concentration Sensor (DIRRACS)
503
Figure 5–16. Schematic of the DIRRACS I.
fference. A computer-controlled calibration system (describ lHFC-125 c tical path length, the instrument is sensitive over a mole fraction nuncertainty systematic difference between the measured and expected values and much larger noise when compared
.
Figure 5–17. Schematic of the Optical Design Used in DIRRACS I.
The detector output was collected at 20 kHz using a digitizing card mounted in a PC and analyzed to determine the peak-to-valley (Pk-Vy) voltage di
ed ater) utilizing three mass flow controllers was used for calibrating the Pk-Vy signal versus oncentration. For the 2.8 cm op
ra ge from 0.01 to 0.25. While the calibration measurements indicated a nominal ≈ 10 % (coverage factor k=2), actual tests using a transient agent release facility indicated a
Instrumentation for Bench- and Large-scale Test Fixtures 504
to the calibration measurements. Subsequent study indicated that the high flow velocity in the facility nge in the instrument response by affecting the socaused a cha urce temperature and inducing vibrations in
the instradiation rosurround th the effect of the flow on the source temperature. The second method was to use a second narrow-band-pass filter at a nearby, non-absorbing wavelength.
rument. An additional limitation of the method was the high background signal from the IR f m the walls. Two approaches were used to address the problems. The first approach was to
e IR source with a cooling coil to minimize
In this case, it was expected that both signals would be affected in the same way by a change in the source temperature so that the ratio would be constant. Neither method solved the flow effect problem, though the cooling coil approach provided some improvement, and neither method addressed the problems with vibration or background radiation from the walls.
Figure 5–18. Absorption Spectrum of HFC-125 Superimposed with the Transmittance Spectrum for the Bandpass Filter.
Even with these limitations, useful data have been obtained using the DIRRACS I. Two models of the DIRRACS I were used in the first measurements of the dispersal time of an agent in the dry-bay facility at Wright-Patterson Air Force Base.39 The preliminary measurements indicated a relatively long time, on the order of a few seconds, for dispersal of the agent throughout the dry bay. This information has important implications about the mechanism of extinguishment when the fire is far from the release point of the agent. If the fire is extinguished under these conditions, the mechanism must not involve a direct interaction of the agent on the fire, if one assumes the presence of the fire does not affect the distribution of the agent. These results showed the value of a fast response agent measurement.

Measurement of Fire Suppressant Concentration Using a Differential Infrared Rapid Agent Concentration Sensor (DIRRACS)
505
5.4.3 Improved Hardware Design – DIRRACS II
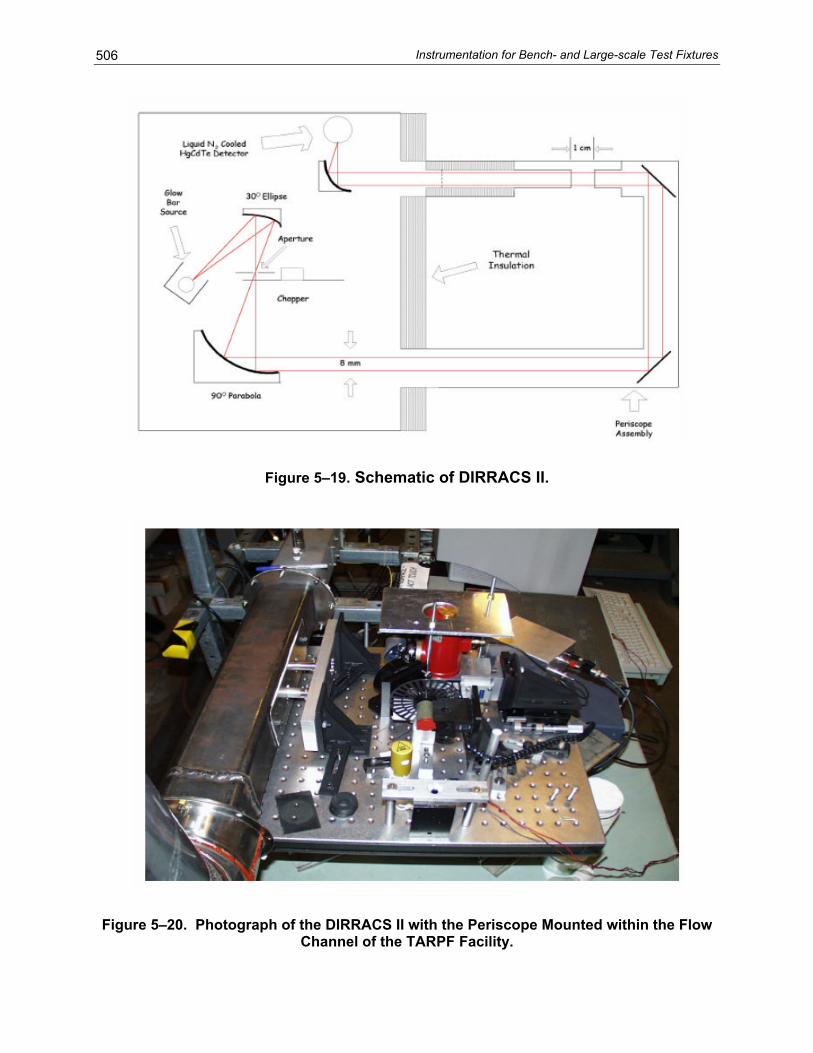
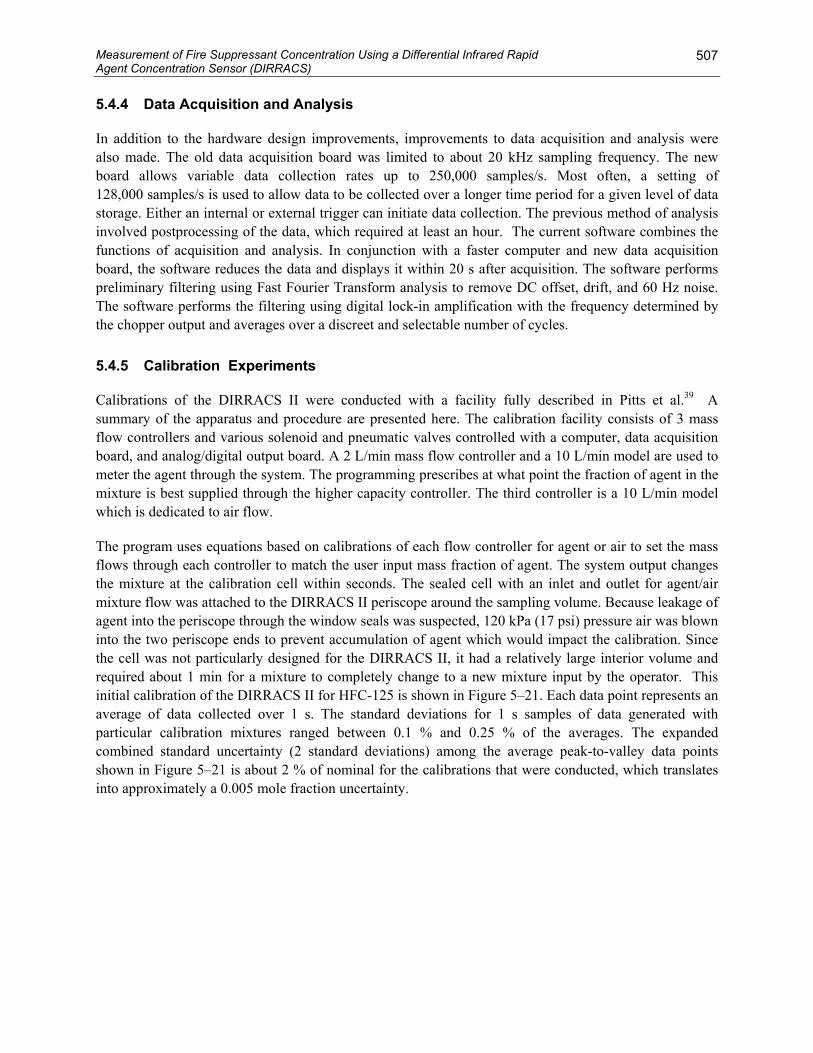
The drawbacks of the DIRRACS I necessitated major modifications to the original design. The objectives were to eliminate the temperature and flow sensitivity of the source, detector, and other components; increase the signal-to-noise ratio; and increase the frequency response. Figure 5–19 is a schematic of the DIRRACS II design, and Figure 5–20 is a photograph of the breadboarded instrument as set up to measure a transient agent release in the Transient Application, Recirculating Pool Fire Apparatus (TARPF), described in Chapter 6 of this book. IR radiation is emitted by the source (cylinder with triangle on top at bottom central) toward an elliptical mirror, reflected through the chopper and pinhole, collimated by a parabolic mirror (behind chopper), through the periscope (attached to the duct at left), reflected by a 90° mirror and a focusing mirror, through a narrow-band-pass filter, and finally detected by a HgCdTe detector (under the plate with the hole).
The key design changes in the DIRRACS II are:40
• The addition of a periscope, for reducing the high noise level of the DIRRACS I at velocity conditions of 10 m/s to 20 m/s. The periscope also allows the sampling volume to be completely is e flow and temperature variations at th tector.
• Reduction in system vibrations by constructing the periscope assembly from standard stainless steel vacuum components. This structure is much more rigid than the previous optical housing.
• Decrease the sample path length by about a factor of two, increasing the practical maximum mole fraction measurable by the instrument from about 0.2 to about 0.5.
• Collimating the IR bean and focusing it through an aperture just before the chopper and using a faster IR detector (HgCdTe), to allow operation of the chopper at frequencies as high as 4000 Hz, while the previous design with a large, unfocussed beam and slow detector was limited to about 400 Hz. This IR source also provided a more stable output with a higher intensity at the wavelength range of interest. The performance of the HgCdTe detector improves with frequency up to 4000 Hz, while the pyroelectric detector response falls off for frequencies above about 50 Hz. The tenfold increase in frequency corresponds to about a tenfold improvement in time response. The new detector also produces nearly square-wave output well above any background signal from extraneous radiation sources. The detector does require liquid N2 cooling, but one filling provides at least 2 h of stable operation.
• Placing the IR source within the instrument housing, eliminating the problems of the high flow affecting the temperature of the source and the movement of the source.
• The elliptical and parabolic mirrors were used to produce an 8 mm collimated beam, which tle (<1 %)
to the IR radiation reaching the detector, while in the previous design as much as 50 % of the IR radiation originated from blackbody radiation from the walls.
olated from the rest of the instrument, so convective measurement location cannot affect the source or de
was ultimately focused on the detector. The background IR radiation contributed lit
Instrumentation for Bench- and Large-scale Test Fixtures 506
Figure 5–19. Schematic of DIRRACS II.
Figure 5–20. Photograph of the DIRRACS II with the Periscope Mounted within the Flow
Channel of the TARPF Facility.
Measurement of Fire Suppressant Concentration Using a Differential Infrared Rapid Agent Concentration Sensor (DIRRACS)
507
5.4.4 Data Acquisition and Analysis
In addition to the hardware design improvements, improvements to data acquisition and analysis were also made. The old data acquisition board was limited to about 20 kHz sampling frequency. The new board allows variable data collection rates up to 250,000 samples/s. Most often, a setting of 128,000 samples/s is used to allow data to be collected over a longer time period for a given level of data storage. Either an internal or external trigger can initiate data collection. The previous method of analysis involved postprocessing of the data, which required at least an hour. The current software combines the functions of acquisition and analysis. In conjunction with a faster computer and new data acquisition board, the software reduces the data and displays it within 20 s after acquisition. The software performs preliminary filtering using Fast Fourier Transform analysis to remove DC offset, drift, and 60 Hz noise. The software performs the filtering using digital lock-in amplification with the frequency determined by the chopper output and averages over a discreet and selectable number of cycles.
5.4.5
Calibrationssummary o onsists of 3 mass flow co oboard, an ameter the ag stem. The programming prescribes at what point the fraction of agent in the mixture bwhich i
The pro mflows throuthe mixturemixture flowagent into thinto the twothe cell wasrequired abinitial calibr ts an average particula ccombined standard uncertaintyshown iinto approxi
Calibration Experiments
of the DIRRACS II were conducted with a facility fully described in Pitts et al.39 A f the apparatus and procedure are presented here. The calibration facility c
ntr llers and various solenoid and pneumatic valves controlled with a computer, data acquisition d nalog/digital output board. A 2 L/min mass flow controller and a 10 L/min model are used to
ent through the sy is est supplied through the higher capacity controller. The third controller is a 10 L/min model s dedicated to air flow.
gra uses equations based on calibrations of each flow controller for agent or air to set the mass gh each controller to match the user input mass fraction of agent. The system output changes at the calibration cell within seconds. The sealed cell with an inlet and outlet for agent/air
was attached to the DIRRACS II periscope around the sampling volume. Because leakage of e periscope through the window seals was suspected, 120 kPa (17 psi) pressure air was blown periscope ends to prevent accumulation of agent which would impact the calibration. Since not particularly designed for the DIRRACS II, it had a relatively large interior volume and
out 1 min for a mixture to completely change to a new mixture input by the operator. This ation of the DIRRACS II for HFC-125 is shown in Figure 5–21. Each data point represen
of data collected over 1 s. The standard deviations for 1 s samples of data generated with r alibration mixtures ranged between 0.1 % and 0.25 % of the averages. The expanded
(2 standard deviations) among the average peak-to-valley data points n Figure 5–21 is about 2 % of nominal for the calibrations that were conducted, which translates
mately a 0.005 mole fraction uncertainty.

Instrumentation for Bench- and Large-scale Test Fixtures 508
Figure 5–21. Calibration plot of Average Normalized Peak-to-valley Signals vs. Volume
Fraction of HFC-125.
5.4.6 Release Tests of HFC-125 in the TARPF Facility
The NIST TARPF facility (Chapter 9) consists of a 2.5 m long duct of 9.2 cm x 9.2 cm square cross section which is connected to a high capacity air compressor. Variable orifice plates allow the compressor to generate air velocities up to 20 m/s in the duct. Various agents can be stored in 1 L and 2 L cylinders. Before a test, a cylinder is filled to a prescribed pressure, which is measured with a pressure transducer inside the cylinder. A release is controlled with a timer that determines the length of time the cylinder solenoid valve is opened. The normal operation of the TARPF facility consists of igniting a flame in a test section and releasing various amounts of agent upstream to observe the extinguishment behavior. For the DIRRACS testing, no flame was ignited, but the air flow and agent release capabilities of the system were utilized. The periscope assembly was mounted 0.5 m downstream of the pool fire zone and about 2 m downstream of the region where the agent is mixed into the air stream.
Over 40 release tests were conducted in the TARPF Facility.40 Each test was conducted with specified settings of air flow, agent vessel pressure, and agent vessel valve opening period. In order to capture
ents of less than 1 s with the data acquisition system, varying combinations of total points collected and mpling frequency were used. The series of tests with the DIRRACS II was used to help characterize the
of pulses of agent as they moved downstream after each release.
evsadistortion

Measurement of Fire Suppressant Concentration Using a Differential Infrared Rapid Agent Concentration Sensor (DIRRACS)
509
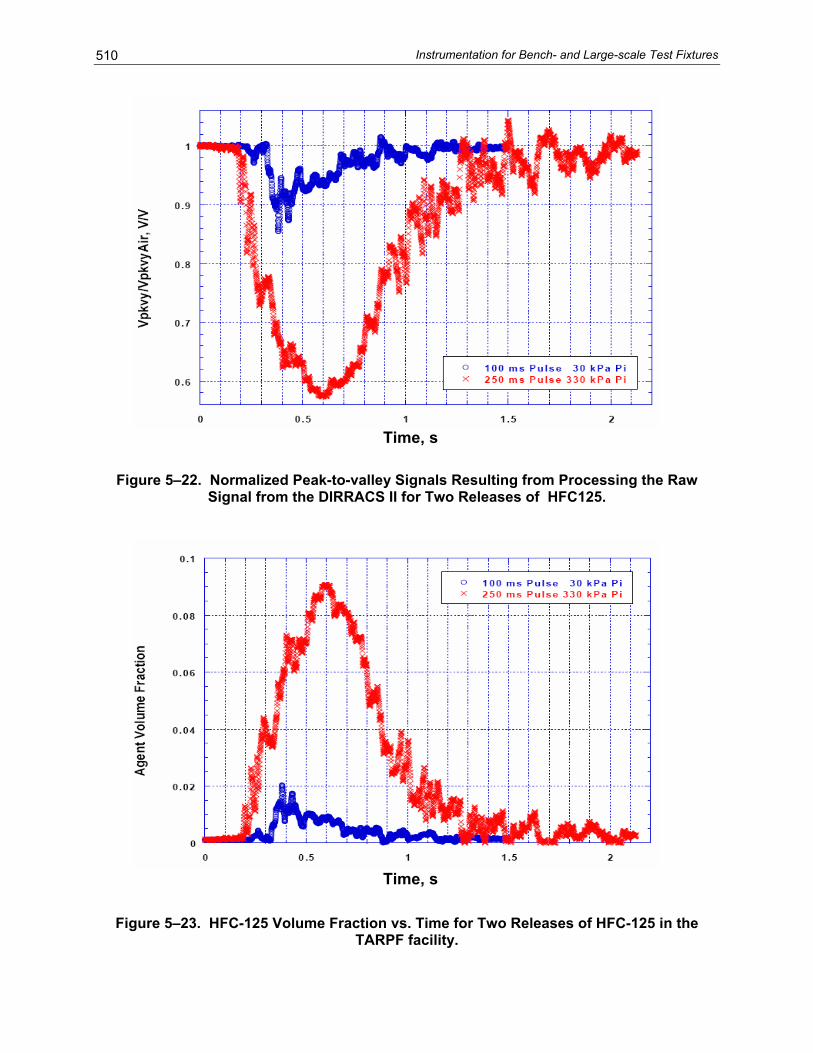
Tinvolved a pulse of 100 ms durati ent pressure. The second was a 250 ms pulse from a 330 kPa pressure. In both cases, the air velocity through the duct was 11 m/s. The
n ng frequency was 128 kHz.
tion normalized by the average of a 1 s sample of data was typically about 0.2 %. This is a substantial improvement over the
iation of 23 % under the same conditions.
ere from the right, high mounting position just behind the turret. There was only one DIRRACS II unit, so concentration was monitored at two locations in different tests. Figure
ter 1.5 s the volume fraction is slightly higher at the lower position, 0.09 compared to about 0.07. After 2 min, the HFC-125 volume fraction was in the range 0.03 to 0.09 compared to an estimate of 0.095 based on a well mixed distribution throughout the volume of the vehicle.
wo of the HFC-125 release tests that represent the extremes of the series are described here. The first on from a cylinder a 30 kPa initial ag
choppi g frequency was 2 kHz and the sampli
Figure 5–22 shows the recorded peak-to-valley voltage normalized by the background value, which is proportional to the IR intensity incident on the detector. The abrupt decrease in the voltage is a result of the IR absorption by the HFC-125. The width in the dip in the voltage is slightly larger than the release time because of downstream mixing effects. Figure 5–23 shows the calculated evolution of the volume fractions of the chemical.
The different pulse durations are apparent, although the step releases become significantly spread out. The test data indicate that a 0.005 volume fraction of HFC-125 can easily be detected and differentiated from background noise. Also, turbulent fluctuations on the order of 5 ms to 10 ms are clearly resolved due to a combination of the 2 kHz chopping frequency and the Fourier Transform high frequency filtering. For neat air flowing past the periscope in the TARPF facility, the standard devia
DIRRACS I, which had a standard dev
5.4.7 HFC-125 Release Tests in a Bradley Vehicle
A series of 11 agent release tests were carried out in a Bradley armored personnel carrier at the Aberdeen Test Center in order to characterize the DIRRACS II response to temperature and flow effects during transient agent concentration measurements.40 The vehicle is shown in Figure 5–24. The extinguishing agent, HFC-125, was released in amounts ranging from about 2 kg up to about 4 kg at a fill pressure of 5.2 MPa. All of the releases w
5–25 shows the high location, which was near head height for an occupant in the left side of the vehicle, about halfway between the turret and the rear bulkhead. The instrument was located between two rectangular structures representing the location and approximate size of two occupants of the vehicle. The second, low location was at about waist height.
The agent volume fraction and the cylinder pressure are plotted versus time for the DIRRACS II in the high position in Figure 5–26. The HFC-125 reached the measuring position 275 ms after the release. The peak agent volume fraction was 0.22, and decreased to a value of about 0.07 after 1.5 s. Before the agent arrival, the background volume fraction is close to zero and averages about 0.0006. After arrival of the agent, the volume fractions range between 0.05 and 0.21, which overwhelms by two orders of magnitude the background level and by at least a factor of 25 the effect of pressure or vibration noise.
Figure 5–27 compares the HFC-125 concentration in the lower location to the same upper location result in the prior figure. In the lower position, the arrival time increases from 300 ms to about 400 ms, and the peak volume fraction decreases to about 0.12; however, af
Instrumentation for Bench- and Large-scale Test Fixtures 510
Time, s
Figure 5–22. Normalized Peak-to-valley Signals Resulting from Processing the RawSignal from the DIRRACS II for Two Releases of HFC125.
Time, s
Figure 5–23. HFC-125 Volume Fraction vs. Time for Two Releases of HFC-125 in the TARPF facility.

Measurement of Fire Suppressant Concentration Using a Differential Infrared Rapid Agent Concentration Sensor (DIRRACS)
511
performing agent
Figure 5–25. Interior of the Bradley
Figure 5–24. Bradley armored personnel carrier modified for
release and fire suppression studies.
Vehicle Showing the periscope of the DIRRACS II in the “high” location. The Two Rectangular Structures Simulate Occupants.

Instrumentation for Bench- and Large-scale Test Fixtures 512
Figure 5–26. HFC-125 Volume Fraction and Cylinder Pressure vs. Time at the Upper
Figure 5–27. HFC-125 Volume Fractions vs. Time At the High and low Positions During Two Different Releases.
Measurement Position.

Conclusion 513
5.4
DIRRACS II meets the design needs for monitoring halon replacement chemicals:
• Response time: The instrument monitored agent releases with a 4 ms time response and can capture the structure of distinct events that are less than 10 ms in duration.
• Dynamic range: The instrument measured HFC-125 volume fractions from 0.01 to 0.25 with an expanded uncertainty of 0.005.
• Versatility: The DIRRACS II can be used for any agents with the C-F bond using the current filter or replacing it with one more closely matched to an agent’s absorption spectrum.
• Ruggedness: The instrument is portable and withstood the vibration from the agent release. The DIRRACS II could be useful for monitoring agent concentration in a fire environment provided some protection is added to shield the periscope and other exposed components from the corrosive gases produced by decomposition of the agent in the fire.
It was significant that the measured times for the HFC-125 to reach the measuring positions were longer than the desired time to extinguish the fire. This information could be useful for understanding the mechanism of fire suppression for the fire tests performed in the Bradley vehicle.
d
gen,
hy Full im rem
nt in
.8 Assessment
The design is ready to be adapted for reproduction or commercialization. A manual41 has been prepareto assist in the fabrication of copies of DIRRACS II and to provide operation instructions to users.
5.5 CONCLUSION
Under the NGP, researchers at the Army Research Laboratory and the National Institute of Standards andTechnology have developed techniques for measuring the concentrations of fuel vapors, oxy
drogen fluoride, and fire suppressants during real-scale, high-speed fire suppression tests.plementation of all of these techniques into routine testing has not yet been realized, but the discreteaining technological barriers to this have been identified, showing the way to full measurement
capability in future fire tests.
The use of these instruments has already produced insights into the fluid dynamics of suppressant release and distribution, the potential for flame re-ignition, and the advantage of rapid flame extinguishmecontaining the concentrations of noxious combustion products, all under realistic fire conditions.
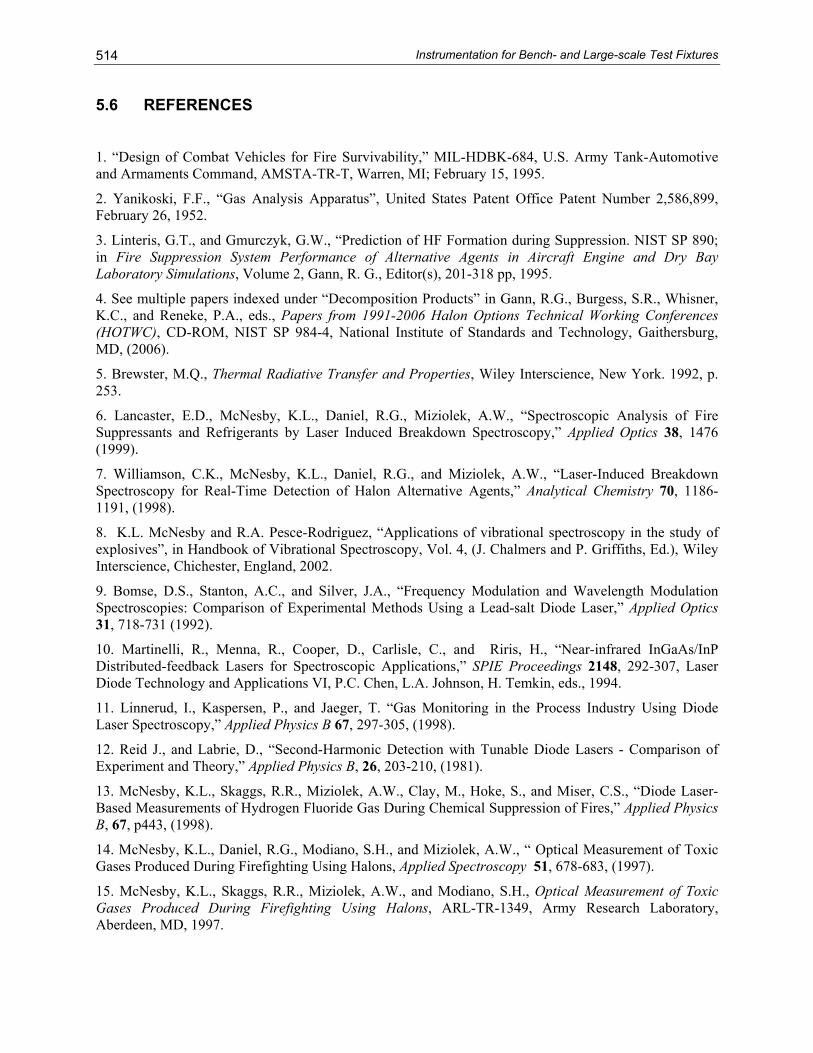
Instrumentation for Bench- and Large-scale Test Fixtures 514
5.6 REFERENCES
1. “Design of Combat Vehicles for Fire Survivability,” MIL-HDBK-684, U.S. Army Tank-Automotive and Armaments Command, AMSTA-TR-T, Warren, MI; February 15, 1995.
2. Yanikoski, F.F., “Gas Analysis Apparatus”, United States Patent Office Pat 6,899, February 26, 1952.
3. Linteris, G.T., and Gmurczyk, G.W., “Prediction of HF Formation during Sup ; in Fire Suppression System Performance of Alternative Agents in Aircraft Engine and Dry Bay Laboratory Simulations, Volume 2, Gann, R. G., Editor(s), 201-318 pp, 1995.
4. See multiple papers indexed under “Decomposition Products” in Gann, R.G., B ner, K.C., and Reneke, P.A., eds., Papers from 1991-2006 Halon Options Technica rences (HOTWC), CD-ROM, NIST SP 984-4, National Institute of Standards and Technology, Gaithersburg, MD, (2006).
5. Brewster, M.Q., Thermal Radiative Transfer and Properties, Wiley Interscience, New York. 1992, p. 253.
6. Lancaster, E.D., McNesby, K.L., Daniel, R.G., Miziolek, A.W., “Spectroscopic Analysis of Fire Suppressants and Refrigerants by Laser Induced Breakdown Spectroscopy,” Applied Optics 38, 1476 (1999).
7. Williamson, C.K., McNesby, K.L., Daniel, R.G., and Miziolek, A.W., “Laser-Induced Breakdown Spectroscopy for Real-Time Detection of Halon Alternative Agents,” Analytical Chemistry 70, 1186-1191, (1998).
8. K.L. McNesby and R.A. Pesce-Rodriguez, “Applica vibrational spectroscopy in the study of explosives”, in Handbook of Vibrational Spectroscopy, Vol. 4, (J. Chalmers and P. Griffiths, Ed.), Wiley Interscience, Chichester, England, 2002.
9. Bomse, D.S., Stanton, A.C., and Silver, J.A., “Frequency Modulation and Wavelength Modulation Spectroscopies: Comparison of Experimental Methods Using a Lead-salt Diode Laser,” Applied Optics 31, 718-731 (1992).
10. Martinelli, R., Menna, R., Cooper, D., Carlisle, C., and Riris, H., “Near-infrared InGaAs/InP Distributed-feedback Lasers for Spectroscopic Applicat aser Diode Technology and Applications VI, P.C. Chen, L.A.
11. Linnerud, I., Kaspersen, P., and Jaeger, T. “Gas M e Laser Spectroscopy,” Applied Physics B 67, 297-305, (19
12. Reid J., and Labrie, D., “Second-Harmonic Detection with Tunable Diode Lasers - Comparison of Experiment and Theory,” Applied Physics B, 26, 203-210, (1981).
13. McNesby, K.L., Skaggs, R.R., Miziolek, A.W., Clay M., Hoke, S., and Miser, C.S., “Diode Laser-Based Measurements of Hydrogen Fluoride Gas During Chemical Suppression of Fires,” Applied Physics B, 67, p443, (1998).
14. McNesby, K.L., Daniel, R.G., Modiano, S.H., and Miziolek, A.W., “ Optical Measurement of Toxic Gases Produced During Firefighting Using Halons, Applied Spectroscopy 51, 678-683, (1997).
15. McNesby, K.L., Skaggs, R.R., Miziolek, A.W., and Modiano, S.H., Optical Measurement of Toxic Gases Produced During Firefighting Using Halons, ARL-TR-1349, Army Research Laboratory, Aberdeen, MD, 1997.
ent Number 2,58
pression. NIST SP 890
urgess, S.R., Whisl Working Confe
tions of
ions,” SPIE Proceedings 2148, 292-307, LJohnson, H. Temkin, eds., 1994.
onitoring in the Process Industry Using Diod98).
,

References 515
16. McNesby, K.L., Skaggs, R.R., Miziolek, A.W., Daniel, R.G., and Miser, C.S., “Near-Infrared Tunable Laser Diagnostics in Laboratory Scale Flames,” Proceedings of the Sixth Topical Meeting on Laser Applications to Chemical and Environmental Analysis, Optical Society of America, Orlando, FL, p. 203, March, 1998.
17. McNesby, K.L., Skaggs, R.R., Miziolek, A.W., Clay, M., Hoke, S., and Miser, C.S., “Diode Laser-Based Measurements of Hydrogen Fluoride Gas During Chemical Suppression of Fires,” ARL-TR –1785, Army Research Laboratory Aberdeen, MD, 1998.
18. Skaggs, R.R., Daniel, R.G., Miziolek, A.W., McNesby, K.L., Herud, C., Bolt, W.R., and Horton, D., “Diode Laser Measurements of HF Concentrations Produced From Heptane/Air Pan Fires Extinguished By HFC-236, HFC-227EA, HFC-236 Plus APP, or HFC-227EA Plus APP,” Applied Spectroscopy 53, 1143, (1999).
19. McNesby, K.L., Wainner, R.T., Daniel, R.G., Skaggs, R.R., Morris, J.B., Miziolek, A.W., Jackson, W.M., and McLaren, I.A., “Detection and Measurement of Middle-Distillate Fuel Vapors by Use of Tunable Diode Lasers,” Applied Optics, 40, 840-845 (2001).
20. Wormhoudt, J, ed., Infrared Methods for Gaseous Measurements - Theory and Practice, Marcel-Dekker, New York, 1985;
21. Guenther, P.L., Stedman, D.H., Bishop, G.A., Beaton S.P., Bean J.H., and Quine, R.W., “A ydrocarbon Detector for the Remote Sensing of Vehicle Exhaust Emissions,” Review of Scientific
Ins
22. Ferraro, J.R., and Basile, L.J., Fourier Transform Infrared Spectroscopy: Applications to Chemical , Vols. 1-3, Academic Press, New York, 1978.
23. http://www.brandtinst.com/biosystems/appnotes/equiv3.htm.
24. Modiano, S.H., McNesby, K.L., Marsh, P.E., Bolt, W., and Herud, C., “Quantitative Measurements by Fourier Transform Infrared Spectroscopy of Toxic Gas Production During Inhibition of JP-8 Fires by CF3Br and C3F7H,” Applied. Optics 35, 4004-4008, (1996).
25. Griffiths, P.R., Hirsche, and Manning, C.J., “Ultra-rapid-scanning Fourier Transform Infrared Spectrometry,” Vibrational Spectroscopy 19, 165-176, (1999).
26. Naegeli, D.W., and Childress, K.H., “Lower Explosion Limits and Compositions of Middle Distillate Fuel Vapors,” Proceedings of the Fall Meeting of the Society of Automotive Engineers, SAE paper # 982485, (1998), pp. 1-7.
27. Kuchta, J.M. and R.G. Clodfelter, Aircraft Mishap Fire Pattern Investigations. Final Report, APWAL-TR-85-2057, Aero Propulsion Laboratory, Wright Patterson Air Force Base, OH, 1985.
28. Baer, M.R., and Gross, R.J., “Extended Modeling Studies of the TWA 800 Center-Wing Fuel Tank Explosion,” Report SAND2000-0445, Sandia National Laboratories, Albuquerque, NM, 2000.
29. Shepherd, J., “Learning from a Tragedy: Explosions and Flight 800,” Engineering and Science, 2, 18-29, (1998).
30. Werle, P., “A Review of Recent Advances in Semiconductor Laser Based Gas Monitors,” Spectrochimica Acta A, 54, 197-236, (1998).
31. Hertzberg, G., Infrared and Raman Spectra, Van Nostrand Reinhold Co., New York, 1945.
3 “High-Sensitivity Region,” Applied Optics, 39, 5006-5011
Htruments 66, 3024-3029, (1995)
Systems
2. McNesby, K.L., Wainner, R.T., Daniel, R.G., Miziolek, A.W., Jackson, W.M., and McLaren, I.A., Laser Absorption Measurements of Broadband Absorbers in the Near-Infrared Spectral
, (2000).
Instrumentation for Bench- and Large-scale Test Fixtures 516
33. Griffiths, P.R., and de Haseth, J.A., Fourier Transform Infrared Spectrometry, Wiley-Interscience,
34. McN bW.M., and Tunable Dio
35. CooSeries,” Ma
36. Rot aDevi, M., F Toth, R.A., “ eSpectroscop
37. McNesApplied Op
Harris, R. H., Jr.; Hess, D. E., “Real-Time Suppressant Concentration Measurement,” in Fire Suppression System Performance of
40. Johnsson, E.L., Johnsson, Mulholland, G.W., Fraser, G.T., Leonov, I.I., and Golubiatnikove, G.Y., nse Fire Suppressant Concentration Meter, NIST TN 1464, National
Gaithersburg, MD, 2004.
New York, 1986.
es y, K.L., Wainner, R.T., Daniel, R.G., Skaggs, R.R., Morris, J.B., Miziolek, A.W., Jackson, McLaren, I.A., “Detection and Measurement of Middle-Distillate Fuel Vapors by Use of de Lasers,” Applied Optics, 40, 840-845, (2001).
ley, J.W., and Tukey, J.W., “An Algorithm for the Machine Calculation of Complex Fourier th. Comput., 19, 297, (1965).
hm n, L.S., Gamache, R.R., Tipping, R.H., Rinsland, C.P., Smith, M.A.H., Chris, D., Benner, V., laud, J-M., Camy-Peyret, C., Perrin, A., Goldman, A., Massie, S.T., Brown, L.R., and
Th Hitran Molecular Database: Editions of 1991 and 1992,” Journal of Quantitative y and Radiative Transfer 48, 469, (1992).
by, K.L., and Miziolek, A.W., “Fourier Transform Laser Spectroscopy,” Applied Optics, tics, 42, 2127-2131, (2003).
38. Zhu, X., and Cassidy, D.T., “Liquid Detection with InGaAsP Semiconductor Lasers Having Multiple Short External Cavities,” Applied Optics-LP 35, 4689-4693, (1996).
39. Pitts, W. M.; Mulholland, G. W.; Breuel, B. D.; Johnsson, E. L.; Chung, S.;
Alternative Agents in Aircraft Engine and Dry Bay Laboratory Simulations. Volume 2, Gann, R. G., ed., NIST SP 890, National Institute of Standards and Technology, Gaithersburg, MD, 1995.
Development of a Fast-RespoInstitute of Standards and Technology,
41. Johnsson, E.L., Mulholland, G.W., Fraser, G.T., Leonov, I.I., and Golubiatnikove, G.Y., Description and Usage of a Fast-Response Fire Suppressant Concentration Meter, NIST TN 1463, National Institute of Standards and Technology, Gaithersburg, MD, 2004.