Chapter 5 First-Year Courses in Four-Year Colleges and ...
21
Chapter 5 First-Year Courses in Four-Year Colleges and Universities The tables in this chapter explore the mathematics and statistics courses of four-year colleges and univer- sities that are taught generally to beginning students. Tables S.5, S.6, S.7, S.8, and S.12 from Chapter 1, are broken down by the level of department in this chapter, to provide more information about the following courses, which tend to be the focus of the early college experience: 1. Precollege and Introductory-Level Mathematics (Appendix I) 2. Mainstream Calculus (Tables FY.1) 3. Non-Mainstream Calculus (Table FY.2) 4. Introductory Statistics (Tables FY.3-FY.9). Previous CBMS surveys collected data on the appointment type of faculty who taught introductory level courses, but this data was not collected in 2015; course enrollments for individual courses are available in Appendix I. Mainstream Calculus courses are the calculus courses needed for the mathematics major, or for applications in the physical sciences or engi- neering. Other calculus courses, which tend to be for business, social science, or life science majors, are labeled Non-Mainstream Calculus. Beginning courses build the interest and skills that students need for further study of mathematics and statistics, and the many other disciplines that use mathematics or statistics. These courses constitute a substantial portion of four-year mathematics and statistics departments’ course enrollments. Hence these courses merit the careful consideration of the mathematical sciences community. The issues addressed in this chapter are the course enrollments, the appointment type of the course instructors, and pedagogy used in teaching Introductory Statistics. Standard errors: As the estimates produced from the survey data are broken down more finely, the esti- mates are made over smaller sets of departments, and the standard errors typically increase, sometimes to magnitudes that make the estimates rather uncertain. This phenomenon occurs particularly in the masters- level mathematics and statistics departments, which are smaller in number, and possibly less homoge- neous, than the other levels of departments. In this chapter, data are broken down quite finely, and the standard errors become an issue. In the text that follows, the standard error (SE) in many of the estimates is provided along with the estimate (e.g. enrollment of 255,000 (SE 23,000)); the standard errors for all CBMS2015 tables can be found in Appendix VIII. The change in an estimate from an estimate in a previous survey is often expressed both as percentage change, and as the number of SEs that change represents (e.g. “increased 21% (1.7 SEs)”). Highlights of Chapter 5 A. Enrollments • The largest estimated percentage growth in mathematics course enrollment from 2010 to 2015 occurred in precollege-level courses, which increased 21% (1.7 SEs) from fall 2010 to fall 2015. The largest estimated total mathematics enrollments in fall 2015 occurred in the introduc- tory-level courses, as was observed, also, in the three previous CBMS surveys, and introductory courses had the second largest growth in estimated enrollment from fall 2010 to fall 2015, up 14% (1.6 SEs) (see Chapter 1, Table S.4). Chapter 3, Table E.2, indicates that much of the increase occurred at the doctoral-level mathematics departments, where the percentage increase in enrollments in intro- ductory mathematics courses was 36% (1.6 SEs) (compared to increases of 6% at masters-level and 4% at bachelors-level mathematics departments). • Mainstream Calculus I (non-distance learning) had estimated total enrollment, in fall 2015, of roughly 255,000 (SE 23,000), up 9% (0.9 SEs) from fall 2010, up 27% (2.3 SEs) from fall 2005 (Chapter 1, Table S.5), and up 34% (2.8 SEs) from fall 2000 (CBMS2005, Chapter 1, Table S.7, p.17). By Table FY.1, which breaks down Table S.5 of Chapter 1 by level of department, we see that the enrollment gains took place at the masters and doctoral-level departments, and enrollments declined at the bachelors-level departments. From Table FY.1 we see that across all levels of departments combined 57% of the estimated enrollments were taught in lecture/recitation format, and 53% of the estimated enrollments were at the doctoral-level departments. 133
Transcript of Chapter 5 First-Year Courses in Four-Year Colleges and ...

Chapter 5
First-Year Courses in Four-Year Colleges and Universities
The tables in this chapter explore the mathematics and statistics courses of four-year colleges and univer-sities that are taught generally to beginning students. Tables S.5, S.6, S.7, S.8, and S.12 from Chapter 1, are broken down by the level of department in this chapter, to provide more information about the following courses, which tend to be the focus of the early college experience:1. Precollege and Introductory-Level Mathematics
(Appendix I)
2. Mainstream Calculus (Tables FY.1)
3. Non-Mainstream Calculus (Table FY.2)
4. Introductory Statistics (Tables FY.3-FY.9).Previous CBMS surveys collected data on the
appointment type of faculty who taught introductory level courses, but this data was not collected in 2015; course enrollments for individual courses are available in Appendix I. Mainstream Calculus courses are the calculus courses needed for the mathematics major, or for applications in the physical sciences or engi-neering. Other calculus courses, which tend to be for business, social science, or life science majors, are labeled Non-Mainstream Calculus.
Beginning courses build the interest and skills that students need for further study of mathematics and statistics, and the many other disciplines that use mathematics or statistics. These courses constitute a substantial portion of four-year mathematics and statistics departments’ course enrollments. Hence these courses merit the careful consideration of the mathematical sciences community. The issues addressed in this chapter are the course enrollments, the appointment type of the course instructors, and pedagogy used in teaching Introductory Statistics.
Standard errors: As the estimates produced from the survey data are broken down more finely, the esti-mates are made over smaller sets of departments, and the standard errors typically increase, sometimes to magnitudes that make the estimates rather uncertain. This phenomenon occurs particularly in the masters-level mathematics and statistics departments, which are smaller in number, and possibly less homoge-neous, than the other levels of departments. In this chapter, data are broken down quite finely, and the standard errors become an issue.
In the text that follows, the standard error (SE) in many of the estimates is provided along with the estimate (e.g. enrollment of 255,000 (SE 23,000)); the standard errors for all CBMS2015 tables can be found in Appendix VIII. The change in an estimate from an estimate in a previous survey is often expressed both as percentage change, and as the number of SEs that change represents (e.g. “increased 21% (1.7 SEs)”).
Highlights of Chapter 5
A. Enrollments
• The largest estimated percentage growth in mathematics course enrollment from 2010 to 2015 occurred in precollege-level courses, which increased 21% (1.7 SEs) from fall 2010 to fall 2015. The largest estimated total mathematics enrollments in fall 2015 occurred in the introduc-tory-level courses, as was observed, also, in the three previous CBMS surveys, and introductory courses had the second largest growth in estimated enrollment from fall 2010 to fall 2015, up 14% (1.6 SEs) (see Chapter 1, Table S.4). Chapter 3, Table E.2, indicates that much of the increase occurred at the doctoral-level mathematics departments, where the percentage increase in enrollments in intro-ductory mathematics courses was 36% (1.6 SEs) (compared to increases of 6% at masters-level and 4% at bachelors-level mathematics departments).
• Mainstream Calculus I (non-distance learning) had estimated total enrollment, in fall 2015, of roughly 255,000 (SE 23,000), up 9% (0.9 SEs) from fall 2010, up 27% (2.3 SEs) from fall 2005 (Chapter 1, Table S.5), and up 34% (2.8 SEs) from fall 2000 (CBMS2005, Chapter 1, Table S.7, p.17). By Table FY.1, which breaks down Table S.5 of Chapter 1 by level of department, we see that the enrollment gains took place at the masters and doctoral-level departments, and enrollments declined at the bachelors-level departments. From Table FY.1 we see that across all levels of departments combined 57% of the estimated enrollments were taught in lecture/recitation format, and 53% of the estimated enrollments were at the doctoral-level departments.
133
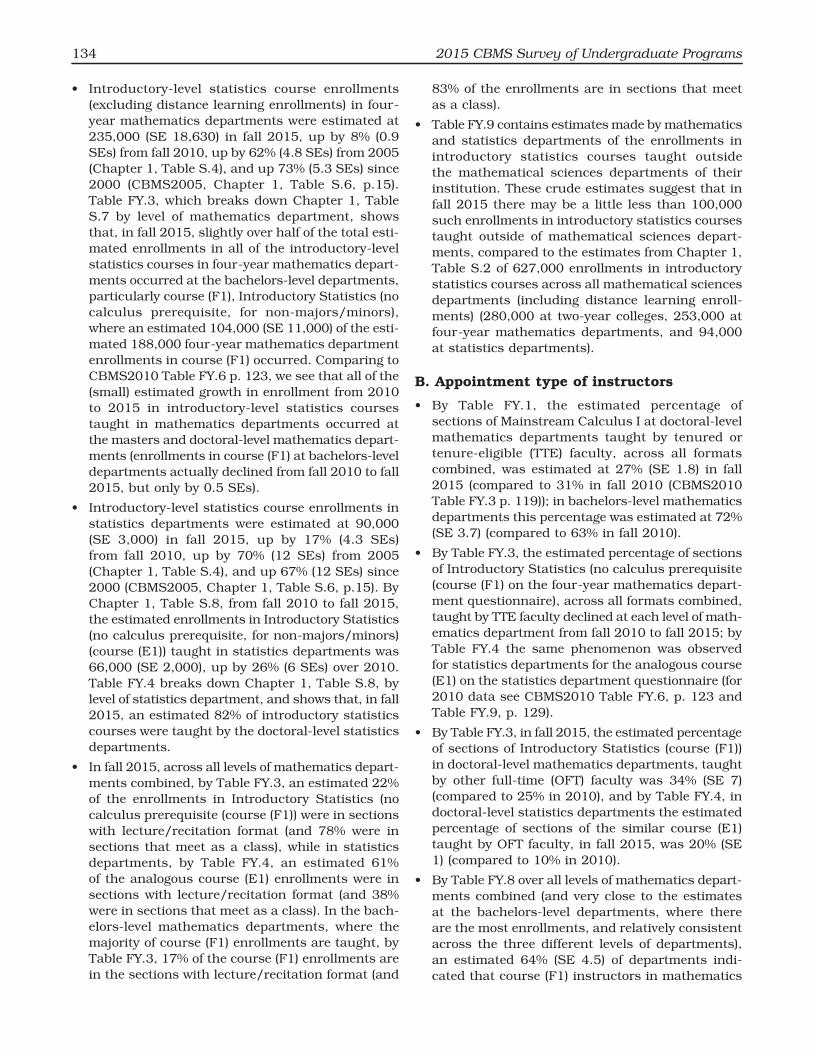
134 2015 CBMS Survey of Undergraduate Programs
• Introductory-level statistics course enrollments (excluding distance learning enrollments) in four-year mathematics departments were estimated at 235,000 (SE 18,630) in fall 2015, up by 8% (0.9 SEs) from fall 2010, up by 62% (4.8 SEs) from 2005 (Chapter 1, Table S.4), and up 73% (5.3 SEs) since 2000 (CBMS2005, Chapter 1, Table S.6, p.15). Table FY.3, which breaks down Chapter 1, Table S.7 by level of mathematics department, shows that, in fall 2015, slightly over half of the total esti-mated enrollments in all of the introductory-level statistics courses in four-year mathematics depart-ments occurred at the bachelors-level departments, particularly course (F1), Introductory Statistics (no calculus prerequisite, for non-majors/minors), where an estimated 104,000 (SE 11,000) of the esti-mated 188,000 four-year mathematics department enrollments in course (F1) occurred. Comparing to CBMS2010 Table FY.6 p. 123, we see that all of the (small) estimated growth in enrollment from 2010 to 2015 in introductory-level statistics courses taught in mathematics departments occurred at the masters and doctoral-level mathematics depart-ments (enrollments in course (F1) at bachelors-level departments actually declined from fall 2010 to fall 2015, but only by 0.5 SEs).
• Introductory-level statistics course enrollments in statistics departments were estimated at 90,000 (SE 3,000) in fall 2015, up by 17% (4.3 SEs) from fall 2010, up by 70% (12 SEs) from 2005 (Chapter 1, Table S.4), and up 67% (12 SEs) since 2000 (CBMS2005, Chapter 1, Table S.6, p.15). By Chapter 1, Table S.8, from fall 2010 to fall 2015, the estimated enrollments in Introductory Statistics (no calculus prerequisite, for non-majors/minors) (course (E1)) taught in statistics departments was 66,000 (SE 2,000), up by 26% (6 SEs) over 2010. Table FY.4 breaks down Chapter 1, Table S.8, by level of statistics department, and shows that, in fall 2015, an estimated 82% of introductory statistics courses were taught by the doctoral-level statistics departments.
• In fall 2015, across all levels of mathematics depart-ments combined, by Table FY.3, an estimated 22% of the enrollments in Introductory Statistics (no calculus prerequisite (course (F1)) were in sections with lecture/recitation format (and 78% were in sections that meet as a class), while in statistics departments, by Table FY.4, an estimated 61% of the analogous course (E1) enrollments were in sections with lecture/recitation format (and 38% were in sections that meet as a class). In the bach-elors-level mathematics departments, where the majority of course (F1) enrollments are taught, by Table FY.3, 17% of the course (F1) enrollments are in the sections with lecture/recitation format (and
83% of the enrollments are in sections that meet as a class).
• Table FY.9 contains estimates made by mathematics and statistics departments of the enrollments in introductory statistics courses taught outside the mathematical sciences departments of their institution. These crude estimates suggest that in fall 2015 there may be a little less than 100,000 such enrollments in introductory statistics courses taught outside of mathematical sciences depart-ments, compared to the estimates from Chapter 1, Table S.2 of 627,000 enrollments in introductory statistics courses across all mathematical sciences departments (including distance learning enroll-ments) (280,000 at two-year colleges, 253,000 at four-year mathematics departments, and 94,000 at statistics departments).
B. Appointment type of instructors
• By Table FY.1, the estimated percentage of sections of Mainstream Calculus I at doctoral-level mathematics departments taught by tenured or tenure-eligible (TTE) faculty, across all formats combined, was estimated at 27% (SE 1.8) in fall 2015 (compared to 31% in fall 2010 (CBMS2010 Table FY.3 p. 119)); in bachelors-level mathematics departments this percentage was estimated at 72% (SE 3.7) (compared to 63% in fall 2010).
• By Table FY.3, the estimated percentage of sections of Introductory Statistics (no calculus prerequisite (course (F1) on the four-year mathematics depart-ment questionnaire), across all formats combined, taught by TTE faculty declined at each level of math-ematics department from fall 2010 to fall 2015; by Table FY.4 the same phenomenon was observed for statistics departments for the analogous course (E1) on the statistics department questionnaire (for 2010 data see CBMS2010 Table FY.6, p. 123 and Table FY.9, p. 129).
• By Table FY.3, in fall 2015, the estimated percentage of sections of Introductory Statistics (course (F1)) in doctoral-level mathematics departments, taught by other full-time (OFT) faculty was 34% (SE 7) (compared to 25% in 2010), and by Table FY.4, in doctoral-level statistics departments the estimated percentage of sections of the similar course (E1) taught by OFT faculty, in fall 2015, was 20% (SE 1) (compared to 10% in 2010).
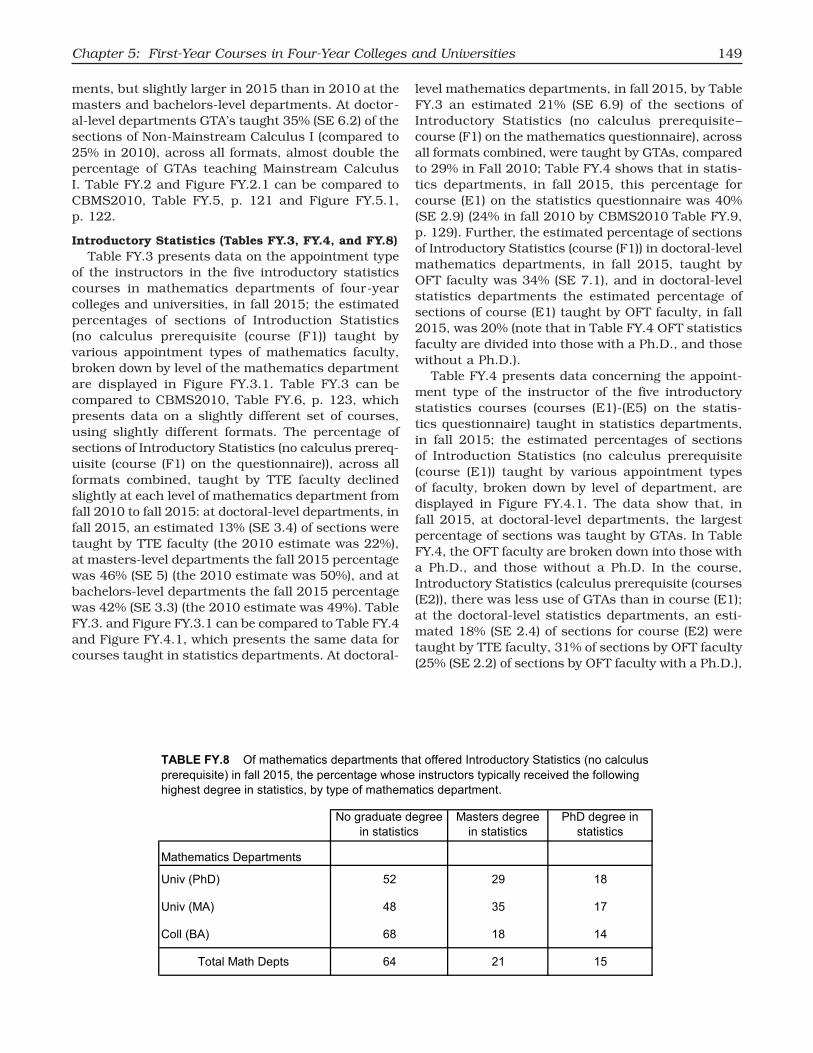
• By Table FY.8 over all levels of mathematics depart-ments combined (and very close to the estimates at the bachelors-level departments, where there are the most enrollments, and relatively consistent across the three different levels of departments), an estimated 64% (SE 4.5) of departments indi-cated that course (F1) instructors in mathematics

Chapter 5: First-Year Courses in Four-Year Colleges and Universities 135
departments typically had no graduate degree in statistics, 21% (SE 4.4) had a Master’s degree in statistics, and 15% (SE 3.5) had a Ph.D. in statis-tics.
C. Average Section Size
• The estimated average size of Mainstream Calculus I sections increased slightly, from fall 2010 to fall 2015, at the doctoral and masters-level mathe-matics departments; for example, by Table FY.1, at doctoral-level mathematics departments, in fall 2015, the average lecture section enrolled an estimated 98 (SE 7.6) students, compared to 71 students in fall 2010 (CBMS2010, Table FY.3, p. 119).
• The estimated average size of introductory statis-tics sections taught in statistics departments was slightly larger than the average size of the corresponding course/format section taught in mathematics departments; for example, by Table FY.3, the estimated average size of sections of course (F1) in doctoral-level mathematics depart-ments over all formats combined, in fall 2015, was 42 (SE 3.7), and, by Table FY.4, the estimated average size of sections of the corresponding course (E1) in doctoral-level statistics departments, over all formats combined, was 58 (SE 2.6).
D. Pedagogy in Introductory Statistics
• Tables FY.5 and FY.6 compare ways course (F1) in mathematics departments and course (E1) in statistics departments were taught. The tables break Chapter 1, Table S.12 down by level of department. Generally, Table S.12 shows that in fall 2015 (as in fall 2010) statistics departments were making more use than mathematics depart-ments of the current recommendations for teaching introductory statistics including: use of real data, modern technology, applets, classroom response systems (such as clickers), and in-class activities that encourage student involvement. Tables FY.5 and FY.6 show there were some differences across levels of departments.
• Table FY.7 presents data on the estimated percent-ages of mathematics and statistics departments that covered certain topics in courses (F1) and (E1) in fall 2015. As one example, it shows that resam-pling techniques were covered in 22% (SE 5.1) of course (F1) across all levels of mathematics depart-ments, and 39% (SE 2.9) of course (E1) across all levels statistics departments; the percentage was smaller (9% (SE 5)) at doctoral-level mathematics departments, and (8% (SE 4.1) at masters-level statistics departments.
A. Course Enrollments: (Tables FY.1-FY.4, Appendix I)
First, we consider enrollments in four-year mathe-matics departments, and we note that the enrollments in Chapter 3, Table E.2 include distance learning enrollments, whereas the tables of this chapter and Chapter 1 generally do not. Appendix I, Tables A.1, A.2, A.3 give the enrollments (with distance learning enrollments included) in fall 2000, 2005, 2010, and 2015 for each of the courses in the four-year mathe-matics and statistics questionnaires; they also present the non-distance learning enrollments in fall 2010 and fall 2015 (except for advanced-level courses). The Appendix I tables also give the enrollments broken down by level of department (bachelors, masters, or doctoral level) for enrollments in fall 2015; compa-rable breakdowns for fall 2010 are given in the corresponding table of the CBMS 2010 report. In the discussion that follows, we present enrollments without distance learning enrollments, as was done in the CBMS 2010 report in this chapter, whenever these are available for some preceding years; we occasion-ally use enrollments with distance learning included when necessary to compare to several previous years. Questions about issues in introductory-level courses, which were asked in previous CBMS surveys, were not repeated in the 2015 survey.
Precollege-level courses: (Appendix I, Table A.1)The largest percentage growth in mathematics course enrollment was in precollege-level courses, which increased 21% (1.7 SEs), from an estimated enrollment of roughly 201,000 in fall 2010 to an estimated enrollment of 244,000 (with SE 26,000) in fall 2015 (see Chapter 1, Table S.4). Beginning with the 2010 CBMS survey, enrollments in individual precollege-level courses were not collected.
Introductory-level courses: (Appendix I, Table A.1) The largest estimated total mathematics enroll-
ments in fall 2015 occurred in the introductory-level courses, as was observed, also, in the three previous CBMS surveys, and introductory-level courses had the second largest growth in estimated enrollment from fall 2010 to fall 2015, up 14% (1.6 SEs) (see Chapter 1, Table S.4). Chapter 3, Table E.2, indi-cates that much of the increase in introductory-level mathematics enrollments occurred at the doctor-al-level mathematics departments, where estimated enrollment in introductory-level courses (including distance learning enrollments) went from 299,000 in fall 2010, to 408,000 (SE 54,000) in fall 2015, an increase of 36% (1.6 SEs) (compared to increases of 6% at masters-level and 4% at bachelors-level math-ematics departments).
From Appendix I, Table A.1, we see that, of the introductory-level mathematics courses, the course titled College Algebra had the largest estimated course

136 2015 CBMS Survey of Undergraduate Programs
Cha
pter
5 2
015
Tabl
es o
ct20
-fina
l.xls
x: F
Y.1
11/1
4/20
17: 3
:52
PM
Cou
rse
& D
epar
tmen
t Typ
eP
hDM
AB
AP
hDM
AB
AP
hDM
AB
AP
hDM
AB
AP
hDM
AB
AP
hDM
AB
AP
hDM
AB
A
Mai
nstre
am C
alcu
lus
I
Lect
ure
with
sep
arat
e re
cita
tion
2832
7548
2618
1224
17
40
514
698
4526
9340
12
Sec
tions
that
mee
t as
a cl
ass
2662
7231
268
127
1027
00
35
1032
3023
3918
51
Oth
er s
ectio
ns27
035
320
657
100
034
00
00
032
09
20
0
Tota
l Mai
nstre
am C
alcu
lus
I27
4472
3825
1112
189
192
04
119
6038
2413
458
63
Mai
nstre
am C
alcu
lus
II
Lect
ure
with
sep
arat
e re
cita
tion
3366
6552
1123
517
05
60
60
1290
3722
5413
5
Sec
tions
that
mee
t as
a cl
ass
2760
6938
1815
84
625
00
318
938
2820
217
24
Oth
er s
ectio
ns38
NA
100
25N
A0
0N
A0
38N
A0
0N
A0
29N
A10
10
0
Tota
l Mai
nstre
am C
alcu
lus
II 30
6469
4414
176
125
154
04
710
6433
2076
2129
Tota
l Mai
nstre
am C
alcu
lus
I & II
2850
7140
2213
1016
718
30
410
962
3723
210
7992
TAB
LE F
Y.1
Per
cent
age
of s
ectio
ns (e
xclu
ding
dis
tanc
e-le
arni
ng s
ectio
ns) i
n M
ains
tream
Cal
culu
s I a
nd M
ains
tream
Cal
culu
s II
taug
ht b
y va
rious
type
s of
in
stru
ctor
s in
four
-yea
r mat
hem
atic
s de
partm
ents
in fa
ll 20
15, b
y si
ze o
f sec
tions
and
type
of d
epar
tmen
t. A
lso
aver
age
sect
ion
size
s an
d en
rollm
ents
(not
in
clud
ing
dist
ance
-lear
ning
enr
ollm
ents
). T
his
tabl
e ca
n be
com
pare
d to
Tab
le F
Y.3,
p. 1
19 o
f CB
MS
2010
.
Not
e: 0
% m
eans
less
than
one
half
of 1
%.0
enr
ollm
ent m
eans
und
er 5
00. I
ncon
sist
enci
es in
col
umn
and
row
sum
sar
e du
e to
roun
d-of
f.N
A=
Not
app
licab
le.
1 In 2
010,
the
CB
MS
surv
eyad
ded
the
wor
d "p
erm
anen
t" to
the
desc
riptio
n "te
nure
d/te
nure
elig
ible
" tha
twas
use
d pr
evio
usly
. In
2015
the
wor
d "p
erm
anen
t" w
as d
elet
ed.
Sec
tion
Oth
er
Siz
e
full-
time
%%
%%
%
Par
t-tim
e
(100
0s)
Per
cent
age
of s
ectio
ns ta
ught
by
Enr
ollm
ent
Gra
duat
eTe
nure
d/
Unk
now
n
Ave
rage
te
nure
-
assi
stan
ts
teac
hing
elig
ible
1

Chapter 5: First-Year Courses in Four-Year Colleges and Universities 137
Chapter 5 2015 Tables oct20-final.xlsx: FY.1.1 11/14/2017: 3:52 PM
FIGURE FY.1.1 Percentage of sections (excluding distance learning) in Mainstream Calculus I in four-year mathematics departments by type of instructor and by type of department in fall 2015. (Deficits from 100% represent unknown instructors.) This figure can be compared to Figure FY.3.1, p. 120, in CBMS2010.
0
10
20
30
40
50
60
70
80
90
100
Univ (PhD) Univ (MA) Coll (BA)
Perc
ent
Graduate teachingassistants
Part-time
Other full-time
Tenured/tenure-eligible
enrollment for each level of department in fall 2015. The introductory-level mathematics course with the second highest estimated enrollment in fall 2015 at doctoral-level mathematics departments was “Other” followed closely by Elementary Functions (which includes Precalculus and Analytical Geometry) and Mathematics for the Liberal Arts; at masters-level and bachelors-level departments, the course with the second largest enrollment was Mathematics for the Liberal Arts. These patterns also held in fall 2010, except that “Other” in doctoral-level departments had smaller enrollment (15,000 in 2010, compared to 62,000 in 2015) (CBMS2010, Appendix I, Table A.1, p. 185). Each specific introductory-level course had larger estimated enrollment in 2015 than in 2010 across all levels of departments combined (though not a significantly larger enrollment, as the SEs are rela-tively large for individual courses), except for Business Math and Math for Elementary Teachers, which had slightly smaller estimated enrollments in fall 2015 than in fall 2010.
College Algebra, Trigonometry, PrecalculusThe total enrollments, over all levels of departments
combined, in the cluster of the four courses that were listed on the four-year mathematics questionnaire as: College Algebra, Trigonometry, College Algebra and Trigonometry, and Precalculus (Elementary Functions) generally have been rising, except in the 2005 CBMS survey, where they showed a decline. The
total enrollments in these four courses at all four-year mathematics departments (combined) were roughly 368,000 in fall 1995, 386,000 in 2000, 352,000 in 2005, 431,000 in 2010, and 482,000 in 2015. Hence there has been a 37% increase in the estimated total enrollment in these four courses since 2005, and a 31% increase since 1995. In fall 2015, the sum of the esti-mated enrollments in these four classes represented 20% of all doctoral-level mathematics department (non-distance learning) estimated enrollments in mathematics courses, 28% of all masters-level math-ematics department (non-distance learning) estimated enrollments in mathematics courses, and 31% of all bachelors-level mathematics departments (non-dis-tance learning) estimated enrollments in mathematics.
Mathematics for the Liberal ArtsEnrollments in Mathematics for the Liberal Arts
have been steadily increasing, from an estimated enrollment (including distance learning enrollments) of 86,000 in fall 2000 to 171,000 (SE 21,900) in fall 2015, almost doubling over the past 15 years (an increase of 3.9 SEs from fall 2000 to fall 2015). Much of the increase occurred at the doctoral level, where estimated enrollments went from 43,000 in fall 2010 to 57,000 in fall 2015. The estimated enrollment at doctoral-level departments in the category of intro-ductory-level courses, “Other”, increased from an estimated enrollment of 15,000 in fall 2010 to 62,000 in fall 2015. The increased enrollment in these two

138 2015 CBMS Survey of Undergraduate Programs
categories of introductory-level courses at doctoral- level mathematics departments, suggests that doctoral- level departments are creating enrollments in intro-ductory-level courses other than the traditional college algebra related courses.
Introductory courses for pre-service elementary teachers:
Estimated enrollments in introductory courses designed for pre-service elementary teachers, which had been increasing (in fall 1995 the estimated enroll-ment was roughly 59,000, in 2000 it was 68,000, in 2005 it was 72,000, and in 2010 it rose to 80,000), decreased in fall 2015 to 72,000 (SE 9,500, so not a significant change).
Mainstream Calculus: (Table FY.1)Mainstream Calculus I had (non-distance learning)
total enrollment, across all levels of mathematics departments combined, in fall 2015, of roughly 255,000 (SE 23,000), up 9% (0.9 SEs) from fall 2010, up 27% from fall 2005 (Chapter 1, Table S.5), and up 34% from fall 2000 (CBMS2005, Chapter 1, Table S.7, p.17). By Table FY.1, which breaks down Table S.5 of Chapter 1 by level of department, and comparing to CBMS2010 Table FY.3, p. 119, we see that the enroll-ment gains occurred at the masters and doctoral-level departments (from 2010 to 2015 Mainstream Calculus I estimated enrollment was up 41% (1 SE) at masters-level departments, up 22% (1.8 SEs) at doctoral-level departments), and estimated enrollment was down 23% (2.3 SEs) at bachelors-level departments. From Table FY.1 we also see that, in fall 2014, 53% of the estimated enrollments in Mainstream Calculus I were at the doctoral-level departments.
Mainstream Calculus II, the second course in the calculus sequence for STEM majors, had (non-dis-tance learning) total enrollment in fall 2015 of roughly 125,000 (SE 10,650) (Chapter 1, Table S.5). The CBMS 2010 survey reported estimated enrollments of 128,000, the 2005 survey reported enrollments of 85,000 (Chapter 1, Table S.5), and the 2000 survey reported enrollments of 87,000 (CBMS2005, Chapter 1, Table S.7, p. 17). Hence, in fall 2015, the estimated enrollment in Mainstream Calculus II was up 44% (3.6 SEs) over fall 2000. Comparing Table FY.1 to CBMS2010 Table FY.3, p. 119, we see that the esti-mated enrollment in Mainstream Calculus II, from fall 2010 to fall 2015, declined at the masters and bachelors-level departments (down 34% (3.3 SEs) at the bachelors-level departments), and increased 25% (1.8 SEs) at the doctoral-level departments.
Generally, Calculus has been taught in a lecture/recitation format or in sections that meet as a class (and are not broken down into smaller sections). Recently other formats, such as self-paced laboratory sections, have been introduced. The CBMS surveys have considered the enrollments in each type of
format. In the 2015 CBMS survey calculus sections were broken down into three kinds of formats: lecture/recitation, sections that meet as a class, and other. The estimated enrollments in each format, broken down by the level of the mathematics department is also given in Table FY.1 for both Mainstream Calculus I and II; Table FY.1 can be compared to Table FY.3, p. 119 in CBMS2010, where course sections were broken down slightly differently (lecture/recitation, other sections with enrollments of 30 or less, and other sections with enrollments more than 30). In fall 2015, 57% of the total estimated Mainstream Calculus I enrollments were in the lecture/recitation format. From fall 2010 to fall 2015, the enrollments in the lecture/recitation format of both Mainstream Calculus I and Mainstream Calculus II appeared to be growing at the doctoral and masters-level departments, and declining at the bachelors-level departments. There was very little reporting of “other” type of format in both Mainstream and Non-Mainstream Calculus; for Mainstream Calculus I, in fall 2015, doctoral-level departments reported an estimated enrollment of 2,000 (SE 1,800) in “other” formats of Mainstream Calculus I, and for other levels of departments, the estimates were less than 500 enrollments.
Non-Mainstream Calculus: (Table FY.2)Non-Mainstream Calculus is the flavor of calculus
that is not a part of the calculus sequence for math-ematical and physical science majors, and tends to be for business, social science, or life science majors. Non-Mainstream Calculus I had (non-distance learning) enrollment in fall 2015 of roughly 91,000 (SE 10,500), down slightly from the fall 2010 estimate of 99,000, and from the fall 2005 estimate of 108,000 (Chapter 1, Table S.6); the fall 1995 estimate was 97,000 (CBMS2005, Chapter 1, Table S.8, p. 19). By Table FY.2, which breaks down Table S.6 of Chapter 1 by level of department, and comparing to CBMS2010, Table FY.5, p. 121, we see that the Non-Mainstream estimated enrollments in fall 2015 were distributed roughly the same way in fall 2015 as in fall 2010, with 63% of the enrollments at the doctoral-level depart-ments in fall 2015.
Non-Mainstream Calculus II, III, etc. had (non-dis-tance learning) enrollment in fall 2015 of roughly 16,000 (SE 4,300) (Chapter 1, Table S.6). The fall 2015 estimate was halfway between the 2005 estimate of 10,000 and the 2010 estimate of 22,000 (Chapter 1, Table S.6), and the 1995 survey reported estimated enrollments of 14,000 (CBMS2005, Chapter 1, Table S.8, p.19). By Table FY.2 the estimated enrollment in Non-Mainstream Calculus II, III, etc. declined 50% (4 SEs) from fall 2010 to fall 2015 at the doctoral-level departments, and declined 80% (7 SEs) at the bache-lors-level departments; the masters-level departments reported the largest estimated enrollments.

Chapter 5: First-Year Courses in Four-Year Colleges and Universities 139
Cha
pter
5 2
015
Tabl
es o
ct20
-fina
l.xls
x: F
Y.2
11/1
4/20
17: 3
:52
PM
Cou
rse
& D
epar
tmen
t Typ
ePh
DM
ABA
PhD
MA
BAPh
DM
ABA
PhD
MA
BAPh
DM
ABA
PhD
MA
BAPh
DM
ABA
Non
-Mai
nstre
am C
alcu
lus
I
Lect
ure
with
sep
arat
e re
cita
tion
2533
5651
2344
1444
02
00
80
096
5619
263
1
Sect
ions
that
mee
t as
a cl
ass
1538
3916
3229
1024
3047
00
136
238
3229
2914
17
Oth
er s
ectio
ns0
NA
NA
56N
AN
A0
NA
NA
44N
AN
A0
NA
NA
61N
AN
A2
00
Tota
l Non
-Mai
nstre
am C
alcu
lus
I17
3740
2631
3011
2628
350
011
52
5434
2957
1717
Tota
l Non
-Mai
nstre
am C
alcu
lus
II, II
I, et
c.32
3235
2914
1119
5517
150
04
037
4139
226
81
Tota
l Non
-Mai
nstre
am C
alcu
lus
I, II,
III,
etc.
1936
3927
2628
1234
2732
00
104
552
3528
6325
18
NA
= N
ot a
pplic
able
.
Not
e: 0
mea
ns le
ss th
an o
ne h
alf o
f 1%
in c
olum
ns 1
thro
ugh
18. I
ncon
sist
ence
s in
row
and
col
umn
sum
s ar
e du
e to
roun
d-of
f.
TAB
LE F
Y.2
Per
cent
age
of s
ectio
ns (e
xclu
ding
dis
tanc
e-le
arni
ng s
ectio
ns) i
n N
on-M
ains
tream
Cal
culu
s I a
nd in
Non
-Mai
nstre
am II
, III,
etc
. tau
ght b
y va
rious
ty
pes
of in
stru
ctor
s in
mat
hem
atic
s de
partm
ents
in fa
ll 20
15, b
y si
ze o
f sec
tions
and
type
of d
epar
tmen
t. A
lso
aver
age
sect
ion
size
and
enr
ollm
ents
(not
incl
udin
g di
stan
ce-le
arni
ng e
nrol
lmen
ts).
Thi
s ta
ble
can
be c
ompa
red
to T
able
FY.
5, p
. 121
in C
BMS2
010.
Gra
duat
eTe
nure
d/
Perc
enta
ge o
f sec
tions
taug
ht b
y
(100
0s)
%
tenu
re-
Oth
er
%
Enro
llmen
t
Aver
age
teac
hing
1 In 2
010,
the
CBM
S su
rvey
add
ed th
e w
ord
"per
man
ent"
to th
e de
scrip
tion
"tenu
red/
tenu
re e
ligib
le" t
hat w
as u
sed
prev
ious
ly. I
n 20
15 th
e w
ord
"per
man
ent"
was
del
eted
.
full-
time
Part-
time
assi
stan
tsU
nkno
wn
Sect
ion
elig
ible
1
Size
%%
%

140 2015 CBMS Survey of Undergraduate Programs
Chapter 5 2015 Tables oct20-final.xlsx: FY.2.1 11/14/2017: 3:52 PM
FIGURE FY.2.1 Percentage of sections (excluding distance-learning sections) in Non-Mainstream Calculus I in four-year mathematics departments taught by various kinds of instructors, by type of department in fall 2015. (Deficits from 100% represent unknown instructors.) This Figure can be compared to Figure FY.5.1, p. 122, in CBMS2010.
0
10
20
30
40
50
60
70
80
90
100
Univ (PhD) Univ (MA) Coll (BA)
Perc
ent
Graduate teachingassistantsPart-time
Other full-time
Tenured/tenure-eligible
The estimated enrollments in each of the three formats described above for Mainstream Calculus I are broken down by the level of the mathematics department for Non-Mainstream Calculus I in Table FY.2. Table FY.2 can be compared to Table FY.5, p. 121 in CBMS2010, where course sections were broken down slightly differently. From fall 2010 to fall 2015, the enrollments in the lecture/recitation format of Non-Mainstream Calculus I at bachelors-level depart-ments appeared to be declining (from 2010 to 2015 down 80% (13 SEs)).
In comparing fall 2015 Non-Mainstream Calculus estimated enrollments to those obtained in fall 2010, one should keep in mind that there was an error in the 2010 questionnaire. The questionnaire asked for enrollments in Non-Mainstream Calculus I (broken down by three formats), followed by a request for “Non-Mainstream Calculus I, II, III, etc.” enroll-ments (not broken down by formats). The intention had been to combine all Non-Mainstream Calculus enrollments above Non-Mainstream Calculus I (as was done in 2015), and hence Non-Mainstream Calculus I should not have been included in the second list of courses. From other data provided, it was clear that some departments listed Non-Mainstream Calculus I enrollments in both rows, and looking at the data, and with some follow-up correspondence with some of the departments, the data was interpreted
as best it could be. The 2010 enrollment data on Non-Mainstream Calculus II, III, etc., as interpreted, showed that the Non-Mainstream Calculus II, III, etc. enrollment (excluding distance learning courses) of roughly 22,000 in fall 2010 was double the fall 2005 enrollment (excluding distance learning courses) in Non-Mainstream Calculus II (CBMS2005, Table S.8, p.19). The fall 2015 estimate was 15,000, suggesting that the 2010 estimate was too large.
More information about Calculus instruction can be found in the MAA Progress Through Calculus National Survey Summary [MAA:PtC].
Introductory Statistics: (Table FY.3, FY.4 and FY.9)
The 2015 four-year mathematics CBMS question-naire listed five introductory statistics courses for non-majors/minors: (F1) Introductory Statistics (no calculus prerequisite), (F2) Introductory Statistics (calculus prerequisite), (F3) statistics for pre-service elementary (K-5) or middle grade (6-8) teachers, (F4) statistics for pre-service secondary teachers, and (F5) other introductory probability and statistics courses. Courses (F3) and (F4) were included in the CBMS mathematics survey for the first time in 2015, and the 2010 CBMS mathematics questionnaire included a course (F3) titled Probability and Statistics (no calculus prerequisite) that was deleted from the 2015

Chapter 5: First-Year Courses in Four-Year Colleges and Universities 141
Cha
pter
5 2
015
Tabl
es o
ct20
-fina
l.xls
x: F
Y.3
11/1
4/20
17: 3
:52
PM
Cou
rse
& M
athe
mat
ics
Dep
artm
ent T
ype
PhD
MA
BA
PhD
MA
BA
PhD
MA
BA
PhD
MA
BA
PhD
MA
BA
PhD
MA
BA
PhD
MA
BA
Intro
duct
ory
Sta
tistic
s (F
1) (n
on-C
alcu
lus)
Lect
ure
with
sep
arat
e re
cita
tion
1749
4352
3919
38
197
00
204
1914
141
3115
918
Sec
tions
that
mee
t as
a cl
ass
1346
4231
3816
1716
3423
00
160
830
3926
2634
85
Oth
er s
ectio
ns9
NA
3891
NA
490
NA
130
NA
00
NA
02
NA
120
00
Tota
l Int
rodu
ctor
y S
tatis
tics
(non
-Cal
culu
s)13
4642
3438
1616
1432
210
017
19
4239
2741
4310
4
Intro
duct
ory
Sta
tistic
s (F
2) (C
alcu
lus
prer
equi
site
for n
on-m
ajor
s/m
inor
s)
Lect
ure
with
sep
arat
e re
cita
tion
5486
4129
70
90
598
00
07
053
7927
25
3
Sec
tions
that
mee
t as
a cl
ass
3771
6924
1111
1717
1215
00
80
833
3127
58
11
Oth
er s
ectio
ns10
00
100
0N
A0
0N
A0
0N
A0
0N
A0
34N
A30
00
0
Tota
l Int
rodu
ctor
y S
tatis
tics
(Cal
culu
s)43
7463
2410
815
1422
130
06
16
3740
277
1314
Sta
tistic
s fo
r Pre
-ser
vice
Tea
cher
s (F
3,F4
)23
7629
270
012
270
380
710
00
2523
31
10
Pro
babi
lity
& S
tatis
tics
(non
-Cal
culu
s)(F
5)46
3227
034
3154
1329
00
00
2113
3438
313
26
Tota
l, al
l int
rodu
ctor
y st
atis
tics
cour
ses
for
non-
maj
ors
2052
4430
3116
1814
3019
01
132
940
3927
5358
123
NA
= N
ot a
pplic
able
.
TAB
LE F
Y.3
Per
cent
age
of s
ectio
ns (e
xclu
ding
dis
tanc
e-le
arni
ng s
ectio
ns) i
n In
trodu
ctor
y S
tatis
tics
cour
ses
(for n
on-m
ajor
s) ta
ught
by
vario
us ty
pes
of
inst
ruct
ors
in m
athe
mat
ics
depa
rtmen
ts in
fall
2015
, by
size
of s
ectio
ns a
nd ty
pe o
f dep
artm
ent.
Als
o av
erag
e se
ctio
n si
ze a
nd e
nrol
lmen
ts (n
ot in
clud
ing
dist
ance
-lear
ning
enr
ollm
ents
). C
ompa
rabl
e 20
10 d
ata
is in
CB
MS
2010
, Tab
le F
Y.6,
p. 1
23.
(100
0s)
Gra
duat
eTe
nure
d/
Per
cent
age
of s
ectio
ns ta
ught
by
%el
igib
le 1
full-
time
%S
ize
1 In 2
010,
the
CB
MS
sur
vey
adde
d th
e w
ord
"per
man
ent"
to th
e de
scrip
tion
"tenu
red/
tenu
re e
ligib
le" t
hat w
as u
sed
prev
ious
ly. I
n 20
15, t
he w
ord
"per
man
ent"
was
del
eted
.
Not
e: 0
% m
eans
less
than
one
hal
f of 1
%. 0
enr
ollm
ent m
eans
und
er 5
00. S
ome
row
and
col
umn
sum
s ap
pear
inco
nsis
tent
due
to ro
und-
off.
tenu
re-
Oth
er
%%
%U
nkno
wn
teac
hing
Sec
tion
Par
t-tim
eas
sist
ants
Ave
rage
E
nrol
lmen
t
142 2015 CBMS Survey of Undergraduate Programs
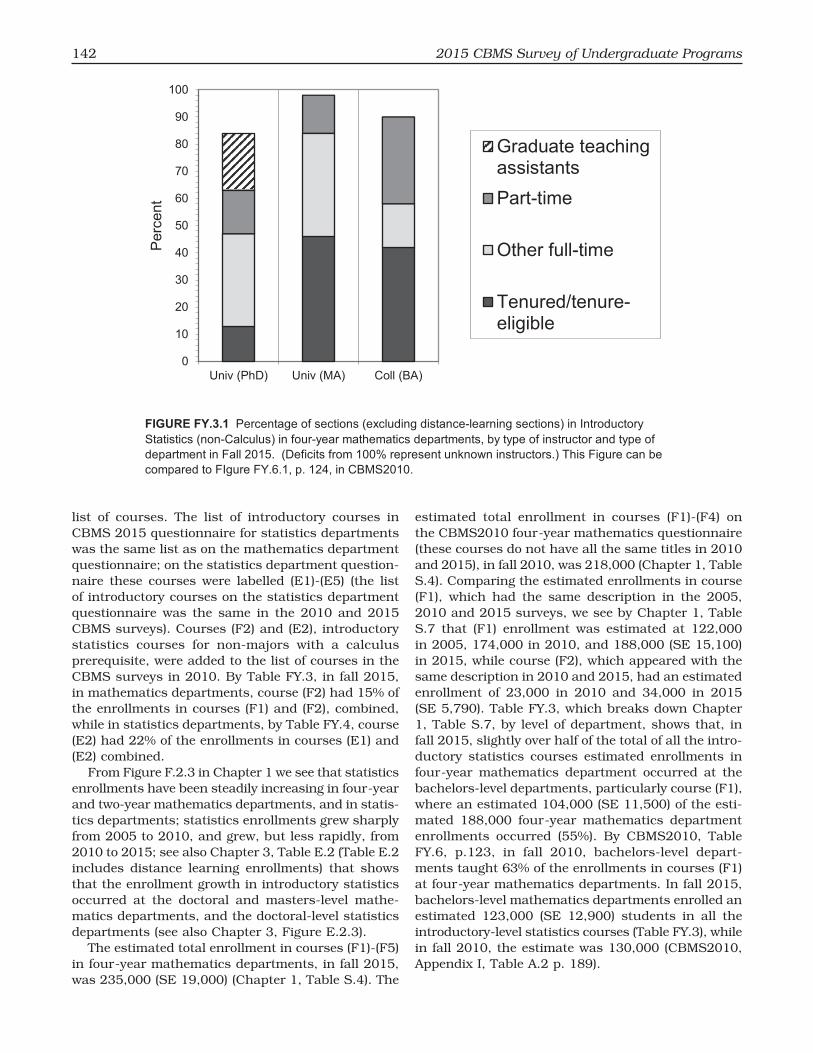
FIGURE FY.3.1 Percentage of sections (excluding distance-learning sections) in Introductory Statistics (non-Calculus) in four-year mathematics departments, by type of instructor and type of department in Fall 2015. (Deficits from 100% represent unknown instructors.) This Figure can be compared to FIgure FY.6.1, p. 124, in CBMS2010.
0
10
20
30
40
50
60
70
80
90
100
Univ (PhD) Univ (MA) Coll (BA)
Perc
ent
Graduate teachingassistantsPart-time
Other full-time
Tenured/tenure-eligible
list of courses. The list of introductory courses in CBMS 2015 questionnaire for statistics departments was the same list as on the mathematics department questionnaire; on the statistics department question-naire these courses were labelled (E1)-(E5) (the list of introductory courses on the statistics department questionnaire was the same in the 2010 and 2015 CBMS surveys). Courses (F2) and (E2), introductory statistics courses for non-majors with a calculus prerequisite, were added to the list of courses in the CBMS surveys in 2010. By Table FY.3, in fall 2015, in mathematics departments, course (F2) had 15% of the enrollments in courses (F1) and (F2), combined, while in statistics departments, by Table FY.4, course (E2) had 22% of the enrollments in courses (E1) and (E2) combined.
From Figure F.2.3 in Chapter 1 we see that statistics enrollments have been steadily increasing in four-year and two-year mathematics departments, and in statis-tics departments; statistics enrollments grew sharply from 2005 to 2010, and grew, but less rapidly, from 2010 to 2015; see also Chapter 3, Table E.2 (Table E.2 includes distance learning enrollments) that shows that the enrollment growth in introductory statistics occurred at the doctoral and masters-level mathe-matics departments, and the doctoral-level statistics departments (see also Chapter 3, Figure E.2.3).
The estimated total enrollment in courses (F1)-(F5) in four-year mathematics departments, in fall 2015, was 235,000 (SE 19,000) (Chapter 1, Table S.4). The
estimated total enrollment in courses (F1)-(F4) on the CBMS2010 four-year mathematics questionnaire (these courses do not have all the same titles in 2010 and 2015), in fall 2010, was 218,000 (Chapter 1, Table S.4). Comparing the estimated enrollments in course (F1), which had the same description in the 2005, 2010 and 2015 surveys, we see by Chapter 1, Table S.7 that (F1) enrollment was estimated at 122,000 in 2005, 174,000 in 2010, and 188,000 (SE 15,100) in 2015, while course (F2), which appeared with the same description in 2010 and 2015, had an estimated enrollment of 23,000 in 2010 and 34,000 in 2015 (SE 5,790). Table FY.3, which breaks down Chapter 1, Table S.7, by level of department, shows that, in fall 2015, slightly over half of the total of all the intro-ductory statistics courses estimated enrollments in four-year mathematics department occurred at the bachelors-level departments, particularly course (F1), where an estimated 104,000 (SE 11,500) of the esti-mated 188,000 four-year mathematics department enrollments occurred (55%). By CBMS2010, Table FY.6, p.123, in fall 2010, bachelors-level depart-ments taught 63% of the enrollments in courses (F1) at four-year mathematics departments. In fall 2015, bachelors-level mathematics departments enrolled an estimated 123,000 (SE 12,900) students in all the introductory-level statistics courses (Table FY.3), while in fall 2010, the estimate was 130,000 (CBMS2010, Appendix I, Table A.2 p. 189).

Chapter 5: First-Year Courses in Four-Year Colleges and Universities 143
Cha
pter
5 2
015
Tabl
es o
ct20
-fina
l.xls
x: F
Y.4
11/1
4/20
17: 3
:52
PM
Cou
rse
& S
tatis
tics
Dep
artm
ent T
ype
PhD
MA
PhD
MA
PhD
MA
PhD
MA
PhD
MA
PhD
MA
PhD
MA
PhD
MA
Intro
duct
ory
Sta
tistic
s (n
on-C
alcu
lus
for n
on-
maj
ors/
min
ors
) (E
1)
Lect
ure
with
sep
arat
e re
cita
tion
68
926
918
621
383
3226
5796
355
Sec
tions
that
mee
t as
a cl
ass
1740
164
935
1115
411
65
6653
187
Oth
er s
ectio
ns0
NA
3
3N
A42
NA
52N
A0
NA
20N
A1
0
T ota
l Int
rodu
ctor
y S
tatis
tics
(non
-Cal
culu
s)
931
1110
930
916
401
2311
5865
5412
Intro
duct
ory
Sta
tistic
s (C
alcu
lus
prer
equi
site
fo
r non
-maj
ors/
min
ors
) (E
2)
Lect
ure
with
sep
arat
e re
cita
tion
1417
2417
78
120
160
2758
7357
101
Sec
tions
that
mee
t as
a cl
ass
3141
220
648
84
310
07
5468
52
Oth
er s
ectio
ns5
NA
33N
A2
NA
0N
A60
NA
0N
A26
NA
10
Tota
l Int
rodu
ctor
y S
tatis
tics
(Cal
culu
s)
1833
255
636
93
290
1423
5965
163
Sta
tistic
s fo
r Pre
-ser
vice
Tea
cher
s (E
3,E
4)10
00
00
010
00
00
00
036
50
0
Pro
babi
lity
& S
tatis
tics
(non
-Cal
culu
s) (E
5)6
019
06
03
100
330
330
102
404
0
Tota
l, al
l Int
rodu
ctor
y P
roba
bilit
y &
Sta
tistic
s co
urse
s 11
3114
98
329
1437
121
1359
6574
15
NA
= N
ot a
pplic
able
.
assi
stan
ts%
Gra
duat
ete
achi
ngE
nrol
lmen
t
(100
0s)
Sec
tion
Siz
e
Unk
now
n
%
full-
time
(with
PhD
)%
Tenu
red/
tenu
re-e
ligib
le1
TAB
LE F
Y.4
Per
cent
age
of s
ectio
ns (e
xclu
ding
dis
tanc
e-le
arni
ng s
ectio
ns) i
n In
trodu
ctor
y S
tatis
tics
cour
ses
(for n
on-m
ajor
s) ta
ught
by
vario
us ty
pes
of
inst
ruct
ors
in s
tatis
tics
depa
rtmen
ts in
fall
2015
, by
size
of s
ectio
ns a
nd ty
pe o
f dep
artm
ent.
Als
o av
erag
e se
ctio
n si
ze a
nd to
tal (
non-
dist
ance
-lear
ning
) en
rollm
ents
. Th
is ta
ble
can
be c
ompa
red
to T
able
FY.
9, p
. 129
, in
CB
MS
2010
.
1 In 2
010,
the
CB
MS
sur
vey
adde
d th
e w
ord
"per
man
ent"
to th
e de
scrip
tion
"tenu
red/
tenu
re e
ligib
le" t
hat w
as u
sed
prev
ious
ly. I
n 20
15, t
he w
ord
"per
man
ent"
was
del
eted
.
Not
e: 0
% m
eans
less
than
one
hal
f of 1
%.
0 en
rollm
ent m
eans
und
er 5
00. R
ow a
nd c
olum
n su
ms
may
app
ear i
ncon
sist
ent d
ue to
roun
d-of
f.
Per
cent
age
of s
ectio
ns ta
ught
by
%%
Ave
rage
O
ther
full-
time
(with
out P
hD)
Par
t-tim
e
%
Oth
er

144 2015 CBMS Survey of Undergraduate Programs
Chapter 5 2015 Tables oct20-final.xlsx: FY.4.1 11/14/2017: 3:52 PM
FIGURE FY.4.1 Percentage of sections (excluding distance-learning sections) in Introductory Statistics (non-Calculus) taught in statistics departments in fall 2015, by type of instructor and type of department. (Deficits from 100% represent unknown instructors). This Figure can be compared to Figure FY.9.1, p. 128, in CBMS2010.
0
10
20
30
40
50
60
70
80
90
100
Univ (PhD) Univ (MA)
Perc
ent
Graduate teachingassistantsPart-time
Other full-time
Tenured/tenure-eligible
Estimated enrollments in courses (F1) and (F2) were also broken down by the format of the section (lecture/recitation, sections that meet as a class, and other), a different format breakdown than in the 2010 survey. By Table FY.3, in mathematics depart-ments, in fall 2015, across all levels of departments combined, 22% of the (F1) estimated enrollments were in the lecture/recitation format, and the bach-elors-level departments had the greatest number of these enrollments. Comparing Table FY.3 to Table FY.6, p. 123 of CBMS2010, we see that enrollments in the lecture/recitation format sections of course (F1) at doctoral-level mathematics department increased (from 6,000 in 2010 (16% of total enrollments) to 15,000 (SE 4,600) in 2015 (37% of total enrollments)), while enrollments in the lecture/recitation format sections of course (F1) at bachelors-level mathematics departments decreased (from 34,000 in 2010 (31% of total enrollments) to 18,000 (SE 3,200) in 2015 (17% of total enrollments)).
The estimated total enrollment in courses (E1)-(E5) in statistics departments, in fall 2015, was 90,000 (SE 3,000) (Chapter 1, Table S.8). The estimated total enrollment in courses (E1)-(E5) at statistics depart-ments, in fall 2010, was 77,000 (SE 4,700) (CBMS2010, Appendix I, Table A.2, p. 189). Hence the estimated enrollment in introductory courses for non-majors/minors in statistics departments has increased 17% (4.3 SEs) from 2010 to 2015. The 2005 estimated
enrollment was 53,000, and hence enrollments in 2015 increased 70% (12 SEs) from 2005.
Comparing the estimated enrollments in courses (E1) and (E2), we see, by Chapter 1, Table S.8, that (E1) enrollment was estimated at 42,000 in 2005, 56,000 in 2010, and 66,000 (SE 2,000) in 2015; hence estimated enrollments in course (E1) taught in statis-tics departments were up by 26% (6 SEs) over 2010. Course (E2) had an estimated enrollment of 16,000 in 2010 and 20,000 in 2015 (SE 1,000). Table FY.4 breaks down Chapter 1, Table S.8, by level of depart-ment, and shows that, in fall 2015, an estimated 82% of introductory statistics courses were taught at the doctoral-level statistics departments.
In fall 2015, in mathematics departments, where the majority of enrollments are taught at the bache-lors-level departments, by Table FY.3, across all levels of departments combined, an estimated 22% of the enrollments in Introductory Statistics (no calculus prerequisite) (course (F1)) were taught in lecture/recitation format and 78% were taught in sections that meet as a class, whereas in statistics departments, by Table FY.4, an estimated 61% of the analogous course (E1) were taught in lecture/recitation format and 38% were taught in sections that meet as a class.
Finally, a new question included on the 2015 CBMS surveys of four-year mathematics and statistics departments asked responders to estimate the number of enrollments at their institution in Introductory Statistics courses (no calculus prerequisite) taught
Chapter 5: First-Year Courses in Four-Year Colleges and Universities 145
Chapter 5 2015 Tables oct20-final.xlsx: FY.5 11/14/2017: 3:52 PM
Univ (PhD) Univ (MA) College (BA) All Depts. Combined
Percentage of departments that offer Introductory Statistics with no calculus prerequisite 50 78 83 78
Number of different kinds of introductory statistics courses for non-majors with no calculus prerequisite
1 61 69 74 72
2 35 23 23 24
3 4 4 2 3
More than 3 4 0 1
Of those that offer the course, the percentage of departments in which the majority of sections use real data for the following percentages of class sessions:
0-20% 21 29 28 28
21-40% 13 31 23 23
41-60% 26 19 18 19
61-80% 12 2 14 12
81-100% 29 18 18 19
Percentage of departments where the majority of sections use in-class demonstrations in the following percentages of class sessions:
0-20% 21 23 18 19
21-40% 26 17 22 22
41-60% 20 33 21 23
61-80% 16 17 17 17
81-100% 18 9 21 19
Percentage of departments using the following kinds of technology in the majority of sections:
Graphing calculators 57 77 66 67
Statistical packages 48 64 45 48
Educational software 29 55 52 50
Applets 16 30 24 24
Spreadsheets 66 72 67 68
Web-based resources 42 65 49 50
Classroom response systems 4 12 6 6
Online textbooks 41 48 39 41
Online videos 26 32 32 31Percentage of departments where the majority of sections require assessments beyond homework, exams, and quizzes
19 22 45 39
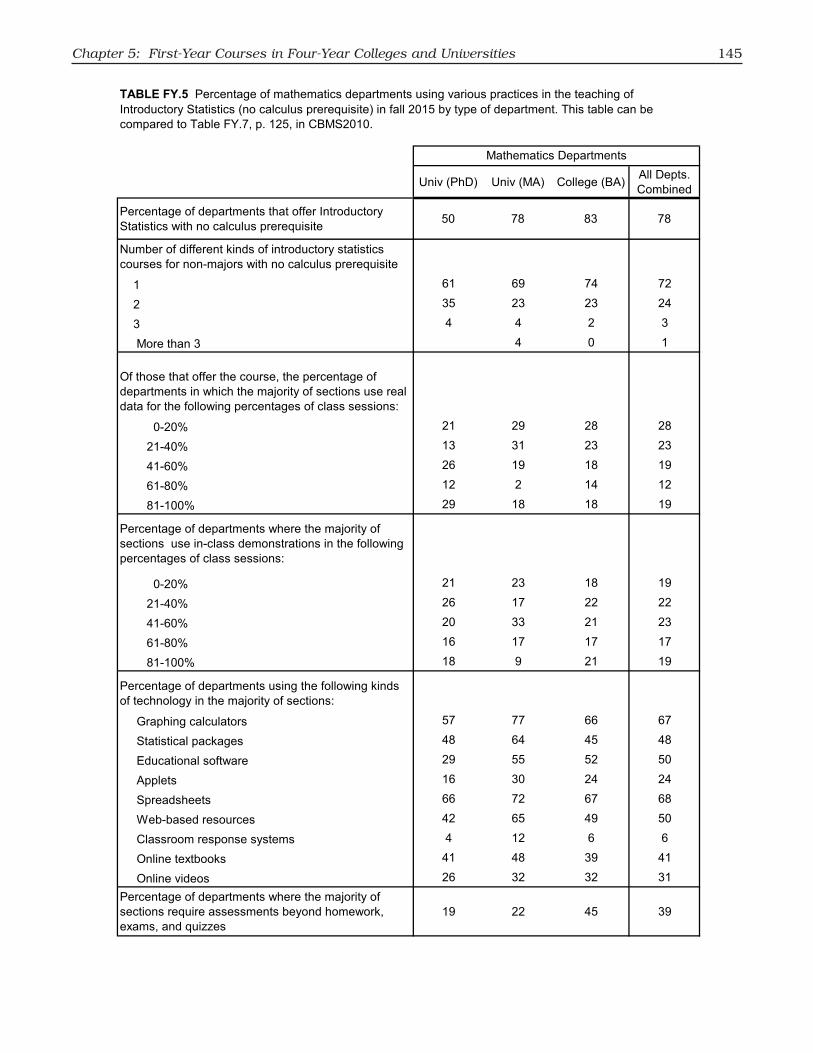
TABLE FY.5 Percentage of mathematics departments using various practices in the teaching of Introductory Statistics (no calculus prerequisite) in fall 2015 by type of department. This table can be compared to Table FY.7, p. 125, in CBMS2010.
Mathematics Departments

146 2015 CBMS Survey of Undergraduate Programs
Chapter 5 2015 Tables oct20-final.xlsx: FY.6 11/14/2017: 3:52 PM
Univ (PhD) Univ (MA) All Depts. Combined
Percentage of departments that offer Introductory Statistics for non-majors/minors with no calculus prerequisite 97 85 94
Number of different kinds of introductory statistics courses for non-majors with no calculus prerequisite
1 17 38 23
2 26 23 26
3 21 23 22
More than 3 35 15 30
Of those that offer the course, the percentage of departments in which the majority of sections use real data the following percentages of the time:
0-20% 14 20 15
21-40% 12 20 14
41-60% 16 10 15
61-80% 16 40 21
81-100% 42 10 35
Percentage of departments where the majority of sections use in-class demonstrations in the following percentages of class sessions:
0-20% 8 30 13
21-40% 18 40 23
41-60% 24 10 21
61-80% 7 5
81-100% 44 20 39
Percentage of departments using following kinds of technology in the majority of sections
Graphing calculators 46 50 47
Statistical packages 65 75 68
Educational software 53 55 53
Applets 45 27 41
Spreadsheets 52 64 55
Web-based resources 74 45 68
Classroom response systems 55 33 50
Online textbooks 51 45 50
Online videos 38 27 35
Percentage of departments where the majority of sections require assessments beyond homework, exams, and quizzes
35 25 32
TABLE FY.6 Percentage of statistics departments using various practices in the teaching of Introductory Statistics for non-majors/minors (no calculus prerequisite) in fall 2015 by type of department. This table can be compared to Table FY.8, p. 127, in CBMS2010.
Statistics Departments

Chapter 5: First-Year Courses in Four-Year Colleges and Universities 147
Chapter 5 2015 Tables oct20-final.xlsx: FY.7 11/14/2017: 3:52 PM
Univ (PhD)
Univ(MA)
College(BA) Total Univ
(PhD)Univ(MA) Total
Conditional probability 92 90 72 76 85 75 83
Simulation to explore randomness 50 84 45 51 76 67 73
Resampling techniques 9 34 21 22 50 8 39
TABLE FY.7 Of departments that offered Introductory Statistics (no calculus prerequisite) in fall 2015, the percentage that cover the following topics, by type of department.
Mathematics Depts Statistics Depts
outside of the mathematical sciences departments. These estimates are summarized in Table FY.9, which is broken down by level of department, and used to project national enrollments outside of mathematical science departments. The estimates obtained from statistics departments are from colleges with sepa-rate statistics departments; as such colleges would be expected to also have mathematics departments, adding the estimates in FY.9 obtained for both types of departments together would result in duplicating the counts of some students. However, using these crude estimates suggests that there may have been a little less than 100,000 such enrollments in introduc-tory statistics courses taught outside of mathematical sciences departments; this estimate can be compared to the estimates from Chapter 1, Table S.2: 627,000 enrollments in introductory statistics courses across all mathematical sciences departments (including distance learning enrollments), of these, 280,000 (SE 60,000) occurred at two-year colleges (45%), 253,000 (SE 20,000) at four-year mathematics departments (40%), and 94,000 (SE 3,000) at statistics depart-ments (15%).
B. Appointment Type of First Year Course Instructors (Tables FY.1-FY.4, FY.8)
Each CBMS survey report has attempted to answer the question: “who is teaching the course?” The CBMS 2015 survey divided faculty at four-year institutions into four categories: tenured or tenure-eligible (TTE), other full-time faculty (OFT) who are full-time but not TTE (including postdocs and faculty with renewable appointments), part-time faculty (PT), and grad-uate teaching assistants (GTAs). A course was to be reported as being taught by a GTA if and only if the GTA was the “instructor of record” for the course. GTAs who ran discussion or recitation sections as part of a lecture/recitation course were not included in this category.
Related data has been presented in earlier chapters. Chapter 1, Table S.4, gave the estimated percent-ages of course instructors at each appointment type,
who were teaching the various levels of mathematics and statistics courses in fall 2005, 2010 and 2015, while Chapter 1 Table S.5 (Mainstream Calculus), Table S.6 (Non-Mainstream Calculus), Table S.7 (introductory-level statistics courses in mathematics departments), and Table S.8 (introductory-level statistics courses in statistics departments) gave the percentages of the appointment type of instructors, broken down by the format of the course (lecture/recitation, sections that meet as a class, and other) in fall 2015, and the percentages of the appointment types over all sections of the course for fall 2005, 2010, and 2015. In Chapter 3, Table E.5 (calcu-lus-level courses), Table E.6 (introductory statistics courses), Table E.7 (lower-level computer science courses), Table E.8 (middle-level computer science courses), and Table E.9 (advanced-level mathematics and statistics courses), gave the estimated number of sections taught by each appointment type of course instructors in fall 2010 and fall 2015. In this chapter, data on first-year courses will be broken down by course, section format, and the level of the depart-ment.
As was noted in Chapter 1, in CBMS surveys of four-year departments, prior to 2010 the TTE category was labeled “tenured/ tenure-eligible” on the survey questionnaire. In the 2010 survey the word “perma-nent” was an added description, since the instructions for the questionnaire told departments at institutions that did not recognize tenure (estimated at 7.9% (SE 2.5) of all four-year mathematics departments in the CBMS 2015 survey) to place permanent faculty in the TTE category. In the 2010 survey, the addition to of the label “permanent” to the description of the TTE category on the questionnaire may have led some respondents to add to the TTE category instructors who should have been classified as OFT instructors, namely those instructors at institutions that DO recognize tenure, who have teaching positions that are regarded as permanent, although these faculty do not have tenure and are not eligible for tenure. The 2010 survey instructions did not define “permanent” beyond the situation where the institution does not

148 2015 CBMS Survey of Undergraduate Programs
recognize tenure, and it seems quite possible that some departments interpreted “permanent faculty” to have this additional meaning, and some of the data in 2010 suggested that some faculty who should have been counted as OFT were listed as TTE because they were “permanent”. Hence, the word “permanent” was deleted from the TTE description on the 2015 instru-ment (returning to the description used in 2005 and previously), and this change may explain some of the decrease in the estimated numbers of TTE faculty (and increase in OFT faculty) in the tables observed from 2010 to 2015.
The 2015 CBMS survey followed the practice estab-lished in the 2005 survey of presenting findings in terms of percentages of “sections” offered in four-year institutions (in CBMS2000 and earlier, the data were presented in terms of percentages of enrollments). In analyzing the 2010 survey data, it seemed that the notion of “section” varied somewhat among different departments, particularly for lower-level classes that were taught with a laboratory component. A further, and possibly related problem, experienced in the 2015 survey, was the inconsistent numbers of faculty and sections reported by some departments; this problem had occurred in past surveys, and was resolved by creating the category of “unknown” instructors. The 2015 survey defined more clearly what constitutes a “section”, and provided a place to enter enrollments that were not taught in either the lecture/recitation or the sections that meet as a class format. Further, the 2015 survey collected data on the rank of the instructor for only calculus-level mathematics classes, introductory statistics classes, and computer science classes; no data on the rank of the instructor in precollege or introductory-level mathematics classes was collected; in advanced-level mathematics and statistics classes, the survey gathered the number of sections with a TTE instructor, and listed the rest as “other”.
Mainstream Calculus: (Table FY.1)Table FY.1 presents data on the appointment type
of the instructor in Mainstream Calculus I and II in fall 2015; the data for Mainstream Calculus I, broken down by level of department, is displayed in Figure FY.1.1. These data can be compared with CBMS2010, Table FY.3, p. 119, and Figure FY.3.1, p. 120. For Mainstream Calculus I, at doctoral-level mathe-matics departments, over all formats of the sections combined, an estimated 27% (SE 1.8) of sections were taught by TTE faculty (compared to 31% in 2010), while at masters-level departments 44% (SE 6.3) of the sections were taught by TTE faculty (compared with 63% in 2010), and at bachelors-level departments 72% (SE 3.7) were taught by TTE faculty (compared with 63% in 2010). Of the Mainstream Calculus I sections taught using the lecture/recitation format, in
doctoral-level departments, the estimated percentage of sections that were taught by TTE faculty in fall 2015 was 28% (SE 3.6), about the same as in fall 2010, but in masters-level departments, in fall 2015, was 32% (SE 3.7) (compared with 82% in fall 2010), and in bachelors-level departments, in fall 2015, was 75% (SE 4.8) (compared with 50% in fall 2010). With the overall growth in numbers of OFT faculty, the estimated percentage of sections of Mainstream Calculus I taught by OFT faculty, across all formats combined, increased at doctoral and masters-level mathematics departments from fall 2010 to fall 2015: at doctoral level departments it was 38% (SE 1.8) in 2015 (compared 30% in 2010), and at masters-level departments it was 25% (SE 6.3) in 2015 (compared to 13% in 2010). The estimated percentage of sections taught by PT faculty was about the same in 2010 and 2015 at doctoral- and masters-level departments, and decreased at bachelors-level department. The esti-mated percentage of sections of Mainstream Calculus I at doctoral-level mathematics departments taught by GTAs, in fall 2015, across all formats combined, was 19% (SE 4.2), about the same as in fall 2010.
Table FY.1 also shows that the estimated distri-bution of appointment types of faculty teaching Mainstream Calculus II in fall 2015 was similar to that in fall 2010, except at the ranks of TTE and OFT faculty at doctoral-level departments. At doctor-al-level departments, in fall 2015, across all formats combined, an estimated 30% (SE 2.9) of Mainstream Calculus II sections were taught by TTE faculty (compared with 45% in 2010), and an estimated 44% (SE 2.1) of Mainstream Calculus II sections were taught by OFT faculty (compared with 26% in 2010). The fall 2010 estimates can be found at CBMS2010, Table FY.3, p. 119.
For further discussion of the declining number of TTE faculty teaching Calculus, see David Bressoud’s Launchings blog http://launchings.blogspot.com/ for October 2017.
Non-Mainstream Calculus: (Table FY.2)Table FY.2 presents data on the appointment
type of instructors of Non-Mainstream Calculus, and Figure FY.2.1 displays the estimated percent-ages of various appointment types of faculty teaching Non-Mainstream Calculus I, in fall 2015, broken down by level of department. At the doctoral-level depart-ments, in fall 2015, an estimated 17% (SE 3.1) of the sections of Non-Mainstream Calculus I were taught by TTE faculty (compared to 22% in 2010), while at the bachelors and masters-level this percentage was about 40%; these estimated percentages are not very different from those estimated in 2010. The esti-mated percentages of sections of Non-Mainstream Calculus I taught by OFT faculty were about the same in 2015 as in 2010 at doctoral-level depart-
Chapter 5: First-Year Courses in Four-Year Colleges and Universities 149
Chapter 5 2015 Tables oct20-final.xlsx: FY.8 1/16/2018: 1:06 PM
No graduate degree in statistics
Masters degree in statistics
PhD degree in statistics
Mathematics Departments
Univ (PhD) 52 29 18
Univ (MA) 48 35 17
Coll (BA) 68 18 14
Total Math Depts 64 21 15
TABLE FY.8 Of mathematics departments that offered Introductory Statistics (no calculus prerequisite) in fall 2015, the percentage whose instructors typically received the following highest degree in statistics, by type of mathematics department.
*Prior to 2015, CBMS asked about certification for pre-service K-8 teachers, while CBMS 2015 separated K-5 from 6-8. If the results for the two questions on CBMS 2015 are combined, then 63 percent responded that they had a program for certification for K-5 and/or 6-8 teachers.
ments, but slightly larger in 2015 than in 2010 at the masters and bachelors-level departments. At doctor-al-level departments GTA’s taught 35% (SE 6.2) of the sections of Non-Mainstream Calculus I (compared to 25% in 2010), across all formats, almost double the percentage of GTAs teaching Mainstream Calculus I. Table FY.2 and Figure FY.2.1 can be compared to CBMS2010, Table FY.5, p. 121 and Figure FY.5.1, p. 122.
Introductory Statistics (Tables FY.3, FY.4, and FY.8)Table FY.3 presents data on the appointment type
of the instructors in the five introductory statistics courses in mathematics departments of four-year colleges and universities, in fall 2015; the estimated percentages of sections of Introduction Statistics (no calculus prerequisite (course (F1)) taught by various appointment types of mathematics faculty, broken down by level of the mathematics department are displayed in Figure FY.3.1. Table FY.3 can be compared to CBMS2010, Table FY.6, p. 123, which presents data on a slightly different set of courses, using slightly different formats. The percentage of sections of Introductory Statistics (no calculus prereq-uisite (course (F1) on the questionnaire)), across all formats combined, taught by TTE faculty declined slightly at each level of mathematics department from fall 2010 to fall 2015: at doctoral-level departments, in fall 2015, an estimated 13% (SE 3.4) of sections were taught by TTE faculty (the 2010 estimate was 22%), at masters-level departments the fall 2015 percentage was 46% (SE 5) (the 2010 estimate was 50%), and at bachelors-level departments the fall 2015 percentage was 42% (SE 3.3) (the 2010 estimate was 49%). Table FY.3. and Figure FY.3.1 can be compared to Table FY.4 and Figure FY.4.1, which presents the same data for courses taught in statistics departments. At doctoral-
level mathematics departments, in fall 2015, by Table FY.3 an estimated 21% (SE 6.9) of the sections of Introductory Statistics (no calculus prerequisite– course (F1) on the mathematics questionnaire), across all formats combined, were taught by GTAs, compared to 29% in Fall 2010; Table FY.4 shows that in statis-tics departments, in fall 2015, this percentage for course (E1) on the statistics questionnaire was 40% (SE 2.9) (24% in fall 2010 by CBMS2010 Table FY.9, p. 129). Further, the estimated percentage of sections of Introductory Statistics (course (F1)) in doctoral-level mathematics departments, in fall 2015, taught by OFT faculty was 34% (SE 7.1), and in doctoral-level statistics departments the estimated percentage of sections of course (E1) taught by OFT faculty, in fall 2015, was 20% (note that in Table FY.4 OFT statistics faculty are divided into those with a Ph.D., and those without a Ph.D.).
Table FY.4 presents data concerning the appoint-ment type of the instructor of the five introductory statistics courses (courses (E1)-(E5) on the statis-tics questionnaire) taught in statistics departments, in fall 2015; the estimated percentages of sections of Introduction Statistics (no calculus prerequisite (course (E1)) taught by various appointment types of faculty, broken down by level of department, are displayed in Figure FY.4.1. The data show that, in fall 2015, at doctoral-level departments, the largest percentage of sections was taught by GTAs. In Table FY.4, the OFT faculty are broken down into those with a Ph.D., and those without a Ph.D. In the course, Introductory Statistics (calculus prerequisite (courses (E2)), there was less use of GTAs than in course (E1); at the doctoral-level statistics departments, an esti-mated 18% (SE 2.4) of sections for course (E2) were taught by TTE faculty, 31% of sections by OFT faculty (25% (SE 2.2) of sections by OFT faculty with a Ph.D.),

150 2015 CBMS Survey of Undergraduate Programs
and 29% (SE 3.3) by GTAs. This data can be compared to the data obtained in fall 2010 (CBMS2010 Table FY.9, p. 129), which shows that for course (E2), a greater percentage of sections were taught by GTAs and by OFT faculty, and a smaller percentage by TTE faculty, in fall 2015 than in fall 2010 in doctoral-level statistics departments.
The 2015 CBMS survey questionnaire for four-year mathematics departments contained a new additional question inquiring about the highest degree in statis-tics held by mathematics faculty teaching Introductory Statistics (no calculus prerequisite (course (F1)). Departments were asked the following: “the instruc-tors teaching introductory statistics course (F1) typically have received the following highest degree in statistics (check one): no graduate degree, a Master’s degree, or a Ph.D.” The responses from this question are summarized in Table FY.8, which is broken down by level of department. Over all mathematics depart-ments combined (and very close to the estimates at the bachelors-level departments, where there are the most enrollments, and relatively consistently across the three different levels of departments), an estimated 64% (SE 4.5) had no graduate degree in statistics, 21% (SE 4.4) had a Master’s degree in statistics, and 15% (SE 3.5) had a Ph.D. in statistics.
C. Average Section Sizes (Tables FY.1-FY.4)
The tables FY.1-FY.4 also contain the average section sizes for each of the courses discussed above, broken down by the level of the department, and by the format of the class. The average size of Mainstream Calculus I sections increased slightly at the doctoral and masters-level departments from fall 2010 to fall 2015; for example, by Table FY.1, at doctoral-level mathematics departments, in fall 2015, the average lecture section enrolled an estimated 98 (SE 7.6) students, compared to 71 students in fall 2010 (CBMS2010, Table FY.3, p. 119). The estimated average size of Mainstream Calculus I sections, over all formats, in fall 2015, was 60 (SE 5.0) at the doctor-al-level departments, 38 (SE 6.8) at the masters-level departments, and 24 (SE 0.8) at the bachelors-level departments. The average size of Mainstream Calculus II sections was generally about the same size as Mainstream Calculus I sections.
By Table FY.2 the estimated average sizes of Non-Mainstream Calculus I and II sections in fall 2015 were quite similar to that of Mainstream Calculus I and II, and also very nearly that observed in fall 2010 (CBMS2010, Table FY.5, p. 121). Non-Mainstream Calculus I at doctoral-level departments in the “other” (not lecture/recitation or sections that meet as a class) format, in fall 2015, had an estimated average section size of 61 (SE 37.3) (compared to an estimated 32 (SE 1.7) for the Mainstream version), suggesting that, at some doctoral-level mathematics departments,
perhaps some different kinds of format were used for larger groups of students in some Non-Mainstream calculus sections.
The estimated average sizes of introductory statis-tics sections taught in mathematics departments, in fall 2015, are given in Table FY.3, and were about the same sizes as the estimates for Mainstream Calculus I sections. One anomaly is Introductory Statistics (no calculus prerequisite (courses (F1)) at the doctor-al-level mathematics departments, where the average size of lecture sections is estimated at 141 students (SE 24.5). In fall 2015, the estimated average sizes of introductory statistics sections taught in statis-tics departments were slightly larger than the average sizes of the corresponding courses/formats sections in mathematics departments; for example, by Table FY.3, the estimated average size of sections of course (F1) in doctoral-level mathematics departments over all formats combined, in fall 2015, was 42 (SE 3.7), and, by Table FY.4, the estimated average section size of the corresponding course (E1) in doctoral-level statistics departments over all formats combined was 58 (SE 2.6). By Table FY.4, at doctoral-level statis-tics departments, in fall 2015, the estimated average section size of Introductory Statistics (no calculus prerequisite (course (E.1)) in lecture format was 57 (SE 3.7) and in the sections that meet as a class format the estimated average section size was 66 (SE 3.0).
D. Pedagogy in Introductory Statistics (Tables FY.5, FY.6, and FY.7)
As we have noted, statistics course enrollments have increased in two-year and four-year mathe-matics departments, and in statistics departments. There has been considerable interest in how these courses are taught, particularly since they are taught primarily outside of statistics departments, and since the focus of these courses has been shifting from an emphasis on probability theory to the analysis of data (see e.g. [GAISE}, [Moore]). The CBMS 2015 survey pedagogy questions focused on the statistics course, “Introductory Statistics (no calculus prereq-uisite) for non-majors/minors” (course (F1) in the Four-Year Mathematics Questionnaire, and course (E1) in the Four-Year Statistics Questionnaire). The same questions were used in both instruments, so that the results (Table FY.5 for mathematics depart-ments and Table FY.6 for statistics departments) can be compared. This data was discussed in Chapter 1, (see Table S.12 (and Figures S.12.1 and S.12.2)); in this chapter, Table S.12 is broken down by level of mathematics department in Table FY.5, and by level of statistics department in Table FY.6. Furthermore, these same questions (with some small changes) appeared in the CBMS 2010 survey, and the responses from fall 2010 appear in CBMS2010, Tables FY.7, p. 125, and FY.8, p. 127. The questions in this part of the

Chapter 5: First-Year Courses in Four-Year Colleges and Universities 151
survey are in Section G of the statistics questionnaire, and in Section H of the mathematics questionnaire (the questionnaires appear in Appendices IV and VI).
Generally, the results of the CBMS survey showed that in fall 2015 (as in fall 2010) statistics depart-ments were making more use than mathematics departments of the current recommendations for teaching introductory statistics including: use of real data, modern technology, applets, classroom response systems (such as clickers), and in-class activities that encourage student involvement. Table FY.5 shows that at least one version of course (F1) was offered, in fall 2015, at an estimated 50% (SE 4.5) of the doctoral- level mathematics departments, about 75% (SE 5.5) of the masters-level mathematics departments, and 83% (SE 5.8) of the bachelors-level mathematics depart-ments, and each of these percentages is slightly less than estimated in 2010. Table FY.6 shows that at least one version of course (E1), was offered, in fall 2015, at 97% (SE 1.6) of the doctoral-level statistics departments and 85% (SE 5.1) of the masters-level statistics departments, about the same percentages as estimated in 2010. The remaining table entries are percentages of sections from departments that offer these courses. The data in Table FY.5 and Table FY.6 are estimates obtained from the survey responder (not the course instructor).
As an addition to the questions asked in the 2010 CBMS survey, in 2015 departments were asked how many different kinds of introductory courses for non-majors with no calculus prerequisite they offered, and from Table FY.5 we see that, across all levels of mathematics departments combined, in fall 2015, an estimated 72% (SE 5.4) offered only one such course, and almost none offered more 3 or more such courses. However, in statistics departments, Table FY.7 shows that, in fall 2015, an estimated 52% offered three or more such courses. Hence, although we have seen
that mathematics departments had more enrollments in these course than statistics departments had, in fall 2015, statistics departments typically offered more varieties of this course than did mathematics depart-ments.
The survey asked the responder to estimate the percentage of class sessions in most sections, in which real data were used; responders could choose between the percentage intervals: 0-20%, 21-40%, 41-60%, 61-80%, and 81-100%. As noted in Chapter 1, the response chosen most often by mathematics department responders was 0-20% (chosen by 28% (SE 6)), whereas in statistics departments, 81-100% was chosen most often (by 35% (SE 3)); Chapter 1, Table S.12 and Figure S.12.1 display the distribu-tions of the percentages of mathematics and statistics departments that chose each of these intervals. The graph for mathematics departments’ responses was skewed toward the lower percentages, whereas the graph for the statistics departments’ responses was skewed toward the higher percentages, indicating that these courses taught in statistics departments were more likely to put emphasis on the use of real data, than these courses taught in mathematics depart-ments; the graphs have very similar shapes to those obtained in 2010 [CBMS2010, Figure S.13.A.1, p.31]. In Table FY.5 the responses in Table S.12 are broken down by level of mathematics department, and, among doctoral-level departments the interval chosen most often was 81-100% (chosen by 29%), among masters-level departments it was 21-40% (chosen by 29%), and among bachelors-level departments it was 0-20% (chosen by 28%). By Table FY.6 among doctoral-level statistics departments, the interval chosen most often was 81-100% (chosen by 42%) and among masters-level departments it was 61-80% (chosen by 40%).
The survey asked the responder to estimate the percentage of class sessions in most sections, in which Chapter 5 2015 Tables oct20-final.xlsx: FY.9 11/14/2017: 3:52 PM
Univ (PhD)
Univ(MA)
College(BA) Total Univ
(PhD)Univ(MA) Total
Average estimated outside enrollment 710 196 68 134 306 496 328
Estimated outside national enrollment 34369 20217 34988 89574 6038 1296 7334
TABLE FY.9 Of departments that offered Introductory Statistics (no calculus prerequisite) in fall 2015 and where a similar course is offered outside the mathematical sciences departments, the average estimated fall 2015 enrollment of all similar courses and an estimate of the total national enrollment.
Mathematics Depts Statistics Depts
Note: The estimates for statistics departments are for colleges with separate statistics departments. Since such colleges would be expected to also have mathematics departments, adding statistics for both types of departments together would result in duplicating the counts of some students.

152 2015 CBMS Survey of Undergraduate Programs
in-class demonstrations and/or in-class problem solving activities/discussions took place, with the same interval choices available for responses. As noted in Chapter 1, the distributions are displayed in Figure S.12.2. The distribution for in-class demon-strations/problem solving activities for mathematics departments was roughly bell-shaped, whereas the distribution for statistics department had the largest percentages of responses in the 81-100% interval; these distributions can be compared to those obtained in 2010 [CBMS2010, Figure S.13.A.2, p. 31]. Tables FY.5 and FY.6 break the responses down by level of department, and the three levels of mathematics departments had rather similar responses, whereas the masters-level statistics departments responses were skewed toward the low percentage intervals and the doctoral-level statistics departments were more skewed toward the high percentage intervals. The responses from 2015 are similar to the responses in 2010 (CBMS2010, Tables FY.7, p.125, and FY.8, p. 127).
Departments were asked about the use of the following kinds of technology in most sections of their introductory statistics courses: graphing calculators, statistical packages, educational software, applets, spreadsheets, web-based resources (including data sources or data analysis routines) and classroom response systems (e.g. clickers), online textbooks, and online videos (the last two options were added to the 2015 survey). The percentages of mathematics and statistics departments using each of these kinds of technology, in fall 2015, is given in Chapter 1, Table S.12, and broken down by level of department in Tables FY.5 and FY.6; these tables can be compared to the responses obtained in 2010 (CBMS2010, FY.7, p. 125, and FY.8, p. 127). The data show that generally less sophisticated technology, like graphing calculators and spreadsheets, were more popular in Introductory Statistics taught in mathematics departments than in statistics departments, but all the other kinds of technology (particularly statistical packages, applets, classroom response systems) were said to be used in higher percentages of statistics departments’, rather than in mathematics departments’, Introductory Statistics courses. For example, in fall 2015, across all levels of mathematics departments combined, 48% (SE 5.5) departments were using statistical packages in the majority of their sections, whereas across all levels of statistics departments combined, the esti-mated percentage was 68% (SE 3.2). Moreover, in fall 2015, across all levels of mathematics departments combined, 24% (SE 4.2) were using applets, whereas across all levels of statistics departments combined, the estimated percentage was 41% (SE 2.8). In fall 2015, across all levels of mathematics departments combined, an estimated 67% (SE 4.7) of departments were using graphing calculators in the majority of
their sections, whereas, across all levels of statistics departments combined, the estimated percentage was 47% (SE 3.2). The biggest difference in the responses from mathematics departments in 2015 and 2010 was in the use of educational software. Across all levels of mathematics departments combined, in fall 2015, an estimated 50% (SE 4.8) departments responded that educational software was used in the majority of the sections of their course (F1), whereas in fall 2010, the estimated percentage was 19% (the biggest changes occurring at the bachelors and masters-level departments). In statistics departments, there was a smaller percentage of departments using statistical packages in 2015 than in 2010 (estimated 68% (SE 2.8) of departments in 2015, and 87% in 2010), and a greater use of classroom response systems (estimated 50% (SE 3.2) of departments in 2015, and 29% in 2010). Tables FY.5 and FY.6 show that there are some differences across levels of departments; for example, by Table FY.5 in mathematics departments, in fall 2015, educational software was used in 52% (SE 5.9) of bachelors-level departments and 55% (SE 6.7) of masters-level departments, but in only 29% (SE 6.6) of doctoral-level mathematics departments.
The final question on teaching methods in Introductory Statistics asked each department about the percentage of sections of the course that required assessments beyond homework, tests and quizzes (assessments such as projects, oral presentations or written reports); here the percentages were about the same across all levels of mathematics departments combined, and all levels of statistics departments combined, and may, again be compared to the 2010 survey results, where mathematics departments reported 45% of sections and statistics departments reported 36% of sections (CBMS2010, FY.7, p. 125, and FY.8, p. 127). In fall 2015, this percentage was larger at the bachelors-level mathematics departments than at the other levels of mathematics departments: 19% (SE 5.4) at doctoral-level departments, 22% (SE 8.1) at masters-level departments, and 45% (SE 5.8) at bachelors-level departments.
A new question, added to the CBMS 2015 survey, inquired about certain specific topics that might be covered in the Introductory Statistics course ((F1) or (E1)) in fall 2015. Table FY.7 summarizes the data from mathematics and statistics departments, broken down by level of department. Responders were asked to check which (if any) of the following topics were covered in the course: conditional probability, simulation to explore randomness, and resampling techniques (such as bootstrapping and randomiza-tion tests). Conditional probability was covered in an estimated 76% (SE 3.7) of the (F1) courses in mathe-matics departments, across all levels of departments combined (but in about 90% of the courses in the doctoral and masters-level mathematics departments);

Chapter 5: First-Year Courses in Four-Year Colleges and Universities 153
it was covered in an estimated 83% (SE 2.5) of the (E1) courses in statistics departments, across all levels of statistics department combined. Simulation to explore randomness was covered in an estimated 51% (SE 4.7) of mathematics courses, and 73% (SE 2.5) of statistics courses. Resampling techniques were covered in 22%
(SE 5.1) of mathematics courses, and 39% (SE 2.9) of statistics courses; in this case, the percentage was smaller than the combined average of 22% at doctor-al-level mathematics departments (where it was 9% (SE 5)) and at masters-level statistics departments (where it was 8% (SE 4.1)).