Chapter 5 Financial Case December 2017 · PDF fileMETROWEST PHASE 1 CHAPTER 5 - FINANCIAL CASE...
19
METROWEST PHASE 1 OUTLINE BUSINESS CASE Chapter 5 Financial Case December 2017
Transcript of Chapter 5 Financial Case December 2017 · PDF fileMETROWEST PHASE 1 CHAPTER 5 - FINANCIAL CASE...

METROWEST PHASE 1
OUTLINE BUSINESS CASE
Chapter 5 Financial Case
December 2017
METROWEST PHASE 1 CHAPTER 5 - FINANCIAL CASE
5-1
Chapter 5: Financial Case Contents Page
5.1 Introduction ................................................................................................................. 5-2
5.2 Scheme Costs ................................................................................................................ 5-2
5.3 Capital Costs ................................................................................................................. 5-3
5.4 Operational Costs ......................................................................................................... 5-6
5.5 Budgets & Funding Position ........................................................................................... 5-9 5.5.1 Funding of Preparation Costs up to the submission of the OBC ............................... 5-9 5.5.2 Funding of Preparation Costs (OBC to FBC) and Construction Costs......................... 5-9 5.5.3 Funding of Operational Costs .................................................................................. 5-11 5.5.4 Funding of Long Term Asset Renewal Costs ............................................................ 5-15 5.5.5 Alternative Scheme Funding Approach ................................................................... 5-15
5.6 Summary of Financial Case .......................................................................................... 5-18 Tables
Table 5.1 – Scheme Estimated Capital Out-turn Cost by Cost Heading .................................. 5-3 Table 5.2 - Indicative Train Operator Costs (Post Opening Train Service Costs) .................... 5-7 Table 5.3 - Scheme Sunken Costs ........................................................................................... 5-9 Table 5.4 - Scheme Funding Sources .................................................................................... 5-10 Table 5.5 - Scheme Spend Profile ......................................................................................... 5-11 Table 5.6 - Estimated Operating Costs and Forecast Revenue ............................................. 5-11 Table 5.7 - Scheme Indicative Revenue Profile Over 60 Years (based on Full Operating Cost Risks) ..................................................................................................................................... 5-17
Figures
Figure 5.1 - Scheme Estimated Capital Out-turn Cost ............................................................ 5-4 Figure 5.2 - Estimated Operating Costs and Forecast Revenue ............................................ 5-13 Figure 5.3 - Portishead to Bristol TM – Maximum Passengers Per Train 08:00-09:00 ......... 5-14 Figure 5.4 - Bristol TM to Portishead – Maximum Passengers Per Train 17:00-18:00 ......... 5-14 Figure 5.5 - One Train Per Hour Comparator Stations by Location Type ............................. 5-15
Appendices
Appendix 5.1 - Network Rail Value Engineering Report June 2017
METROWEST PHASE 1 CHAPTER 5 - FINANCIAL CASE
5-2
CHAPTER 5
Financial Case
5.1 Introduction
The estimated scheme capital out-turn cost is £106,071,658 excluding preparation costs to date
(technical work and engineering design prior to the submission of this Outline Business Case),
excluding provision for potential Part 1 claims and excluding scheme monitoring and evaluation
costs. These three cost areas in total amount to £10,391,057, in addition to these costs are
operational costs which are to be dealt with separately. Therefore the total estimated scheme
delivery cost (excluding operational costs) to be borne by the Authorities including cost of work to
date, Part 1 claims and monitoring and evaluations is £116,462,715.
In respect of scheme operational costs negotiations between the Authorities and the DfT Rail
Executive are on-going and there are both operational options being considered by DfT and
commercial /contractual options. The base position is that the DfT’s three year rule would apply
whereby the Authorities would have to fund all the operational costs during the first years of
operation. However, the proposed train services are forecast to generate a revenue surplus by the
end of year six and that by year 10 the surplus is approx £1M per annum, consequently the three
year rule may not be the most appropriate option.
5.2 Scheme Costs
The delivery and operation of the scheme entails a four stage cost lifecycle, as follows:
1. Preparation costs up to submission of Outline Business Case (Sunken Costs)
2. Preparation costs from Outline Business Case to Full Business Case Approval and
Construction Costs (Scheme Out-turn Cost)
3. Operational costs (train service, railway and highway maintenance costs)
4. Long term asset renewal costs eg track renewal costs, train replacement costs
Item 1 - Preparation costs up to submission of Outline Business Case are sunken costs and have been
met by the Authorities.
Items 2 - Preparation Costs and Construction Costs are capital costs (except costs for Part 1 claims
and monitoring and evaluation costs) and will be met by a combination of funding budgeted by the
Authorities and funding to be secured through the DfT Large Local Major Scheme Fund or other
funding mechanism. For further details see section 5.3 and Table 5.1.
Item 3 - Operational costs include train service costs, railway and highway maintenance costs. These
costs are examined in detail in section 5.4 and Table 5.2.
Item 4 - Long term asset renewal costs includes long term industry costs of renewing track and
infrastructure (in year 20, 30 & 40) and train replacement costs (year 30). Both of these costs will
fall upon the public sector, via Network Rail in respect of track renewal and DfT (directly or
indirectly) in respect of train replacement costs. These costs have been estimated for the economic
appraisal and included in calculating the net present costs.

METROWEST PHASE 1 CHAPTER 5 - FINANCIAL CASE
5-3
5.3 Capital Costs
The scheme estimated capital out-turn cost is £106,071,658 excluding preparation costs to date
(technical work and engineering design prior to the submission of this Outline Business Case),
excluding provision for potential Part 1 claims and excluding scheme monitoring and evaluation
costs. These three cost areas in total amount to £10,391,057, in addition to these costs are
operational costs which are to be dealt with separately. Therefore the total estimated scheme out-
turn cost to be borne by the Authorities including cost of work to date, Part 1 claims and monitoring
and evaluations is £116,462,715.
Table 5.1 and Figure 5.1 shows the capital out-turn cost by cost heading. The cost estimate is based
on GRIP stage 3 Option Selection Approval in Principle (AIP) design. The GRIP 3 AIP deign is built
around a 3d model and includes the Network Rail engineering disciplines: Track formation, Geo-
technical & drainage, Structures, Signalling and Electrical & Plant, Communications (GSMR),
Overhead Line Equipment (for Bathampton Turnback only), Buildings & Property and Maintenance.
The GRIP 3 AIP deliverables are extensive and comprise of over 300 reports and drawings. All the
mandatory deliverables required at GRIP Stage 3 have been undertaken and have achieved Route
Asset Manager (RAM) technical approval. Above and beyond this additional deliverables that are
normally undertaken GRIP 5 were undertaken during GRIP3, including extensive ground investigation
works and track telemetry modelling, to reduce risks particularly in respect of informing the scheme
red line boundary and construction strategy. Further information about the scheme engineering
design and technical work is set out in chapter 3, the Management Case.
Table 5.1 – Scheme Estimated Capital Out-turn Cost by Cost Heading Cost Heading
Scheme Delivery
Costs*
Preparation Costs - Outline Business Case to Full Business Case £12,751,887
Railway construction costs (2017 prices excl risk & inf) £53,600,000
Network Rail Ind Risk & Fee Fund for railway construction £2,000,000
Highway construction costs (2017 prices excl risk & Inf) £6,975,497
Land costs £3,179,054
Mitigation works & Misc costs £2,529,525
Sub-total £81,035,963
Risk £20,221,425
Inflation £4,814,271
Total including all Costs £106,071,658
* excluding preparation costs to date, provision for potential Part1 claims and scheme monitoring and evaluation costs.
The estimate has been informed by both internal processes within Network Rail including inter-
disciplinary reviews (across eight engineering disciplines) and also has been subject to independent
review via Mott MacDonald appointed by the Authorities as its Independent Cost Estimation
Reviewer. Mott MacDonald have been appointed based on their considerable experience
undertaking similar work in the rail industry including major projects with Transport for London and
Cambridgeshire County Council. Their work has included examining scheme costs including
engineering design, construction methodology, project management, industry fees and approaches
to risk and inflation.

METROWEST PHASE 1 CHAPTER 5 - FINANCIAL CASE
5-4
Figure 5.1 - Scheme Estimated Capital Out-turn Cost
Risk
A full Quantified Cost Risk Assessment (QCRA) was undertaken in March 2017 to assess risk exposure
and inform the cost estimate and is attached to chapter 3 Management Case as appendix 3.6. As a
third party scheme, the risks modelled were divided into the following categories:
1. NR Project Risks – risks associated with Network Rail’s execution of the project
2. NR Integration Risks – risks on the integration (and timely completion) of other NR
programmes
3. Client Risks – risks owned by the promoting authorities
The majority of risks that are programme level in nature, excluding the integration risks are held by
the Authorities. The GRIP3 cost estimate was completed in March 2017 (based on the 2 trains per
hour option) and this included the QCRA modelling with a P80 output of £24.8M combined total.
The GRIP3 cost estimate including all client costs totalled £160M, which was considerably higher
than the previous GRIP2 cost estimate. This presented major affordability issues for the Authorities
and in discussion with the rail industry, the Authorities decided in March 2017 to proceed with a
lower cost option for the Portishead Line (one train per hour instead of two trains per hour).
This resulted in a considerable amount of railway infrastructure being removed from the scheme,
through value engineering informed by further train pathing modelling (Railsys), refer to the
strategic Case chapter 1 for further details. The value engineering exercise was completed in June
2017 and included revisions to the QCRA, see appendix 5.1. Between June and December 17
revisions to the GRIP3 AIP design were undertaken based on the revised value engineering scope.
The QCRA was further updated in December 2017 and resulted in a P80 output of £20.2M. The
£20.2M risk provision equates to 28% of the total preparation and construction costs.
Prep Costs - post OBC12%
Railway construction costs
51%
Network Rail Ind Risk & Fee
2%
Highway construction costs
7%
Land costs3%
Mitigation & Misc costs 2%
Risk19%
Inflation5%

METROWEST PHASE 1 CHAPTER 5 - FINANCIAL CASE
5-5
Inflation
The Building Cost Information Service (BCIS) central forecast to 2021 Q2 has been used for inflation
estimation. The forecast is based on the BCIS Price Adjustment Formulae Indices, developed and
managed by the Royal Institute of Chartered Surveyors (RICS). This indices has been used in
preference to Retail Prices Index (RPI) because using RPI would result in a risk of insufficient
provision for inflation. The BCIS Price Adjustment Formulae Indices is based on a data set of
underlying construction and materials costs which are regularly updated inline which fluctuations in
markets, industry practises and industry buoyancy. The total provision for risk is £4,814,271, which
equates to a total uplift of 8% on 2017 Q3 estimated construction costs.
Commenting on BCIS Price Adjustment Formulae Indices, Robert Stockwell Crossrail Ltd (CRL) said
“At Crossrail we have administered NEC3 Contracts with Secondary Option X1 clauses using the BCIS
Price Adjustment Formulae Indices (PAFI). By using the BCIS Indices we have been able to procure
contracts where inflation is identified as an Employers’ risk which could otherwise have been priced
by our Tier 1 Contractors at a potentially high risk premium. The biggest benefit of using the BCIS
Price Adjustment Formulae Indices is that it promotes a collaborative commercial arrangement
between the project manager and contractor by setting out in the contract tender process exactly
how the impact of inflation will be measured and how the Contractor will recover costs through the
administration of a periodic Price Adjustment”. Source: BCIS Inflation Adjustment Clauses - May
2016.

METROWEST PHASE 1 CHAPTER 5 - FINANCIAL CASE
5-6
5.4 Operational Costs
The scheme operational costs comprise of four main elements:
I. Train operator costs (pre-opening mobilisation costs) leading up to the start of the train
services
II. Train operator costs (post opening train service) during the first three years of operation
III. Network Rail infrastructure maintenance costs, from opening to the start of the next control
period
IV. Highway maintenance and car park operating costs
Train Operator Costs - pre-opening mobilisation Costs
Prior to scheme opening there will be some train operator costs (pre-opening mobilisation costs)
comprising of recruitment and training of train drivers and train managers, training of additional
staff (depot pool) operational commissioning and testing cost (new rail infrastructure, stations,
ticketing etc). A total of 18 addition train drivers will be required and 13.5 train conductors to
operate the MetroWest Phase 1 train services (further information on this is set out in the following
paragraphs). The initial estimate for these mobilisation costs is £1.74M, with costs commencing T-
18 months to T-0 scheme opening.
Although the Authorities do not take issue that these costs will need to be borne, the largest
proportion of these costs relate to the cost of recruiting and training new train drivers and
conductors. Training a new train driver takes 18 months and the investment produces a medium to
long term asset for the rail industry. While MetroWest Phase 1 should pay its fair share of
operational costs it should not be expected to meet what are essentially medium to long term rail
industry costs.
Train Operator Costs - post opening train service costs
The scheme will augment the existing Severn Beach Line service, which is currently operated using
two train sets and augment the existing Bath Spa to Bristol local train service, which is operated as
part of a regional route. The enhancement of the Severn Beach Line service and the Bath Spa to
Bristol service requires two additional train sets (based on Railsys modelling to date). The reopening
of the Portishead Line with an hourly service requires one train set. For the hourly plus option
(hourly with peak enhancement) an additional train set is required for the peak. Each train set will
operate in a three car formation, therefore a total of nine train units will be required to operate the
base MetroWest Phase 1 service (with an hourly service for the Portishead Line).
Table 5.2 sets out a summary of the composition of train operator costs, provided by Great Western
Railway.
There are number of constraints in resourcing additional train crew:
Shifts for members of train crew including rest periods and booking on and off may only last
eight hours. Therefore, to cover an eighteen hour service, three shifts are typically required.
Opportunities may present themselves to create efficient diagrams by integrating with
existing diagrams. However these may already be as efficient as possible and additional
interworking creates inherent performance risks (train and crew not necessarily being in the
same place at the same time).

METROWEST PHASE 1 CHAPTER 5 - FINANCIAL CASE
5-7
Each member of train crew only works four days in seven. So allowing for leave and sickness
two heads are required to cover each driver turn and 1.5 to cover each conductor turn.
Across a large train crew pool there may be minor efficiencies available but these will be
limited.
Therefore it can be assumed that the likely net additional train crew requirement is
effectively 18 train drivers (3 trains x 3 shifts x 2 heads) and 13.5 conductors (3 trains x 3
shifts x 1.5 heads).
There are also constraints in respect of rolling stock:
The train path modelling (Railsys) indicates that MetroWest Phase 1 requires three
additional train sets in three car formations (nine train units in total), however the large
number of enhancement and renewal schemes currently being delivered in a relatively short
period in late control period 5 and early control period 6, is causing a degree of uncertainty
in the modelling undertaken to date. This will be clarified by further Railsys modelling based
on the final December 2018 timetable, which is expected to be available around Easter
2018.
The commercial rolling stock market via the rolling stock operating companies (ROSCOs) can
fluctuate in accordance with demand, therefore the costs set out in Table 5.2 are indicative.
Table 5.2 also shows the costs estimated for the 2014 Preliminary Business Case option 5B (previous
central case), for comparative purposes.
Table 5.2 - Indicative Train Operator Costs (Post Opening Train Service Costs) Operational Cost Operational Cost Detail OBC Central Case
Severn Beach and Bath corridors 2 TPH, Portishead corridor 1TPH
9 x Class 165/6
PBC 2014 (Option 5B)
All three corridors 2TPH
12 x Class 165/6
Base Estimate Mileage Costs £1.129 £1.218
Lease Costs £1.482 £1.976
Staff Costs £1.548 £2.064
Station Costs £0.271 £0.271
Base Estimate Total £4.430 £5.529
Operational Risk Fuel price +50% £0.319 £0.427
Spare Train Unit (Maintenance) - - - - £0.494
More Train Managers per turn £0.162 £0.216
Station Staff at Portishead - - - - £0.241
Depot Staff £0.379 - - - -
Sub-total £0.860 £1.378
Risk Adjusted Total (all numbers £M) £5.290 £6.907
Network Rail Infrastructure Maintenance Costs
The maintenance costs incurred by Network Rail in the early years after scheme opening are likely to
be very modest, because the key railway assets will either be new or in a renewed condition.

METROWEST PHASE 1 CHAPTER 5 - FINANCIAL CASE
5-8
Network Rail have informed the Authorities informally that it is unlikely that it would levy any
maintenance costs onto the Authorities to cover any maintenance costs from midpoint in the control
period to the end of the control period, subject to internal approval. Towards the end of control
period 6, post scheme opening Network Rail will seek to include the new MetroWest Phase 1 assets
into the regulatory asset base (RAB) in negotiation with the Office of Rail & Road leading into the
next control period. For the economic appraisal undertaken to the Economic Case chapter 2,
theoretical maintenance costs were included in the detailed appraisal calculations.
Highway Maintenance Cost
Most of the highway works are to be delivered within North Somerset Council’s area, with the
remainder of works delivered in Bristol City Council’s area. A section 278 agreement (under the
Highways Act 1980) will be entered into with each of the highway authorities. Furthermore each
Council has agreed to own and maintain the new highway assets delivered in its area. The scheme
highway works are of a relatively minor nature, the biggest item entails the re-alignment of the
northern end of Quays Avenue, Portishead. Quays Avenue is already maintained by North Somerset
Council as part of the adopted highway and the realignment of the northern end of the road will not
result in any additional highway maintenance costs. The four road over bridges on the dis-used
section of railway between Portishead and Pill are already maintained by North Somerset Council as
part of the adopted highway. While some defect rectification works will be undertaken to the
bridges as part of the scheme works, the scheme will not result in any additional ongoing
maintenance requirements for the bridges.
Other highway maintenance costs include maintenance costs of new toucan crossing at Quays
Avenue, various other informal pedestrian crossing points, a 150m extension of a bridleway east of
the M5, a new 300 metre pedestrian & cycle boulevard on Harbour Road, a new footbridge next to
Trinity Primary school and landscaping / ecology maintenance costs. These maintenance costs will
be borne by North Somerset Council’s Highways & Transport Service and total approximately
£0.08M per annum. At Ashton Gate, Bristol a new pedestrian and cycle ramp is to be delivered
along with a 100 m extension to a left turn only lane and an upgrade to a set of high traffic signals.
The maintenance costs of these assets are very modest. Note the sections of National Cycle Route 26
that run under three highway bridges are already maintained by Sustrans and will continue to be
maintained by them.
Car Park Operating Costs
The scheme entails delivery of three new car parks, two for Portishead station and one for Pill
station. The operating costs of the car parks include rates, electricity, operational staffing and asset
maintenance. The total estimated operating cost of the two Portishead station car parks is £0.03M
per annum and £0.008M per annum for Pill station car park. All three car parks will be operated by
North Somerset Council’s Highway & Transport Service with a charging tariff. The exact tariff is yet
to be decided however the working assumption is a charge of £2 to £3 per day for Portishead and
slightly lower for Pill. Using the forecast passenger demand profiled by mode of transport arrivals at
the stations (see Forecasting Report appended to the Economic Case chapter 2), the forecast total
revenue for all three car parks is £0.145M in the opening year, giving a forecast revenue surplus of
£0.107M.
Given, the forecast revenue surplus from the car parks is substantially greater than the highway
maintenance costs, these costs are being treated as cost neutral by North Somerset Council’s
Highway & Transport Service. In other words the Council will offset the highway maintenance costs
from the car parking revenue surplus.

METROWEST PHASE 1 CHAPTER 5 - FINANCIAL CASE
5-9
5.5 Budgets & Funding Position
As set out in section 5.2 the delivery and operation of the scheme entails a four stage cost lifecycle,
as follows:
1. Preparation costs up to submission of Outline Business Case
2. Preparation costs from Outline Business Case to Full Business Case Approval and
Construction Costs (Scheme Out-turn Cost)
3. Operational costs (train service, railway and highway maintenance costs)
4. Long term asset renewal costs eg track renewal costs, train replacement costs
5.5.1 Funding of Preparation Costs up to the submission of the OBC
The MetroWest Phase 1 scheme was launched in 2013. The total of preparation costs from May
2013 up to the submission of this Outline Business Case in December 2017 is £10,116,057. The costs
have been met by the Authorities and are treated as sunken costs. Table 5.3 sets out the funding
sources for the sunken costs.
Table 5.3 - Scheme Sunken Costs
Funding Source Sub-total
Local Contribution - Prior to OBC Cash contributions by the Councils £2,214,921
up to December 17 Local Growth Funding by WoE LEP £7,901,136
Sub-total £10,116,057
5.5.2 Funding of Preparation Costs (OBC to FBC) and Construction Costs The estimated preparation cost from the Outline Business Case to the Full Business Case is
£12,751,887. In order to achieve the Full Business Case the scheme must meet rail industry GRIP
costs (GRIP 4 & 5) and also substantial costs to achieve powers to build and operate the scheme,
including Development Consent Order costs and Habitat Regulations Assessment costs. The
preparation cost to Full Business Case are to be met by the Authorities (using combination of cash
resources and Local Growth Funding).
The estimated scheme capital out-turn cost is £106,071,658 excluding preparation costs up to the
submission of this Outline Business Case, (which are set out in Table 5.3), excluding provision for
potential Part1 claims and excluding scheme monitoring and evaluation costs. These three cost areas
in total amount to £10,391,057. Therefore the total estimated scheme delivery cost (excluding
operational costs) to be borne by the Authorities including cost of work to date, Part 1 claims and
monitoring and evaluations is £116,462,715.
With a scheme budget of £57,813,000 this left a total funding gap of £58,649,715 leading up to the
submission of this Outline Business Case. The initial task for the Authorities was to examine all
possible sources of local funding within the West of England including Local Growth Funding (LGF)
and Economic Development Funding (EDF), West of England Combined Authority Funding and
Council reserves. The outcome of the examination was that all LGF and EDF was already fully
committed to high priority schemes. While an allocation of West of England Combined Authority
Funding was identified as a potential option, there are issues and constraints with this funding

METROWEST PHASE 1 CHAPTER 5 - FINANCIAL CASE
5-10
source. The lead Authority for MetroWest Phase 1 North Somerset Council (within which most of
the scheme infrastructure is to be delivered) is not part of the West of England Combined Authority
(WECA). WECA comprises of the Bath & North East Somerset, Bristol City and South Gloucestershire
Council areas. MetroWest Phase 1 is a cross boundary scheme, and the proportion of the scheme
(on a mileage basis) within WECA is relatively modest.
In respect of Council reserves these are very limited due in part to the sustained period of reduction
in central Government revenue funding for local Government since 2010. Given the outlook of
further reduction in local Government revenue support, no funds are available from Council
reserves. Another possible funding source identified was borrowing on the back of Portishead
station car park and this could contribute circa £1M. Note this has subsequently been built into
North Somerset Councils additional contribution of £5.86M, as set out below.
Having established at an early stage (summer 2017) that it would not be feasible for the Authorities
to meet the total funding gap, the Authorities engaged in discussions with the DfT on how the
scheme could be funded. The DfT advised that one potential funding mechanism is the Large Local
Major Scheme Fund. This fund requires the promoter to provide a local contribution, although the
amount is not prescribed, the fund entails a competitive bidding process with a strong focus of
decision making on value for money in terms of both the BCR and the limiting the net amount of
funding sought from the DfT by the promoters.
In early December 2017 the Authorities increased the local contribution by a further £11,720,000 to
£69,533,000 to support a Large Local Major Scheme Fund bid to the DfT. £10,116,057 of the
Authorities £69,533,000 budget has been spent on preparation costs prior to the submission of this
Outline Business Case, leaving £59,141,943. With the additional £11,720,000 allocated by the
Authorities this leaves a net funding gap of £46,929,715 which is being sought from the DfT through
a Large Local Major Scheme bid.
This equates to a local contribution of 56% with the remaining 44% being sought from the DfT. Both
the scheme cost and indeed the total local contribution is above the DfT’s threshold of £59M
minimum scheme cost for the WoE (as set out in DfT Guidance) for consideration of Large Local
Major Scheme Funding, for schemes which otherwise are too large to be funded locally. The funding
sources for the scheme estimated out-turn are shown in Table 5.4. The spend profile for the scheme
estimated out-turn is shown in Table 5.5.
Table 5.4 - Scheme Funding Sources
Funding Source Sub-total %
Local Contribution Cash contributions by the Councils 1 £1,923,079 -
- Post OBC Local Growth Funding by WoE LEP £45,498,864 -
North Somerset Council - further cash 2 £5,860,000 -
West of England Combined Authority - cash 2 £5,860,000 -
Sub-total £59,141,943 56%
Large Local Major Funding Sought £46,929,715 44%
Total Scheme Budget £106,071,658 100% 1 a further sum has been allocated by the Councils for Part 1 Claims and Evaluation & Monitoring Costs 2 this funding has been allocated to support the Large Local Majors Funding Bid

METROWEST PHASE 1 CHAPTER 5 - FINANCIAL CASE
5-11
Table 5.5 - Scheme Spend Profile
Note the above spend profile is subject to agreement by the WoE LEP (through approval by the West
of England Joint Committee) to amend the profile of LGF funding between years, from the current
approved profile. The revised spend profile includes moving of £9.883M of LGF funding from
construction to preparation costs, in light of the revised scheme programme. This re-profiling of LGF
funding does not change the total spend of £53.4M of LGF by March 2021.
5.5.3 Funding of Operational Costs
The estimated operating costs in the opening year of the scheme total £5,372,299 (see section 5.4
for the detail cost breakdown). The opening year operating costs includes a 19% risk uplift on the
base cost estimate provided by Great Western Railways, based on a P50 risk output (see table 5.2).
These operating costs in the opening year are largely off-set by forecast farebox revenue of
£4,385,000, leaving a net subsidy requirement of £987,099. After the opening year the forecast
revenue increases each year such that the train service breaks even in year six. By the end of year
10 the train service is forecast to generate a net surplus of just under £1M per annum, see table 5.6.
Table 5.6 - Estimated Operating Costs and Forecast Revenue
The forecast revenue growth arises from growth in forecast passenger demand during the first ten
years and into the medium term. This growth in passenger demand is driven by three main factors:
Ramp up - the forecast passenger trips produced by the Rail Demand Model, refer to the
Economic Case chapter 2 for more details, have been manually adjusted (reduced) to take
account of the fact that demand for a new train service does not switch on 100% from day
one. There is an initial period of typically two or three months for people to adjust to the
new service. The financial profiling shown in Table 5.6 has included a ramp up factor based
on 90% of the forecast demand in year 1 increasing to 95% in year 2, with year 3 based on
100% of demand.
Latent demand and personal strategic decision making - the absence of a rail offer on the
Portishead corridor has the effect of suppressing total travel on the corridor for all modes,
Funding Source 2017/18 Q4
Estimated
Spend
2018/19
Estimated
Spend
2019/20
Estimated
Spend
2020/21
Estimated
Spend
2021/22
Estimated
Spend
Total
Prep Costs - LGF funding 945,434£ 4,019,034£ 5,864,340£ -£ -£ 10,828,808£
Prep Costs - Authority funding:
Bath & North East Somerset -£ 120,450£ 168,012£ -£ -£ 288,462£
Bristol City -£ 240,900£ 336,024£ -£ -£ 576,924£
North Somerset -£ 401,500£ 560,040£ -£ -£ 961,540£
South Gloucestershire -£ 40,150£ 56,004£ -£ -£ 96,154£
Sub-total Prep Costs - Authority funding -£ 803,000£ 1,120,079£ -£ -£ 1,923,079£
Construction Costs - LGF funding -£ -£ 6,453,695£ 28,216,361£ -£ 34,670,056£
Construction Costs - Authority funding:
North Somerset -£ -£ -£ -£ 5,860,000£ 5,860,000£
West of England Combined Authority -£ -£ -£ -£ 5,860,000£ 5,860,000£
Sub-total Construction Costs - Authority funding -£ -£ -£ -£ 11,720,000£ 11,720,000£
Construction Costs - DfT Large Local Major -£ -£ -£ 20,043,239£ 26,886,476£ 46,929,715£
Total 945,434£ 4,822,034£ 13,438,114£ 48,259,600£ 38,606,476£ 106,071,658£
2021 2022 2023 2024 2025 2026 2027 2028 2029 2030
Scheme Estimated Operating Costs 5,372,299 5,521,040 5,681,070 5,853,201 6,038,333 6,229,970 6,428,363 6,633,772 6,846,466 7,066,728
Scheme Forecast Revenue £4,385,200 £4,830,408 £5,289,775 £5,627,691 £5,981,376 £6,354,164 £6,746,866 £7,160,311 £7,595,351 £8,052,854
Scheme Net Revenue Position -£987,099 -£690,632 -£391,295 -£225,510 -£56,956 £124,194 £318,503 £526,540 £748,885 £986,126
METROWEST PHASE 1 CHAPTER 5 - FINANCIAL CASE
5-12
because of the inherent unreliable journey times by car and by bus into and out of Bristol,
this results in latent demand (demand above what would normally be expected from
modelling existing trip flows/patterns). This effect can be augmented further by personal
strategic decision making after an initial period of operation. For example, a commuter who
tries out the new train service in the first few months, switching between a few days a week
traveling by train and a few days a week by car, may decide after a few months to sell a car
(typically second household car) thereby limiting his/her access to a car and opt for the train
every day of the week.
Underlying growth in rail passenger demand - as set out in the Strategic Case Chapter 1, ORR
data shows the ten year growth from 2006/7 to 2015/16 was 63%, averaging 5.6% per
annum for all stations in the West of England. This is the main driver of the increase in
forecast farebox revenue during the first ten years and into the medium term. Note
inflation has been assumed to apply to both fares and operating costs in future years in the
financial profile.
Detailed information about the assumptions used for calculation of farebox revenue is set out in the
Forecasting Report which is appended to chapter 2 the Economic Case. The fare tariff has been
calculated based on a basket of fares which takes into account purchase of season tickets, use of rail
cards etc to produce a rate of 26½ pence per mile. Furthermore a number of sensitivity tests have
also been undertaken on the scheme revenue profile.
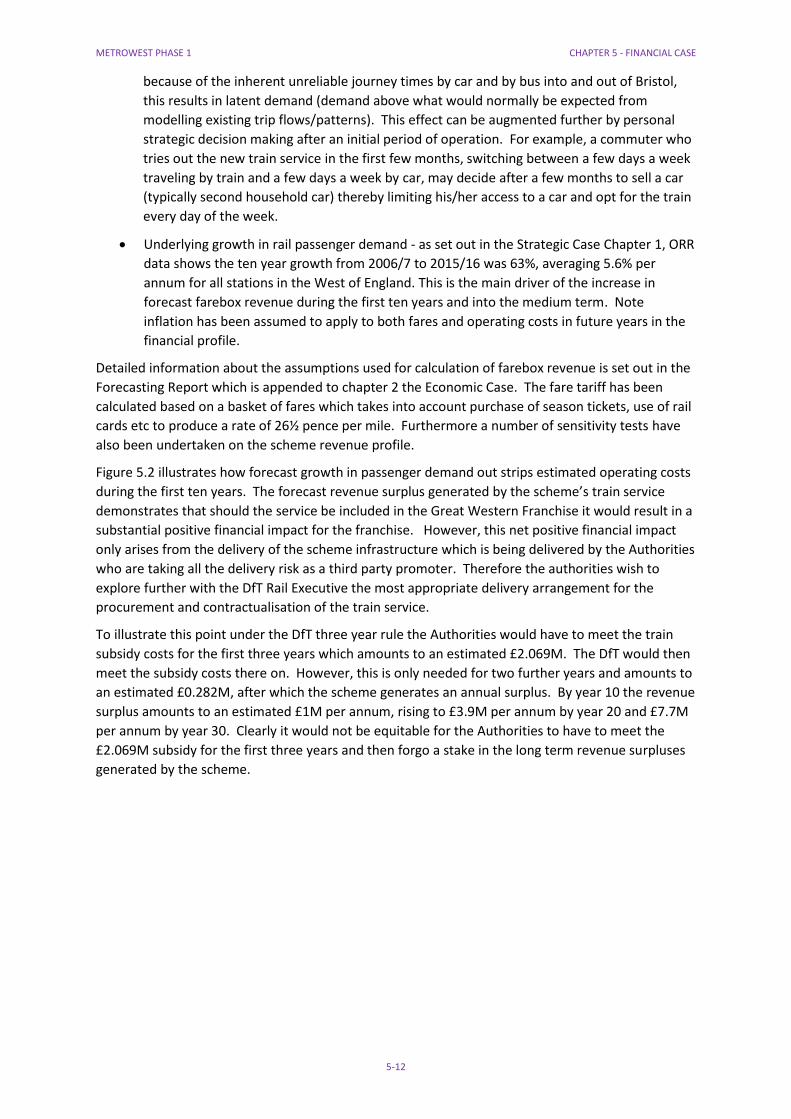
Figure 5.2 illustrates how forecast growth in passenger demand out strips estimated operating costs
during the first ten years. The forecast revenue surplus generated by the scheme’s train service
demonstrates that should the service be included in the Great Western Franchise it would result in a
substantial positive financial impact for the franchise. However, this net positive financial impact
only arises from the delivery of the scheme infrastructure which is being delivered by the Authorities
who are taking all the delivery risk as a third party promoter. Therefore the authorities wish to
explore further with the DfT Rail Executive the most appropriate delivery arrangement for the
procurement and contractualisation of the train service.
To illustrate this point under the DfT three year rule the Authorities would have to meet the train
subsidy costs for the first three years which amounts to an estimated £2.069M. The DfT would then
meet the subsidy costs there on. However, this is only needed for two further years and amounts to
an estimated £0.282M, after which the scheme generates an annual surplus. By year 10 the revenue
surplus amounts to an estimated £1M per annum, rising to £3.9M per annum by year 20 and £7.7M
per annum by year 30. Clearly it would not be equitable for the Authorities to have to meet the
£2.069M subsidy for the first three years and then forgo a stake in the long term revenue surpluses
generated by the scheme.

METROWEST PHASE 1 CHAPTER 5 - FINANCIAL CASE
5-13
Figure 5.2 - Estimated Operating Costs and Forecast Revenue
Service Capacity
The operating cost estimate provided by Great Western Railway is based on Class 165/6 trains
operating in three car formations. Each three car train has approximately 270 seats and standing
capacity for approximately a further 130 people. Figure 5.3 and 5.4 below shows that full standing
capacity is not reached within the first ten years of service, however taking account of passenger
comfort, an upgrade to 5 car train formations would be likely around year 10.
Note both new stations at Portishead and Pill are to be delivered with 5 car length platforms from
the outset, furthermore all the existing station on the Portishead line (Parson Street, Bedminster and
Bristol Temple Meads) have 5 car length platforms. The local stations on the Bath Spa to Bristol Line
(Keynsham and Oldfield Park) also already have 5 car length platforms. The stations on the Severn
Beach Line has a mixture of platform lengths.

METROWEST PHASE 1 CHAPTER 5 - FINANCIAL CASE
5-14
Figure 5.3 - Portishead to Bristol TM – Maximum Passengers Per Train 08:00-09:00
Figure 5.4 - Bristol TM to Portishead – Maximum Passengers Per Train 17:00-18:00
Robustness of the Passenger Demand Forecast
The passenger demand forecast is based on a Rail Demand Model which encompasses three main
elements; the Network Rail MORIA model to changes in demand to existing stations, a CH2M gravity
demand model for the two new stations and the sub-regional GBATS4 multi-modal model which is
being used as a cross check for Network Rail and CH2M model and used to calculate the scheme
non-user benefits. Further detail about the Rail Demand Model is set out in the Economic Case
chapter 2.

METROWEST PHASE 1 CHAPTER 5 - FINANCIAL CASE
5-15
Having built, validated and operated the Rail Demand Model, the model output has been put
through a further check to benchmark the results against similar existing stations and their
respective passenger volumes. This additional benchmarking provides an extra level of assurance for
the Authorities in the robustness of the passenger demand forecasting. The results of the
benchmarking illustrated in Figure 5.5 show that the forecast demand for each of the new stations is
very comparable with existing peer group stations.
Figure 5.5 - One Train Per Hour Comparator Stations by Location Type
5.5.4 Funding of Long Term Asset Renewal Costs
The scheme infrastructure assets will be transferred to Network Rail at GRIP stage 7. As set out in
section 5.4 Network Rail will seek to include the assets within its Regulatory Asset Base (RAB) as part
of its periodic (Control Period 7) funding settlement. Aside from on-going maintenance operating
costs, there will be a need to renew key assets approximately every 30 years, which typically include
track formation and signalling. At part of the RAB these renewal costs will be met by Network Rail.
In respect of the train service, there will be a need for heavy maintenance work to rolling stock every
10-15 years and major rebuild or renew every 30 years. These costs are built into the rolling stock
leasing costs which contains both a ‘Base Capital’ element and a ‘Non Base Capital Reserve’ element.
5.5.5 Alternative Scheme Funding Approach
Section 5.1.3 demonstrates the MetroWest Phase 1 train service yields a strong financial
performance, generating a revenue surplus from year 6 onwards, based on a conservative

METROWEST PHASE 1 CHAPTER 5 - FINANCIAL CASE
5-16
operational cost and forecast revenue methodology. Table 5.6 shows that by year 10 the train
service is forecast to generate a net surplus of just under £1M per annum. The paragraphs following
Table 5.6 explains the context of how forecast growth in passenger demand out strips estimated
operating costs during the first ten years.
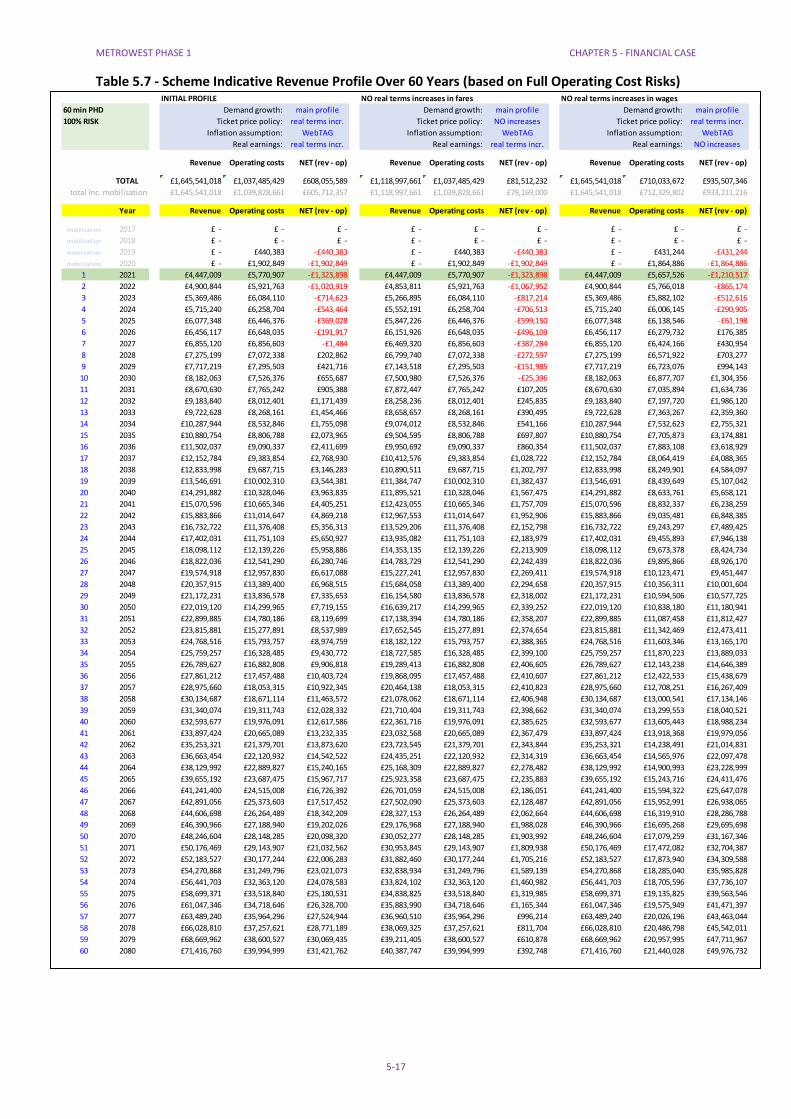
Financial profiles have been undertaken over a 30 and 60 year period, using a range of assumptions
and sensitivity tests. The profiles in Table 5.7 are based on a more conservative approach to
operating costs that assumes all the quantified operational cost risks arise all together. In other
words the combined total of the operational cost risks (which is £1.72M) has been applied to the
base operational cost estimated provided by GWR (of £4.430M), giving a total (risk adjusted)
estimated operating cost in the opening year of £5.290M. This more cautious approach has be taken
to provide a higher level of certainty for decision makers. It can be seen from Table 5.7 that the
trend of growth in passenger demand outstripping operating costs, continues into the medium to
long term. By year 20 the revenue surplus is £3.9M per annum and by year 30 the revenue surplus is
£7.7M per annum.
Given the considerable revenue generated by the scheme, it may be feasible to establish a funding
mechanism where the Authorities borrow against these future revenues to fund the cost of
delivering the scheme. This approach was used to fund Worcester Parkway station and was deemed
a successful approach for potential replication for other third party rail schemes. The approach is
however dependent upon the borrower having certainty over the whole borrowing period of a
dependable income stream. For Worcester Parkway station scheme the approach used by the DfT
Rail Executive entailed setting up a station access payment to Worcestershire County Council (the
promoter) that guaranteed an annual payment in return for delivering the new station and operating
the new station over a 30 year period. The farebox revenue collected for trips to and from the
station was then fed back to the DfT Rail Executive.
Such an arrangement needs to be commercially attractive to the promoter who is taking all the risk
for delivering the scheme, while also giving value for money to the DfT Rail Executive. Our initial
calculations indicate that the scheme revenue surpluses could make a contribution towards the
scheme capital funding gap, via a borrowing arrangement.
METROWEST PHASE 1 CHAPTER 5 - FINANCIAL CASE
5-17
Table 5.7 - Scheme Indicative Revenue Profile Over 60 Years (based on Full Operating Cost Risks)
INITIAL PROFILE NO real terms increases in fares NO real terms increases in wages
60 min PHD Demand growth: main profile Demand growth: main profile Demand growth: main profile
100% RISK Ticket price policy: real terms incr. Ticket price policy: NO increases Ticket price policy: real terms incr.
Inflation assumption: WebTAG Inflation assumption: WebTAG Inflation assumption: WebTAG
Real earnings: real terms incr. Real earnings: real terms incr. Real earnings: NO increases
Revenue Operating costs NET (rev - op) Revenue Operating costs NET (rev - op) Revenue Operating costs NET (rev - op)
TOTAL £1,645,541,018 £1,037,485,429 £608,055,589 £1,118,997,661 £1,037,485,429 £81,512,232 £1,645,541,018 £710,033,672 £935,507,346
total inc. mobilisation £1,645,541,018 £1,039,828,661 £605,712,357 £1,118,997,661 £1,039,828,661 £79,169,000 £1,645,541,018 £712,329,802 £933,211,216
Year Revenue Operating costs NET (rev - op) Revenue Operating costs NET (rev - op) Revenue Operating costs NET (rev - op)
mobilisation 2017 £ - £ - £ - £ - £ - £ - £ - £ - £ -
mobilisation 2018 £ - £ - £ - £ - £ - £ - £ - £ - £ -
mobilisation 2019 £ - £440,383 -£440,383 £ - £440,383 -£440,383 £ - £431,244 -£431,244
mobilisation 2020 £ - £1,902,849 -£1,902,849 £ - £1,902,849 -£1,902,849 £ - £1,864,886 -£1,864,886
1 2021 £4,447,009 £5,770,907 -£1,323,898 £4,447,009 £5,770,907 -£1,323,898 £4,447,009 £5,657,526 -£1,210,517
2 2022 £4,900,844 £5,921,763 -£1,020,919 £4,853,811 £5,921,763 -£1,067,952 £4,900,844 £5,766,018 -£865,174
3 2023 £5,369,486 £6,084,110 -£714,623 £5,266,895 £6,084,110 -£817,214 £5,369,486 £5,882,102 -£512,616
4 2024 £5,715,240 £6,258,704 -£543,464 £5,552,191 £6,258,704 -£706,513 £5,715,240 £6,006,145 -£290,905
5 2025 £6,077,348 £6,446,376 -£369,028 £5,847,226 £6,446,376 -£599,150 £6,077,348 £6,138,546 -£61,198
6 2026 £6,456,117 £6,648,035 -£191,917 £6,151,926 £6,648,035 -£496,109 £6,456,117 £6,279,732 £176,385
7 2027 £6,855,120 £6,856,603 -£1,484 £6,469,320 £6,856,603 -£387,284 £6,855,120 £6,424,166 £430,954
8 2028 £7,275,199 £7,072,338 £202,862 £6,799,740 £7,072,338 -£272,597 £7,275,199 £6,571,922 £703,277
9 2029 £7,717,219 £7,295,503 £421,716 £7,143,518 £7,295,503 -£151,985 £7,717,219 £6,723,076 £994,143
10 2030 £8,182,063 £7,526,376 £655,687 £7,500,980 £7,526,376 -£25,396 £8,182,063 £6,877,707 £1,304,356
11 2031 £8,670,630 £7,765,242 £905,388 £7,872,447 £7,765,242 £107,205 £8,670,630 £7,035,894 £1,634,736
12 2032 £9,183,840 £8,012,401 £1,171,439 £8,258,236 £8,012,401 £245,835 £9,183,840 £7,197,720 £1,986,120
13 2033 £9,722,628 £8,268,161 £1,454,466 £8,658,657 £8,268,161 £390,495 £9,722,628 £7,363,267 £2,359,360
14 2034 £10,287,944 £8,532,846 £1,755,098 £9,074,012 £8,532,846 £541,166 £10,287,944 £7,532,623 £2,755,321
15 2035 £10,880,754 £8,806,788 £2,073,965 £9,504,595 £8,806,788 £697,807 £10,880,754 £7,705,873 £3,174,881
16 2036 £11,502,037 £9,090,337 £2,411,699 £9,950,692 £9,090,337 £860,354 £11,502,037 £7,883,108 £3,618,929
17 2037 £12,152,784 £9,383,854 £2,768,930 £10,412,576 £9,383,854 £1,028,722 £12,152,784 £8,064,419 £4,088,365
18 2038 £12,833,998 £9,687,715 £3,146,283 £10,890,511 £9,687,715 £1,202,797 £12,833,998 £8,249,901 £4,584,097
19 2039 £13,546,691 £10,002,310 £3,544,381 £11,384,747 £10,002,310 £1,382,437 £13,546,691 £8,439,649 £5,107,042
20 2040 £14,291,882 £10,328,046 £3,963,835 £11,895,521 £10,328,046 £1,567,475 £14,291,882 £8,633,761 £5,658,121
21 2041 £15,070,596 £10,665,346 £4,405,251 £12,423,055 £10,665,346 £1,757,709 £15,070,596 £8,832,337 £6,238,259
22 2042 £15,883,866 £11,014,647 £4,869,218 £12,967,553 £11,014,647 £1,952,906 £15,883,866 £9,035,481 £6,848,385
23 2043 £16,732,722 £11,376,408 £5,356,313 £13,529,206 £11,376,408 £2,152,798 £16,732,722 £9,243,297 £7,489,425
24 2044 £17,402,031 £11,751,103 £5,650,927 £13,935,082 £11,751,103 £2,183,979 £17,402,031 £9,455,893 £7,946,138
25 2045 £18,098,112 £12,139,226 £5,958,886 £14,353,135 £12,139,226 £2,213,909 £18,098,112 £9,673,378 £8,424,734
26 2046 £18,822,036 £12,541,290 £6,280,746 £14,783,729 £12,541,290 £2,242,439 £18,822,036 £9,895,866 £8,926,170
27 2047 £19,574,918 £12,957,830 £6,617,088 £15,227,241 £12,957,830 £2,269,411 £19,574,918 £10,123,471 £9,451,447
28 2048 £20,357,915 £13,389,400 £6,968,515 £15,684,058 £13,389,400 £2,294,658 £20,357,915 £10,356,311 £10,001,604
29 2049 £21,172,231 £13,836,578 £7,335,653 £16,154,580 £13,836,578 £2,318,002 £21,172,231 £10,594,506 £10,577,725
30 2050 £22,019,120 £14,299,965 £7,719,155 £16,639,217 £14,299,965 £2,339,252 £22,019,120 £10,838,180 £11,180,941
31 2051 £22,899,885 £14,780,186 £8,119,699 £17,138,394 £14,780,186 £2,358,207 £22,899,885 £11,087,458 £11,812,427
32 2052 £23,815,881 £15,277,891 £8,537,989 £17,652,545 £15,277,891 £2,374,654 £23,815,881 £11,342,469 £12,473,411
33 2053 £24,768,516 £15,793,757 £8,974,759 £18,182,122 £15,793,757 £2,388,365 £24,768,516 £11,603,346 £13,165,170
34 2054 £25,759,257 £16,328,485 £9,430,772 £18,727,585 £16,328,485 £2,399,100 £25,759,257 £11,870,223 £13,889,033
35 2055 £26,789,627 £16,882,808 £9,906,818 £19,289,413 £16,882,808 £2,406,605 £26,789,627 £12,143,238 £14,646,389
36 2056 £27,861,212 £17,457,488 £10,403,724 £19,868,095 £17,457,488 £2,410,607 £27,861,212 £12,422,533 £15,438,679
37 2057 £28,975,660 £18,053,315 £10,922,345 £20,464,138 £18,053,315 £2,410,823 £28,975,660 £12,708,251 £16,267,409
38 2058 £30,134,687 £18,671,114 £11,463,572 £21,078,062 £18,671,114 £2,406,948 £30,134,687 £13,000,541 £17,134,146
39 2059 £31,340,074 £19,311,743 £12,028,332 £21,710,404 £19,311,743 £2,398,662 £31,340,074 £13,299,553 £18,040,521
40 2060 £32,593,677 £19,976,091 £12,617,586 £22,361,716 £19,976,091 £2,385,625 £32,593,677 £13,605,443 £18,988,234
41 2061 £33,897,424 £20,665,089 £13,232,335 £23,032,568 £20,665,089 £2,367,479 £33,897,424 £13,918,368 £19,979,056
42 2062 £35,253,321 £21,379,701 £13,873,620 £23,723,545 £21,379,701 £2,343,844 £35,253,321 £14,238,491 £21,014,831
43 2063 £36,663,454 £22,120,932 £14,542,522 £24,435,251 £22,120,932 £2,314,319 £36,663,454 £14,565,976 £22,097,478
44 2064 £38,129,992 £22,889,827 £15,240,165 £25,168,309 £22,889,827 £2,278,482 £38,129,992 £14,900,993 £23,228,999
45 2065 £39,655,192 £23,687,475 £15,967,717 £25,923,358 £23,687,475 £2,235,883 £39,655,192 £15,243,716 £24,411,476
46 2066 £41,241,400 £24,515,008 £16,726,392 £26,701,059 £24,515,008 £2,186,051 £41,241,400 £15,594,322 £25,647,078
47 2067 £42,891,056 £25,373,603 £17,517,452 £27,502,090 £25,373,603 £2,128,487 £42,891,056 £15,952,991 £26,938,065
48 2068 £44,606,698 £26,264,489 £18,342,209 £28,327,153 £26,264,489 £2,062,664 £44,606,698 £16,319,910 £28,286,788
49 2069 £46,390,966 £27,188,940 £19,202,026 £29,176,968 £27,188,940 £1,988,028 £46,390,966 £16,695,268 £29,695,698
50 2070 £48,246,604 £28,148,285 £20,098,320 £30,052,277 £28,148,285 £1,903,992 £48,246,604 £17,079,259 £31,167,346
51 2071 £50,176,469 £29,143,907 £21,032,562 £30,953,845 £29,143,907 £1,809,938 £50,176,469 £17,472,082 £32,704,387
52 2072 £52,183,527 £30,177,244 £22,006,283 £31,882,460 £30,177,244 £1,705,216 £52,183,527 £17,873,940 £34,309,588
53 2073 £54,270,868 £31,249,796 £23,021,073 £32,838,934 £31,249,796 £1,589,139 £54,270,868 £18,285,040 £35,985,828
54 2074 £56,441,703 £32,363,120 £24,078,583 £33,824,102 £32,363,120 £1,460,982 £56,441,703 £18,705,596 £37,736,107
55 2075 £58,699,371 £33,518,840 £25,180,531 £34,838,825 £33,518,840 £1,319,985 £58,699,371 £19,135,825 £39,563,546
56 2076 £61,047,346 £34,718,646 £26,328,700 £35,883,990 £34,718,646 £1,165,344 £61,047,346 £19,575,949 £41,471,397
57 2077 £63,489,240 £35,964,296 £27,524,944 £36,960,510 £35,964,296 £996,214 £63,489,240 £20,026,196 £43,463,044
58 2078 £66,028,810 £37,257,621 £28,771,189 £38,069,325 £37,257,621 £811,704 £66,028,810 £20,486,798 £45,542,011
59 2079 £68,669,962 £38,600,527 £30,069,435 £39,211,405 £38,600,527 £610,878 £68,669,962 £20,957,995 £47,711,967
60 2080 £71,416,760 £39,994,999 £31,421,762 £40,387,747 £39,994,999 £392,748 £71,416,760 £21,440,028 £49,976,732

METROWEST PHASE 1 CHAPTER 5 - FINANCIAL CASE
5-18
5.6 Summary of Financial Case
In summary:
a robust approach has been taken to understanding and estimating the costs of the scheme
a QCRA has been undertaken based on the GRIP3 AIP design with a P80 output which has
informed the GRIP 3 estimated capital out-turn cost
the estimated capital out-turn cost has been subject to an independent cost estimation
review
the scheme operating costs have been informed by input from Great Western Railways and
Network Rail
the Authorities have already increased their contribution to the scheme delivery costs to
£69.5M, including the cost of work to date of £10.1M, leaving a net capital funding gap of
£46.9M
the MetroWest Phase 1 train service yields a strong financial performance, generating a
revenue surplus from year 6 onwards, based on a conservative operational cost and forecast
revenue methodology.
by year 10 the train service is forecast to generate a net surplus of just under £1M per
annum.
a robust approach has been taken to forecast passenger demand including bench marking
to check how the forecast output compares against similar existing peer group stations
the forecast scheme revenue profile shows the scheme would result in a substantial positive
financial impact for the Great Western franchise and this would continue into the long term
over a 60 year period.
there are options for the DfT Rail Executive to consider in respect of the contractualisation
of the MetroWest Phase 1 train service, taking into account that the forecast scheme
revenue only arises from the delivery of the scheme infrastructure for which the Authorities
are taking all the delivery risk.