CHAPTER 5 FERTILIZER AND PESTICIDES …shodhganga.inflibnet.ac.in/bitstream/10603/1793/14/14_chapter...
29
CHAPTER 5 FERTILIZER AND PESTICIDES CONSUMPTION IN INDIAN AGRICULTURE 5.0 INTRODUCTION: Fertilizers play a vital role in the modern agriculture technology. Increased use of fertilizers has increased food production which is conspicuous in the last two and a half decades when the consumption of nutrients N, P, and K increased from 0.78 million tones(1965-66) to 10.3 million tones (1988-89). During this period the food grain production also increased to over 170 million tones from a level of 73 million tones. The projected food grain requirement of 240 million tones by the turn of the century is to be achieved mainly through fertilizer use and improved farm technology. Several studies are available which attempt: (1) to estimate the contribution of fertilizers to increased agricultural output over time or (2) to estimate the proportion of agricultural output which is accounted for by the fertilizer input. In general, the developing countries have only a small proportion of total food output attributable to fertilizer use, but the contribution of fertilizer to subsequent increases in output is much higher. A more balanced relationship exists within most developed countries. The contribution of fertilizer depends heavily upon the sources of increased output increased area brought under cultivation or increased yield per hectare cultivated. Although fertilizer 198
Transcript of CHAPTER 5 FERTILIZER AND PESTICIDES …shodhganga.inflibnet.ac.in/bitstream/10603/1793/14/14_chapter...

CHAPTER 5
FERTILIZER AND PESTICIDES CONSUMPTION IN INDIAN AGRICULTURE
5.0 INTRODUCTION:
Fertilizers play a vital role in the modern agriculture
technology. Increased use of fertilizers has increased food
production which is conspicuous in the last two and a half decades
when the consumption of nutrients N, P, and K increased from 0.78
million tones(1965-66) to 10.3 million tones (1988-89). During
this period the food grain production also increased to over 170
million tones from a level of 73 million tones. The projected food
grain requirement of 240 million tones by the turn of the century
is to be achieved mainly through fertilizer use and improved farm
technology.
Several studies are available which attempt: (1) to estimate
the contribution of fertilizers to increased agricultural output
over time or (2) to estimate the proportion of agricultural output
which is accounted for by the fertilizer input. In general, the
developing countries have only a small proportion of total food
output attributable to fertilizer use, but the contribution of
fertilizer to subsequent increases in output is much higher. A
more balanced relationship exists within most developed countries.
The contribution of fertilizer depends heavily upon the sources of
increased output increased area brought under cultivation or
increased yield per hectare cultivated. Although fertilizer
198

applications may be necessary to bring new land under cultivation,
its major influence is through the yield-increasing component.
The commercial energy required to produce a pesticide can be
substantial. The raw materials for modern pesticides mostiy come
from the petrochemical industry, and further inputs of energy are
required in manufacturing. Thus pesticides are the most energy
intensive agricultural input. Nevertheless, continued growth in
the use of pesticides appears unavoidable. Their expanded use is
particularly needed in developing countries, where crop loss(both
pre- and post harvest), because of inadequate pest control, are
very large. The declining share of world pesticide use projected
for the developed countries probably mainly reflects environmental
concerns.
Raymond H.Ewell(1974), who examined the success failure of
Green revolution in Developing countries by taking the fertilizer
as limitting factor. The main issues focussed in this study are
(1). of the three primary agricultural inputs - seeds, water and
fertilizer- fertilizer is the most critical input since it
involves the greatest investment both by individual farmers and by
the national economy. (2) very large quantities of fertilizer will
be required by the developing countries during the next decade in
order for agricultural production to keep pace with population
growth. (3) Under-utilization of fertilizer is likely to be the
limiting factor in increasing agricultural production in the
developing countries during the next decade.
The main conclusions drawn in this study are that,
199

under-utilization of fertilizer is likely to be the limiting
factor in agricultural production in the developing countries
during the 1970's and 1980's rather than under-utilization of
improved seed varieties or under-utilization of agricultural
water. Under-utilization of fertilizer in the developing countries
is the most likely cause of the green revolution falling short of
the expectations, (the world's people now have for it, if that
should happen).
Another interesting study by Chauhan.K.K.S and
Misra.R.V(1989), who analyzed the Nitrogen fertilization in Indian
agriculture. The main observations of this study are that,
application of nitrogenous fertilizers is a key factor in the
overall fertilization programme of Indian agriculture. Due to
widespread nitrogen deficiency in Indian soils, need for adequate
nitrogen fertilization is being felt more and more, especially
with the increasing coverage under short duration of high yielding
varieties and removal of substantial quantities of nitrogen in
intensive cropping systems.
Nitrogen being an energy intensive and costly nutrient, it
becomes necessary to plan for scientific and efficient use of
nitrogenous fertilizers. The nitrogen requirements for different
crops and varieties under various agro soil-climatic situations,
promotion of efficient fertilizer materials, complementary use of
organic , in-organic and biological sources of nitrogen, and a
sound technology transfer programme should form essential
components of the strategy to promote efficient use of nitrogenous
fertilizers.
200

Tandon.HLS(1993), who examined the fertilizer consumption in
Indian agriculture by taking data from fertilizer statistics,
(Fertilizer Association Of India), during the period 1970 to 1992.
The major findings are, The season-wise fertilizer consumption
pattern has gradually undergone major changes over the years.
During the 1970s and early 1980s, 60-65% of annual fertilizer
consumption took place during the post-monsoon(rabi) season and
35-40% in the monsoon season (kharif). This ratio has been
narrowing down. Narrowing down of this ratio can be taken as an
indicator for three possible developments (i) increasing
acceptance of fertilizers on kharif crops particularly rice (ii)
increasing fertilizer use on rain fed crops during kharif in the
assured rainfall areas (e.g. kharif sorghum in Maharashtra), and
(iii) widening of the base of fertilizer consumption.
Punjab is the only state to have application rate above 100
kg/ha for an individual nutrient(N). Highest mean consumption
rates for PgOgare also found in punjab followed by Andhra Pradesh.
Tamil Nadu and Kerala lead the other states in terms of mean
potash application per unit area. Out of about 400 districts, 25%
of the total fertilizer is used in 27 districts, 50% in 76
districts and 75% in 151 districts. This clearly demonstrates the
concentration of fertilizers in a few favorably endowed areas. It
is apparent that not all high-consuming districts have a high
nutrient application rate per unit area. Some districts are in the
high consumption category because of their large cropped area,
some due to high application rates per hectare and others due to a
combination of both area and intensity of use.
201
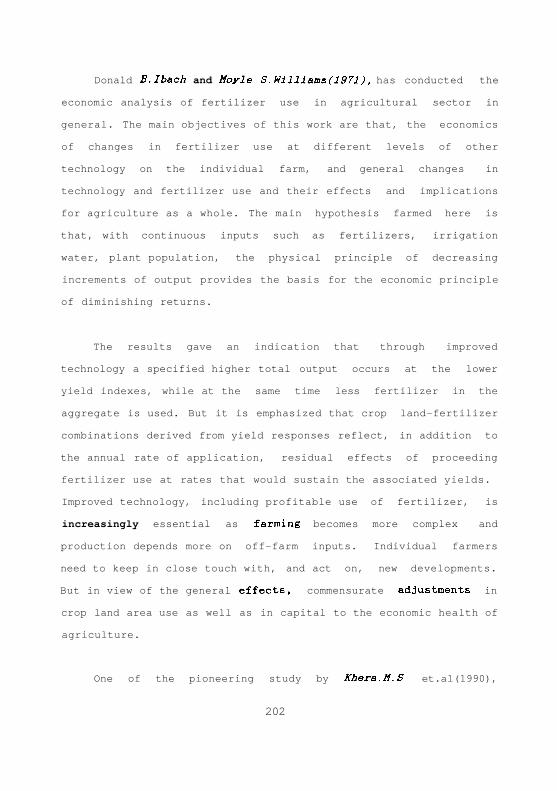
Donald B.Ibach and Moyle S.Willlams(1971), has conducted the
economic analysis of fertilizer use in agricultural sector in
general. The main objectives of this work are that, the economics
of changes in fertilizer use at different levels of other
technology on the individual farm, and general changes in
technology and fertilizer use and their effects and implications
for agriculture as a whole. The main hypothesis farmed here is
that, with continuous inputs such as fertilizers, irrigation
water, plant population, the physical principle of decreasing
increments of output provides the basis for the economic principle
of diminishing returns.
The results gave an indication that through improved
technology a specified higher total output occurs at the lower
yield indexes, while at the same time less fertilizer in the
aggregate is used. But it is emphasized that crop land-fertilizer
combinations derived from yield responses reflect, in addition to
the annual rate of application, residual effects of proceeding
fertilizer use at rates that would sustain the associated yields.
Improved technology, including profitable use of fertilizer, is
increasingly essential as farming becomes more complex and
production depends more on off-farm inputs. Individual farmers
need to keep in close touch with, and act on, new developments.
But in view of the general effects, commensurate adjustments in
crop land area use as well as in capital to the economic health of
agriculture.
One of the pioneering study by Khera.M.S et.al(1990),
202

analyzed the use of potassium in Indian agriculture. This study
presents an overall view of the past, present and likely future
trends of K use in Indian agriculture. It was observed that about
one fifth of the districts in India fall in the Low-K category.
Depletion of reserve K in soils especially with intensification of
agriculture and consequently more areas likely to become deficient
in K are emphasized. About 41% of the total low-K districts in
India were located in U.P alone. Goa, Meghalaya, Mizoram,
Nagaland, Pondicherry and Tripura were in the low-K category,
while the entire Gujarat was in the high-K category. Nearly 50% of
total consumption of K fertilizers is accounted by southern zone
in which Tamil Nadu state gets a major share. But the consumption
figurers of different states do not relate to their K fertility
status. More than 50% of K fertilizers are being consumed by rice
followed by wheat (15%).
Prem Narain, et.al(1990), analyzed the long term fertilizer
use and yield sustainability in Indian agriculture, with the
objectives, to identify the economics of long term fertilizer use
in crop production, to estimate the yield trends from continuous
application of fertilizer and, to trace out the factors affecting
yield sustainability in long term fertilizer experiments. The data
for the study have been drawn from the long term fertilizer use
experiments conducted at 8 cooperative centers under All India
coordinated research project on long term fertilizer experiments
for the period 1971-86.
The results showed that, the economics of long term
fertilizer use and yield sustainability in various agro-climatic
203
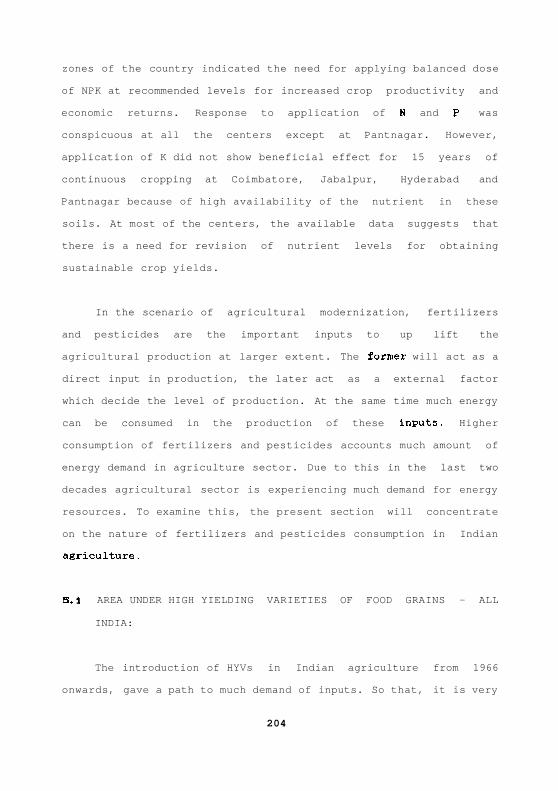
zones of the country indicated the need for applying balanced dose
of NPK at recommended levels for increased crop productivity and
economic returns. Response to application of N and P was
conspicuous at all the centers except at Pantnagar. However,
application of K did not show beneficial effect for 15 years of
continuous cropping at Coimbatore, Jabalpur, Hyderabad and
Pantnagar because of high availability of the nutrient in these
soils. At most of the centers, the available data suggests that
there is a need for revision of nutrient levels for obtaining
sustainable crop yields.
In the scenario of agricultural modernization, fertilizers
and pesticides are the important inputs to up lift the
agricultural production at larger extent. The former will act as a
direct input in production, the later act as a external factor
which decide the level of production. At the same time much energy
can be consumed in the production of these inputs. Higher
consumption of fertilizers and pesticides accounts much amount of
energy demand in agriculture sector. Due to this in the last two
decades agricultural sector is experiencing much demand for energy
resources. To examine this, the present section will concentrate
on the nature of fertilizers and pesticides consumption in Indian
agriculture.
S.I AREA UNDER HIGH YIELDING VARIETIES OF FOOD GRAINS - ALL
INDIA:
The introduction of HYVs in Indian agriculture from 1966
onwards, gave a path to much demand of inputs. So that, it is very
204
much essential, at foremost for discussion, to identify the area
under high yielding varieties, which again will provide a path to
identify the nature of fertilizers and pesticides demand in Indian
agriculture.
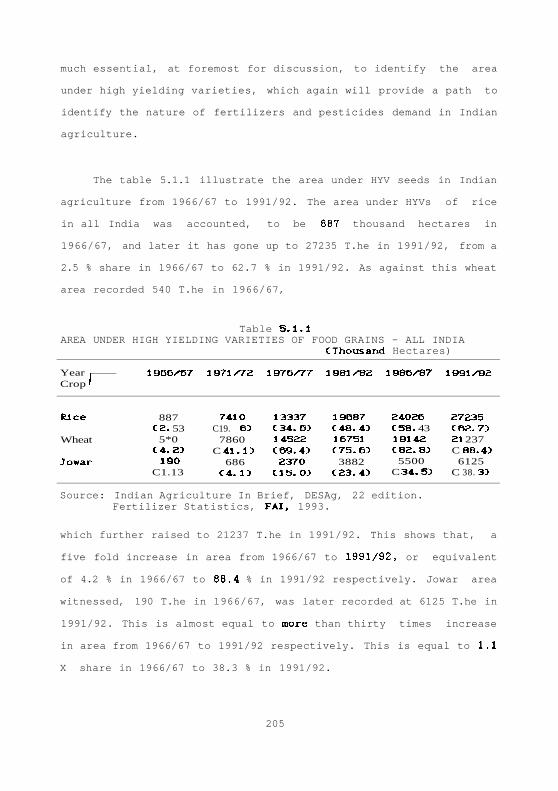
The table 5.1.1 illustrate the area under HYV seeds in Indian
agriculture from 1966/67 to 1991/92. The area under HYVs of rice
in all India was accounted, to be 887 thousand hectares in
1966/67, and later it has gone up to 27235 T.he in 1991/92, from a
2.5 % share in 1966/67 to 62.7 % in 1991/92. As against this wheat
area recorded 540 T.he in 1966/67,
Table 5.1.1AREA UNDER HIGH YIELDING VARIETIES OF FOOD GRAINS - ALL INDIA
CThousand Hectares)
Source: Indian Agriculture In Brief, DESAg, 22 edition.Fertilizer Statistics, FAI, 1993.
which further raised to 21237 T.he in 1991/92. This shows that, a
five fold increase in area from 1966/67 to 1991/92, or equivalent
of 4.2 % in 1966/67 to 88.4 % in 1991/92 respectively. Jowar area
witnessed, 190 T.he in 1966/67, was later recorded at 6125 T.he in
1991/92. This is almost equal to more than thirty times increase
in area from 1966/67 to 1991/92 respectively. This is equal to 1.1
X share in 1966/67 to 38.3 % in 1991/92.
205
Year |Crop 1
RJ.ce
Wheat
Jowar
1966/67
887C2. 53
5*0C4. 23
190C1.13
1971/72
7410C19. 6)
7860C 41.13
686C4. 13
1976/77
13337C34. 6)14522C69. 45
237OC15. 0)
1981/82
19687C48. 4)16751C75. 63
3882C23. 4)
1986/87
24026C58. 4319142C82. 83
5500C 34.53
1991/92
27235C62. 73El 237C 88, 43
6125C 38. 33
Source: Indian Agriculture In Brief, DESAg, 22 edition.Fertilizer Statistics, FAI, 1993.
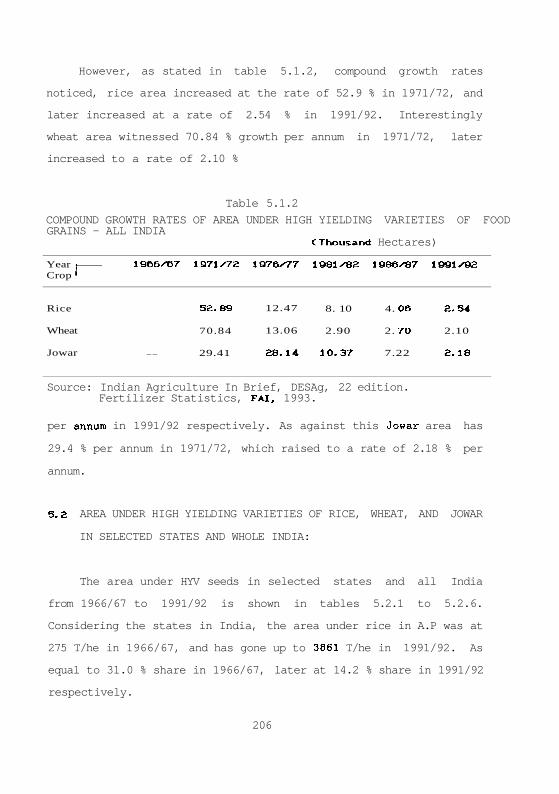
per annum in 1991/92 respectively. As against this Jowar area has
29.4 % per annum in 1971/72, which raised to a rate of 2.18 % per
annum.
S.2 AREA UNDER HIGH YIELDING VARIETIES OF RICE, WHEAT, AND JOWAR
IN SELECTED STATES AND WHOLE INDIA:
The area under HYV seeds in selected states and all India
from 1966/67 to 1991/92 is shown in tables 5.2.1 to 5.2.6.
Considering the states in India, the area under rice in A.P was at
275 T/he in 1966/67, and has gone up to 3861 T/he in 1991/92. As
equal to 31.0 % share in 1966/67, later at 14.2 % share in 1991/92
respectively.
206
However, as stated in table 5.1.2, compound growth rates
noticed, rice area increased at the rate of 52.9 % in 1971/72, and
later increased at a rate of 2.54 % in 1991/92. Interestingly
wheat area witnessed 70.84 % growth per annum in 1971/72, later
increased to a rate of 2.10 %
Table 5.1.2
COMPOUND GROWTH RATES OF AREA UNDER HIGH YIELDING VARIETIES OF FOODGRAINS - ALL INDIA
CThousand Hectares)
Year |Crop '
Rice
Wheat
Jowar
1966/67
_ _
1971/72
52.89
70.84
29.41
1976/77
12.47
13.06
28.14
1981/82
8. 10
2.90
10.37
1986/87
4. O6
2. 7O
7.22
1991/92
2.54
2.10
2.18

Bihar recorded 67 T/he in 1966/67, later it has raised to
2891 T.he in 1991/92. This is equal to 7.6 % in 1966/67 and 10.6 %
in 1991/92. As against this, Punjab accounted 7 T/he in 1966/67,
which increased to 2037 T/he in 1991/92, in percentage terms
from0.8 % share in 1966/67 to 7.5 % in 1991/92. Tamil Nadu noticed
Source: Indian Agriculture In Brief, DESAg, 22 edition.Fertilizer Statistics, FAI, 1993.
152 T/he in 1966/67, and later increased to 2213 T/he in 1991/92,
this is equal to 17.1 % in 1966/67 to 8.1 % in 1991/92
respectively. U.P recorded 69 T/he in 1966/67, which has increased
to 4125 T/he in 1991/92, a share of 7.8 % in 1966/67 to 15.2 % in
1991/92. However, West Bengal noticed 26 T/he in 1966/67, which
raised to 2623 T/he in 1991/92. The share equal to 2.9 % in
1966/67 to 9.6 * in 1991/92 respectively. All India level scenario
showed that, 888 T/he in 1966/67, has raised up to 27235 T/he in
1991/92 respectively.
207
Table 5 .2 .1
AREA UNDER HIGH YIELDING VARIETIES OF RICE, 1966/67 TO 1991/92.C'OOO Hectares)
S t a t e s
Years |
1966/67
1971STZ
1976/77
1981/82
1986X86
1991/92
A. P
275C 3 1 . O)
725C9. 83
2O24C15. 23
3086C15. 73
3250C13. 53
3861C14. 23
Bihar
67C7. 63
44OC5. 93
998C7. 531500C7. 632748
C11. 432891
CIO. 63
Punjab
7CO. 83311C4. 23579
C4. 331207C6.131709C7.132037C7.53
T.Nadu
152C17.132245
C30. 332170
C16. 332300
C11. 731860
C7. 732213
C8.13
U. P
69C7. 83
994Cl3 . 43
1679C12. 63
2665C13. 53
3701C15. 43
4125C15. 23
W.Bengal
26C2. 93
704C9. 531290
C9. 7318O7
C9. 232244
C9. 332623
C9. 63
ALLI n d i a
888C1OO.O3
7410C100.O313337C1OO.O319687C1OO.O324026C100. O327235C 1 O O . O 3
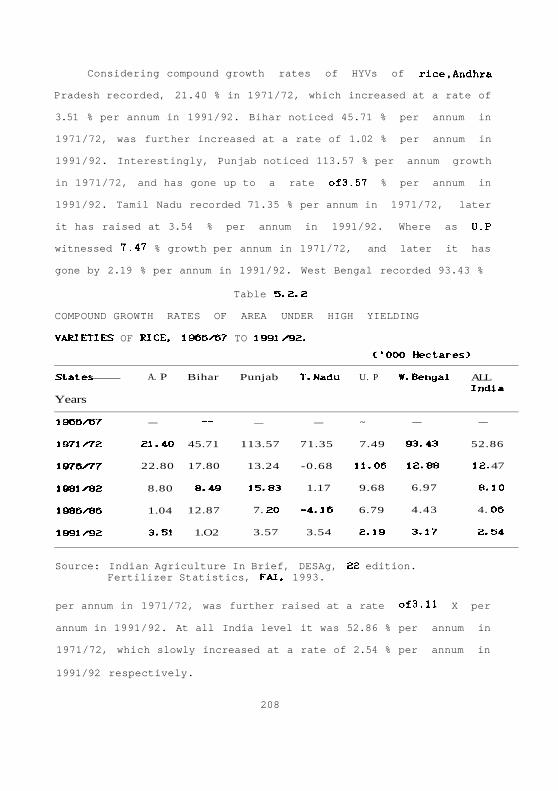
Considering compound growth rates of HYVs of rice,Andhra
Pradesh recorded, 21.40 % in 1971/72, which increased at a rate of
3.51 % per annum in 1991/92. Bihar noticed 45.71 % per annum in
1971/72, was further increased at a rate of 1.02 % per annum in
1991/92. Interestingly, Punjab noticed 113.57 % per annum growth
in 1971/72, and has gone up to a rate of3.57 % per annum in
1991/92. Tamil Nadu recorded 71.35 % per annum in 1971/72, later
it has raised at 3.54 % per annum in 1991/92. Where as U.P
witnessed 7.47 % growth per annum in 1971/72, and later it has
gone by 2.19 % per annum in 1991/92. West Bengal recorded 93.43 %
Table 5.2.2
COMPOUND GROWTH RATES OF AREA UNDER HIGH YIELDING
VARIETIES OF RICE, 1966/^67 TO 1991 •92.
C'OOO Hectares)
States
Years
1906SG7
1971/72
1976/77
1981/82
1986/86
1991/92
A. P
—
21.40
22.80
8.80
1.04
3.51
Bihar
~
45.71
17.80
8.49
12.87
1.O2
Punjab
—
113.57
13.24
15.83
7. 2O
3.57
T.Nadu
—
71.35
-0.68
1.17
-4.16
3.54
U. P
~
7.49
11.06
9.68
6.79
2.19
W.Bengal
—
93.43
12.88
6.97
4.43
3.17
ALLIndia
—
52.86
12. 47
8.10
4. O6
2.54
Source: Indian Agriculture In Brief, DESAg, 22 edition.Fertilizer Statistics, FAI, 1993.
per annum in 1971/72, was further raised at a rate of3.11 X per
annum in 1991/92. At all India level it was 52.86 % per annum in
1971/72, which slowly increased at a rate of 2.54 % per annum in
1991/92 respectively.
208
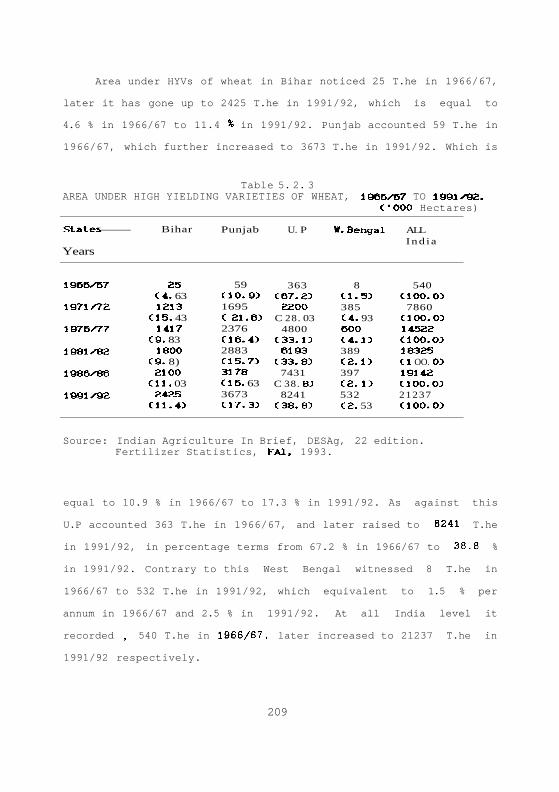
Area under HYVs of wheat in Bihar noticed 25 T.he in 1966/67,
later it has gone up to 2425 T.he in 1991/92, which is equal to
4.6 % in 1966/67 to 11.4 % in 1991/92. Punjab accounted 59 T.he in
1966/67, which further increased to 3673 T.he in 1991/92. Which is
Table 5. 2. 3AREA UNDER HIGH YIELDING VARIETIES OF WHEAT, 1966/67 TO 1991/92.
C'OOO Hectares)
Source: Indian Agriculture In Brief, DESAg, 22 edition.Fertilizer Statistics, FAI, 1993.
equal to 10.9 % in 1966/67 to 17.3 % in 1991/92. As against this
U.P accounted 363 T.he in 1966/67, and later raised to 8241 T.he
in 1991/92, in percentage terms from 67.2 % in 1966/67 to 38.8 %
in 1991/92. Contrary to this West Bengal witnessed 8 T.he in
1966/67 to 532 T.he in 1991/92, which equivalent to 1.5 % per
annum in 1966/67 and 2.5 % in 1991/92. At all India level it
recorded , 540 T.he in 1966/67, later increased to 21237 T.he in
1991/92 respectively.
209
States
Years
1966/67
1971/7Z
1976/77
1981/82
1986/86
1991/92
Bihar
25C4. 631213
C15. 431417
C9. 831800
C9. 8)21OO
C11. 032425
C11. 45
Punjab
59CIO. 9)1695C 21. 652376C16. 432883C15. 733178C16. 633673C17.33
U. P
363C67.23
2200C 28. 03
4800C33.13
6193C33. 83
7431C 38. 83
8241C38. 83
W.Bengal
8C1.53385C4. 936O0C4.13389C2.13397C2. 13532C2. 53
ALLInd ia
540C1OO.03
7860C1OO. O314522C100. O318325C1 OO. O319142C100.O321237C100.O3

Regarding compound growth rates, Bihar witnessed 117.36 % per
annum in 1971/72, which further raised to 2.92 % per annum in
1991/92. Punjab noticed 95.73 % per annum in 1971/72, and
Table 5.2.4COMPOUND GROWTH RATES OF AREA UNDER HIGH YIELDING VARIETIES OF WHEAT,1966x67 TO 1991X92.
C'OOO Hectares)
Source: Indian Agriculture In Brief, DESAg, 22 edition.Fertilizer Statistics, FAI, 1993.
increased at a rate of 2.94 % per annum in 1991/92. As against
this U.P, noticed 43.38 % per annum in 1971/72 to 2.09 % per annum
in 1991/92. Interestingly, West Bengal recorded, 117.01 % per
annum in 1971/72, and later it raised at a rate of 6.03 % per
annum in 1991/92. Where as all India picture showed a70.84 % per
annum in 1971/72, and2.10 % per annum in 1991/92 respectively.
Area under HYVs of Jowar in A.P noticed 36 T.he in 1966/67,
which was raised to 510 T.he in 1991/92. which is equal to 19.0 %
from 1966/67 to 8.3 % in 1991/92. Tamil Nadu recorded 10 T.he in
1966/67, which further raised to 385 T.he in 1991/92, this is
210
States
years 1
1966X67
1971X72
1976X77
1981X82
1986X86
1991X92
Bihar
117. 36
3.16
4.90
3.13
2.98
Punjab
95.73
6.99
4.78
1.97
2.94
U. P
43.38
16.89
5.23
3.71
2.O9
W.Bengal
117.01
9.28
-8.30
0.41
6. O3
ALLIndia
70.84
13. O6
4.76
O. 88
2.10

equal to 5.3 % growth in 1966/67 to 6.3 % growth in 1991/92. On
the other hand U.P noticed 2 T.he in 1966/67, which has later
recorded 3 T.he in 1991/92. This is equal to 1.1 % in 1966/67 to
0.1 % in 1991/92 respectively. At all India level it was observed
Table 5 . 2 . 5AREA UNDER HIGH YIELDING VARIETIES OF JOWAR, 1966 /67 TO 1 9 9 1 / 9 2 .
C *OOO Hectares)
Source: Indian Agriculture In Brief, DESAg, 22 edition.Fertilizer Statistics, FAI, 1993.
that, 190 T.he was the area under HYV inl966/67, was further it
has gone up to 6125 T.he in 1991/92 respectively.
Compound growth rates recorded in A.P was 0.55 % per annum in
1971/72, was later raised 2.54 % per annum in 1991/92. Where as
Tamil Nadu noticed, 12.47 % per annum in 1971/72, to -0.96 %
growth in 1991/92. U.P noticed almost 0.00 % growth in 1971/72 to
1991/92. All India level picture witnessed 29.28 % per annum in
1971/72, which has later increased at a rate of 2.18 % per annum
in 1991/92 respectively.
211
StatesYears |
1966/^7
1971 /V2
1976/V7
1981 /^E
1986/86
1991 /*92
A. P
36C19. 0)
37C5. 4)
150C6. 3)
449Cl1 .63
450( 8 . 23
510C8. 33
T.Nadu
10C5. 33
18C2. 63
185C4. 53
4O4C7. 43
385C6. 33
U. P
2C1.13
1CO. 23
2CO.13
1CO. O33
3CO. 13
ALL I n d i a
190C1OO. O3
686C1OO. 03
2370C1OO. O3
3882C1 00.O3
5500C1OO. 03
6125C1OO. 03

Table 5.2.6COMPOUND GROWTH RATES OF AREA UNDER HIGH YIELDING VARIETIES OF JOWAR,1966/^7 TO 1991 ̂ 2 .
C'OOO Hectares)
Source: Indian Agriculture In Brief, DESAg, 22 edition.Fertilizer Statistics, FAI, 1993.
5.3 THE QUANTITY OF PLANT NUTRIENTS RECEIVED FROM SOIL BY
DIFFERENT CROPS:
Fertilizers absorption from soil can differ from crop to crop
according to its biological structure. As we know the legume crop
will demand less amount of fertilizers as compared to other crops
such as rice, wheat, jowar, sugar cane and cotton. According to
ICAR (1987), fertilizer absorption can differ from crop to crop
and region to region due to soil differences. The tables 5.3.1 to
5.3.1 discusses the fertilizer absorption by different crops under
consideration.
212
StatesYears |
1966/^7
1971 /V2
1976/77
1981 ^ 2
1986/^6
1991^92
A. P
O. 53
32.31
27.18
-2. OS
2.54
T.Nadu
12.47
16.91
-O. 96
U. P
0.00
0.00
0 . OO
0 . OO
O. OO
ALL I n d i a
29.28
28.14
10.32
7.22
2.18

Table 5.3.1THE QUANTITY OF PLANT NUTRIENTS RECEIVED FROM SOIL BY DIFFERENTCROPS CKg. per hectare}
Source: ICAR Hand Book of Agriculture: Facts and figures forfarmers. Students and all Interested in farming 1987.
Regarding rice crop, it was noticed that2240 Kg/he yield can
demand 34 kg. nitrogen, 22 Kg phosphate, and 67 Kg potassium. As
against this, wheat with 1568 Kg/he will demand 56 Kg nitrogen, 24
Kg phosphate, and 67 Kg Potassium. On the other hand jowar demands
56 Kg nitrogen, 15 Kg phosphate, and 46 Kg potassium, which
produces 1792 Kg/hectare of output. However, sugar cane with 67200
Kg/he yield, a demands 90 Kg nitrogen, 17 Kg phosphate, and 202 Kg
potassium respectively. Meanwhile Ground nut with 1904 yield,
consumes 78 Kg nitrogen, 22 Kg phosphate, and 45 Kg potassium.
Next comes to cotton with 448 Kg/he productivity, which demands 30
kg nitrogen, 17 Kg phosphate, and 45 Kg potassium. respectively.
It was observed that sugar cane demands high amounts of
fertilizers while comparing with other crops. Next comes ground
nut, wheat, jowar, rice, and cotton respectively.
213
Crop
Ri.ce
Wheat
Jo war
Sugar cane
Groundnut
Cotton
Yield GrainC Kg/'haa
2240
1568
1792
67200
1904
448
N
34
56
56
90
78
3O
P2°5
22
24
IS
17
22
17
K2°
67
67
46
202
45
45

Another study by FAK1990), identified the potassium removal
ratios to nitrogen and phosphate for million tonns of yield
production for different crops. It showed that, Rice demands 20.1
Table 5.3.2K REMOVALS RELATIVE TO N AND P/MT OF YIELD PRODUCTION FORDIFFERENT CROPS UNDER FIELD CONDITIONS IN INDIA.
Source: Soil fertility and Fertilizer use. Vol. IV, 1990.
nitrogen, 11.2 phosphate, and 30.0 potassium for Kg/he production.
With respect to wheat, it recorded 24.5 nitrogen, 8.6 phosphate,
and 32.8 potassium for kg/he of production. Ground nut demands
58.1 nitrogen, 19.6 phosphate, and 30.1 potassium for Kg/he
production. Next to cotton and sugar cane demand 44.5 and 1.7
nitrogen, 28.3 and 0.2 phosphate, and 74.7 and 2.0 potassium for
Kg/he production respectively.
On the other hand the ratio of potassium and phosphate
relation to nitrogen showed that, (by considering nitrogen is 100)
rice noticed 55.7 Kg phosphate and 149.3 Kg potassium, wheat
accounts 35.1 and 133.8 Kg phosphate and potassium respectively.
Where as ground nut noticed 33.7 and 51.8 kgs phosphate and
214
Crop Kg/'tonne Produce Ratio of K_o and P^o- r e l a t i v e to N
N P_o K o N P.o_ K_o2 5 2 2 5 2 •
Rice 20.1 11.2 30.0 1OO 55.7 149.3
Wheat 24 .5 8.6 32.8 1OO 35.1 133.8
Ground-58. 1 19.6 30.1 1OO 33.7 51.8Nut
Cotton 44.5 28.3 74.7 1OO 63.6 167.8
Sugar- 1.7 0.2 2.0 100 11.8 117.6cane

potassium respectively. Mean while cotton and sugar cane noticed
63.6 phosphate and 11.8 potassium, and 167.8 phosphate and 117.6
potassium respectively.
On the whole it is observed that, the rate of phosphate and
potassium increasing at faster rate in Indian agriculture. But
according to this study it has been observed that, the soil which
have abundant potassium will demand less potassium, where as the
soil which had scarce potassium demands more amount of potassium.
5.4 FERTILIZER CONSUMPTION IN INDIAN AGRICULTURE:
Fertilizer consumption is steadily increasing in Indian
agriculture over a period of time. Due to this, the demand for
fertilizers increased at a faster rate, in India. Especially
chemical fertilizers consumption is increasing at faster rate than
farm yard manures. The chemical fertilizers are expected to give
immediate results in agricultural production. On these grounds the
present section will discuss fertilizer consumption in Indian
agriculture.
As stated in table 5.4.1, fertilizer consumption in India
recorded, nitrogen at 738 Thousands in 1966/67, and it increased
to 8046 T.t in 1991/92. Phosphate fertilizers accounted for 558
T.t in 1966/67, has gone up to 3321 T.t in 1991/92 respectively.
However, potassium fertilizers consumption recorded 114 T.t in
1966/67, has later gone up to 1361 T.t in 1991/92. On the whole
total fertilizer (NPK) witnessed 1101 T.t in 1966/67, which has
raised to 12728 T.t in 1991/92.
215
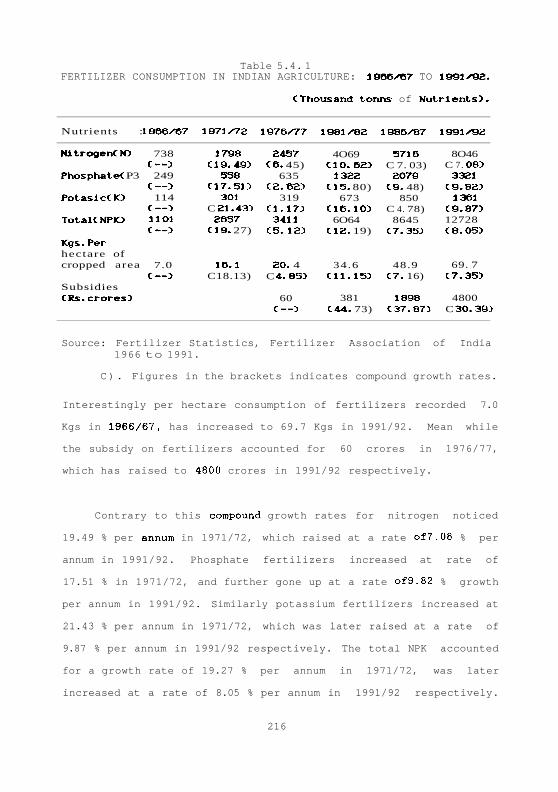
Table 5.4. 1FERTILIZER CONSUMPTION IN INDIAN AGRICULTURE: 1966X67 TO 1991X92.
CThousand tonns of Nutrients).
Source: Fertilizer Statistics, Fertilizer Association of India1966 to 1991.
C). Figures in the brackets indicates compound growth rates.
Interestingly per hectare consumption of fertilizers recorded 7.0
Kgs in 1966/67, has increased to 69.7 Kgs in 1991/92. Mean while
the subsidy on fertilizers accounted for 60 crores in 1976/77,
which has raised to 4800 crores in 1991/92 respectively.
Contrary to this compound growth rates for nitrogen noticed
19.49 % per annum in 1971/72, which raised at a rate of7.08 % per
annum in 1991/92. Phosphate fertilizers increased at rate of
17.51 % in 1971/72, and further gone up at a rate of9.82 % growth
per annum in 1991/92. Similarly potassium fertilizers increased at
21.43 % per annum in 1971/72, which was later raised at a rate of
9.87 % per annum in 1991/92 respectively. The total NPK accounted
for a growth rate of 19.27 % per annum in 1971/72, was later
increased at a rate of 8.05 % per annum in 1991/92 respectively.
216
Nutrients :
NltrogenOO
PhosphateC P3
PotasicCIO
Total CNPK)
Kgs.Perhectare ofcropped area
SubsidiesCRs.crores)
1966X67
738C—)
249C—)
114C—)11O1C—)
7.0C—3
1971 X72
1798C19. 49)
538C17.513
3O1C 21. 43)
2657Cl9. 27)
16.1C18.13)
1976X77
2457C6. 45)
635C2. 623
319Cl.173
3411C5. 123
2O. 4C 4.853
60C—)
1981X82
4O69CIO. 62)
1322C15. 80)
673C16.10)
6O64C12. 19)
34.6C11•15)
381C44. 73)
1986X87
5716C 7. 03)
2079C9. 48)
850C 4. 78)
8645C7.35)
48.9C7. 16)
1898C37.87)
1991X92
8O46C 7. 083
3321C9.82)
1361C9.87312728C8.O53
69. 7C7.353
4800C 30.393
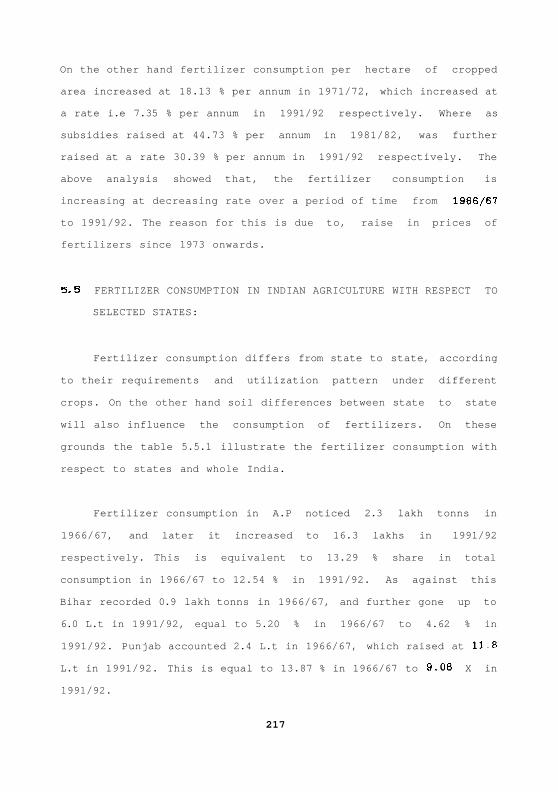
On the other hand fertilizer consumption per hectare of cropped
area increased at 18.13 % per annum in 1971/72, which increased at
a rate i.e 7.35 % per annum in 1991/92 respectively. Where as
subsidies raised at 44.73 % per annum in 1981/82, was further
raised at a rate 30.39 % per annum in 1991/92 respectively. The
above analysis showed that, the fertilizer consumption is
increasing at decreasing rate over a period of time from 1966/67
to 1991/92. The reason for this is due to, raise in prices of
fertilizers since 1973 onwards.
5.S FERTILIZER CONSUMPTION IN INDIAN AGRICULTURE WITH RESPECT TO
SELECTED STATES:
Fertilizer consumption differs from state to state, according
to their requirements and utilization pattern under different
crops. On the other hand soil differences between state to state
will also influence the consumption of fertilizers. On these
grounds the table 5.5.1 illustrate the fertilizer consumption with
respect to states and whole India.
Fertilizer consumption in A.P noticed 2.3 lakh tonns in
1966/67, and later it increased to 16.3 lakhs in 1991/92
respectively. This is equivalent to 13.29 % share in total
consumption in 1966/67 to 12.54 % in 1991/92. As against this
Bihar recorded 0.9 lakh tonns in 1966/67, and further gone up to
6.0 L.t in 1991/92, equal to 5.20 % in 1966/67 to 4.62 % in
1991/92. Punjab accounted 2.4 L.t in 1966/67, which raised at 11.8
L.t in 1991/92. This is equal to 13.87 % in 1966/67 to 9.08 X in
1991/92.
217
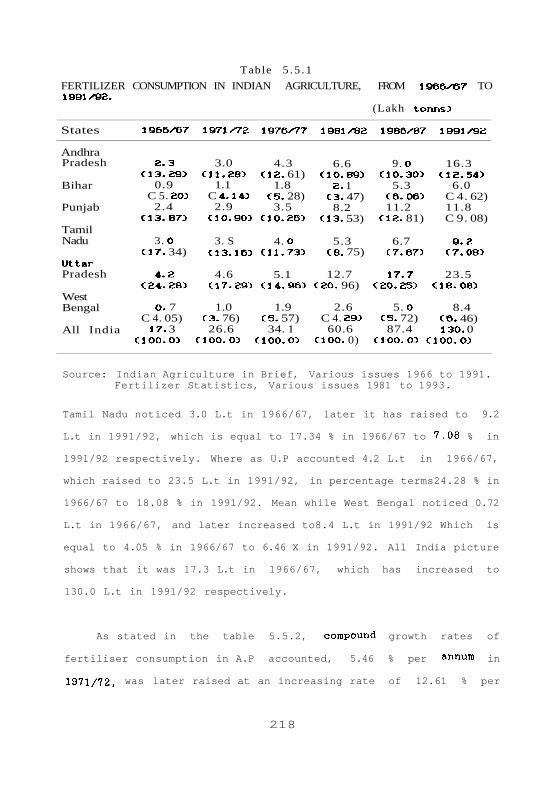
Table 5 . 5 . 1
FERTILIZER CONSUMPTION IN INDIAN AGRICULTURE, FROM 1966/07 TO1991/92.
(Lakh t onns )
Source: Indian Agriculture in Brief, Various issues 1966 to 1991.Fertilizer Statistics, Various issues 1981 to 1993.
Tamil Nadu noticed 3.0 L.t in 1966/67, later it has raised to 9.2
L.t in 1991/92, which is equal to 17.34 % in 1966/67 to 7.08 % in
1991/92 respectively. Where as U.P accounted 4.2 L.t in 1966/67,
which raised to 23.5 L.t in 1991/92, in percentage terms24.28 % in
1966/67 to 18.08 % in 1991/92. Mean while West Bengal noticed 0.72
L.t in 1966/67, and later increased to8.4 L.t in 1991/92 Which is
equal to 4.05 % in 1966/67 to 6.46 X in 1991/92. All India picture
shows that it was 17.3 L.t in 1966/67, which has increased to
130.0 L.t in 1991/92 respectively.
As stated in the table 5.5.2, compound growth rates of
fertiliser consumption in A.P accounted, 5.46 % per annum in
1971/72, was later raised at an increasing rate of 12.61 % per
218
States
AndhraPradesh
Bihar
Punjab
TamilNadu
UttarPradesh
WestBengal
All India
1966>'67
2.3C13. 29)
0.9C 5. 2O)
2.4C13. 87)
3. OC17. 34)
4.2C24. 28)
O. 7C 4. 05)
17. 3C1O0.O)
1971 /72
3.0C11.28)
1.1C 4.14)2.9
CIO.90)
3. SC13.16)
4.6C17.29)
1.0C3. 76)26.6
C1OO. O)
1976/77
4.3C12. 61)
1.8C5. 28)3.5
CIO.26)
4. OC11.73)
5.1C14. 96)
1.9C5. 57)
34. 1C1OO.0)
1981/82
6.6CIO.89)
2. 1C3. 47)8.2
C13. 53)
5.3C8. 75)
12.7C2O. 96)
2.6C 4. 29)60.6
C1OO. 0)
1986/^7
9. OCIO.30)
5.3C6. O6)11.2
C12. 81)
6.7C7.67)
17.7C2O.25)
5. OC5. 72)87.4
C100. O)
1991SQZ
16.3C12.54)
6.0C 4. 62)11.8C 9. 08)
9.2C7.08)
23.5C18. O8)
8.4C6. 46)13O. 0
C1OO. O)

West Bengal has no growth( 0.00 % growth)in 1971/72, but
later it has increased at 10.93 % per annum in 1991/92. All India
picture showed that, 8.98 % per annum in 1971/72, which has
further raised at a rate of8.26 % per annum in 1991/92
respectively.
219
annum In 1991/92. Bihar noticed 0.20 % per annum in 1971/72, and
Table 5.5.2
COMPOUND GROWTH RATES OF FERTILIZER CONSUMPTION IN INDIAN AGRICULTURE,FROM 1966/T57 TO 1 9 9 1 X 9 3 .
CLakh t o n n s )
Source: Indian Agriculture in Brief, Various issues 1966 to 1991.Fertilizer Statistics, Various issues 1981 to 1993.
further raised at a rate of 2.51 % per annum in 1991/92.
Interestingly Punjab accounted 3.86 % per annum in 1971/72, which
was gone up at a rate of 1.05 % per annum in 1991/92. However,
Tamil Nadu noticed, 3.13 % growth per annum in 1971/72, which has
further increased at a rate of 6.55 % per annum in 1991/92. U.P
was accounted 1.84 % per annum in 1971/72, and5.83 % per annum in
1991/92.
States
AndhraPradesh
Bihar
Punjab
TamilNadu
UttarPradesh
WestBengal
All India
1966X67
—
1971/72
5. 46
0.20
3.86
3.13
1.84
0 . OO
8.98
1976/77
7.47
10.31
3.83
2.71
2 . O8
O. OO
5.09
1981X82
8.15
3.13
18.56
5.79
20.02
6.39
12.19
1986X87
6.40
2O. 34
6.43
4.80
6.87
13.97
7. 6O
1991X92
12.61
2.51
1.O5
6.55
5.83
1O. 93
8.26

5.6 PER HECTARE CONSUMPTION OF FERTILIZERS IN INDIAN AGRICULTURE
WITH RESPECT TO SELECTED STATES:
Per hectare consumption of fertilizers are differing from
state to state over a period of time since last two decades.
Fertilizer consumption per hectare is one of the important
component for deciding yield rate in agriculture production.
Theoretically as Recardo said , land have original and
indestructible powers, in fact which have been slowly declined in
recent years, due to over exploitation of land resource. To
compensate this fertilizers came in to existence, so that
Table 5.6.1
PER HECTARE CONSUMPTION OF FERTILIZERS IN INDIAN AGRICULTURE, FROM
1966/67 TO 1991/92.
CKg. per hectare)
Source: Indian Agriculture in Brief, Various issues 1966 to 1991.Fertilizer Statistics, Various issues 1981 to 1993.
O . Figures in the brackets indicates compound growth rates.
220
States
AndhraPradesh
Bihar
Punjab
TamilNadu
UttarPradesh
WestBengal
All India
1966/67
17.7
8.7
41.8
38.4
15.7
9. O
10.1
1971 /72
23.5CS. 835
1O.1C3. O3)
5O. 6C 3 . 9O)
45.3C 3. 36)
20.1C5. O6)
13.1C7. 80)
16.1Cl2. 34)
1976/77
30.2C5.14)
14.4C7. 35)
62.9C4. 45)
41.7C - 1 . 64)
32.0C 9. 75)
19.8C8.61)20.8
C5. 26)
1981/82
50.3CIO. 74)
19.3C6. 03)118.3
C13.47)
74.2Cl2.22)
51.3C9. 90)
34.9Cl2.00)34.3
CIO.52)
1986/87
77.1C8. 92)50.6
C21.26)154.6C5.50)
103.6C6. 90)
66.6C5. 36)
60.8C11.74)48.9
C7. 35)
1991/92
124.0C9. 97)57.9
C 2. 73)168.3C1. 71)
130.1C 4. 66)
89. OC 5. 97)
90.7C8.33)
7O. 7C7. 65)
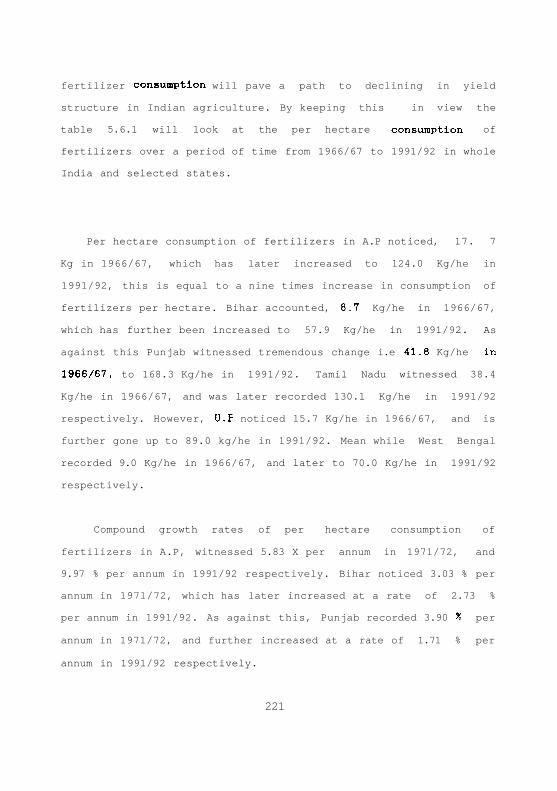
fertilizer consumption will pave a path to declining in yield
structure in Indian agriculture. By keeping this in view the
table 5.6.1 will look at the per hectare consumption of
fertilizers over a period of time from 1966/67 to 1991/92 in whole
India and selected states.
Per hectare consumption of fertilizers in A.P noticed, 17. 7
Kg in 1966/67, which has later increased to 124.0 Kg/he in
1991/92, this is equal to a nine times increase in consumption of
fertilizers per hectare. Bihar accounted, 8.7 Kg/he in 1966/67,
which has further been increased to 57.9 Kg/he in 1991/92. As
against this Punjab witnessed tremendous change i.e 41.8 Kg/he in
1966/67, to 168.3 Kg/he in 1991/92. Tamil Nadu witnessed 38.4
Kg/he in 1966/67, and was later recorded 130.1 Kg/he in 1991/92
respectively. However, U.P noticed 15.7 Kg/he in 1966/67, and is
further gone up to 89.0 kg/he in 1991/92. Mean while West Bengal
recorded 9.0 Kg/he in 1966/67, and later to 70.0 Kg/he in 1991/92
respectively.
Compound growth rates of per hectare consumption of
fertilizers in A.P, witnessed 5.83 X per annum in 1971/72, and
9.97 % per annum in 1991/92 respectively. Bihar noticed 3.03 % per
annum in 1971/72, which has later increased at a rate of 2.73 %
per annum in 1991/92. As against this, Punjab recorded 3.90 % per
annum in 1971/72, and further increased at a rate of 1.71 % per
annum in 1991/92 respectively.
221

Tamil Nadu experienced, 3.36 % per annum in 1971/72, which
raised to 4.66 % per annum in 1991/92. U.P recorded 5.06 % per
annum in 1971/72, and later raised at a rate of 5.97 % per annum
in 1991/92 respectively. West Bengal showed 7.80 % per annum in
1971/72, and later gone up at a rate of 8.33 % per annum in
1991/92. All India picture witnessed a growth rate of 12.34 % per
annum in 1971/72, and later raised at a rate of 7.65 % per annum
in 1991/92 respectively.
5.7 TOTAL PESTICIDE CONSUMPTION IN INDIAN AGRICULTURE AND
SELECTED STATES:
Adoption of HYVs technology gave path to much increase in
pesticide demand in Indian agriculture, due to increase in plant
diseases. To remove pest problem, pesticides and insecticides
demand has been increased, at larger extent, over a period of
time. As discussed above, pesticide production requires larger
amount of energy, which is again used in agricultural production.
This shows the extent of energy demand in Indian agriculture. The
table 5.7.1 explains the nature of pesticides consumption in
selected states and whole India from 1966/67 to 1991/92
respectively.
Pesticides consumption in A.P noticed, 2.3 thousand tonns in
1966/67, and later it increased to 16.7 thousands in 1991/92, ora
growth rate of 14.29 % share in 1966/67 to 19.69 % in 1991/92. A
seven times increase took place in pesticides consumption in A.P
from 1966/67 to 1991/92 respectively. As against this Bihar
222
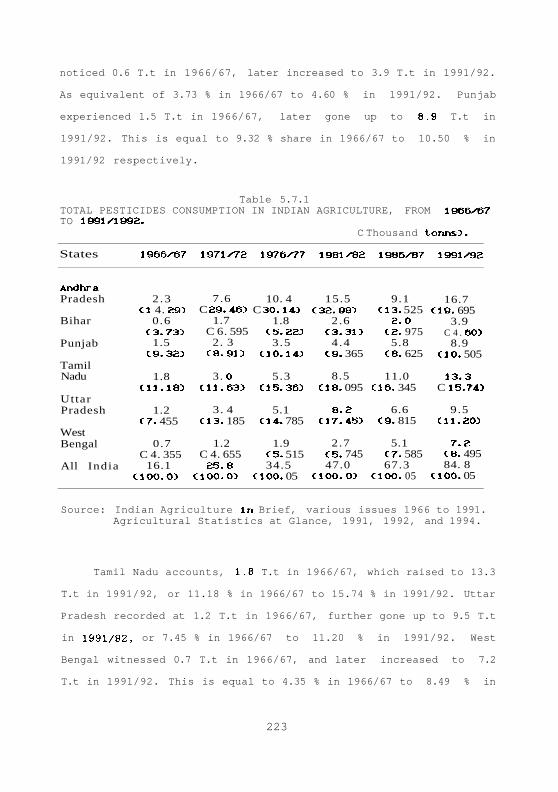
noticed 0.6 T.t in 1966/67, later increased to 3.9 T.t in 1991/92.
As equivalent of 3.73 % in 1966/67 to 4.60 % in 1991/92. Punjab
experienced 1.5 T.t in 1966/67, later gone up to 8.9 T.t in
1991/92. This is equal to 9.32 % share in 1966/67 to 10.50 % in
1991/92 respectively.
Table 5.7.1TOTAL PESTICIDES CONSUMPTION IN INDIAN AGRICULTURE, FROM 1966/67TO 1991/1992.
C Thousand tonns).
Source: Indian Agriculture In Brief, various issues 1966 to 1991.Agricultural Statistics at Glance, 1991, 1992, and 1994.
Tamil Nadu accounts, 1.8 T.t in 1966/67, which raised to 13.3
T.t in 1991/92, or 11.18 % in 1966/67 to 15.74 % in 1991/92. Uttar
Pradesh recorded at 1.2 T.t in 1966/67, further gone up to 9.5 T.t
in 1991/92, or 7.45 % in 1966/67 to 11.20 % in 1991/92. West
Bengal witnessed 0.7 T.t in 1966/67, and later increased to 7.2
T.t in 1991/92. This is equal to 4.35 % in 1966/67 to 8.49 % in
223
States
AndhraPradesh
Bihar
Punjab
TamilNadu
UttarPradesh
WestBengal
All India
1966S67
2.3C1 4. 29)
0.6C3. 735
1.5C9. 323
1.8Cl1.185
1.2C7. 455
0.7C 4. 355
16.1C1OO.05
1971/72
7.6C 29.465
1.7C 6. 595
2. 3C8. 915
3. OCl1.635
3. 4C13. 185
1.2C 4. 655
25.8C100. O5
1976/77
10. 4C 30.145
1.8C5. 225
3.5Cl0.145
5.3C15.365
5.1Cl4. 785
1.9C5. 51534.5
C100. 05
1981^82
15.5C32.985
2.6C3. 315
4.4C9. 365
8.5C18. 095
8.2C17.455
2.7C5. 74547.0
C1OO. O5
1986/87
9.1C13. 525
2 . 0C2. 975
5.8C8. 625
11.0C16. 345
6.6C9. 815
5.1C7. 58567.3
C1OO. 05
1991 /"92
16.7C19. 695
3.9C 4 . 6O5
8.9CIO. 505
13.3C 15. 745
9.5C11. 205
7.2C8. 49584. 8
C100. 05
1991/92 respectively. All India picture recorded a 16.1 T.t in
1966/67, and further raised to 84.8 T.t in 1991/92 respectively.
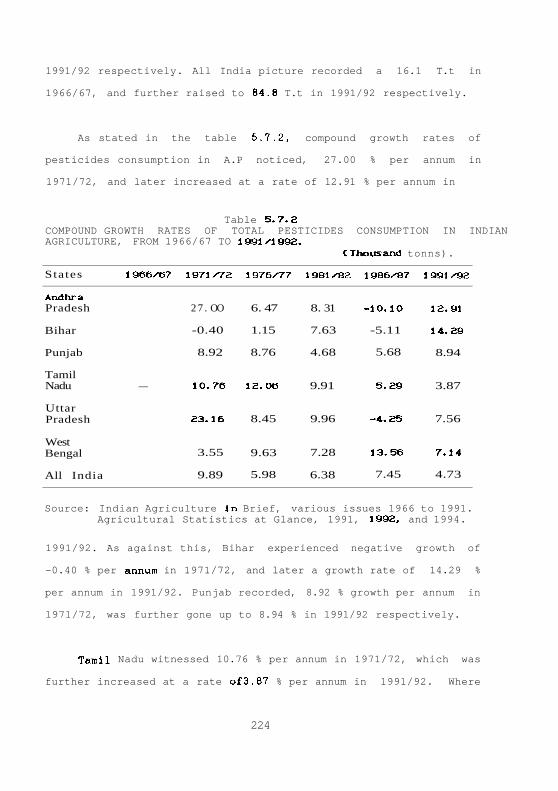
As stated in the table 5.7.2, compound growth rates of
pesticides consumption in A.P noticed, 27.00 % per annum in
1971/72, and later increased at a rate of 12.91 % per annum in
Tamil Nadu witnessed 10.76 % per annum in 1971/72, which was
further increased at a rate of3.87 % per annum in 1991/92. Where
224
Table 5.7.2COMPOUND GROWTH RATES OF TOTAL PESTICIDES CONSUMPTION IN INDIANAGRICULTURE, FROM 1966/67 TO 1991/'1992.
CThousand tonns).
Source: Indian Agriculture In Brief, various issues 1966 to 1991.Agricultural Statistics at Glance, 1991, 1992, and 1994.
1991/92. As against this, Bihar experienced negative growth of
-0.40 % per annum in 1971/72, and later a growth rate of 14.29 %
per annum in 1991/92. Punjab recorded, 8.92 % growth per annum in
1971/72, was further gone up to 8.94 % in 1991/92 respectively.
States
AndhraPradesh
Bihar
Punjab
TamilNadu
UttarPradesh
WestBengal
All India
1966/67
—
1971/72
2 7 . OO
-0.40
8.92
10.76
23.16
3.55
9.89
1976/77
6. 47
1.15
8.76
12.06
8.45
9.63
5.98
1981/82
8. 31
7.63
4.68
9.91
9.96
7.28
6.38
1986/87
-10.10
-5.11
5.68
5.29
-4.25
13.56
7.45
1991/92
12.91
14.29
8.94
3.87
7.56
7.14
4.73

as U.P noticed 23.16 % per annum in 1971/72, which was raised at a
rate of 7.56 % per annum in 1991/92. On the other hand West Bengal
witnessed 3.55 % per annum in 1971/72, has later increased at a
rate of 7.14 % per annum in 1991/92. At all India level 9.89 % per
annum in 1971/72, was noticed and it further raised at a rate of
4.73 % growth per annum in 1991/92 respectively.
5.8 SUMMARY AND CONCLUSIONS:
In this chapter, the fertilizer and pesticides consumption in
Indian agriculture and selected states was analyzed. Along with
this some other indicators such as area under HYV seeds, the
quantity of plant nutrients received from soil by different crops,
and per hectare consumption of fertilizers were analyzed.
At first, the data analysis relating to quantity of plant
nutrients received by different crops was observed that sugar cane
demands high amounts of fertilizers while comparing with other
crops. Next comes ground nut, wheat, jowar, rice, and cotton
respectively. Next the data analysis for fertilizer demand in
Indian agriculture is observed that, the rate of phosphate and
potassium increasing at faster rate in Indian agriculture. But
according to this study it has been observed that, the soil which
have abundant potassium will demand less potassium, where as the
soil which had scarce potassium demands more amount of
potassium.Application of nitrogenous fertilizers is a key factor
in the overall fertilization programme of Indian agriculture. Due
to widespread nitrogen deficiency in Indian soils, need for
adequate nitrogen fertilization is being felt more and more,
225

especially with the increasing coverage under short duration of
high yielding varieties and removal of substantial quantities of
nitrogen in intensive cropping systems.
In case of per hectare consumption of fertilizers in all
India and selected states, the analysis indicate that Punjab has
showed highest per hectare consumption of fertilizers, next comes
to Tamil Nadu, A.P, West Bengal, U.P, and Bihar respectively.
Finally, the data analysis with respect to pesticides consumption
in all India and selected states has shown that, Andhra Pradesh is
demanding much amount of pesticides, next to Tamil Nadu, U.P,
Punjab, West Bengal, and Bihar respectively. The preceding chapter
will examines the nature of energy demand and energy intensities
in Indian agriculture and selected states.
225A