Chapter 5 Delineating Flood-Prone Areas - FEMA 5 - delineating... · Chapter 5 Delineating...
31
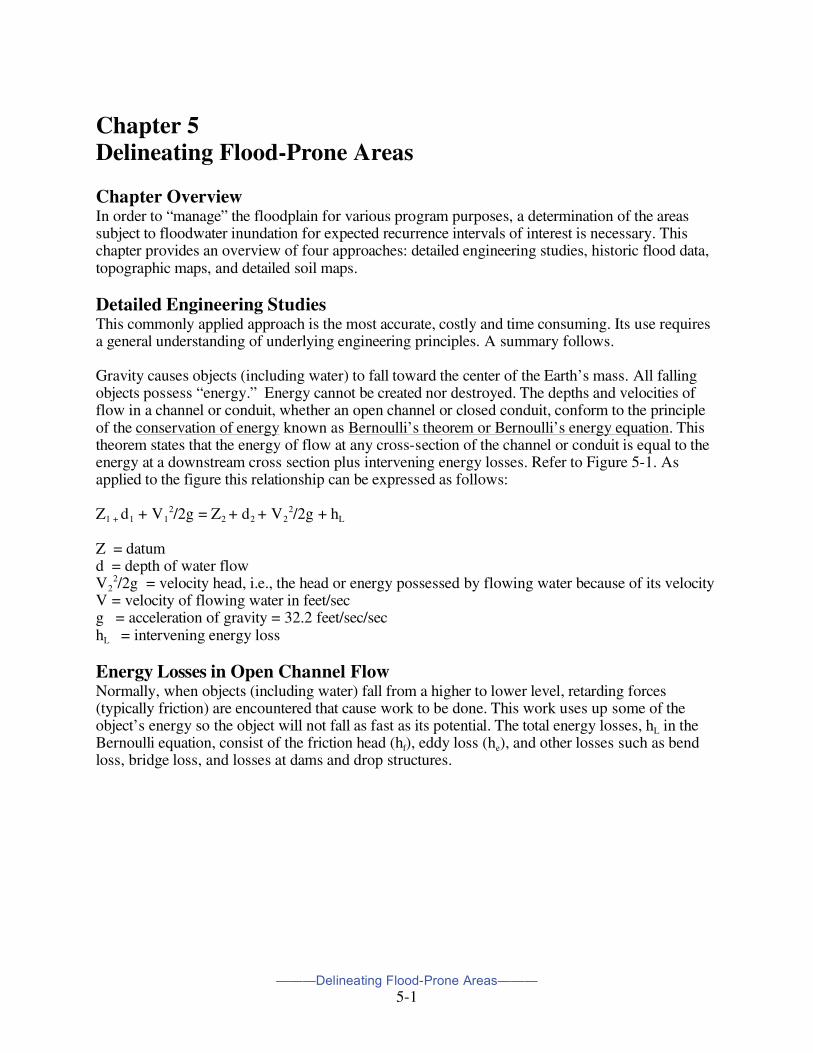
———Delineating Flood-Prone Areas——— 5-1 Chapter 5 Delineating Flood-Prone Areas Chapter Overview In order to “manage” the floodplain for various program purposes, a determination of the areas subject to floodwater inundation for expected recurrence intervals of interest is necessary. This chapter provides an overview of four approaches: detailed engineering studies, historic flood data, topographic maps, and detailed soil maps. Detailed Engineering Studies This commonly applied approach is the most accurate, costly and time consuming. Its use requires a general understanding of underlying engineering principles. A summary follows. Gravity causes objects (including water) to fall toward the center of the Earth’s mass. All falling objects possess “energy.” Energy cannot be created nor destroyed. The depths and velocities of flow in a channel or conduit, whether an open channel or closed conduit, conform to the principle of the conservation of energy known as Bernoulli’s theorem or Bernoulli’s energy equation . This theorem states that the energy of flow at any cross-section of the channel or conduit is equal to the energy at a downstream cross section plus intervening energy losses. Refer to Figure 5-1. As applied to the figure this relationship can be expressed as follows: Z 1 + d 1 + V 1 2 /2g = Z 2 + d 2 + V 2 2 /2g + h L Z = datum d = depth of water flow V 2 2 /2g = velocity head, i.e., the head or energy possessed by flowing water because of its velocity V = velocity of flowing water in feet/sec g = acceleration of gravity = 32.2 feet/sec/sec h L = intervening energy loss Energy Losses in Open Channel Flow Normally, when objects (including water) fall from a higher to lower level, retarding forces (typically friction) are encountered that cause work to be done. This work uses up some of the object’s energy so the object will not fall as fast as its potential. The total energy losses, h L in the Bernoulli equation, consist of the friction head (h f ), eddy loss (h e ), and other losses such as bend loss, bridge loss, and losses at dams and drop structures.
Transcript of Chapter 5 Delineating Flood-Prone Areas - FEMA 5 - delineating... · Chapter 5 Delineating...
———Delineating Flood-Prone Areas———
5-1
Chapter 5 Delineating Flood-Prone Areas Chapter Overview In order to “manage” the floodplain for various program purposes, a determination of the areas subject to floodwater inundation for expected recurrence intervals of interest is necessary. This chapter provides an overview of four approaches: detailed engineering studies, historic flood data, topographic maps, and detailed soil maps. Detailed Engineering Studies This commonly applied approach is the most accurate, costly and time consuming. Its use requires a general understanding of underlying engineering principles. A summary follows. Gravity causes objects (including water) to fall toward the center of the Earth’s mass. All falling objects possess “energy.” Energy cannot be created nor destroyed. The depths and velocities of flow in a channel or conduit, whether an open channel or closed conduit, conform to the principle of the conservation of energy known as Bernoulli’s theorem or Bernoulli’s energy equation. This theorem states that the energy of flow at any cross-section of the channel or conduit is equal to the energy at a downstream cross section plus intervening energy losses. Refer to Figure 5-1. As applied to the figure this relationship can be expressed as follows: Z1 + d1 + V1
2/2g = Z2 + d2 + V22/2g + hL
Z = datum d = depth of water flow V2
2/2g = velocity head, i.e., the head or energy possessed by flowing water because of its velocity V = velocity of flowing water in feet/sec g = acceleration of gravity = 32.2 feet/sec/sec hL = intervening energy loss Energy Losses in Open Channel Flow Normally, when objects (including water) fall from a higher to lower level, retarding forces (typically friction) are encountered that cause work to be done. This work uses up some of the object’s energy so the object will not fall as fast as its potential. The total energy losses, hL in the Bernoulli equation, consist of the friction head (hf), eddy loss (he), and other losses such as bend loss, bridge loss, and losses at dams and drop structures.
———Delineating Flood-Prone Areas———
5-2
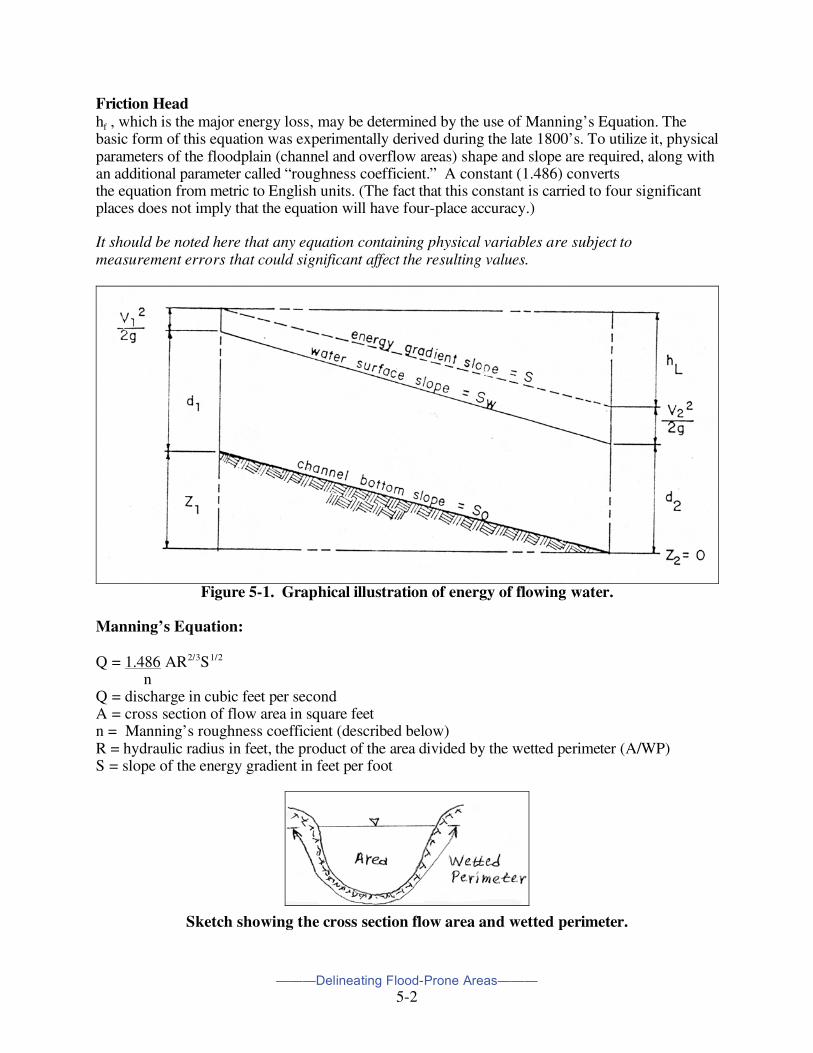
Friction Head hf , which is the major energy loss, may be determined by the use of Manning’s Equation. The basic form of this equation was experimentally derived during the late 1800’s. To utilize it, physical parameters of the floodplain (channel and overflow areas) shape and slope are required, along with an additional parameter called “roughness coefficient.” A constant (1.486) converts the equation from metric to English units. (The fact that this constant is carried to four significant places does not imply that the equation will have four-place accuracy.) It should be noted here that any equation containing physical variables are subject to measurement errors that could significant affect the resulting values.
Figure 5-1. Graphical illustration of energy of flowing water.
Manning’s Equation: Q = 1.486 AR2/3S1/2
n Q = discharge in cubic feet per second A = cross section of flow area in square feet n = Manning’s roughness coefficient (described below) R = hydraulic radius in feet, the product of the area divided by the wetted perimeter (A/WP) S = slope of the energy gradient in feet per foot
Sketch showing the cross section flow area and wetted perimeter.
———Delineating Flood-Prone Areas———
5-3
The formula can be rewritten as follows: S = (Qn/1.486AR2/3)2
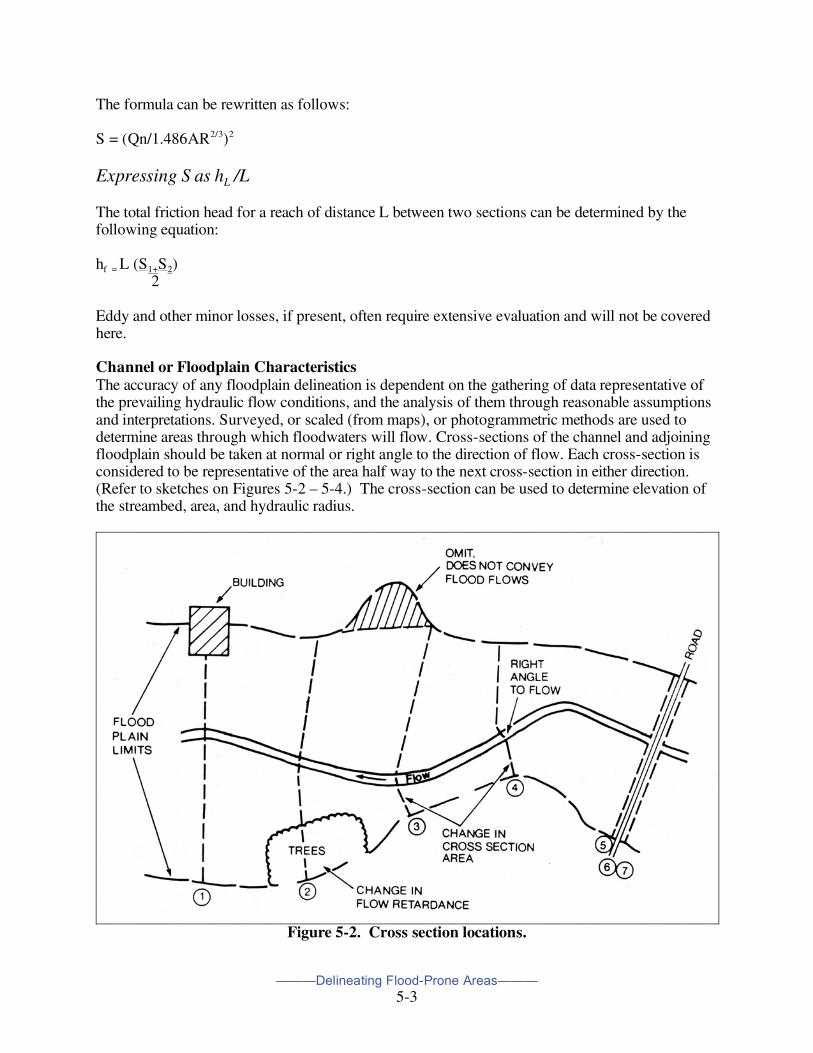
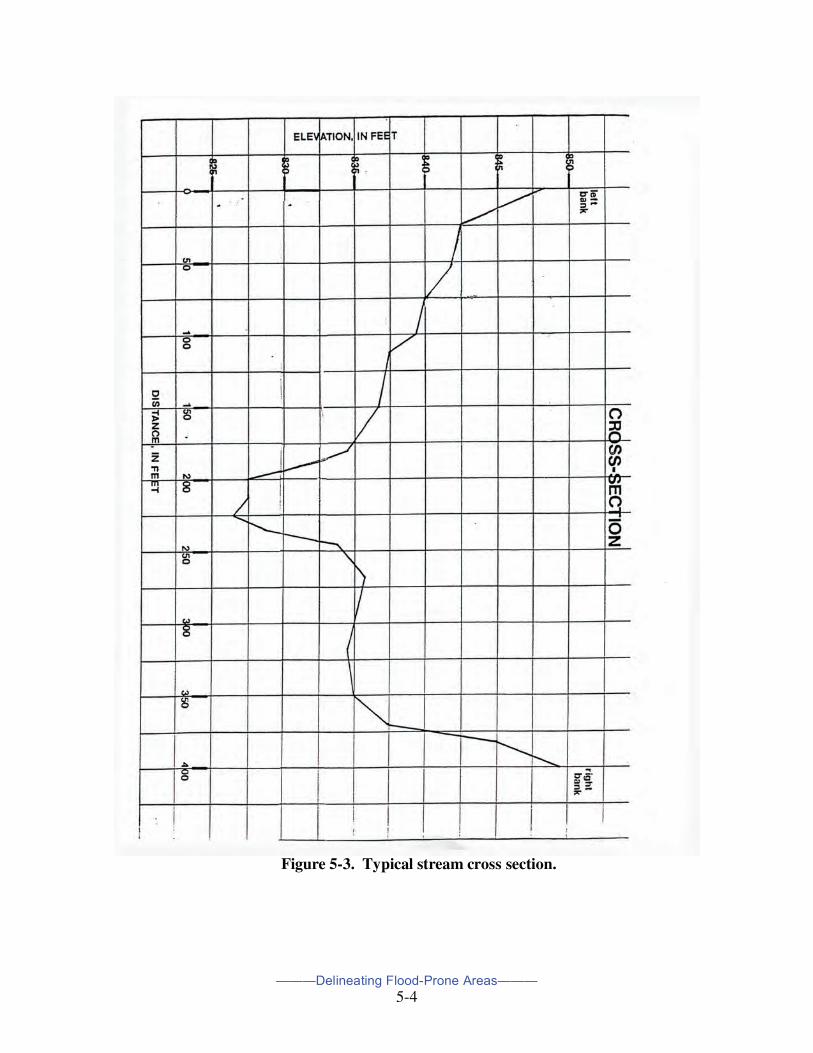
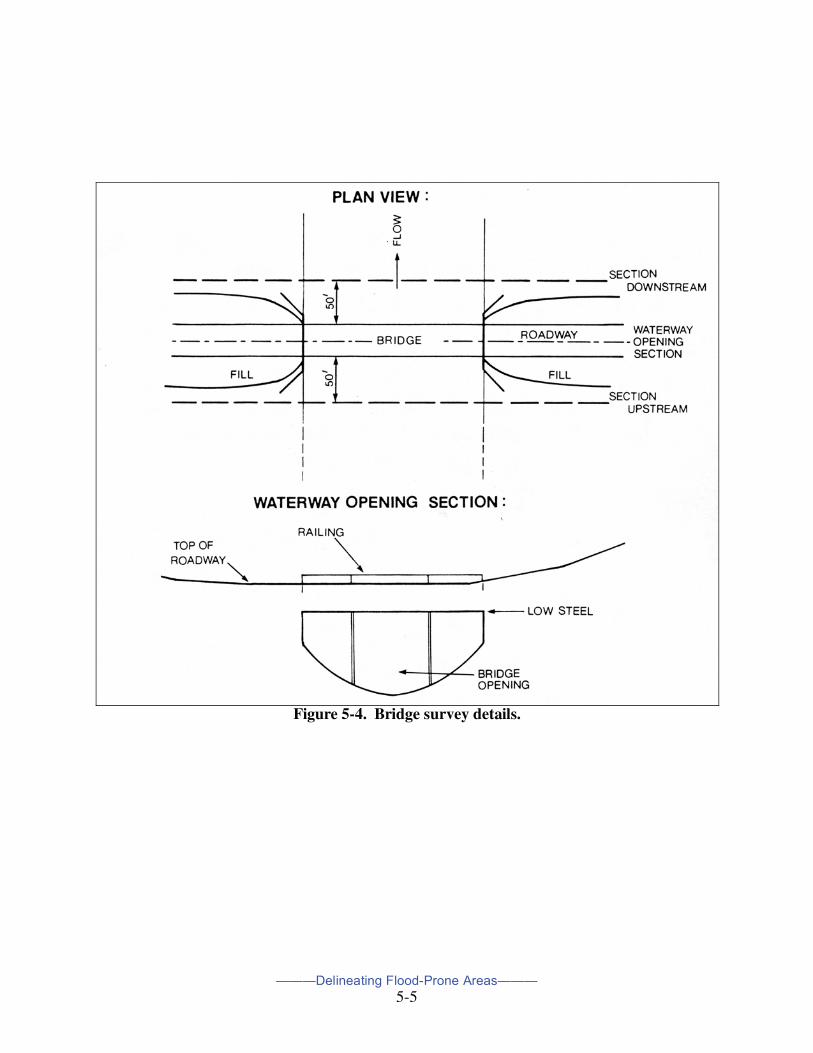
Expressing S as hL /L The total friction head for a reach of distance L between two sections can be determined by the following equation: hf = L (S1+S2) 2 Eddy and other minor losses, if present, often require extensive evaluation and will not be covered here. Channel or Floodplain Characteristics The accuracy of any floodplain delineation is dependent on the gathering of data representative of the prevailing hydraulic flow conditions, and the analysis of them through reasonable assumptions and interpretations. Surveyed, or scaled (from maps), or photogrammetric methods are used to determine areas through which floodwaters will flow. Cross-sections of the channel and adjoining floodplain should be taken at normal or right angle to the direction of flow. Each cross-section is considered to be representative of the area half way to the next cross-section in either direction. (Refer to sketches on Figures 5-2 – 5-4.) The cross-section can be used to determine elevation of the streambed, area, and hydraulic radius.
Figure 5-2. Cross section locations.
———Delineating Flood-Prone Areas———
5-4
Figure 5-3. Typical stream cross section.
———Delineating Flood-Prone Areas———
5-5
Figure 5-4. Bridge survey details.
———Delineating Flood-Prone Areas———
5-6
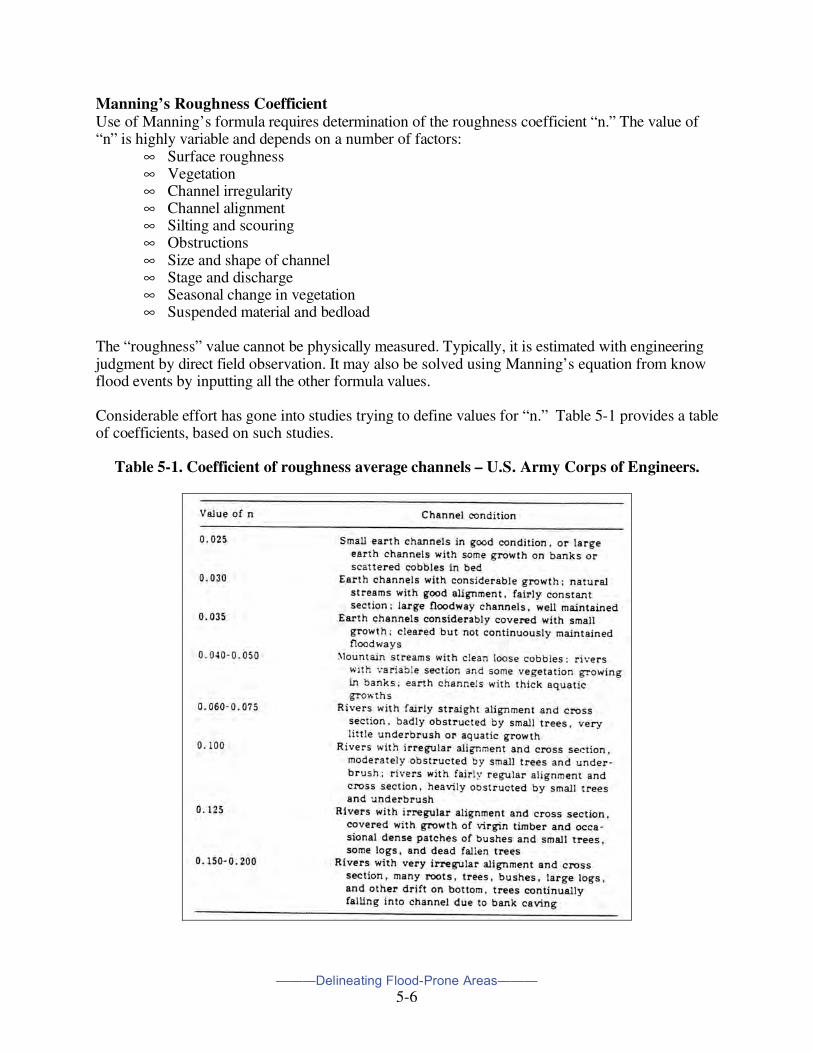
Manning’s Roughness Coefficient Use of Manning’s formula requires determination of the roughness coefficient “n.” The value of “n” is highly variable and depends on a number of factors:
∞ Surface roughness ∞ Vegetation ∞ Channel irregularity ∞ Channel alignment ∞ Silting and scouring ∞ Obstructions ∞ Size and shape of channel ∞ Stage and discharge ∞ Seasonal change in vegetation ∞ Suspended material and bedload
The “roughness” value cannot be physically measured. Typically, it is estimated with engineering judgment by direct field observation. It may also be solved using Manning’s equation from know flood events by inputting all the other formula values. Considerable effort has gone into studies trying to define values for “n.” Table 5-1 provides a table of coefficients, based on such studies.
Table 5-1. Coefficient of roughness average channels – U.S. Army Corps of Engineers.
———Delineating Flood-Prone Areas———
5-7
Basic Computational Methods The computational procedure for determining water surface profiles is based on the solution of the one-dimensional energy equation with energy loss due to friction evaluated with Manning’s equation. The effects of local obstructions to flow enter into the computations. Such obstructions cause upstream water surfaces to rise, resulting in the term “backwater.” Computations proceed upstream cross-section by cross-section in a step-by-step process, thus engineers refer to the whole computational process as “step backwater” or the standard-step method. Computations begin at a known or assumed water surface elevation. They proceed upstream for subcritical flow and downstream for supercritical flow. Only in steep streams is supercritical flow encountered. Compared to subcritical flow, it is rarely encountered. The water surface elevation for the beginning cross-section may be specified in a number of ways:
∞ as critical depth [This method is appropriate at locations where critical flow or near critical flow conditions are known to exist for the range of discharges being computed (e.g., a waterfall, weir or a section of rapids)].
∞ as a known (historic flood) or computed (from a previous study of the downstream area) elevation
∞ by the slope-area method (or normal depth, i.e., the depth of flow in a channel when the slope of the water surface and channel bottom is the same and the water depth remains constant.)
Applying the slope-area method, using the Manning’s equation Q = 1.486 AR2/3S1/2
n Known are n, Q S, the slope of the energy gradient, can be reasonably represented by using the slope of the stream’s water surface (elevation divided by distance between two cross-sections), either measured from acquired channel cross-sectional data or from water surface elevations of actual flood events in the near vicinity of the beginning cross-section. Rearranging AR2/3 = Qn/1.486 S1/2
Various elevations are assumed to satisfy the equation, to arrive at the water surface elevation for the beginning cross-section and in computations for subsequent cross-sections.1 Strictly speaking, Manning’s equation is applicable to uniform flow conditions, a condition that rarely, if ever, exists in natural channels. It is, however, a useful technical approximation. Another approach is to use 2-3 cross-sections downstream of the study reach. An elevation is assumed based on engineering judgment or experience. The water surface elevation generally converges with the “true” elevation within 2-3 cross-sections. 1 The U.S. Army Corps of Engineer’s Hydrologic Engineering Center computer program “HEC-2, Water Surface Profiles,” see text, can be used to calculate critical depth or the water surface elevation for the beginning cross-section by the slope-area method.
———Delineating Flood-Prone Areas———
5-8
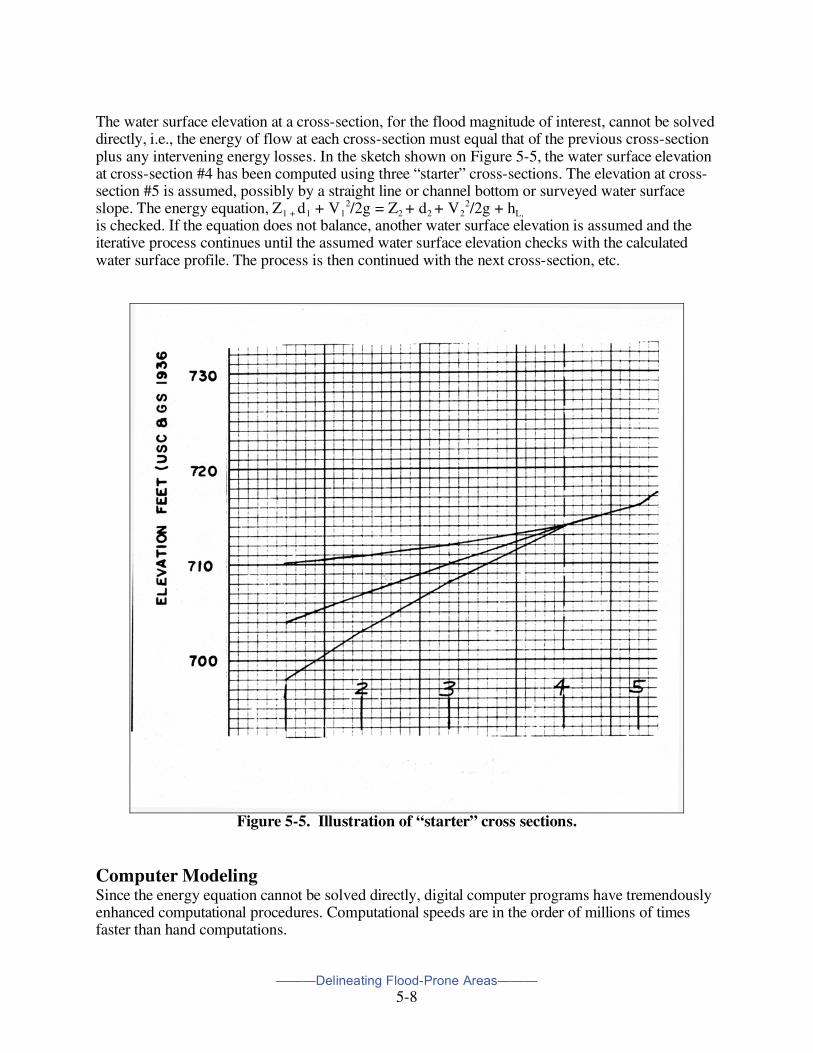
The water surface elevation at a cross-section, for the flood magnitude of interest, cannot be solved directly, i.e., the energy of flow at each cross-section must equal that of the previous cross-section plus any intervening energy losses. In the sketch shown on Figure 5-5, the water surface elevation at cross-section #4 has been computed using three “starter” cross-sections. The elevation at cross-section #5 is assumed, possibly by a straight line or channel bottom or surveyed water surface slope. The energy equation, Z1 + d1 + V1
2/2g = Z2 + d2 + V22/2g + hL,
is checked. If the equation does not balance, another water surface elevation is assumed and the iterative process continues until the assumed water surface elevation checks with the calculated water surface profile. The process is then continued with the next cross-section, etc.
Figure 5-5. Illustration of “starter” cross sections.
Computer Modeling Since the energy equation cannot be solved directly, digital computer programs have tremendously enhanced computational procedures. Computational speeds are in the order of millions of times faster than hand computations.
———Delineating Flood-Prone Areas———
5-9
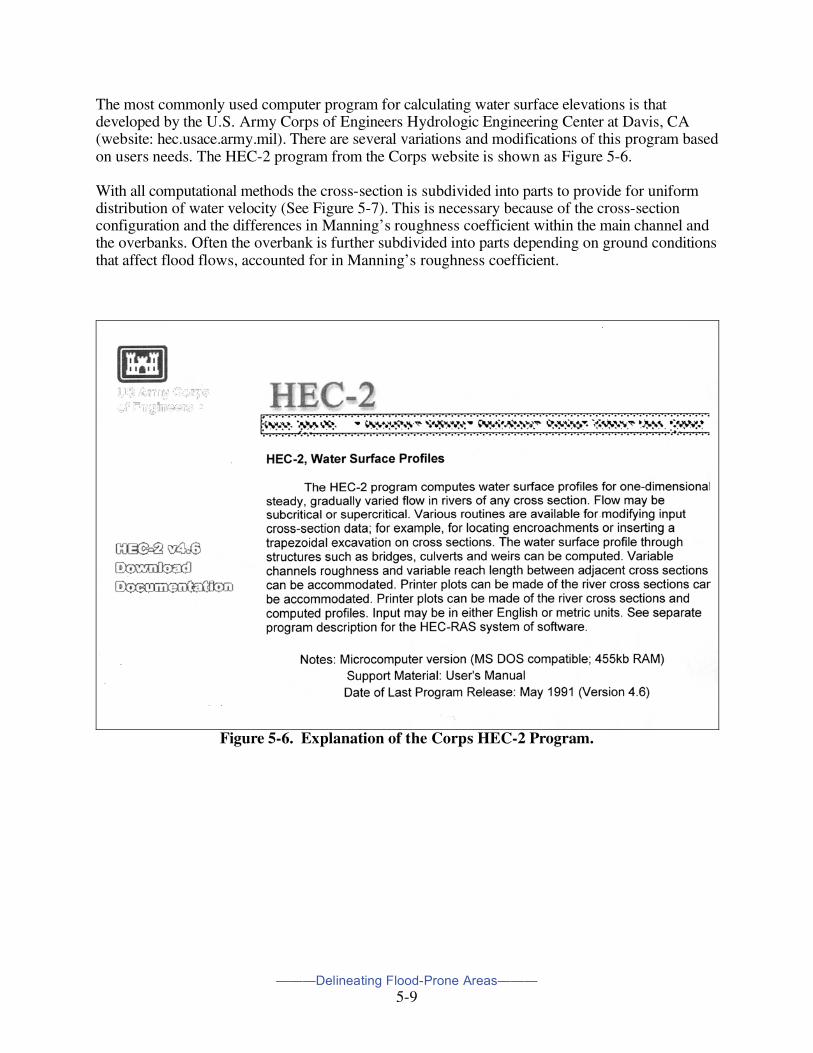
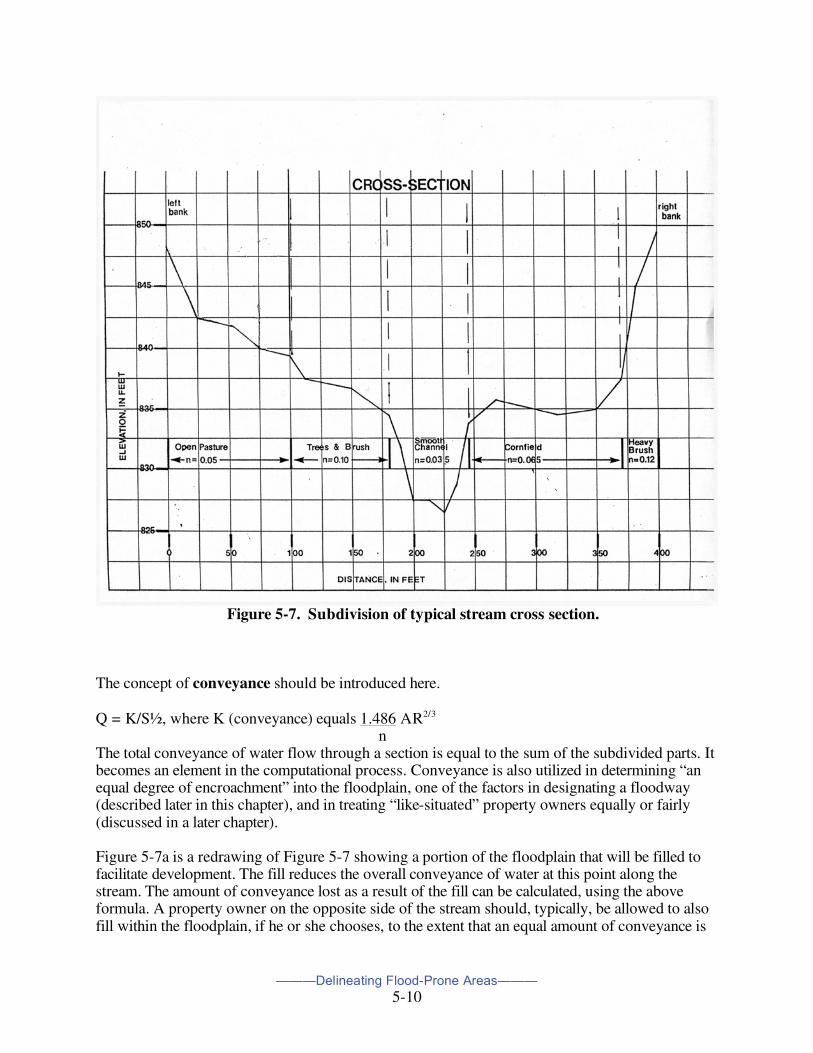
The most commonly used computer program for calculating water surface elevations is that developed by the U.S. Army Corps of Engineers Hydrologic Engineering Center at Davis, CA (website: hec.usace.army.mil). There are several variations and modifications of this program based on users needs. The HEC-2 program from the Corps website is shown as Figure 5-6. With all computational methods the cross-section is subdivided into parts to provide for uniform distribution of water velocity (See Figure 5-7). This is necessary because of the cross-section configuration and the differences in Manning’s roughness coefficient within the main channel and the overbanks. Often the overbank is further subdivided into parts depending on ground conditions that affect flood flows, accounted for in Manning’s roughness coefficient.
Figure 5-6. Explanation of the Corps HEC-2 Program.
———Delineating Flood-Prone Areas———
5-10
Figure 5-7. Subdivision of typical stream cross section.
The concept of conveyance should be introduced here. Q = K/S½, where K (conveyance) equals 1.486 AR2/3
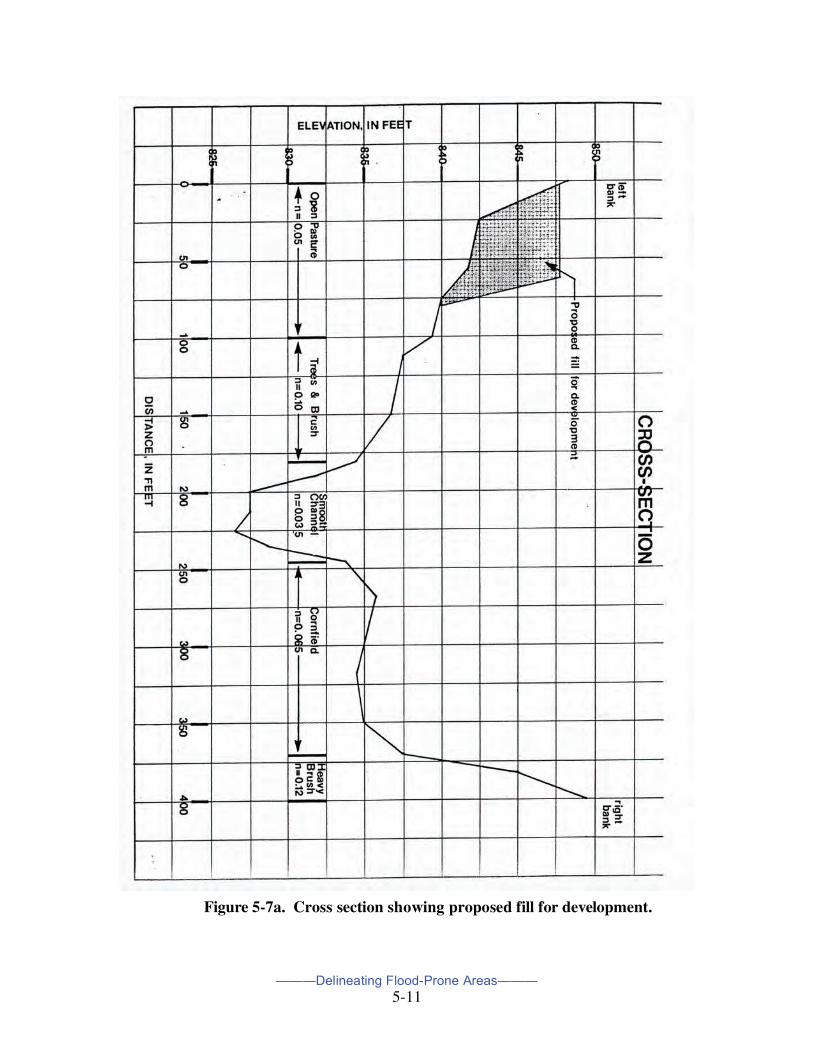
n The total conveyance of water flow through a section is equal to the sum of the subdivided parts. It becomes an element in the computational process. Conveyance is also utilized in determining “an equal degree of encroachment” into the floodplain, one of the factors in designating a floodway (described later in this chapter), and in treating “like-situated” property owners equally or fairly (discussed in a later chapter). Figure 5-7a is a redrawing of Figure 5-7 showing a portion of the floodplain that will be filled to facilitate development. The fill reduces the overall conveyance of water at this point along the stream. The amount of conveyance lost as a result of the fill can be calculated, using the above formula. A property owner on the opposite side of the stream should, typically, be allowed to also fill within the floodplain, if he or she chooses, to the extent that an equal amount of conveyance is
———Delineating Flood-Prone Areas———
5-11
Figure 5-7a. Cross section showing proposed fill for development.
———Delineating Flood-Prone Areas———
5-12
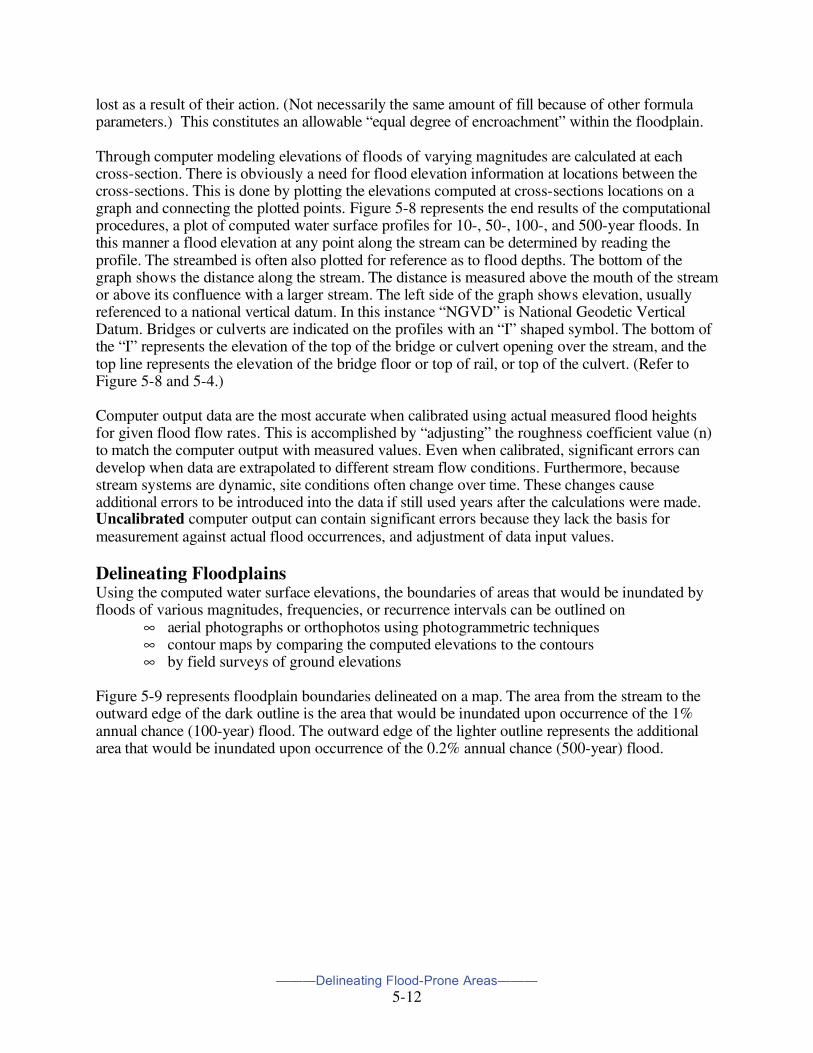
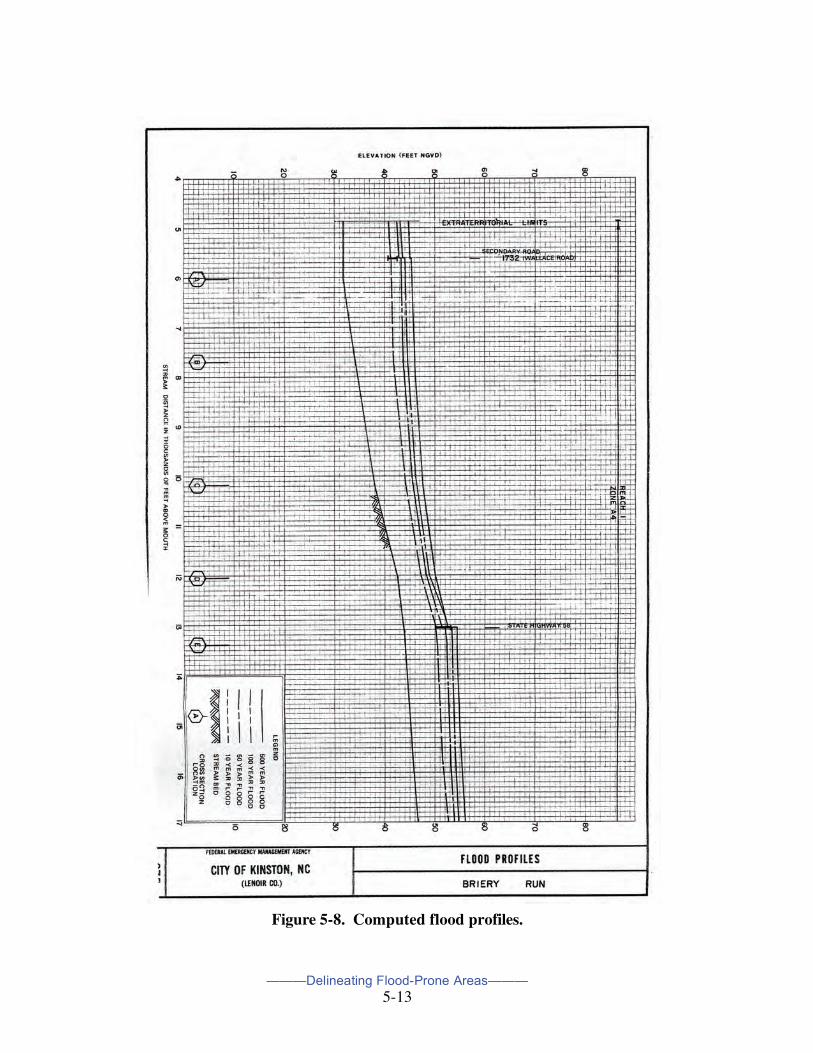
lost as a result of their action. (Not necessarily the same amount of fill because of other formula parameters.) This constitutes an allowable “equal degree of encroachment” within the floodplain. Through computer modeling elevations of floods of varying magnitudes are calculated at each cross-section. There is obviously a need for flood elevation information at locations between the cross-sections. This is done by plotting the elevations computed at cross-sections locations on a graph and connecting the plotted points. Figure 5-8 represents the end results of the computational procedures, a plot of computed water surface profiles for 10-, 50-, 100-, and 500-year floods. In this manner a flood elevation at any point along the stream can be determined by reading the profile. The streambed is often also plotted for reference as to flood depths. The bottom of the graph shows the distance along the stream. The distance is measured above the mouth of the stream or above its confluence with a larger stream. The left side of the graph shows elevation, usually referenced to a national vertical datum. In this instance “NGVD” is National Geodetic Vertical Datum. Bridges or culverts are indicated on the profiles with an “I” shaped symbol. The bottom of the “I” represents the elevation of the top of the bridge or culvert opening over the stream, and the top line represents the elevation of the bridge floor or top of rail, or top of the culvert. (Refer to Figure 5-8 and 5-4.) Computer output data are the most accurate when calibrated using actual measured flood heights for given flood flow rates. This is accomplished by “adjusting” the roughness coefficient value (n) to match the computer output with measured values. Even when calibrated, significant errors can develop when data are extrapolated to different stream flow conditions. Furthermore, because stream systems are dynamic, site conditions often change over time. These changes cause additional errors to be introduced into the data if still used years after the calculations were made. Uncalibrated computer output can contain significant errors because they lack the basis for measurement against actual flood occurrences, and adjustment of data input values. Delineating Floodplains Using the computed water surface elevations, the boundaries of areas that would be inundated by floods of various magnitudes, frequencies, or recurrence intervals can be outlined on
∞ aerial photographs or orthophotos using photogrammetric techniques ∞ contour maps by comparing the computed elevations to the contours ∞ by field surveys of ground elevations
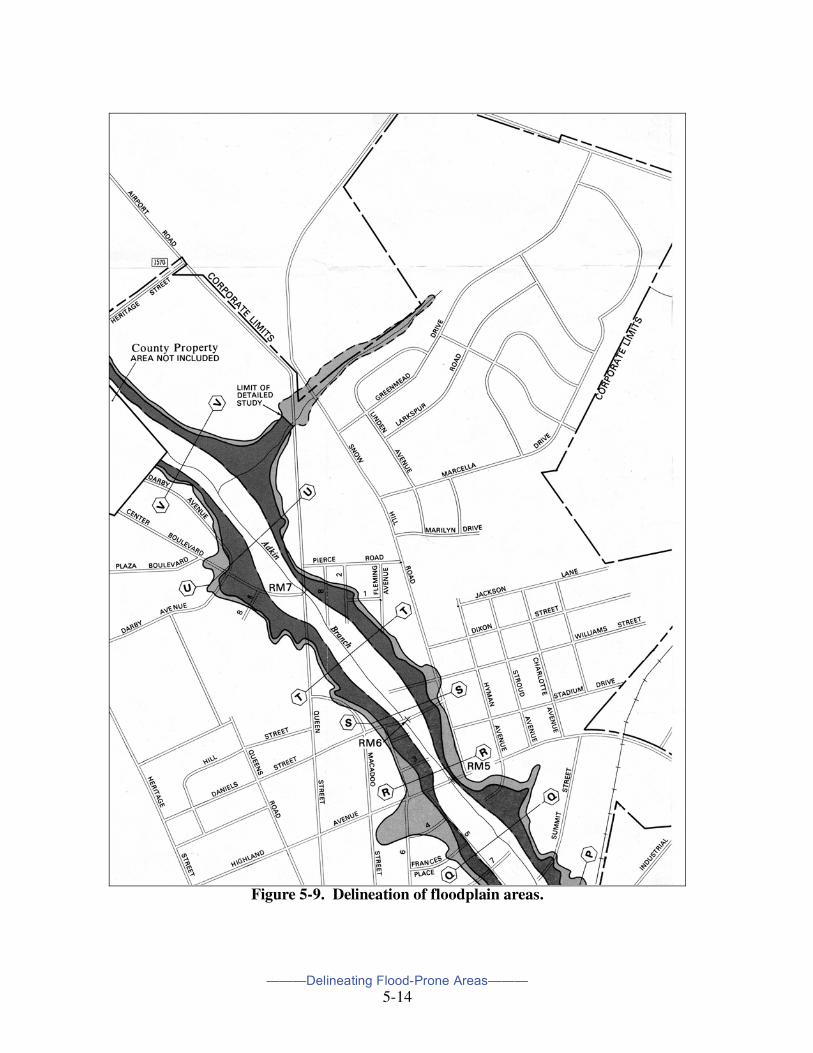
Figure 5-9 represents floodplain boundaries delineated on a map. The area from the stream to the outward edge of the dark outline is the area that would be inundated upon occurrence of the 1% annual chance (100-year) flood. The outward edge of the lighter outline represents the additional area that would be inundated upon occurrence of the 0.2% annual chance (500-year) flood.
———Delineating Flood-Prone Areas———
5-13
Figure 5-8. Computed flood profiles.
———Delineating Flood-Prone Areas———
5-14
Figure 5-9. Delineation of floodplain areas.
———Delineating Flood-Prone Areas———
5-15
As now discussed, other ways of defining flood hazard areas may be applicable where detailed engineering studies cannot be justified. Historic Flood Data Aerial Photography The problem with use of this method is obtaining photography at the peak stage of the flood. Use of infrared and other enhancement techniques have allowed photography through cloud cover and other less ideal conditions. Sketching Employment of this method involves sketching in the field on street maps or other large scale maps by walking or driving along the edge of the flooded area, or by the use of aerial photographs or transfer of the photo outline onto a map. High-water Marks Another method is to identify high-water marks along a stream after the flood, that can later be tied into a common datum by field surveys. Topographic Maps Map inspection may provide approximate flood areas by considering land elevations relative to the stream. Detailed Soil Maps This method for determining flood hazard areas has application in those situations where land surfaces have not been materially altered by past human activity. Detailed soil maps are prepared by the Natural Resources Conservation Service’s Soil Survey Program in cooperation with a state and/or county sponsor. The use of detailed soil maps for locating floodplain areas is often rapid and economical. They are prepared by soil scientists who carefully determine soil types in the field based upon physical characteristics. Field examination is supplemented with aerial photography interpretation. The boundaries of soil units are drawn on aerial photographs, usually at a scale of 4” = 1 mile. The completed soil maps show the location of each soil unit, and an accompanying text describes the soil characteristics. Floodplains are distinct geomorphic units of landscape that contain unique kinds of soils. The floodplain is an area of active erosion and deposition, and evidence of these activities are clues that guide the soil scientist in designation of alluvial soil. This soil, as defined by the U.S. Department of Agriculture, is a soil consisting of recently deposited unconsolidated alluvium generally stratified and exhibiting essentially no development or modification of the materials. These kinds of soils are recognizably different from those soils that are not flooded. The soil scientist can accurately delineate the area of alluvial soil, however, this may and often does not correspond exactly with the area inundated by the infrequent occurring flood. These types of floods do not occur often enough to leave well defined permanent evidence on the land. However, non-alluvial soils subject to flooding can also be recognized by one familiar with the soils, geology,
———Delineating Flood-Prone Areas———
5-16
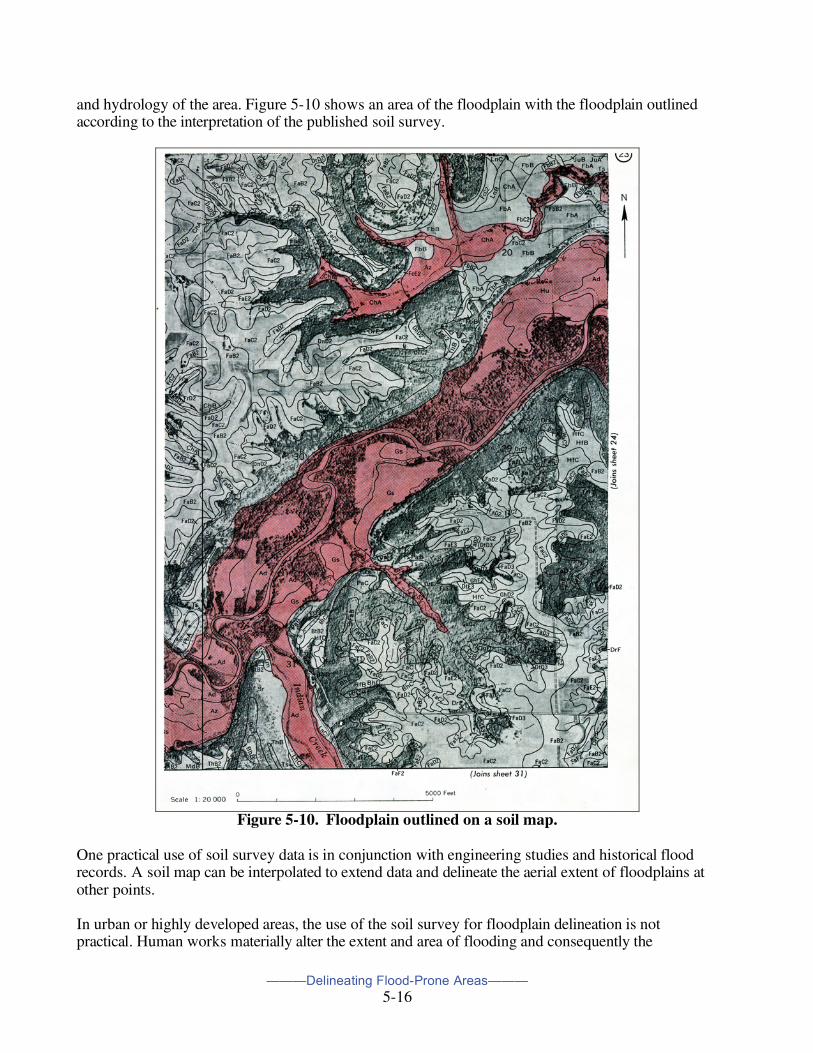
and hydrology of the area. Figure 5-10 shows an area of the floodplain with the floodplain outlined according to the interpretation of the published soil survey.
Figure 5-10. Floodplain outlined on a soil map.
One practical use of soil survey data is in conjunction with engineering studies and historical flood records. A soil map can be interpolated to extend data and delineate the aerial extent of floodplains at other points. In urban or highly developed areas, the use of the soil survey for floodplain delineation is not practical. Human works materially alter the extent and area of flooding and consequently the
———Delineating Flood-Prone Areas———
5-17
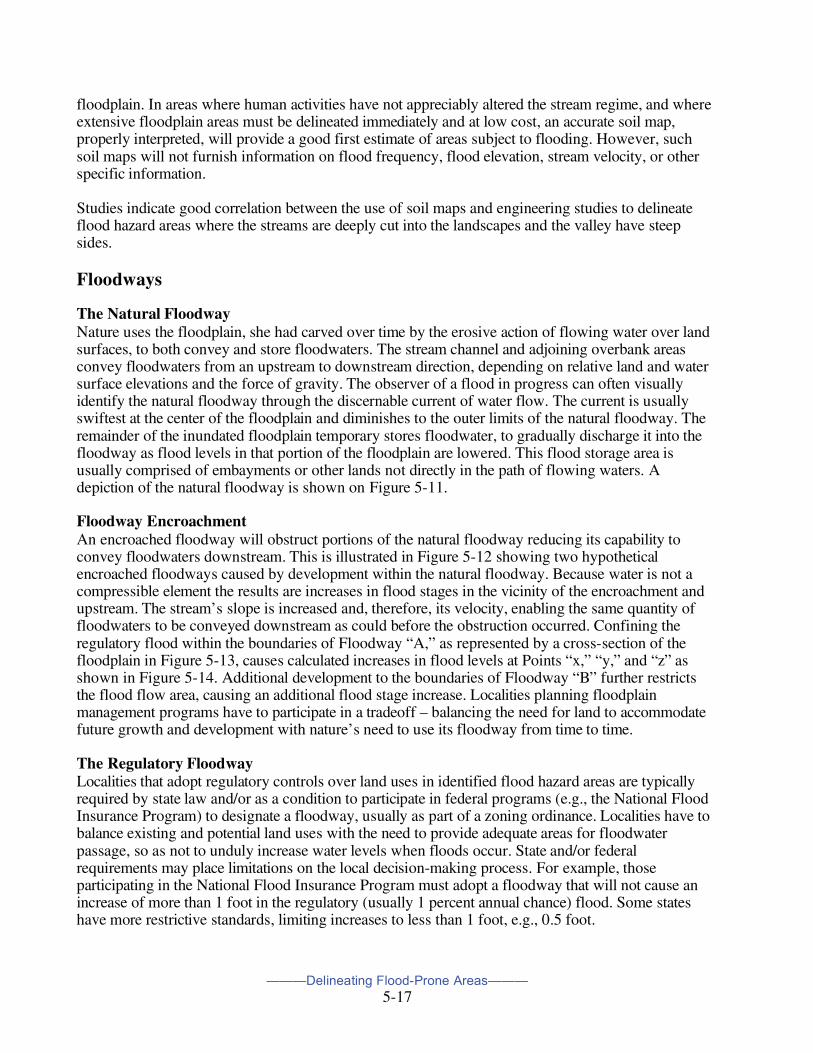
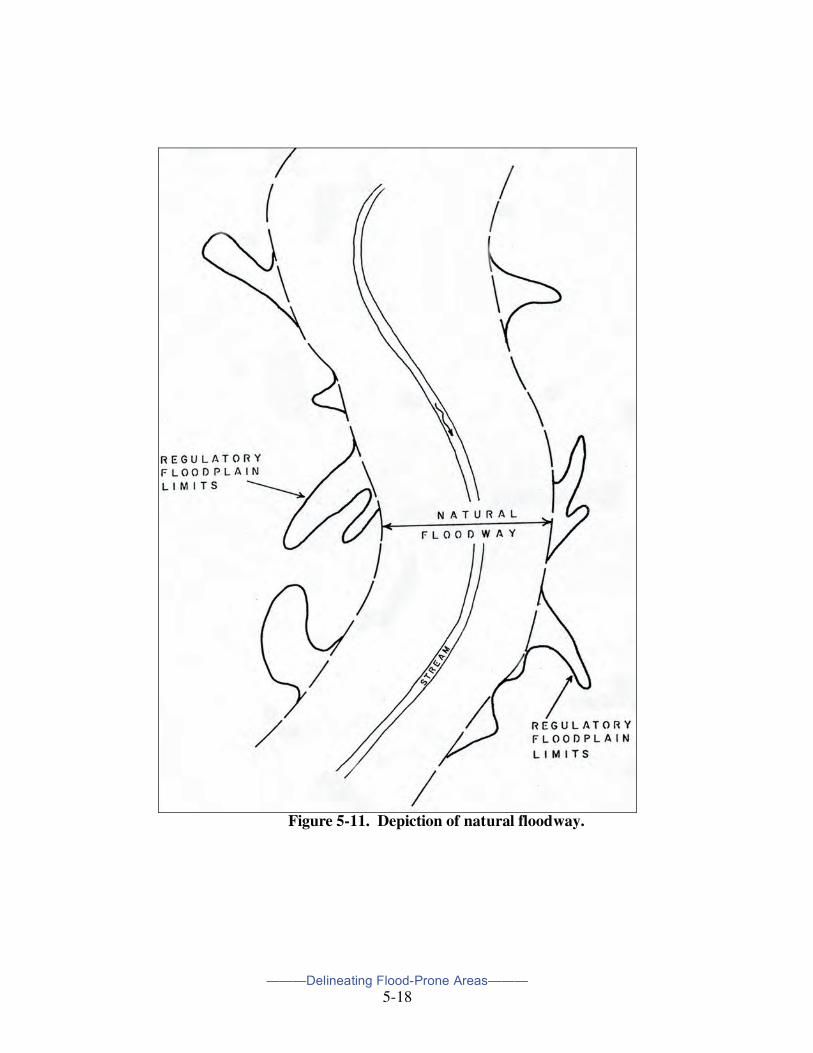
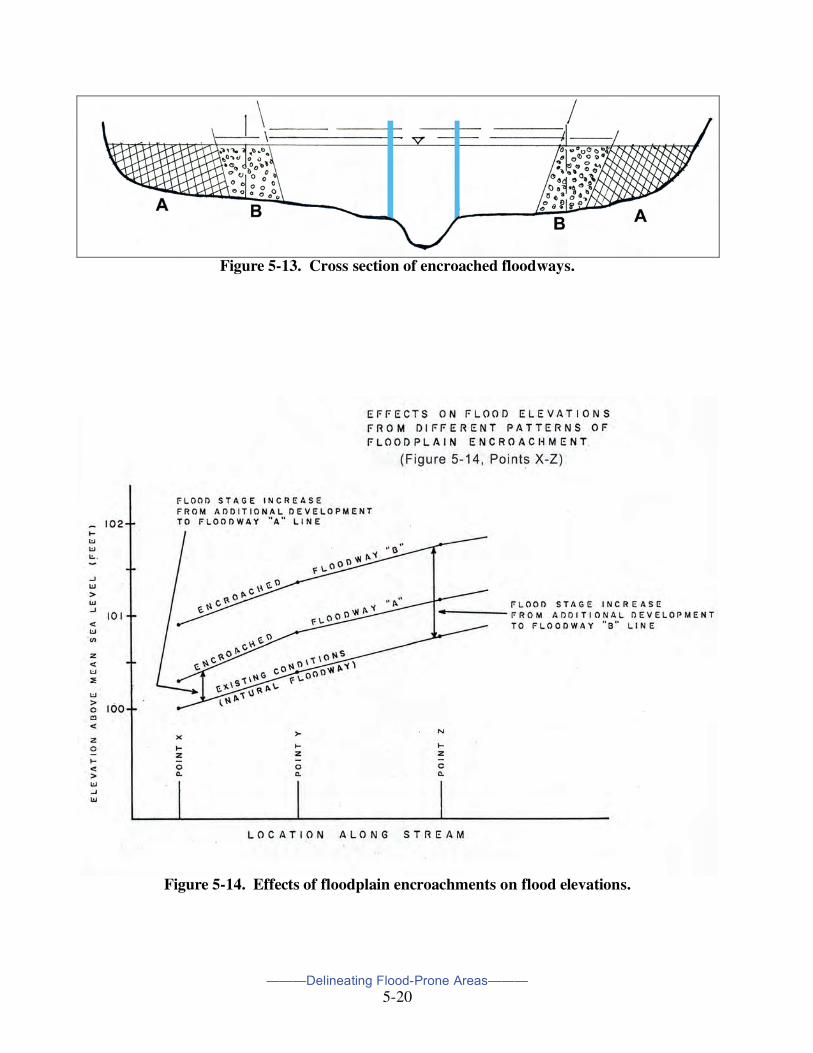
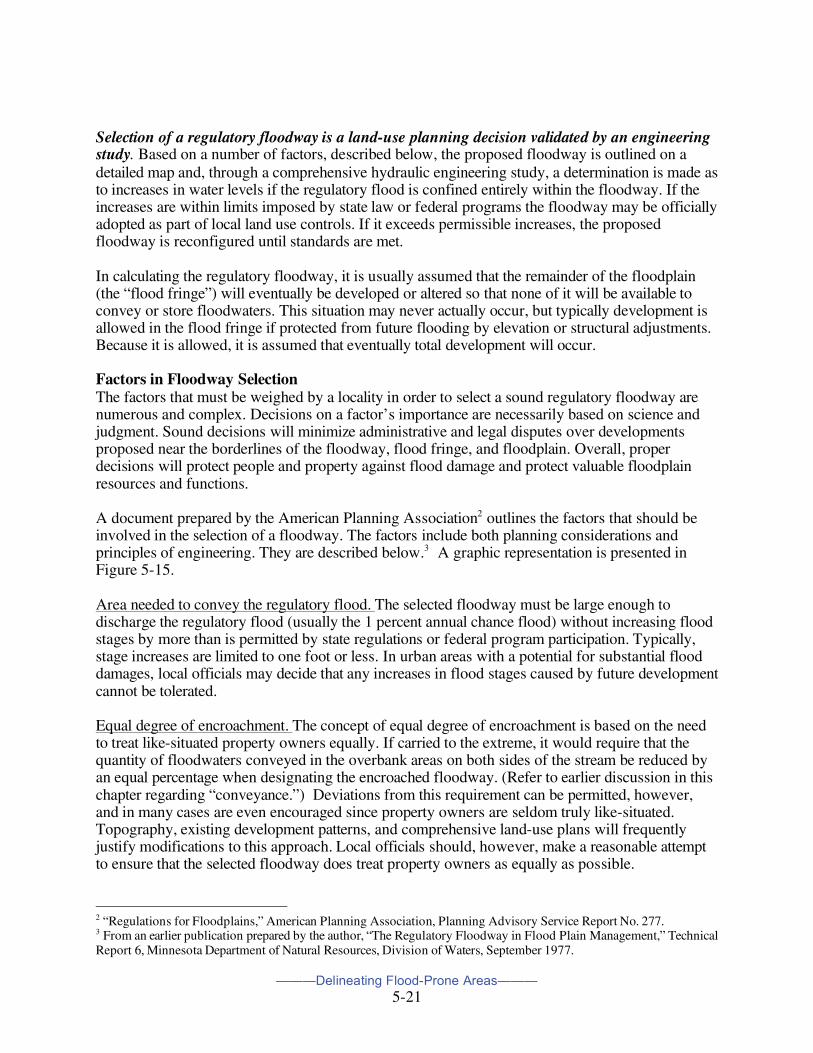
floodplain. In areas where human activities have not appreciably altered the stream regime, and where extensive floodplain areas must be delineated immediately and at low cost, an accurate soil map, properly interpreted, will provide a good first estimate of areas subject to flooding. However, such soil maps will not furnish information on flood frequency, flood elevation, stream velocity, or other specific information. Studies indicate good correlation between the use of soil maps and engineering studies to delineate flood hazard areas where the streams are deeply cut into the landscapes and the valley have steep sides. Floodways The Natural Floodway Nature uses the floodplain, she had carved over time by the erosive action of flowing water over land surfaces, to both convey and store floodwaters. The stream channel and adjoining overbank areas convey floodwaters from an upstream to downstream direction, depending on relative land and water surface elevations and the force of gravity. The observer of a flood in progress can often visually identify the natural floodway through the discernable current of water flow. The current is usually swiftest at the center of the floodplain and diminishes to the outer limits of the natural floodway. The remainder of the inundated floodplain temporary stores floodwater, to gradually discharge it into the floodway as flood levels in that portion of the floodplain are lowered. This flood storage area is usually comprised of embayments or other lands not directly in the path of flowing waters. A depiction of the natural floodway is shown on Figure 5-11. Floodway Encroachment An encroached floodway will obstruct portions of the natural floodway reducing its capability to convey floodwaters downstream. This is illustrated in Figure 5-12 showing two hypothetical encroached floodways caused by development within the natural floodway. Because water is not a compressible element the results are increases in flood stages in the vicinity of the encroachment and upstream. The stream’s slope is increased and, therefore, its velocity, enabling the same quantity of floodwaters to be conveyed downstream as could before the obstruction occurred. Confining the regulatory flood within the boundaries of Floodway “A,” as represented by a cross-section of the floodplain in Figure 5-13, causes calculated increases in flood levels at Points “x,” “y,” and “z” as shown in Figure 5-14. Additional development to the boundaries of Floodway “B” further restricts the flood flow area, causing an additional flood stage increase. Localities planning floodplain management programs have to participate in a tradeoff – balancing the need for land to accommodate future growth and development with nature’s need to use its floodway from time to time. The Regulatory Floodway Localities that adopt regulatory controls over land uses in identified flood hazard areas are typically required by state law and/or as a condition to participate in federal programs (e.g., the National Flood Insurance Program) to designate a floodway, usually as part of a zoning ordinance. Localities have to balance existing and potential land uses with the need to provide adequate areas for floodwater passage, so as not to unduly increase water levels when floods occur. State and/or federal requirements may place limitations on the local decision-making process. For example, those participating in the National Flood Insurance Program must adopt a floodway that will not cause an increase of more than 1 foot in the regulatory (usually 1 percent annual chance) flood. Some states have more restrictive standards, limiting increases to less than 1 foot, e.g., 0.5 foot.
———Delineating Flood-Prone Areas———
5-18
Figure 5-11. Depiction of natural floodway.
———Delineating Flood-Prone Areas———
5-19
Figure 5-12. Depiction of encroached floodways.
———Delineating Flood-Prone Areas———
5-20
Figure 5-13. Cross section of encroached floodways.
Figure 5-14. Effects of floodplain encroachments on flood elevations.
———Delineating Flood-Prone Areas———
5-21
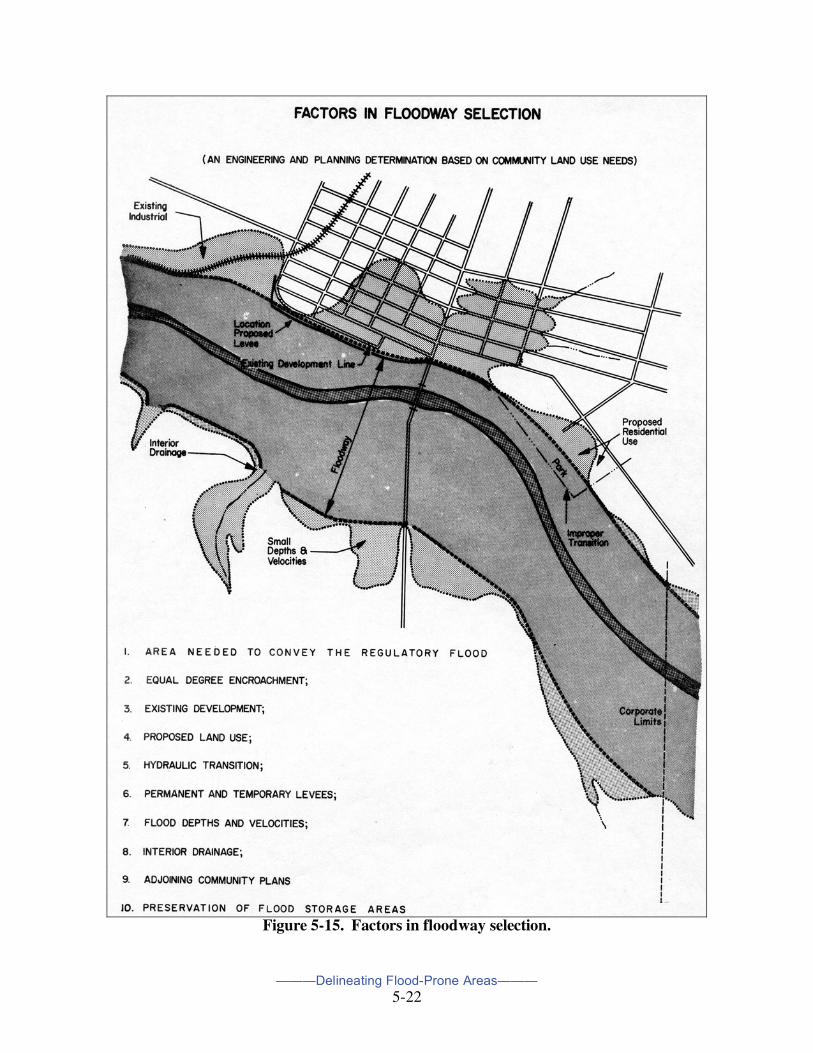
Selection of a regulatory floodway is a land-use planning decision validated by an engineering study. Based on a number of factors, described below, the proposed floodway is outlined on a detailed map and, through a comprehensive hydraulic engineering study, a determination is made as to increases in water levels if the regulatory flood is confined entirely within the floodway. If the increases are within limits imposed by state law or federal programs the floodway may be officially adopted as part of local land use controls. If it exceeds permissible increases, the proposed floodway is reconfigured until standards are met. In calculating the regulatory floodway, it is usually assumed that the remainder of the floodplain (the “flood fringe”) will eventually be developed or altered so that none of it will be available to convey or store floodwaters. This situation may never actually occur, but typically development is allowed in the flood fringe if protected from future flooding by elevation or structural adjustments. Because it is allowed, it is assumed that eventually total development will occur. Factors in Floodway Selection The factors that must be weighed by a locality in order to select a sound regulatory floodway are numerous and complex. Decisions on a factor’s importance are necessarily based on science and judgment. Sound decisions will minimize administrative and legal disputes over developments proposed near the borderlines of the floodway, flood fringe, and floodplain. Overall, proper decisions will protect people and property against flood damage and protect valuable floodplain resources and functions. A document prepared by the American Planning Association2 outlines the factors that should be involved in the selection of a floodway. The factors include both planning considerations and principles of engineering. They are described below.3 A graphic representation is presented in Figure 5-15. Area needed to convey the regulatory flood. The selected floodway must be large enough to discharge the regulatory flood (usually the 1 percent annual chance flood) without increasing flood stages by more than is permitted by state regulations or federal program participation. Typically, stage increases are limited to one foot or less. In urban areas with a potential for substantial flood damages, local officials may decide that any increases in flood stages caused by future development cannot be tolerated. Equal degree of encroachment. The concept of equal degree of encroachment is based on the need to treat like-situated property owners equally. If carried to the extreme, it would require that the quantity of floodwaters conveyed in the overbank areas on both sides of the stream be reduced by an equal percentage when designating the encroached floodway. (Refer to earlier discussion in this chapter regarding “conveyance.”) Deviations from this requirement can be permitted, however, and in many cases are even encouraged since property owners are seldom truly like-situated. Topography, existing development patterns, and comprehensive land-use plans will frequently justify modifications to this approach. Local officials should, however, make a reasonable attempt to ensure that the selected floodway does treat property owners as equally as possible.
2 “Regulations for Floodplains,” American Planning Association, Planning Advisory Service Report No. 277. 3 From an earlier publication prepared by the author, “The Regulatory Floodway in Flood Plain Management,” Technical Report 6, Minnesota Department of Natural Resources, Division of Waters, September 1977.
———Delineating Flood-Prone Areas———
5-22
Figure 5-15. Factors in floodway selection.
———Delineating Flood-Prone Areas———
5-23
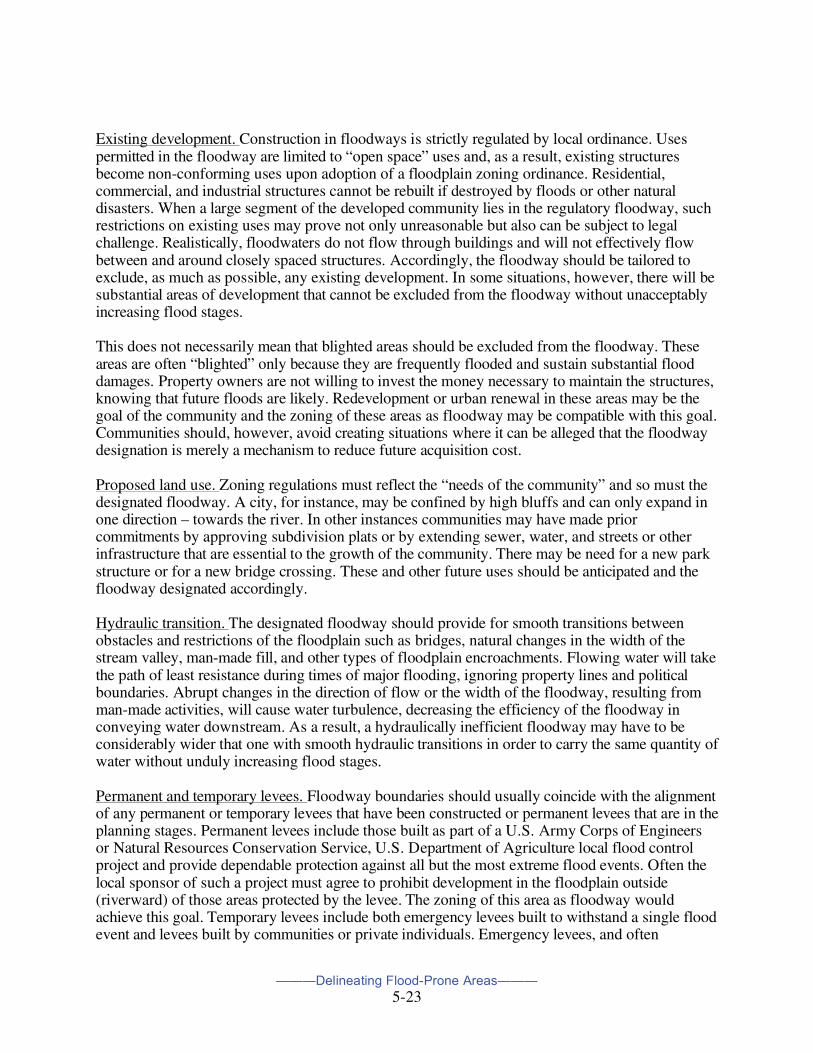
Existing development. Construction in floodways is strictly regulated by local ordinance. Uses permitted in the floodway are limited to “open space” uses and, as a result, existing structures become non-conforming uses upon adoption of a floodplain zoning ordinance. Residential, commercial, and industrial structures cannot be rebuilt if destroyed by floods or other natural disasters. When a large segment of the developed community lies in the regulatory floodway, such restrictions on existing uses may prove not only unreasonable but also can be subject to legal challenge. Realistically, floodwaters do not flow through buildings and will not effectively flow between and around closely spaced structures. Accordingly, the floodway should be tailored to exclude, as much as possible, any existing development. In some situations, however, there will be substantial areas of development that cannot be excluded from the floodway without unacceptably increasing flood stages. This does not necessarily mean that blighted areas should be excluded from the floodway. These areas are often “blighted” only because they are frequently flooded and sustain substantial flood damages. Property owners are not willing to invest the money necessary to maintain the structures, knowing that future floods are likely. Redevelopment or urban renewal in these areas may be the goal of the community and the zoning of these areas as floodway may be compatible with this goal. Communities should, however, avoid creating situations where it can be alleged that the floodway designation is merely a mechanism to reduce future acquisition cost. Proposed land use. Zoning regulations must reflect the “needs of the community” and so must the designated floodway. A city, for instance, may be confined by high bluffs and can only expand in one direction – towards the river. In other instances communities may have made prior commitments by approving subdivision plats or by extending sewer, water, and streets or other infrastructure that are essential to the growth of the community. There may be need for a new park structure or for a new bridge crossing. These and other future uses should be anticipated and the floodway designated accordingly. Hydraulic transition. The designated floodway should provide for smooth transitions between obstacles and restrictions of the floodplain such as bridges, natural changes in the width of the stream valley, man-made fill, and other types of floodplain encroachments. Flowing water will take the path of least resistance during times of major flooding, ignoring property lines and political boundaries. Abrupt changes in the direction of flow or the width of the floodway, resulting from man-made activities, will cause water turbulence, decreasing the efficiency of the floodway in conveying water downstream. As a result, a hydraulically inefficient floodway may have to be considerably wider that one with smooth hydraulic transitions in order to carry the same quantity of water without unduly increasing flood stages. Permanent and temporary levees. Floodway boundaries should usually coincide with the alignment of any permanent or temporary levees that have been constructed or permanent levees that are in the planning stages. Permanent levees include those built as part of a U.S. Army Corps of Engineers or Natural Resources Conservation Service, U.S. Department of Agriculture local flood control project and provide dependable protection against all but the most extreme flood events. Often the local sponsor of such a project must agree to prohibit development in the floodplain outside (riverward) of those areas protected by the levee. The zoning of this area as floodway would achieve this goal. Temporary levees include both emergency levees built to withstand a single flood event and levees built by communities or private individuals. Emergency levees, and often
———Delineating Flood-Prone Areas———
5-24
community or private levees, do not provide dependable flood protection since they do not utilize the design procedures, construction practices, and safety factors incorporated into permanent federal projects. They do provide a line of defense for future flood fights and do channel waters around developed areas. For these reasons the temporary levee alignment would again be a logical floodway boundary. Flood depths and velocities. The depth and velocity of floodwaters in a particular area can be almost as important a consideration in floodway selection as is providing sufficient area to convey flood flows. Because floodplain management is concerned not only in reducing damages to property but also with minimizing threats to public safety, substantial flood depths and velocities place severe physical constraints on floodplain development. Flood depths of greater than two (2) feet or flood velocities greater than four (4) feet per second pose a definite hazard to human safety. When local officials designate a floodway, they in effect are saying that areas outside of that floodway can be both safely and economically developed. Flood depths and velocities that are practical for development will vary depending on the underlying zoning district. Large flood depths and velocities may preclude residential development due to the cost of fill or flood-proofing, the difficulty of providing safe access, the threat of public safety, or even the cost of protecting the fill from erosion. It may be perfectly feasible, however, to develop areas with similar flood depths and velocities as industrial sites since a substantial capital investment is already involved. Still, there is a point where all development becomes neither economically feasible nor in the best interests of the community. Areas of the floodplain that are not accessible by roads and where roads are not planned should not be designated as flood fringe. Isolated developments that are not contiguous to high ground should not be encouraged. At least in the interim, these areas should be designated as floodway until such time as adequate access can be provided. Interior drainage. The effects on interior drainage cannot be ignored when designating a floodway or developing a program of regulations. Permission to fill in the flood fringe of a major watercourse does not constitute permission to fill in or around the channels of drainage ditches and tributary streams which are often subject to annual or even greater frequency of flooding. Adjoining community plans. The selected floodway limits must be compatible with the floodways designated by upstream and downstream communities. The increases in flood stages caused by floodway encroachments in downstream communities are carried into adjacent upstream communities. Typically these stage increases must not be more than 1 foot, for reasons outlined earlier. In addition, for the sake of credibility, floodway limits at the boundary of adjoining communities should match whenever possible. It is generally been the responsibility of state coordinating agencies or regional councils of government to ensure that the floodway selections of adjoining communities are, in fact, reasonably consistent. Preservation of flood storage areas. Floodplains function as temporary storage areas for floodwaters. The discharge of the floodwater is often delayed, often resulting in the lowering of flood peaks downstream. The impact of storage will vary greatly depending on the size, shape, topography, and other natural characteristics of the watershed. The concept of the floodway was originally developed as part of a system designed to regulate development along major river systems. Generally, river systems contain vast amounts of natural storage capability in non-urban areas. Downstream storage areas fill up gradually as floodwaters rise. The net result is that
———Delineating Flood-Prone Areas———
5-25
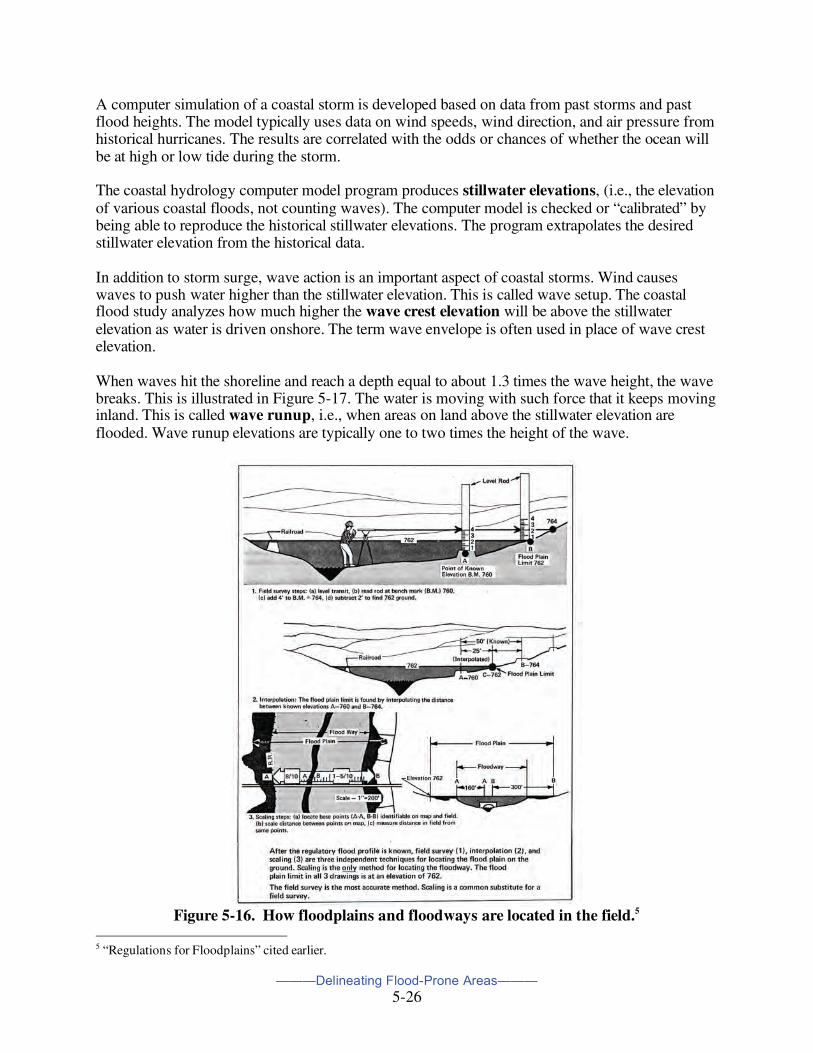
localized loss of this downstream storage seldom has a measurable impact on flood peaks. As a result, floodplain management programs have usually ignored storage when evaluating the effects of designating a floodway. On small urban steams, however, storage can have a significant impact on flood discharges and flood peaks. Floods on small streams are of short duration and the time of peak flows on each of the tributary streams becomes important. By filling storage areas, floodwaters are often concentrated much more rapidly, resulting in higher discharges and higher flood peaks. On these small streams, it is often possible to fill right up to the stream channel without measurably increasing flood stages upstream due to encroachment alone. Filling of these areas and the resulting loss of storage, however, increase flood discharges and flood stages downstream significantly and greatly increase flood damage. Locating Floodway and Floodplain Boundaries on the Ground After the floodway and flood fringe of the floodplain have been determined for a particular study area in a locality, their location will still need to be checked on the ground from time to time, especially when a proposed development is near the regulatory boundaries. By taking accurate determinations in the field, administrative and legal boundary disputes can be avoided or minimized. Figure 5-16 depicts the three ways – field survey, interpolation and scaling – of checking known regulatory lines on the ground. The floodplain boundary can be located by all three methods. In that they utilize flood elevations, a profile of the regulatory flood must be available. Because the floodway boundary is not based on flood elevations, it is necessary to locate the floodway by scaling appropriate distances from a map and measuring the same distances in the field. The floodplain is delineated by the elevation corresponding to the regulatory flood profile. Therefore, the most accurate method for determining the floodplain limit on the ground is by field-survey techniques, locating where the ground elevation corresponds to the regulatory flood elevation. Figure 5-16 provides an illustration. Where elevations are available for streets, railroads, water and sewer lines, the flood elevation from the flood profile can be located on the ground by interpolation from these known points as illustrated is Figure 5-16.4 Approximate floodplain limits can also be determined by scaling, that is, measuring the limits on a large-scale map (such as 1’=200’) and then measuring the same distances in the field. The distances, on the map and in the field, should be tied to the same identifiable physical features such as a wall, fence, road, property line, or building. This is illustrated in Figure 5-16. Coastal Flooding Most coastal floods result from storm surge and wave action caused by coastal storms, usually hurricanes and northeasters. The storms bring very strong winds that “pile” water up against the shore. Air pressure changes add to this change in water level that is called a storm surge (refer to Chapter Two, Coastal Flooding and Erosion). This results in the ocean being higher in some areas than in other areas.
4 “Regulations for Floodplains.”
———Delineating Flood-Prone Areas———
5-26
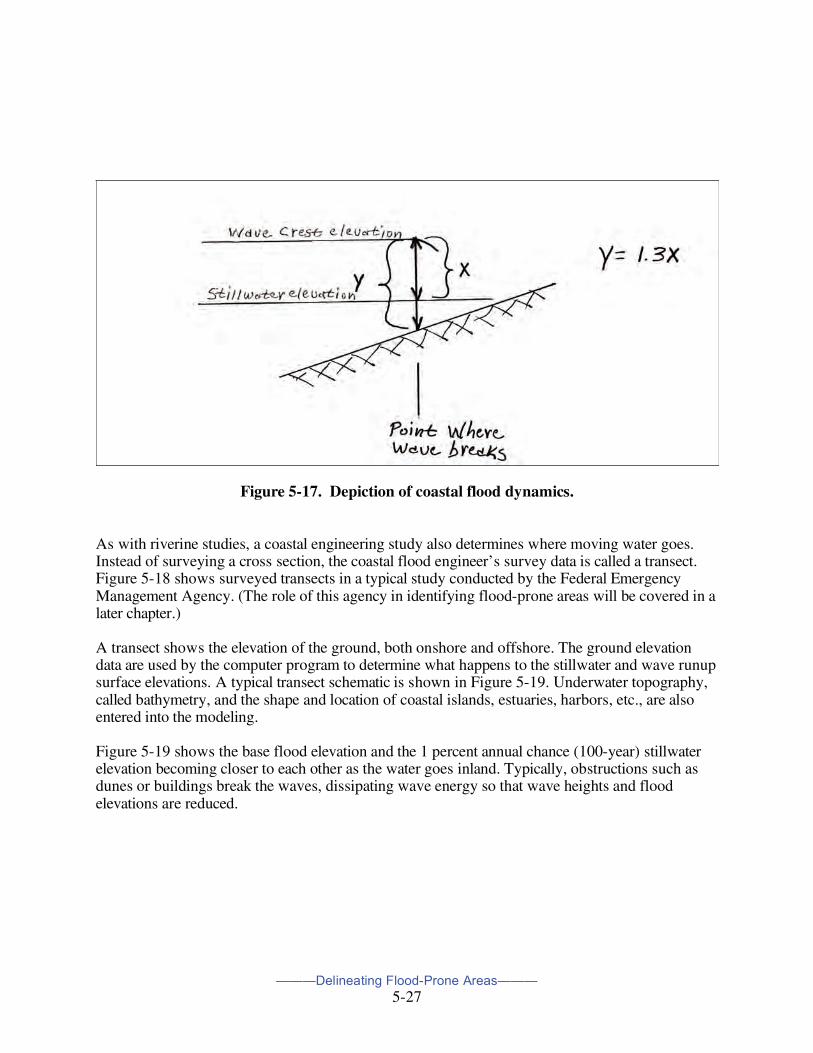
A computer simulation of a coastal storm is developed based on data from past storms and past flood heights. The model typically uses data on wind speeds, wind direction, and air pressure from historical hurricanes. The results are correlated with the odds or chances of whether the ocean will be at high or low tide during the storm. The coastal hydrology computer model program produces stillwater elevations, (i.e., the elevation of various coastal floods, not counting waves). The computer model is checked or “calibrated” by being able to reproduce the historical stillwater elevations. The program extrapolates the desired stillwater elevation from the historical data. In addition to storm surge, wave action is an important aspect of coastal storms. Wind causes waves to push water higher than the stillwater elevation. This is called wave setup. The coastal flood study analyzes how much higher the wave crest elevation will be above the stillwater elevation as water is driven onshore. The term wave envelope is often used in place of wave crest elevation. When waves hit the shoreline and reach a depth equal to about 1.3 times the wave height, the wave breaks. This is illustrated in Figure 5-17. The water is moving with such force that it keeps moving inland. This is called wave runup, i.e., when areas on land above the stillwater elevation are flooded. Wave runup elevations are typically one to two times the height of the wave.
Figure 5-16. How floodplains and floodways are located in the field.5
5 “Regulations for Floodplains” cited earlier.
———Delineating Flood-Prone Areas———
5-27
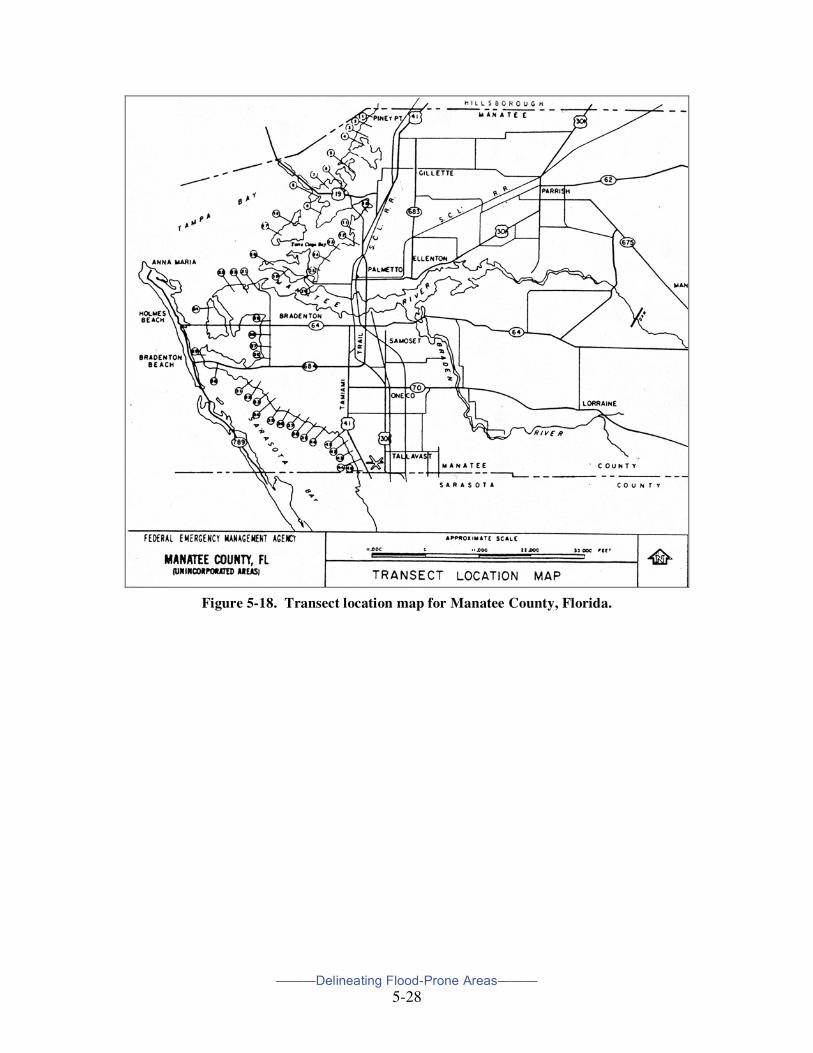
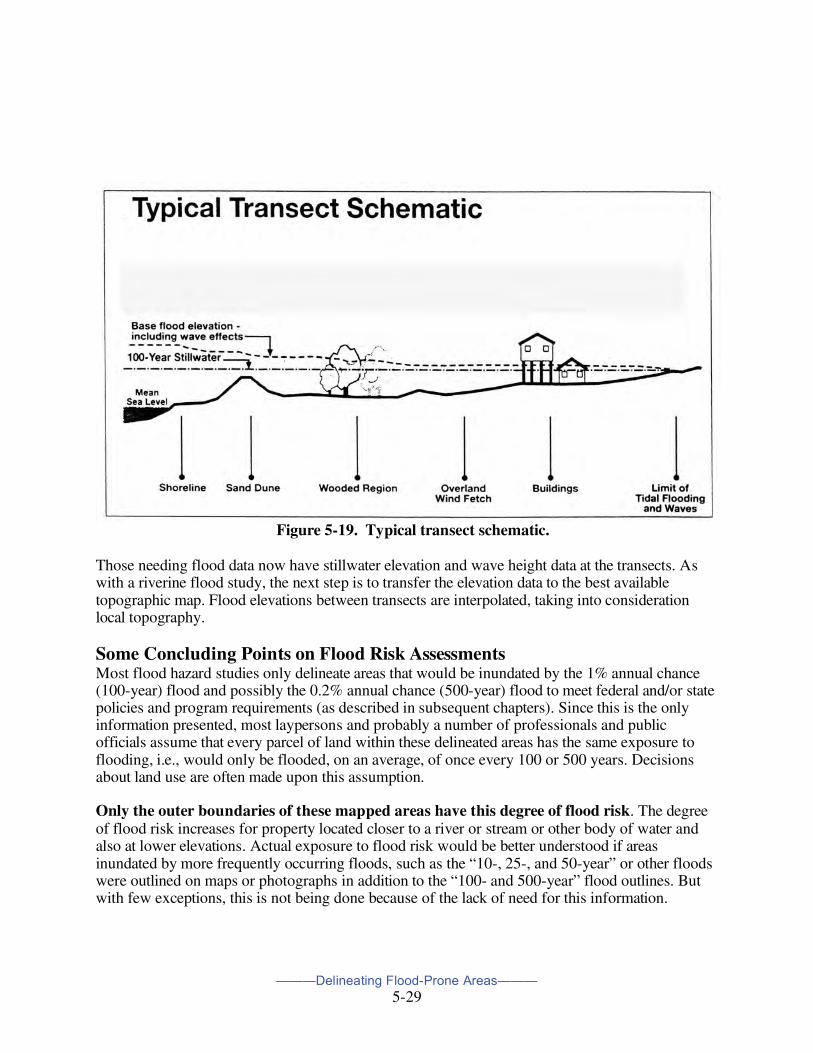
Figure 5-17. Depiction of coastal flood dynamics. As with riverine studies, a coastal engineering study also determines where moving water goes. Instead of surveying a cross section, the coastal flood engineer’s survey data is called a transect. Figure 5-18 shows surveyed transects in a typical study conducted by the Federal Emergency Management Agency. (The role of this agency in identifying flood-prone areas will be covered in a later chapter.) A transect shows the elevation of the ground, both onshore and offshore. The ground elevation data are used by the computer program to determine what happens to the stillwater and wave runup surface elevations. A typical transect schematic is shown in Figure 5-19. Underwater topography, called bathymetry, and the shape and location of coastal islands, estuaries, harbors, etc., are also entered into the modeling. Figure 5-19 shows the base flood elevation and the 1 percent annual chance (100-year) stillwater elevation becoming closer to each other as the water goes inland. Typically, obstructions such as dunes or buildings break the waves, dissipating wave energy so that wave heights and flood elevations are reduced.
———Delineating Flood-Prone Areas———
5-28
Figure 5-18. Transect location map for Manatee County, Florida.
———Delineating Flood-Prone Areas———
5-29
Figure 5-19. Typical transect schematic.
Those needing flood data now have stillwater elevation and wave height data at the transects. As with a riverine flood study, the next step is to transfer the elevation data to the best available topographic map. Flood elevations between transects are interpolated, taking into consideration local topography. Some Concluding Points on Flood Risk Assessments Most flood hazard studies only delineate areas that would be inundated by the 1% annual chance (100-year) flood and possibly the 0.2% annual chance (500-year) flood to meet federal and/or state policies and program requirements (as described in subsequent chapters). Since this is the only information presented, most laypersons and probably a number of professionals and public officials assume that every parcel of land within these delineated areas has the same exposure to flooding, i.e., would only be flooded, on an average, of once every 100 or 500 years. Decisions about land use are often made upon this assumption. Only the outer boundaries of these mapped areas have this degree of flood risk. The degree of flood risk increases for property located closer to a river or stream or other body of water and also at lower elevations. Actual exposure to flood risk would be better understood if areas inundated by more frequently occurring floods, such as the “10-, 25-, and 50-year” or other floods were outlined on maps or photographs in addition to the “100- and 500-year” flood outlines. But with few exceptions, this is not being done because of the lack of need for this information.
———Delineating Flood-Prone Areas———
5-30
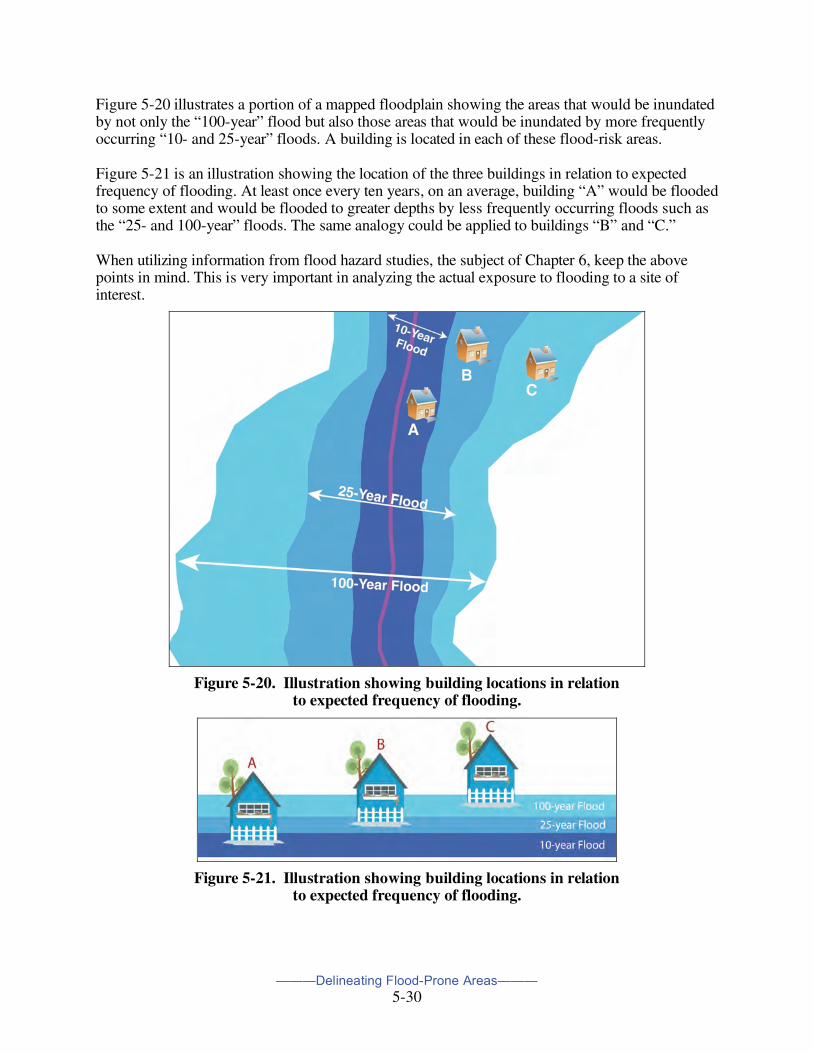
Figure 5-20 illustrates a portion of a mapped floodplain showing the areas that would be inundated by not only the “100-year” flood but also those areas that would be inundated by more frequently occurring “10- and 25-year” floods. A building is located in each of these flood-risk areas. Figure 5-21 is an illustration showing the location of the three buildings in relation to expected frequency of flooding. At least once every ten years, on an average, building “A” would be flooded to some extent and would be flooded to greater depths by less frequently occurring floods such as the “25- and 100-year” floods. The same analogy could be applied to buildings “B” and “C.” When utilizing information from flood hazard studies, the subject of Chapter 6, keep the above points in mind. This is very important in analyzing the actual exposure to flooding to a site of interest.
Figure 5-20. Illustration showing building locations in relation
to expected frequency of flooding.
Figure 5-21. Illustration showing building locations in relation
to expected frequency of flooding.

———Delineating Flood-Prone Areas———
5-31
Chapter Homework Assignment
Any program or measure to reduce flood losses must be established on a sound technical basis. Provide a detailed discussion of this statement based on your readings and the past two lectures on defining the probability of flooding and the delineation of flood hazard areas. Hand-drawn sketches are encouraged to facilitate explanations of the engineering principles involved.