Chapter 5: Ethics and Economic Progress Chapter 5: Ethics ...
Upload
drake-olsenCategory
view
25download
0description

Second Edition
Chapter 5 Chapter 5
Elasticity and Its Elasticity and Its ApplicationsApplications

Elasticity of DemandElasticity of Demand
Elasticity of demand - a measure of how responsive the quantity demanded is to a change in price• more responsive equals more elastic.
The slope of the demand curve is related to the elasticity of demand.
2

Calculating the Elasticity of DemandCalculating the Elasticity of Demand
Elasticity measures the responsiveness of quantity demanded to changes in price.
P%
Q%
pricein change Percentage
demandedquantity in change PercentageE demand of Elasticity
demanded
d
3
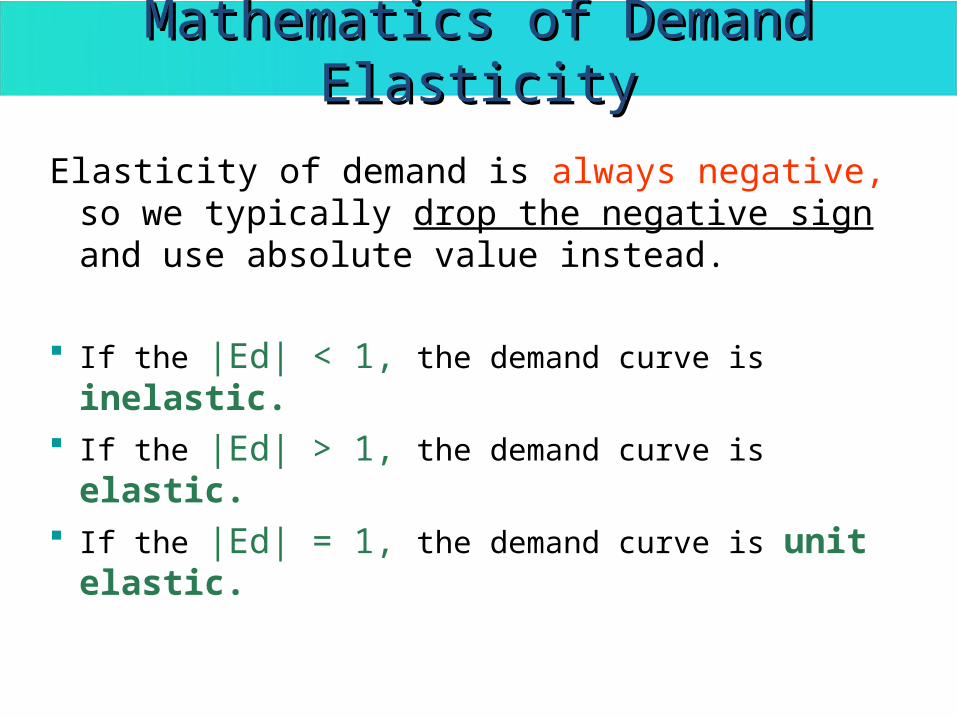
Mathematics of Demand ElasticityMathematics of Demand Elasticity
Elasticity of demand is always negative, so we typically drop the negative sign and use absolute value instead.
If the |Ed| < 1, the demand curve is inelastic. If the |Ed| > 1, the demand curve is elastic. If the |Ed| = 1, the demand curve is unit elastic.

A firm’s revenues are equal to price per unit times quantity sold.• Revenue = Price x Quantity
The elasticity of demand directly influences revenues when the price of the good changes.
Total Revenue and the Elasticity of DemandTotal Revenue and the Elasticity of Demand

Total Revenue and the Elasticity of DemandTotal Revenue and the Elasticity of Demand
Knowing the value of the elasticity allows us to understand what happens to total revenue when the price changes.
If…directions oppositein move TR and PP%Q%1E dd
6
direction samein move TR and PP%Q%1E dd
constant is TRP%Q%1E dd

The Elasticity of SupplyThe Elasticity of Supply
Elasticity of supply – measures how responsive the quantity supplied is to the a change in price.• more responsive equals more elastic.
The slope of the supply curve is related to the elasticity of supply.
7

Calculating the Elasticity of SupplyCalculating the Elasticity of Supply
Measure of the responsiveness of quantity supplied to a change in price
Computed by
P%
Q%
price in change Percentage
suppliedquantity in change PercentageE supply of Elasticity
supplied
s
8
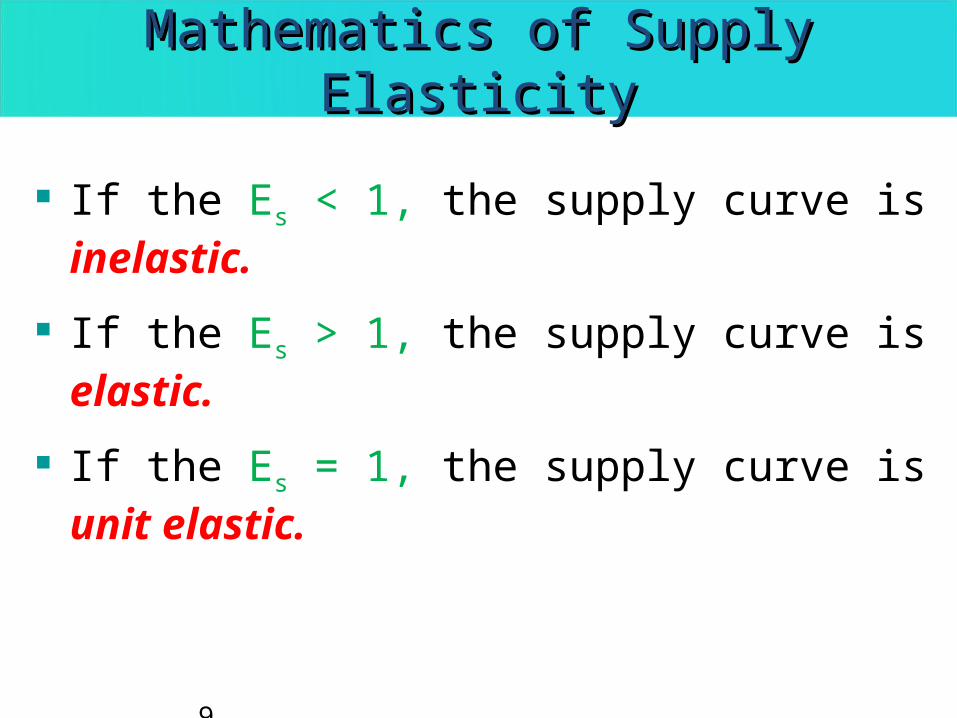
If the Es < 1, the supply curve is inelastic.
If the Es > 1, the supply curve is elastic.
If the Es = 1, the supply curve is unit elastic.
9
Mathematics of Supply ElasticityMathematics of Supply Elasticity

Determinants of the ElasticityDeterminants of the Elasticityof Supplyof Supply
Consider two polar casesPicasso painting Toothpicks
PricePrice
QuantityQuantity
Perfectly elastic supplyPerfectly inelastic supply
10

Second Edition
Chapter 6 Chapter 6
Taxes and SubsidiesTaxes and Subsidies

Commodity TaxesCommodity Taxes
We will emphasize the following:1. Who ultimately pays the tax is not dependent
on who writes the check
2. Who ultimately pays the tax does depend on the relative elasticities of supply and demand.
3. Commodity taxation raises revenue and creates lost gains from trade (deadweight loss)
Let’s look at each of these in turn.12

Using the Tax WedgeUsing the Tax Wedge
Price of Apples (per basket)
Quantity ofApples (baskets)
Supply
$4
3
2
1
500 700 1,250
2.65
1.65
Demand
200
Tax Wedge = $1
Price buyers pay
Price sellersreceive
13

The Burden of the Tax Depends of the The Burden of the Tax Depends of the Elasticities of Supply and DemandElasticities of Supply and Demand
An elastic demand curve means that buyers can substitute
An elastic supply curve means that workers and capital can easily find work in another industry
Result• When demand is more elastic than supply, buyers
pay less of the tax• When supply is more elastic than demand, sellers
pay less of the tax• In other words elasticity = escape
Let’s use the model to show this14

The Burden of the Tax Depends of the The Burden of the Tax Depends of the Elasticities of Supply and DemandElasticities of Supply and Demand
Case I: Demand is more elastic than supplyPrice
Quantity
Supply
DemandTaxWedge
Qno taxQw/tax
Pno tax
Price receivedby sellers
Price paidby buyers
Result:Most of the tax is paidBy sellers
15

The Burden of the Tax Depends of the The Burden of the Tax Depends of the Elasticities of Supply and DemandElasticities of Supply and Demand
Case II: Supply is more elastic than demandPrice
Quantity
Supply
Demand
TaxWedge
Qno taxQw/tax
Pno tax
Price receivedby sellers
Price paidby buyers
Result:Most of the tax is paidBy buyers
16

A Commodity Tax Raises Revenues A Commodity Tax Raises Revenues and Creates Lost Gains From Tradeand Creates Lost Gains From Trade
PricePrice
No Tax With Tax
700700
$2.00$2.00
Consumersurplus
Producersurplus
500
Tax wedge
$2.65
$1.65
Consumer surplus
Producersurplus
Governmentrevenue
Deadweightloss
DD
SS
17
A Commodity Tax Raises Revenues and A Commodity Tax Raises Revenues and Creates Lost Gains From TradeCreates Lost Gains From Trade
Elasticities of demand and supply determine consumer and producer surplus• The greater these elasticities, the greater will
be the deadweight loss
Let’s use our model to show this.
18

Qw/ tax
A Commodity Tax Raises Revenues and A Commodity Tax Raises Revenues and Creates Lost Gains From TradeCreates Lost Gains From Trade
Case I: Elastic Demand
Supply
Price
Quantity
Demand
Pno tax
Pw/tax
Tax wedge
Tax Revenue
Qno tax
Deadweightloss
19

Qw/ tax
A Commodity Tax Raises Revenues and A Commodity Tax Raises Revenues and Creates Lost Gains From TradeCreates Lost Gains From Trade
Case II: Inelastic Demand
Supply
Price
Quantity
Demand
Pno tax
Pw/tax
Tax wedge
Tax Revenue
Qno tax
Deadweightloss
Note: Tax rate and Tax revenue are the same as before.Deadweight loss is much smaller.
20

Tax Revenue
Qw/ tax
A Commodity Tax Raises Revenues and A Commodity Tax Raises Revenues and Creates Lost Gains From TradeCreates Lost Gains From Trade
Case III: Elastic Supply
Supply
Price
Quantity
Demand
Pno tax
Pw/tax
Tax wedge
Qno tax
Deadweightloss
21
Tax Revenue
Qw/ tax
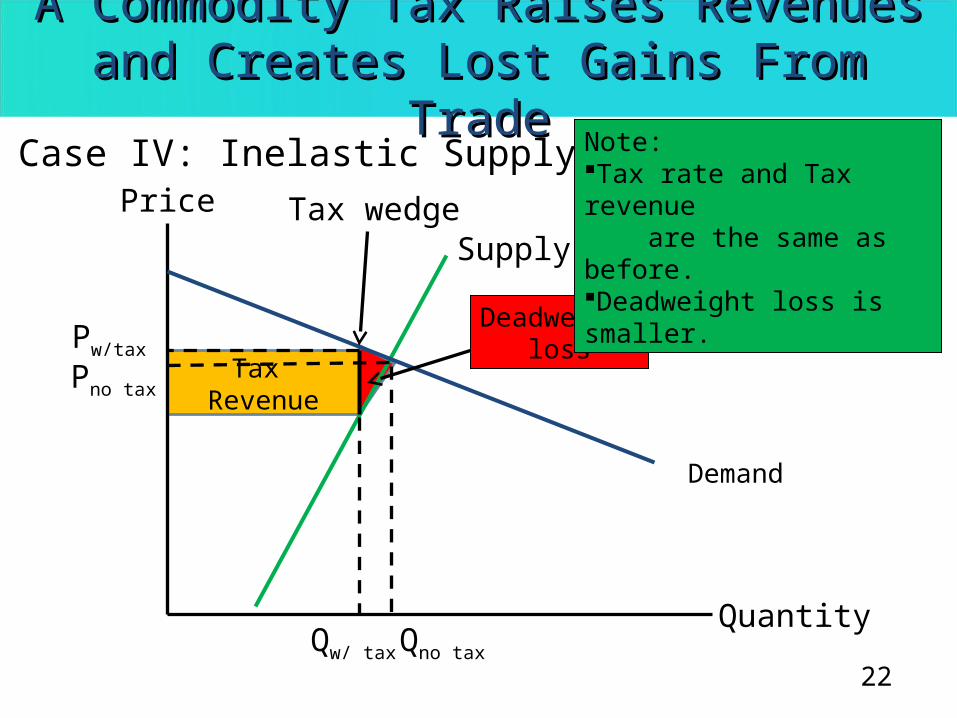
A Commodity Tax Raises Revenues and A Commodity Tax Raises Revenues and Creates Lost Gains From TradeCreates Lost Gains From Trade
Case IV: Inelastic Supply
Supply
Price
Quantity
Demand
Pno tax
Pw/tax
Tax wedge
Qno tax
Deadweightloss
Note: Tax rate and Tax revenue are the same as before.Deadweight loss is smaller.
22

SubsidiesSubsidies
A subsidy is a reverse tax Important facts about commodity subsidies
1. Who gets the subsidy does not depend on who gets the check from the government.
2. Who benefits from the subsidy does depend on the relative elasticities of demand and supply.
3. Subsidies…1. Are paid for by taxpayers2. Result in inefficient increases in trade (deadweight
loss) We can use the same wedge shortcut as
before.Let’s use our model to analyze subsidies.
23

SubsidiesSubsidiesPrice of apples
Per basket
Quantity of apples(baskets)
Demand
Supply
3
$4
2
1
700 900
Price receivedBy sellers = $2.40
Price paidBy buyers = $1.40
Subsidywedge
Deadweightloss
24

Taxes and Subsidies ComparedTaxes and Subsidies Compared
Whoever Bears the Burden of the Tax Receives the Benefits of a Subsidy
Price
Quantity
Supply
Demand
subsidywithQ
Subsidywedge
Taxwedge
Price receivedby sellers
Price paidby buyers
Price paidby buyers
Price receivedby sellers
subsidy notax noP
taxwithQ
subsidy notax noQ
Benefitof subsidyon sellers
Burdenof tax onsellers
25

Wage SubsidiesWage Subsidies
Edmund Phelps – Nobel Prize winner• Wage subsidies can be used to increase
employment of low wage workers.• Although costly, they may reduce
Welfare payments. Crime Drug dependency “Rational defeatism”
• A better alternative to the minimum wage.
Let’s analyze a wage subsidy program.26

Wage SubsidiesWage Subsidies
Wage
Quantityof labor
Demandfor labor
Market wage= $10.50
Supply of Labor
Qm
SubsidyWedge = $4
Qs
Wage received by
workers$12
$8
Wage paidby firms
Cost to taxpayers
27

TakeawayTakeaway
Taxes decrease the quantity traded. Subsidies increase the quantity traded. The burden of the tax and the benefit of the
subsidy do not depend on who sends or receives the government check.
The side of the market that is more elastic will escape more of the tax and receive less of the benefit of the subsidy.
The greater the elasticity of demand or supply the greater will be the deadweight loss.
28

Second Edition
Chapter 8 Chapter 8 Price Ceilings and FloorsPrice Ceilings and Floors

Price CeilingsPrice Ceilings
Price ceiling – a maximum price allowed by law
Five important effects1. Shortages
2. Reductions in product quality
3. Wasteful lines and other search costs
4. A loss in gains from trade
5. A misallocation of resources
Let’s look at each one in turn.30

Price Ceilings Create ShortagesPrice Ceilings Create Shortages
Price of gasolineper gallon
Quantity
Demand
Supply
Market Equilibrium
Controlled Price(ceiling)
Qs Qd
Shortage
31

TotalValue ofWastedtime
Wasteful Lines and Other Search CostsWasteful Lines and Other Search Costs
Quantity
Demand
SupplyMarket Equilibrium
Controlled Price = 1
(ceiling)
Qs Qd
Shortage
Willingness topay for Qs = $3
Price of gasolineper gallon
At the controlled price:Quantity supplied = Qs
Buyers are willing to pay $3/gallonLine will grow until the time cost per gallon $3 - $1 = $2.00/gallon
32

Wasted Time and Other Search CostsWasted Time and Other Search Costs
What’s the difference between paying a bribe and waiting in line?• Waiting in line is more wasteful!
A bribe goes to the station owner. Time waiting in line is lost; it benefits no
one.
33

TotalValue ofWastedtime
Price Ceilings: Reduce Gains From TradePrice Ceilings: Reduce Gains From Trade
Quantity
Demand
Supply
Market Equilibrium
Controlled Price = 1
(ceiling)
Qs Qd
Shortage
$3
Price of gasolineper gallon
Market price
Lostproducersurplus
Lostconsumersurplus
BB
A
A + B = Lost gainsfrom trade
34

Misallocation of ResourcesMisallocation of Resources
Quantity
Demand
Supply
Controlled Price
(ceiling)
Qs Qd
Shortage
$3
Price($)
Highest-valueduses
Lower-valueduses
Least-valueduses
Price control prevents highest valued usesfrom outbidding lower valued uses.Result: some oil flows to lower valued uses
35

Price FloorsPrice Floors
Price floor – a minimum price allowed by law
Price floors create:1. Surpluses
2. Lost gains from trade (deadweight loss)
3. Wasteful increases in quality
4. A misallocation of resources
36

SurplusesSurpluses
A good example of a price floor is the minimum wage
Workers with very low productivity are most affected by the minimum wage.• Least experienced• Least educated or trained
Low-skilled teenagers are most affected.
Let’s use the labor market model to analyze the minimum wage.
37

Minimum Wage Creates a SurplusMinimum Wage Creates a Surplus
Demand for labor
Supply of labor
Marketwage
Wage($/hr)
Quantityof labor(unskilled)
Market employment
Minimumwage
QsQd
Labor surplus(unemployment)
38

Minimum Wage Creates Lost Gains From Minimum Wage Creates Lost Gains From TradeTrade
Demand for labor
Supply of labor
Marketwage
Wage($/hr)
Quantityof labor(unskilled)
Market employment
Minimumwage
QsQd
Labor surplus(unemployment)
Lost gains from trade(deadweight loss) = lost consumer surplus + lost producer surplus
39

Minimum WageMinimum Wage
Hotly debated in the U.S. • 93.9% of workers < 25 years earn more than
the minimum wage• At best, the minimum wage raises the wages
of some teenagers and young workers whose wages would have increased anyway as they became more skilled.
• At worst, increases in the price of hamburgers can create some teenage unemployment.
40

TakeawayTakeaway
You should be able to explain the effects of price ceilings to your uncle.
You should be able to draw a diagram showing the price ceiling, label the shortage, wasteful losses, and the lost gains from trade.
You should understand why a price ceiling reduces product quality and misallocates resources.
You should be able to a similar analysis for price floors.
41

Second Edition
End of Chapter 8End of Chapter 8