CHAPTER 15books.mhprofessional.com/downloads/products/0072133783/00721… · 490 Oracle...
22
CHAPTER 15 Trend Analysis with STATSPACK
Transcript of CHAPTER 15books.mhprofessional.com/downloads/products/0072133783/00721… · 490 Oracle...

ORACLE Series / Oracle High-Performance Tuning with STATSPACK / Burleson / 3378-3 / Chapter 15Blind Folio 15:489
CHAPTER15
Trend Analysiswith STATSPACK
P:\010Comp\Oracle8\378-3\ch15.vpThursday, March 29, 2001 2:07:15 PM
Color profile: Generic CMYK printer profileComposite Default screen

490 Oracle High-Performance Tuning with STATSPACK
ORACLE Series / Oracle High-Performance Tuning with STATSPACK / Burleson / 3378-3 / Chapter 15Blind Folio 15:490
The final chapter in this book is dedicated to the use of STATSPACKinformation for trend analysis. Because STATSPACK can store dataover long time periods, it is easy to extract trend information. Thislong-term trend data can be plotted and forecasts can be made offuture values based on the historical data.
The forecasting techniques can be as simple as a linear regression or assophisticated as a double-exponential or Gaussian smoothing forecast. Thepoint is that STATSPACK data can be easily graphed to predict future valuesof database metrics. When creating a forecast, we take existing values from theSTATSPACK history and use them to predict a value at a future point in time.
This predictive ability is very useful for any DBA or manager who needs to acquireadditional hardware resources such as RAM memory, and a disk of CPU resources.
We will begin this chapter with a discussion on using MS-Excel for plottingSTATSPACK data and then move on to look at a wealth of scripts that can be usedfor trend analysis and forecasting.
Plotting STATSPACK DataUsing MS-ExcelOnce you have implemented hourly STATSPACK collection, you will developa great historical database for detailed analysis. In addition to the alerts that wecovered in Chapter 14, you can also run STATSPACK reports to provide capacityplanning and trend analysis. This can then incorporate linear regression and predictivemodels so the DBA can predict when to order more disks, RAM memory, and CPU,based on prior consumption rates.
Fortunately, it is not necessary that you purchase an expensive statistical packagesuch as SAS and SPSS. You can use standard Microsoft Excel spreadsheets with chartwizards to make acceptable charts and add forecasts. Let’s see how this works.
Plotting STATSPACK Datawith a Spreadsheet Chart WizardWhile many third-party products are capable of plotting data for graphical analysis,adequate graphics can be created using Microsoft Excel spreadsheets. The steps forcreating the chart are as follows:
1. Run the query in SQL*Plus against the STATSPACK data.
2. Cut and paste the result into the spreadsheet.
P:\010Comp\Oracle8\378-3\ch15.vpThursday, March 29, 2001 2:07:16 PM
Color profile: Generic CMYK printer profileComposite Default screen

Chapter 15: Trend Analysis with STATSPACK 491
ORACLE Series / Oracle High-Performance Tuning with STATSPACK / Burleson / 3378-3 / Chapter 15Blind Folio 15:491
3. In MS-Excel, with the data you have just pasted highlighted, choose Datafrom the drop-down menu and then Text To Columns. This will separatethe columns into distinct cells.
4. Press the Chart Wizard button and create a line chart.
5. Choose Chart | Add Trendline to create a forecast line.
To give a simple example, let’s take a simple STATSPACK data extract and plot itusing the Chart Wizard in MS-Excel. Let’s perform an actual analysis and see thesteps firsthand. We’ll assume that our CIO just contacted us and he or she wantsto know the rate of increase in disk read activity for the entire database. The CIOknows that this is not an easy question to answer and gives us two days to assembleand plot the disk read information. Because we know STATSPACK, we know thatwe can collect and plot this information from the stats$sysstat table in a matter ofa few minutes.
Here is a step-by-step description of the process of getting a forecast fromSTATSPACK data.
Step 1: Customize the STATSPACK ReportWe begin by selecting rpt_io.sql, which displays hourly physical read and writestatistics for the whole database. Because this script reports on each hourly snapshot,we modify the script to compute the average read and writes per day. Note that wehave changed the data format string and added the avg function to the code.
rpt_io.sql
set pages 9999;
column reads format 999,999,999column writes format 999,999,999
selectto_char(snap_time,'yyyy-mm-dd'),avg(newreads.value-oldreads.value) reads,avg(newwrites.value-oldwrites.value) writes
fromperfstat.stats$sysstat oldreads,perfstat.stats$sysstat newreads,perfstat.stats$sysstat oldwrites,perfstat.stats$sysstat newwrites,perfstat.stats$snapshot sn
where
P:\010Comp\Oracle8\378-3\ch15.vpThursday, March 29, 2001 2:07:16 PM
Color profile: Generic CMYK printer profileComposite Default screen

newreads.snap_id = sn.snap_idand
newwrites.snap_id = sn.snap_idand
oldreads.snap_id = sn.snap_id-1and
oldwrites.snap_id = sn.snap_id-1and
oldreads.statistic# = 40and
newreads.statistic# = 40and
oldwrites.statistic# = 41and
newwrites.statistic# = 41and
(newreads.value-oldreads.value) > 0and
(newwrites.value-oldwrites.value) > 0group by
to_char(snap_time,'yyyy-mm-dd');
Computing Averages with STATSPACK ScriptsThere is often confusion about the proper way to compute average values inSTATSPACK queries. For example, the preceding query must subtract the endingsnapshot value from the starting snapshot value in order to get the number of readsduring the one-hour period between snapshots. When we want to get the averagereads per day, we have two options:
selectto_char(snap_time,'yyyy-mm-dd'),avg(newreads.value)-avg(oldreads.value),avg(newreads.value-oldreads.value)
In this snippet we see two methods for computing the average physical reads perday. As it turns out, these variations in computation return identical results:
TO_CHAR(SN READS READS---------- ------------ ------------2000-12-12 193 1932000-12-13 37 372000-12-14 63 632000-12-15 100 1002000-12-16 163 1632000-12-17 165 165
492 Oracle High-Performance Tuning with STATSPACK
ORACLE Series / Oracle High-Performance Tuning with STATSPACK / Burleson / 3378-3 / Chapter 15Blind Folio 15:492
P:\010Comp\Oracle8\378-3\ch15.vpThursday, March 29, 2001 2:07:17 PM
Color profile: Generic CMYK printer profileComposite Default screen

Step 2: Run the Report in SQL*PlusNow that we have modified the script to compute daily averages, we enterSQL*Plus and run the report:
>sqlplus perfstat/perfstat
SQL*Plus: Release 8.1.6.0.0 - Production on Mon Feb 5 08:21:56 2001
(c) Copyright 1999 Oracle Corporation. All rights reserved.
Connected to:Oracle8i Enterprise Edition Release 8.1.6.1.0 - 64bit ProductionWith the Partitioning optionJServer Release 8.1.6.1.0 - 64bit Production
SQL> @rpt_io
The report is now displayed on our screen. Now we are ready to highlight andextract the data to place it in a spreadsheet.
Step 3: Highlight and Copy the ResultsThe first step is to highlight the data and choose Edit | Copy from the Windowstoolbar (see Figure 15-1).
Chapter 15: Trend Analysis with STATSPACK 493
ORACLE Series / Oracle High-Performance Tuning with STATSPACK / Burleson / 3378-3 / Chapter 15Blind Folio 15:493
FIGURE 15-1. Copying data from SQL*Plus
P:\010Comp\Oracle8\378-3\ch15.vpThursday, March 29, 2001 2:07:18 PM
Color profile: Generic CMYK printer profileComposite Default screen

Step 4: Open MS-Excel and Paste the DataIn this step, we start Excel, open a spreadsheet, and paste our STATSPACK data intothe spreadsheet using Edit | à Paste (or CTRL-V). Note that all of the data still residesin a single column (see Figure 15-2).
Now we need to separate our data into columns in the spreadsheet.
Step 5: Partition the Data into ColumnsWith our data column highlighted, choose Data from the drop-down menu and
then Text to Columns (see Figure 15-3).We are now guided through a wizard to column delimit the values.
Step 6: Column Delimit the DataNext, we choose “Fixed width” in the Text to Columns Wizard (see Figure 15-4).
We then accept the defaults for each wizard step and the data will be placedinto separate columns.
494 Oracle High-Performance Tuning with STATSPACK
ORACLE Series / Oracle High-Performance Tuning with STATSPACK / Burleson / 3378-3 / Chapter 15Blind Folio 15:494
FIGURE 15-2. Pasting data into a spreadsheet
P:\010Comp\Oracle8\378-3\ch15.vpThursday, March 29, 2001 2:07:19 PM
Color profile: Generic CMYK printer profileComposite Default screen

Chapter 15: Trend Analysis with STATSPACK 495
ORACLE Series / Oracle High-Performance Tuning with STATSPACK / Burleson / 3378-3 / Chapter 15Blind Folio 15:495
FIGURE 15-3. Choosing Data | Text to Columns
FIGURE 15-4. Choosing fixed-width column separation
P:\010Comp\Oracle8\378-3\ch15.vpThursday, March 29, 2001 2:07:20 PM
Color profile: Generic CMYK printer profileComposite Default screen

Step 7: Start the Chart WizardIn the next step, we highlight the physical reads and press the Chart Wizard button(see Figure 15-5).
Here we see a wizard that will guide us through the process of creating a graphof our STATSPACK data.
Step 8: Choose a Line ChartNext, we choose a simple line chart (see Figure 15-6).
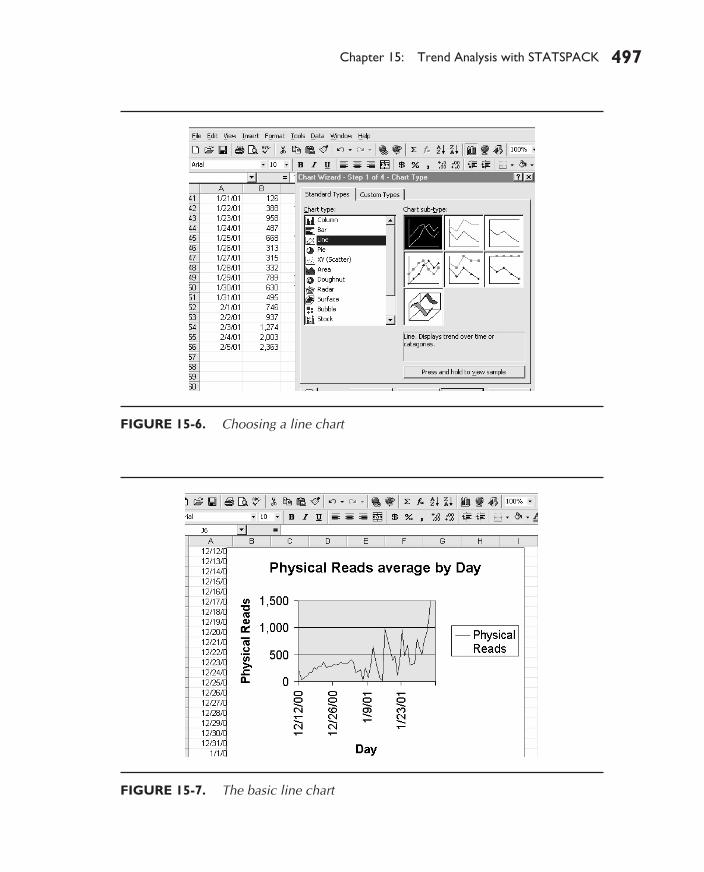
Step 9: Complete the Chart Wizardand View the ChartNow we finish the Chart Wizard by accepting the defaults, and we get a basic chart(see Figure 15-7).
496 Oracle High-Performance Tuning with STATSPACK
ORACLE Series / Oracle High-Performance Tuning with STATSPACK / Burleson / 3378-3 / Chapter 15Blind Folio 15:496
FIGURE 15-5. Choosing the Chart Wizard
P:\010Comp\Oracle8\378-3\ch15.vpThursday, March 29, 2001 2:07:21 PM
Color profile: Generic CMYK printer profileComposite Default screen
Chapter 15: Trend Analysis with STATSPACK 497
ORACLE Series / Oracle High-Performance Tuning with STATSPACK / Burleson / 3378-3 / Chapter 15Blind Folio 15:497
FIGURE 15-6. Choosing a line chart
FIGURE 15-7. The basic line chart
P:\010Comp\Oracle8\378-3\ch15.vpThursday, March 29, 2001 2:07:22 PM
Color profile: Generic CMYK printer profileComposite Default screen

Step 10: Add a Trend LineFinally, we choose Chart | Add Trendline from MS-Excel to add a forecast line.
At this step you are faced with a choice of linear regression techniques, includingsum of the least squared, single, double, and triple exponential smoothing methods.In most cases, you will get the most accurate trend line by choosing the default lineartrend method. Finally, we display the trend line and the forecast is ready to sendto management.
Figure 15-8 shows our completed forecast, ready for management.Most DBAs will paste the chart in a MS-Word document along with an analysis
of the data.
498 Oracle High-Performance Tuning with STATSPACK
ORACLE Series / Oracle High-Performance Tuning with STATSPACK / Burleson / 3378-3 / Chapter 15Blind Folio 15:498
FIGURE 15-8. A completed STATSPACK chart with a forecast trend line
P:\010Comp\Oracle8\378-3\ch15.vpThursday, March 29, 2001 2:07:23 PM
Color profile: Generic CMYK printer profileComposite Default screen

Now that we see how to create graphics from our STATSPACK data, let’s look atother STATSPACK reports that are useful for forecasting and trend analysis.
STATSPACK Reports for ForecastingThe standard STATSPACK collection mechanism has a host of great information fortrend analysis. The scripts I have placed on the companion Web site for this bookcontain prewritten STATSPACK extract scripts.
There are three types of scripts:
■ Long-term trend extract scripts These simply display the hourlyobservations for the desired metric.
■ Averages by hour of the day These reports show averages aggregated bythe hour of the day. These scripts are in the form rpt_avg_xxx_hr.sql and arevery useful for identifying regular trends in hourly processing.
■ Averages by day of the week These reports show averages aggregatedby day of the week. They are in the form rpt_avg_xxx_dy.sql and reporton regular trends in daily processing.
Basic STATSPACK Metrics for Trend AnalysisThe following STATSPACK data are especially interesting for trend analysis:
■ Physical reads and physical writes (rpt_io.sql, rpt_avg_io_dy.sql,rpt_avg_io_hr.sql) These reports are great for showing trends in the physicalread and write activity within Oracle. Note that an Oracle physical readis not necessarily an actual disk read because of the RAM caches on mostdisk arrays.
■ Data buffer hit ratio (rpt_bhr.sql, rpt_avg_bhr_hr.sql, rpt_avg_bhr_dy.sql)Plotting the data buffer hit ratio over time can give the DBA great insight intotimes when the database I/O patterns are changing. Especially useful are theaverage data buffer hit ratios by hour of the day and day of the week. Thesewill often show theretofore hidden patterns in buffer processing.
■ I/O waits (rpt_io_wait.sql, rpt_avg_io_wait_hr.sql, rpt_avg_io_wait_dy.sql)The I/O wait report is useful for showing times when the database was forcedto wait for a latch before granting access to an Oracle datafile.
■ Chained row fetches (rpt_chain.sql, rpt_avg_chain_dy.sql,rpt_avg_chain_hr.sql) Tracking the fetching of continued rows can helpthe DBA decide the optimal time to reorganize the database.
Chapter 15: Trend Analysis with STATSPACK 499
ORACLE Series / Oracle High-Performance Tuning with STATSPACK / Burleson / 3378-3 / Chapter 15Blind Folio 15:499
P:\010Comp\Oracle8\378-3\ch15.vpThursday, March 29, 2001 2:07:24 PM
Color profile: Generic CMYK printer profileComposite Default screen

500 Oracle High-Performance Tuning with STATSPACK
ORACLE Series / Oracle High-Performance Tuning with STATSPACK / Burleson / 3378-3 / Chapter 15Blind Folio 15:500
■ Full table scans (rpt_fts.sql, rpt_avg_fts_dy.sql, rpt_avg_fts_hr.sql)Tracking full table scans can help the DBA understand those time periodswhen large aggregation or summarization queries are being run. On poorlytuned databases, this metric will tell the DBA when to explain the SQL instats$sql_summary for SQL tuning.
■ Cumulative logons (rpt_logon.sql, rpt_avg_logon_dy.sql,rpt_avg_logon_hr.sql) This report tracks changes in the cumulative logonsstatistic in stats$sesstat. For lone databases, the hourly and daily averagereports can show when the end-user community is most active.
■ Sorting activity (rpt_sorts.sql, rpt_avg_sort_dy.sql, rpt_avg_sort_hr.sql)Tracking disk sorts is essential in setting the appropriate value forsort_area_size. If the disk sorts are too high, increasing sort_area_sizecan greatly improve the performance of sorting tasks.
STATSPACK Extensionsfor Database Server Trend AnalysisIf you implement the STATSPACK extensions for server statistics (see Chapter 5),you also have scripts to track the following server metrics. The scripts are calledrpt_vmstat.sql, rpt_vmstat_dy.sql, and rpt_vmstat_hr.sql. These scripts allow youto choose the metric that you are interested in tracking.
NOTEThis script requires you to specify the name of theserver. Since the stats$vmstat table collects datafrom the database server and the Web servers, youneed to filter the report for the server you areinterested in getting a trend analysis for.
The database server and Web server reports are especially useful for hardwaretrend analysis. These metrics include the following.
■ Run queue trends The CPU run queue is a great way to measure the loadaverage for the CPU. This data is great for load balancing and forecastingwhen to add more CPUs.
■ Page-in trends Any time of nonzero page-in activity indicates a shortageof RAM memory. These reports can forecast when the server will exceedRAM capacity.
■ CPU trends Plotting the average user CPU plus system CPU values cantell the DBA the times when the server is overloaded.
P:\010Comp\Oracle8\378-3\ch15.vpThursday, March 29, 2001 2:07:24 PM
Color profile: Generic CMYK printer profileComposite Default screen

Chapter 15: Trend Analysis with STATSPACK 501
ORACLE Series / Oracle High-Performance Tuning with STATSPACK / Burleson / 3378-3 / Chapter 15Blind Folio 15:501
Let’s start by examining the generic STATSPACK script and see how it is usedto track CPU usage. In the next example, we choose to track the average user CPUplus system CPU values.
rpt_vmstat.sql
connect perfstat/perfstat;set pages 9999;
set feedback off;set verify off;
column my_date heading 'date' format a20column c2 heading runq format 999column c3 heading pg_in format 999column c4 heading pg_ot format 999column c5 heading usr format 999column c6 heading sys format 999column c7 heading idl format 999column c8 heading wt format 999
selectto_char(start_date,'yyyy-mm-dd') my_date,
-- avg(runque_waits) c2-- avg(page_in) c3,-- avg(page_out) c4,avg(user_cpu + system_cpu) c5,-- avg(system_cpu) c6,-- avg(idle_cpu) c7,avg(wait_cpu) c8from
stats$vmstatwhere
server_name = 'prodb1'group BY
to_char(start_date,'yyyy-mm-dd')order by
to_char(start_date,'yyyy-mm-dd');
The following data was generated from running this script:
2000-12-20 6 02000-12-21 6 02000-12-22 4 02000-12-23 6 0
P:\010Comp\Oracle8\378-3\ch15.vpThursday, March 29, 2001 2:07:25 PM
Color profile: Generic CMYK printer profileComposite Default screen

502 Oracle High-Performance Tuning with STATSPACK
ORACLE Series / Oracle High-Performance Tuning with STATSPACK / Burleson / 3378-3 / Chapter 15Blind Folio 15:502
2000-12-24 4 02000-12-25 7 02000-12-26 4 02000-12-27 4 02000-12-28 5 02000-12-29 5 02000-12-30 4 02000-12-31 4 02001-01-01 3 02001-01-02 4 02001-01-03 24 02001-01-04 33 02001-01-05 23 02001-01-06 14 02001-01-07 13 02001-01-08 19 02001-01-09 22 02001-01-10 21 02001-01-11 13 02001-01-12 13 02001-01-13 10 02001-01-14 9 02001-01-15 21 02001-01-16 20 02001-01-17 32 02001-01-18 25 02001-01-19 27 02001-01-20 24 02001-01-21 24 02001-01-22 40 02001-01-23 27 02001-01-24 25 02001-01-25 23 02001-01-26 21 02001-01-27 18 02001-01-28 20 02001-01-29 40 02001-01-30 29 02001-01-31 21 02001-02-01 30 02001-02-02 33 02001-02-03 25 02001-02-04 17 02001-02-05 27 0
P:\010Comp\Oracle8\378-3\ch15.vpThursday, March 29, 2001 2:07:25 PM
Color profile: Generic CMYK printer profileComposite Default screen

Chapter 15: Trend Analysis with STATSPACK 503
ORACLE Series / Oracle High-Performance Tuning with STATSPACK / Burleson / 3378-3 / Chapter 15Blind Folio 15:503
As is, this data is not particularly meaningful, but when plotted, we see a cleartrend, as shown in Figure 15-9).
Here we see that the average CPU usage is increasing at a rate of 20 percent permonth. At existing rates, the CPU subsystem will reach the maximum capacity infive months. This information can be critical to top IS management who must planfor computer hardware upgrades.
We can quickly modify this script to display page-in values, and we see that thisdatabase server is in need of additional RAM. Remember, any nonzero values forRAM page-in indicate that the RAM capacity has been exceeded (see Figure 15-10).
Now, let’s look at tracking server trends by hour of the day and day of the week.
Checking Server Trends by HourReturning to our basic script, we can easily modify it to capture CPU usage,averaged by hour of the day. Note that all we need to do is to change the dateformat mask from ‘yyyy-mm-dd’ to ‘HH24’.
FIGURE 15-9. A plot of CPU usage over time
P:\010Comp\Oracle8\378-3\ch15.vpThursday, March 29, 2001 2:07:26 PM
Color profile: Generic CMYK printer profileComposite Default screen

504 Oracle High-Performance Tuning with STATSPACK
ORACLE Series / Oracle High-Performance Tuning with STATSPACK / Burleson / 3378-3 / Chapter 15Blind Folio 15:504
rpt_vmstat_hr.sql
connect perfstat/perfstat;set pages 9999;
set feedback off;set verify off;
column my_date heading 'date' format a20column c2 heading runq format 999column c3 heading pg_in format 999column c4 heading pg_ot format 999column c5 heading usr format 999column c6 heading sys format 999column c7 heading idl format 999column c8 heading wt format 999
selectto_char(start_date,'HH24') my_date,
-- avg(runque_waits) c2
FIGURE 15-10. A plot of RAM page-in
P:\010Comp\Oracle8\378-3\ch15.vpThursday, March 29, 2001 2:07:27 PM
Color profile: Generic CMYK printer profileComposite Default screen

-- avg(page_in) c3-- avg(page_out) c4,avg(user_cpu + system_cpu) c5-- avg(system_cpu) c6,-- avg(idle_cpu) c7,-- avg(wait_cpu) c8from
stats$vmstatgroup BY
to_char(start_date,'HH24')order by
to_char(start_date,'HH24');
Now, when we run this script, we get the average CPU usage data:
date usr-------------------- ----00 1501 1302 1303 1604 1505 1406 1307 1408 1709 2010 2111 2112 3113 3414 3715 3416 2117 2118 2219 2120 1921 1822 1623 15
When we plot this data, we clearly see the server gets very busy each day at noonand continues until 3:00 P.M. (see Figure 15-11).
Next, let’s modify the script and see trends by day of the week.
Chapter 15: Trend Analysis with STATSPACK 505
ORACLE Series / Oracle High-Performance Tuning with STATSPACK / Burleson / 3378-3 / Chapter 15Blind Folio 15:505
P:\010Comp\Oracle8\378-3\ch15.vpThursday, March 29, 2001 2:07:27 PM
Color profile: Generic CMYK printer profileComposite Default screen

Plotting Server Statistics by Day of the WeekNext, we change the dat string from ‘HH24’ to ‘day’. This will aggregate the statisticsby day of the week. When we run the script, we see the average CPU by day ofthe week.
date usr-------------------- ----friday 18monday 53saturday 14sunday 14thursday 20tuesday 55wednesday 20
When we plot this data, we see that Monday and Tuesday are the busiest processingdays of the week (see Figure 15-12).
506 Oracle High-Performance Tuning with STATSPACK
ORACLE Series / Oracle High-Performance Tuning with STATSPACK / Burleson / 3378-3 / Chapter 15Blind Folio 15:506
FIGURE 15-11. A plot of CPU usage by hour of the day
P:\010Comp\Oracle8\378-3\ch15.vpThursday, March 29, 2001 2:07:28 PM
Color profile: Generic CMYK printer profileComposite Default screen

Chapter 15: Trend Analysis with STATSPACK 507
ORACLE Series / Oracle High-Performance Tuning with STATSPACK / Burleson / 3378-3 / Chapter 15Blind Folio 15:507
Web-Based Plottingof STATSPACK DataThere are several freeware and shareware tools available on the Internet to performgraphical plotting of STATSPACK data. There are dozens of freeware and sharewareproducts on the Internet that can be used to plot STATSPACK data, but we will focuson the most popular tools.
The RRDtool ProductThe most popular Web graphing tool is the RRDtool product, which was formerlythe graphing and logging component of the MRTG product. It is a GPLed freesoftware product written by the famous Swiss computer scientist Tobi Oetiker.
RRD is the acronym for the round robin database. The RRD system is designedto store and display any form of time-series data such as server, network, andSTATSPACK metrics. Extracts can be written to load RRD with STATSPACK datafrom the Oracle database and the data can then be used to generate trend analysisgraphs in GIF format.
The RRDtool product can be downloaded from the following Web site:
http://ee-staff.ethz.ch/~oetiker/webtools/rrdtool/
FIGURE 15-12. A plot of CPU % by day of the week
P:\010Comp\Oracle8\378-3\ch15.vpThursday, March 29, 2001 2:07:28 PM
Color profile: Generic CMYK printer profileComposite Default screen

508 Oracle High-Performance Tuning with STATSPACK
ORACLE Series / Oracle High-Performance Tuning with STATSPACK / Burleson / 3378-3 / Chapter 15Blind Folio 15:508
RRDtool is very flexible, and is generally used by large Oracle sites to displayOracle, server, and network performance data in Web pages. At the simplest level,RRDtool accepts data sets and creates GIF files that can then be embedded intoHTML pages. Figure 15-13 shows an example of a GIF file generated by RRDtool.
Other Web-Based Graphing ToolsThere are dozens of interactive Web sites that can be used to generate a plot ofSTATSPACK data. As a representative sample, let’s look at the facility offered atthe University of New South Wales in Sidney, Australia. Here is a link to theirinteractive data plotting Web site:
http://www.phys.unsw.edu.au/3rdyearlab/graphing/graph.html
This Web site accepts data points and creates the appropriate graph based uponyour inputs. In the following example, we paste in our STATSPACK data for averageCPU usage by hour of the day. As shown in Figure 15-14, we choose a Gaussian fittechnique that gives a smooth curve for the average CPU usage.
Next we see the plot for the data (see Figure 15-15). This is presented as a GIFimage (General Interchange Format) within the Web page.
To capture this GIF file for inclusion in an HTML page or an MS-Word document,you can simply right-click the image and save it to a local file on your PC (seeFigure 15-16).
FIGURE 15-13. An example GIF file created by RRDtool
P:\010Comp\Oracle8\378-3\ch15.vpThursday, March 29, 2001 2:07:29 PM
Color profile: Generic CMYK printer profileComposite Default screen

Chapter 15: Trend Analysis with STATSPACK 509
ORACLE Series / Oracle High-Performance Tuning with STATSPACK / Burleson / 3378-3 / Chapter 15Blind Folio 15:509
FIGURE 15-14. An example of an Internet-based plotting utility
FIGURE 15-15. A Web-based plot of average CPU percentage
P:\010Comp\Oracle8\378-3\ch15.vpThursday, March 29, 2001 2:07:31 PM
Color profile: Generic CMYK printer profileComposite Default screen

To summarize, there are a wealth of graphics tools that can be used to plotSTATSPACK data and present it in meaningful formats. Regardless of the methodyou choose, presenting long-term trends with STATSPACK can provide managementwith critical strategic planning information.
ConclusionThis chapter has provided a basic starting point for the DBA to extract STATSPACKand plot the data for forecasting purposes. The material in this chapter is intendedto give you the general idea of how to present forecasts, but there are far moresophisticated analyses that can be done with the wealth of statistics inside theSTATSPACK tables.
As a working DBA who specializes in tuning, I am always excited to hearwhen a reader has developed a new script or STATSPACK technique. Please feelfree to e-mail me if you have any new material to share. My e-mail address [email protected].
I wrote this book because there is a huge amount of benefit to using STATSPACKin tuning your database. It is my hope that the material presented in this book hasassisted you in your tuning endeavors.
510 Oracle High-Performance Tuning with STATSPACK
ORACLE Series / Oracle High-Performance Tuning with STATSPACK / Burleson / 3378-3 / Chapter 15Blind Folio 15:510
FIGURE 15-16. Capturing a Web image to a PC file
P:\010Comp\Oracle8\378-3\ch15.vpThursday, March 29, 2001 2:07:32 PM
Color profile: Generic CMYK printer profileComposite Default screen