Chapter 4: The Average and the Standard Deviation
59
Transcript of Chapter 4: The Average and the Standard Deviation

Chapter 4: The Average and the Standard Deviation
Marius Ionescu
09/06/2011 and 09/08/2011
Marius Ionescu Chapter 4: The Average and the Standard Deviation
Center and spread of a histogram
Fact
A histogram can be used to summarize large amounts of data
Often the histogram is summarized by two numbers: the
center and the spread
The center represents the �level� or �position� of the
distribution
The spread represents the variation within population
However, things do not always work so well
Marius Ionescu Chapter 4: The Average and the Standard Deviation

Measures of the centers
De�nition
The average is the sum of all values divided by the number ofvalues
The median: the value with 50% of the values higher and50% lower
Marius Ionescu Chapter 4: The Average and the Standard Deviation

Measures of the centers
De�nition
The average is the sum of all values divided by the number ofvalues
The median: the value with 50% of the values higher and50% lower
Marius Ionescu Chapter 4: The Average and the Standard Deviation
Measures of the centers
De�nition
The average is the sum of all values divided by the number ofvalues
The median: the value with 50% of the values higher and50% lower
Marius Ionescu Chapter 4: The Average and the Standard Deviation

Average
Example
Find the average
1, 1, 1, 1, 2, 2, 2, 2, 15
1, 1, 1, 1, 2, 2, 2, 2 ,3 ,3, 4
Add 5 to the last example and �nd the average
Multiply each number by 5 and �nd the average
Example
If the average of the day temperature during the last month is 27Fwhat is the average in terms of Celsius?
Marius Ionescu Chapter 4: The Average and the Standard Deviation
Rules
Fact
average(x+5)=average(x)+5
average(x · 5)=average(x) · 5
Marius Ionescu Chapter 4: The Average and the Standard Deviation

Rules
Fact
average(x+5)=average(x)+5
average(x · 5)=average(x) · 5
Marius Ionescu Chapter 4: The Average and the Standard Deviation

Rules
Fact
average(x+5)=average(x)+5
average(x · 5)=average(x) · 5
Marius Ionescu Chapter 4: The Average and the Standard Deviation

Median
Example
Find the median for each of the following sequence of numbers:
1, 1, 1, 1, 2, 2, 2, 2, 15
1, 1, 1, 1, 2, 2, 2, 2 ,3 ,3, 4
8, 10, 15, 20
Marius Ionescu Chapter 4: The Average and the Standard Deviation

Median
Example
Find the median for each of the following sequence of numbers:
1, 1, 1, 1, 2, 2, 2, 2, 15
1, 1, 1, 1, 2, 2, 2, 2 ,3 ,3, 4
8, 10, 15, 20
Marius Ionescu Chapter 4: The Average and the Standard Deviation

Median
Example
Find the median for each of the following sequence of numbers:
1, 1, 1, 1, 2, 2, 2, 2, 15
1, 1, 1, 1, 2, 2, 2, 2 ,3 ,3, 4
8, 10, 15, 20
Marius Ionescu Chapter 4: The Average and the Standard Deviation

Median
Example
Find the median for each of the following sequence of numbers:
1, 1, 1, 1, 2, 2, 2, 2, 15
1, 1, 1, 1, 2, 2, 2, 2 ,3 ,3, 4
8, 10, 15, 20
Marius Ionescu Chapter 4: The Average and the Standard Deviation

Average and median in Excel
Fact
To �nd the average of the cells A1:A10 you need to write
=average(A1:A10)
To �nd the median of the cells A1:A10 you need to write
=median(A1:A10)
Marius Ionescu Chapter 4: The Average and the Standard Deviation

Average and median in Excel
Fact
To �nd the average of the cells A1:A10 you need to write
=average(A1:A10)
To �nd the median of the cells A1:A10 you need to write
=median(A1:A10)
Marius Ionescu Chapter 4: The Average and the Standard Deviation

Average and median in Excel
Fact
To �nd the average of the cells A1:A10 you need to write
=average(A1:A10)
To �nd the median of the cells A1:A10 you need to write
=median(A1:A10)
Marius Ionescu Chapter 4: The Average and the Standard Deviation

Average, median, and the histogram
Example
Which histogram has higher average? Which histogram has highermedian?
Marius Ionescu Chapter 4: The Average and the Standard Deviation
Average, median, and the histogram
Fact
Average is the point at which the distribution balances.
Median is the point for which 1/2 of the area is on the left and
1/2 is on the right.
Median describes a �middle� individual, a typical subject.
Marius Ionescu Chapter 4: The Average and the Standard Deviation
Income in US
Example
For income in US, which would you expect to be larger? Themedian or the income?
Answer: In 2008
the median income was $61,521
the average income was $79,634
Marius Ionescu Chapter 4: The Average and the Standard Deviation

Income in US
Example
For income in US, which would you expect to be larger? Themedian or the income?Answer: In 2008
the median income was $61,521
the average income was $79,634
Marius Ionescu Chapter 4: The Average and the Standard Deviation

Income in US
Example
For income in US, which would you expect to be larger? Themedian or the income?Answer: In 2008
the median income was $61,521
the average income was $79,634
Marius Ionescu Chapter 4: The Average and the Standard Deviation

Standard Deviation
Fact
Standard deviation (SD) is a common way of measuring the
spread around the average.
Marius Ionescu Chapter 4: The Average and the Standard Deviation

The Root-mean-square
De�nition
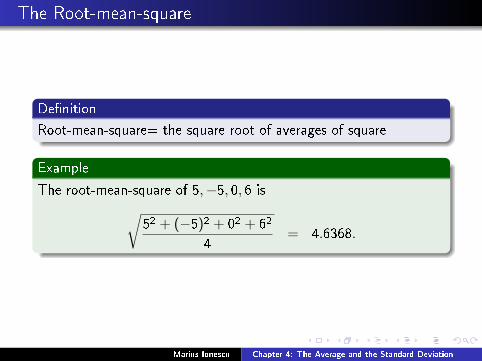
Root-mean-square= the square root of averages of square
Example
The root-mean-square of 5,−5, 0, 6 is√52 + (−5)2 + 02 + 62
4= 4.6368.
Marius Ionescu Chapter 4: The Average and the Standard Deviation
The Root-mean-square
De�nition
Root-mean-square= the square root of averages of square
Example
The root-mean-square of 5,−5, 0, 6 is√52 + (−5)2 + 02 + 62
4= 4.6368.
Marius Ionescu Chapter 4: The Average and the Standard Deviation

Standard Deviation
De�nition
SD= root-mean-square of distance to the average.
Example
Find the standard deviation of 20, 10,15, 15.
Avg =20+ 10+ 15+ 15
4= 15.
SD =
√52 + (−5)2 + 02 + 02
4= 3.5355
Marius Ionescu Chapter 4: The Average and the Standard Deviation

Standard Deviation
De�nition
SD= root-mean-square of distance to the average.
Example
Find the standard deviation of 20, 10,15, 15.
Avg =20+ 10+ 15+ 15
4= 15.
SD =
√52 + (−5)2 + 02 + 02
4= 3.5355
Marius Ionescu Chapter 4: The Average and the Standard Deviation

Standard Deviation
De�nition
SD= root-mean-square of distance to the average.
Example
Find the standard deviation of 20, 10,15, 15.
Avg =20+ 10+ 15+ 15
4= 15.
SD =
√52 + (−5)2 + 02 + 02
4= 3.5355
Marius Ionescu Chapter 4: The Average and the Standard Deviation

Standard Deviation
De�nition
SD= root-mean-square of distance to the average.
Example
Find the standard deviation of 20, 10,15, 15.
Avg =20+ 10+ 15+ 15
4= 15.
SD =
√52 + (−5)2 + 02 + 02
4= 3.5355
Marius Ionescu Chapter 4: The Average and the Standard Deviation

Standard Deviation
Fact
The SD says how far away the numbers on a list are from their
average. Most entries on the list will be somewhere around one SD
away from the average.
Marius Ionescu Chapter 4: The Average and the Standard Deviation

Is your calculator computing SD or SD+?
Fact
Enter 1 and −1 in your calculator and compute SD. What number
do you get?
If the answer is 1 then your calculator is computing SD.
If the answer is 1.41..., then your calculator is computing
something called SD+.
To �nd SD from SD+ you need to use the following formula
SD =
√# of entries− 1
# of entriesSD+.
To compute the standard deviation in Excel of a sequence of
numbers in cells A1:A10 you would write =stdevp(A1:A10)
Marius Ionescu Chapter 4: The Average and the Standard Deviation

Examples
Example
Which of the following histograms has the highest SD and whichone has the smallest SD?
a) b)c)
Marius Ionescu Chapter 4: The Average and the Standard Deviation

Percentiles
De�nition
n%: sort the numbers and then �nd which is bigger than n% of theothers.
Example
Find the 75th%ile of 1,2,3,4.
Find the 10th, 50th, 90th percentile of 1,2,3,4,5,6,7,8,9,10.
Marius Ionescu Chapter 4: The Average and the Standard Deviation

Percentiles
De�nition
n%: sort the numbers and then �nd which is bigger than n% of theothers.
Example
Find the 75th%ile of 1,2,3,4.
Find the 10th, 50th, 90th percentile of 1,2,3,4,5,6,7,8,9,10.
Marius Ionescu Chapter 4: The Average and the Standard Deviation

Percentiles
De�nition
n%: sort the numbers and then �nd which is bigger than n% of theothers.
Example
Find the 75th%ile of 1,2,3,4.
Find the 10th, 50th, 90th percentile of 1,2,3,4,5,6,7,8,9,10.
Marius Ionescu Chapter 4: The Average and the Standard Deviation

Percentiles
De�nition
n%: sort the numbers and then �nd which is bigger than n% of theothers.
Example
Find the 75th%ile of 1,2,3,4.
Find the 10th, 50th, 90th percentile of 1,2,3,4,5,6,7,8,9,10.
Marius Ionescu Chapter 4: The Average and the Standard Deviation

Percentiles
De�nition
n%: sort the numbers and then �nd which is bigger than n% of theothers.
Example
Find the 75th%ile of 1,2,3,4.
Find the 10th, 50th, 90th percentile of 1,2,3,4,5,6,7,8,9,10.
Marius Ionescu Chapter 4: The Average and the Standard Deviation

Percentiles in Excel
Fact
To �nd percentiles in Excel you should use the percentilefunction.
For example to �nd the 75th %ile of a sequence of numbers in
A1:A10 you would enter =percentile(A1:A10,0.75)
Notice that you need to enter 0.75 and not 75!
Marius Ionescu Chapter 4: The Average and the Standard Deviation

Review Example
Example
Try to match the following histograms to the following data from asurvey of adults in the San Francisco Bay Area:
1 people's height
2 people's weight
3 the distance from a persons home to San Francisco
4 the distance from a persons home to the nearest airport.
You can use the same diagram more than once or not at all.
Marius Ionescu Chapter 4: The Average and the Standard Deviation
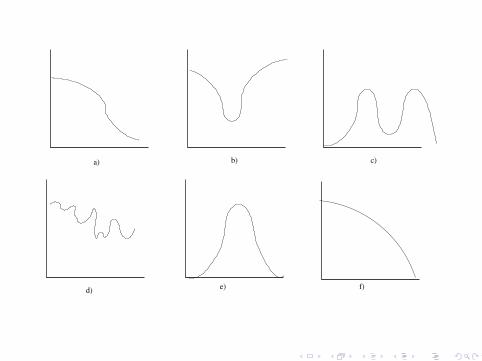
a) b) c)
d)e) f)

Combining histograms
Example
The following two histograms are for decibel reading at a basketballgame and a hockey game. What does the histogram for thecombined data look like (for both sporting events)?
50 100 50 100
Marius Ionescu Chapter 4: The Average and the Standard Deviation