Chapter 4 TARGETRY AND PION PRODUCTION - … · Chapter 4 TARGETRY AND PION PRODUCTION ... The...
57
Chapter 4 TARGETRY AND PION PRODUCTION Contents 4.1 Target and Collection Optimization for Muon Colliders .... 149 4.1.1 Basic Description ............................ 149 4.1.2 Target Region Studies ......................... 153 4.1.3 Pion and Muon Collection ....................... 170 4.1.4 Conclusions ............................... 183 4.2 Design Studies of Capture Magnet Systems ........... 184 4.2.1 Introduction .............................. 184 4.2.2 The Capture Solenoid System ..................... 184 4.2.3 Water-Cooled Bitter Solenoid Insert ................. 185 4.2.4 Superconducting Outsert Solenoid .................. 187 4.2.5 The Transfer Solenoid System ..................... 188 4.1 Target and Collection Optimization for Muon Col- liders 4.1.1 Basic Description To achieve adequate luminosity in a muon collider it is necessary to produce and collect large numbers of muons. The basic method starts with a proton beam impinging on a thick target 149
Transcript of Chapter 4 TARGETRY AND PION PRODUCTION - … · Chapter 4 TARGETRY AND PION PRODUCTION ... The...
Chapter 4
TARGETRY AND PION
PRODUCTION
Contents
4.1 Target and Collection Optimization for Muon Colliders . . . . 149
4.1.1 Basic Description . . . . . . . . . . . . . . . . . . . . . . . . . . . . 149
4.1.2 Target Region Studies . . . . . . . . . . . . . . . . . . . . . . . . . 153
4.1.3 Pion and Muon Collection . . . . . . . . . . . . . . . . . . . . . . . 170
4.1.4 Conclusions . . . . . . . . . . . . . . . . . . . . . . . . . . . . . . . 183
4.2 Design Studies of Capture Magnet Systems . . . . . . . . . . . 184
4.2.1 Introduction . . . . . . . . . . . . . . . . . . . . . . . . . . . . . . 184
4.2.2 The Capture Solenoid System . . . . . . . . . . . . . . . . . . . . . 184
4.2.3 Water-Cooled Bitter Solenoid Insert . . . . . . . . . . . . . . . . . 185
4.2.4 Superconducting Outsert Solenoid . . . . . . . . . . . . . . . . . . 187
4.2.5 The Transfer Solenoid System . . . . . . . . . . . . . . . . . . . . . 188
4.1 Target and Collection Optimization for Muon Col-
liders
4.1.1 Basic Description
To achieve adequate luminosity in a muon collider it is necessary to produce and collect large
numbers of muons. The basic method starts with a proton beam impinging on a thick target
149
150 CHAPTER 4. TARGETRY AND PION PRODUCTION
(one to two interaction lengths) followed by a long solenoid which collects muons resulting
mainly from pion decay. Because of their short lifetime muons must be generated by a single
proton pulse for each new acceleration cycle. Production and collection of pions and their
decay muons must be optimized while keeping in mind limitations of target integrity and of
the technology of magnets and debuncher cavities.
Early estimates of muon yield, based on conventional lithium lens and quadrupole magnet
collection methods, indicated that roughly 1000 protons are needed for every muon delivered
to the collider rings [1]. This results from inherent limitations in the momentum acceptance of
these systems (typically less than ±5 percent) which causes most (potential) muons produced
to be wasted. Motivated by neutrino beamline experience, a solenoid collection scheme for
pions has been suggested [2]. Cursory simulations indicated significant improvement in muon
yields to about 0.3 muon per proton for proton energies below 100 GeV while above this
energy a collection system with two lithium lenses could surpass a solenoid.
Luminosity estimates indicate that 2 × 10¹² muons per bunch delivered at 15 to 30 Hz
are required for a 2+2 TeV muon collider. Assuming a yield of roughly one charged pion per
proton and the efficiencies for pion to muon conversion, muon cooling and muon acceleration
are each about 0.5, the approximate number of protons needed at the target is 1014 per pulse.
However the power required for a 15 to 30 Hz rapid-cycling proton synchrotron with 1014
protons per pulse becomes relatively expensive above 30 GeV. Also multiplicities and pion
yields increase less rapidly above 30 GeV. For energies below 3 GeV pion yields drop off, and
there is an increasing asymmetry in the π+ to π− ratio due to ∆ resonance production. Since
the proton bunch must be a few nanoseconds long at the target to facilitate pion debunching
and momentum spread reduction, the proton energy must also be high enough to reduce
space-charge effects. These considerations suggest that the kinetic energy of the proton
driver should be between 3 and 30 GeV. Actual yields and target energy densities may well
depend considerably on incident energy. This has motivated detailed pion production studies
at 8 and 30 GeV. Inter-comparisons and conclusions derived from these studies, such as in
the optimization of target size or solenoid field with respect to muon yield, are expected to
be much less sensitive to incident energy. Hence the results at these two energies are viewed
as complimentary providing a firm understanding of pion and muon production and target
integrity in this energy range.
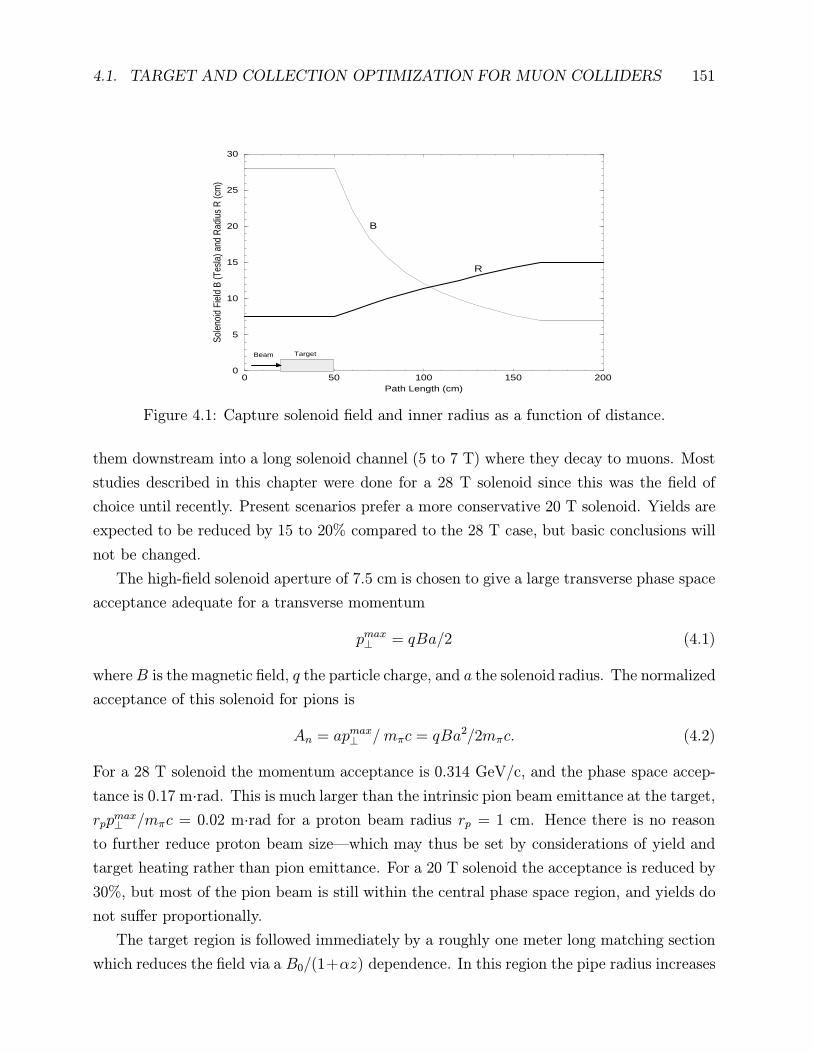
The basic collection scheme, as outlined by Palmer et al [2] is illustrated in Fig. 4.1 and
forms the starting point for the simulations described in this chapter. A very high-field
hybrid solenoid extends the length of a target upon which a proton beam impinges. Based
on near term technology, fields of 20 to 28 T appear to be achievable for this purpose. This
target solenoid collects pions with a large momentum spread and with large angles and guides
4.1. TARGET AND COLLECTION OPTIMIZATION FOR MUON COLLIDERS 151
0 50 100 150 200Path Length (cm)
0
5
10
15
20
25
30
Sole
noid
Fie
ld B
(Tes
la) a
nd R
adiu
s R
(cm
)
Beam Target
B
R
Figure 4.1: Capture solenoid field and inner radius as a function of distance.
them downstream into a long solenoid channel (5 to 7 T) where they decay to muons. Most
studies described in this chapter were done for a 28 T solenoid since this was the field of
choice until recently. Present scenarios prefer a more conservative 20 T solenoid. Yields are
expected to be reduced by 15 to 20% compared to the 28 T case, but basic conclusions will
not be changed.
The high-field solenoid aperture of 7.5 cm is chosen to give a large transverse phase space
acceptance adequate for a transverse momentum
pmax⊥ = qBa/2 (4.1)
whereB is the magnetic field, q the particle charge, and a the solenoid radius. The normalized
acceptance of this solenoid for pions is
An = apmax⊥ / mπc = qBa2/2mπc. (4.2)
For a 28 T solenoid the momentum acceptance is 0.314 GeV/c, and the phase space accep-
tance is 0.17 m·rad. This is much larger than the intrinsic pion beam emittance at the target,
rppmax⊥ /mπc = 0.02 m·rad for a proton beam radius rp = 1 cm. Hence there is no reason
to further reduce proton beam size—which may thus be set by considerations of yield and
target heating rather than pion emittance. For a 20 T solenoid the acceptance is reduced by
30%, but most of the pion beam is still within the central phase space region, and yields do
not suffer proportionally.
The target region is followed immediately by a roughly one meter long matching section
which reduces the field via a B0/(1+αz) dependence. In this region the pipe radius increases
152 CHAPTER 4. TARGETRY AND PION PRODUCTION
to a value which corresponds to the radius of the lower field solenoid serving as pion decay
region. This keeps the product Ba2 constant and the acceptance unchanged. The parameter
α = (qB0/2pπ)(dβf/dz) is chosen such that for a characteristic pion momentum the rate of
change of the beta focusing function (βf = 2pπ/qB) with distance is less than 0.5, which
might still be considered an adiabatic change of the field.
One of the outstanding problems associated with the solenoid collection of secondary
beams immediately after a target is the disposition of the remnant high energy proton beam
and the various non-muon producing particles. These unwanted particles form an intense
swarm which outnumber the pions several to one and can potentially induce significant
radioactivity far downstream. Although no final solution to this problem exists, a possible
solution was discussed in [3]. There a curved solenoid field is introduced to separate positive
and negative pions within a few meters of the target. This permits each to be placed in
separate rf buckets for acceleration which effectively doubles the number of muons per
bunch available for collisions and increases the luminosity fourfold. The proton beam and
neutrals impinge on the curved walls in this limited region, and few manage to travel far
downstream with the pions. This option is not part of the reference design for the 2+2 TeV
collider, but it is discussed later in this chapter to encourage further thought on the matter
of beam cleanup and charge separation.
An extensive number of simulations [3, 4] have been performed for pion production from
8 and 30 GeV proton beams on different target materials in a 28 T solenoid. Solid (graphite,
aluminum, copper, tungsten) and liquid (gallium, mercury, lead) targets of different radii
(0.4 cm≤r≤2 cm) and thicknesses (0.5λI ≤L≤3λI), where λI is nuclear interaction length,
have been explored. Values of λI are taken from [8].
Table 4.1 presents an overview of target parameters which have resulted from these stud-
ies. Of the many materials studied, only three are presented here based on their practicality
and potentially useful properties for high-power targetry. Details of this work are found in
the cited references and the essential results will be discussed in the following sections. In
brief this work has demonstrated by simulation that yields of 1 to 2 charged pions per pro-
ton are achievable from any of the targets considered if collection occurs in a large aperture
solenoid and that pion to muon decay efficiencies can exceed 0.75 in the downstream decay
channel. Although an adequate supply of muons has been demonstrated by simulation, the
beam phase space is, of course, tremendous and requires substantial cooling.
High–Z targets are preferred for producing secondary beams when collection is done with
a thin lens to reduce depth of focus problems (e.g., antiproton collection with a lithium
lens). This concern is absent with solenoid collection, so other constraints determine the
choice of target material. At the proton intensities required for a muon collider, high–Z
4.1. TARGET AND COLLECTION OPTIMIZATION FOR MUON COLLIDERS 153
targets suffer from extremely high heat loads due to electromagnetic showering with only a
marginal increase in pion yield compared to low–Z targets. In going from 8 to 30 GeV and
doubling the average beam power, the average dissipated power in high–Z targets increases
by a factor of 2 with a doubling of the yield. For low–Z targets of the same length (1.5λI)
the average power changes very little with a doubling of the yield in this energy range. For
high–Z materials the power densities suggest the need for much larger diameter targets,
microchannel cooling or circulating liquid targets. Low–Z targets may then be preferred for
the muon collider application. High energy proton beams are not necessarily preferred on
the basis of pion yield, although they may be required for making very short bunches.
An issue not addressed in this chapter is the tendency of high–Z targets to produce many
radionuclides, especially alpha emitters, which are then transported about by a circulating
liquid target system or would produce accumulated helium and embrittlement in a solid
target. Difficulties in the containment of a hot radioactive liquid in the target station during
an accident may also argue against the use of high–Z recirculating targets.
4.1.2 Target Region Studies
Overall Optimization
For the collection geometry described in the previous section, target composition, length and
radius are varied and pion yield is studied using particle production and transport simulation
codes. The proton beam is assumed to have an emittance of εrmsN = 4×10⁻⁵ m·rad consistent
with a value expected from a high-intensity proton source. The focusing function at the
target is conservatively chosen to result in a relatively wide beam with σx=σy=0.4 cm.
Several computer codes for particle production are used in this study due to preference
and availability at different laboratories. This also allowed consistency checks of the codes.
The mars code [5], developed over many years at IHEP and FermiLab for particle–matter
interaction simulations, is used for simulating particle production and transport in thick
targets within the solenoid field. The dpmjet [6] and arc [7] codes are used to compare
particle production and spectra with mars. The arc code continues to be improved and
recently was upgraded to simulate thick targets with re-absorption. The mars is also used to
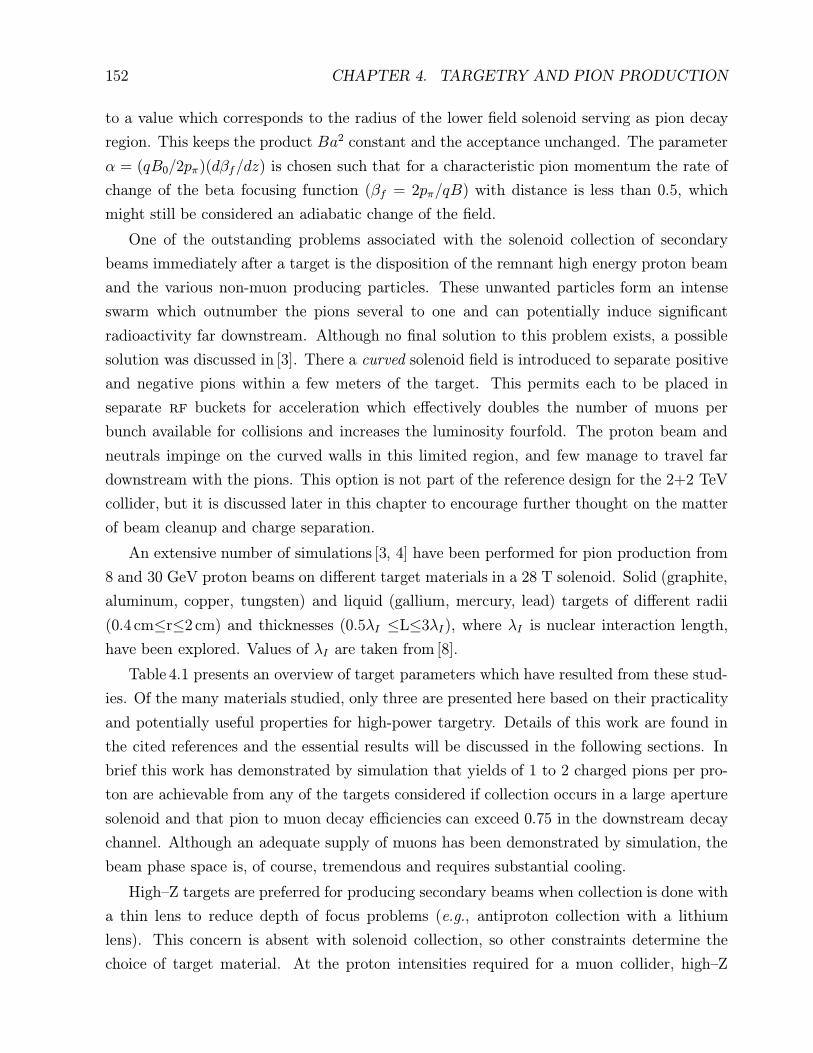
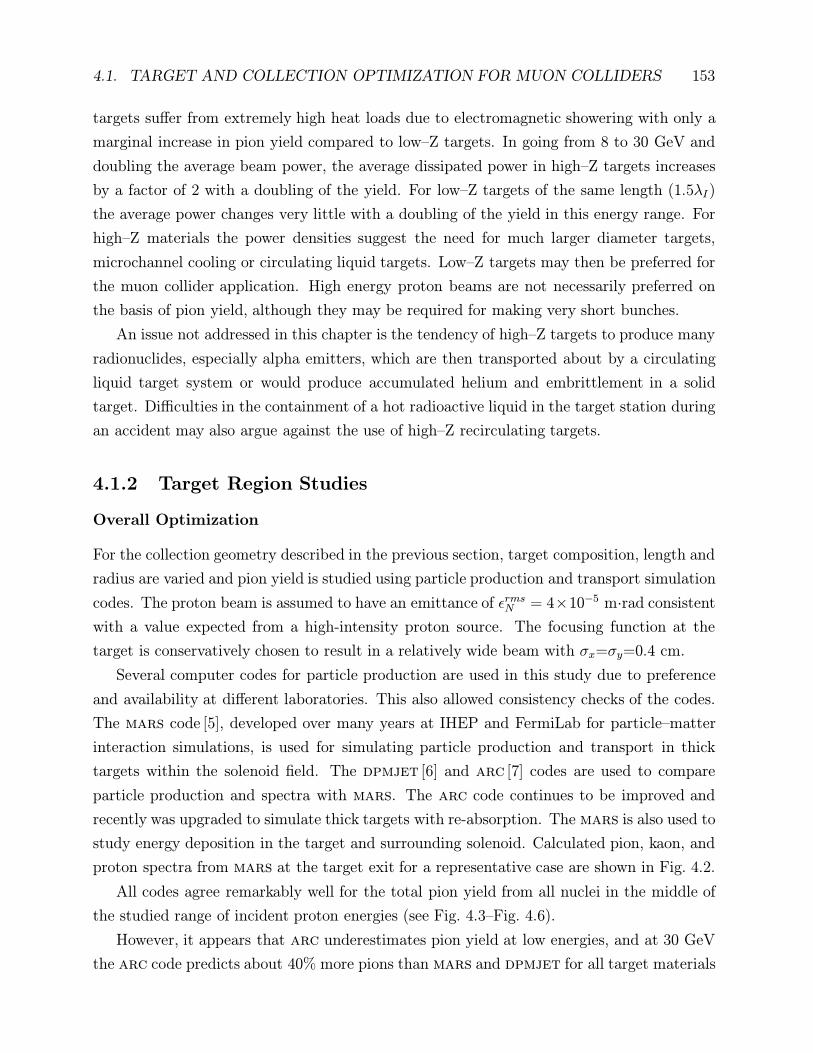
study energy deposition in the target and surrounding solenoid. Calculated pion, kaon, and
proton spectra from mars at the target exit for a representative case are shown in Fig. 4.2.
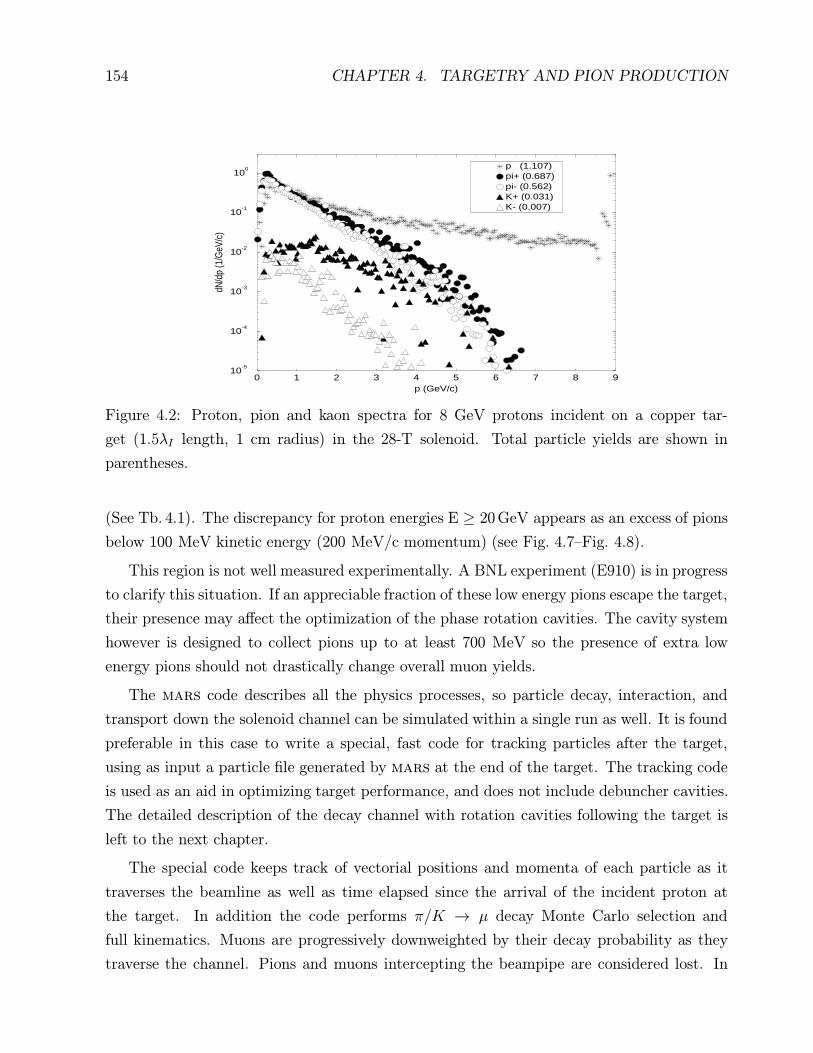
All codes agree remarkably well for the total pion yield from all nuclei in the middle of
the studied range of incident proton energies (see Fig. 4.3–Fig. 4.6).
However, it appears that arc underestimates pion yield at low energies, and at 30 GeV
the arc code predicts about 40% more pions than mars and dpmjet for all target materials
154 CHAPTER 4. TARGETRY AND PION PRODUCTION
0 1 2 3 4 5 6 7 8 9p (GeV/c)
10-5
10-4
10-3
10-2
10-1
100
dN/d
p (1
/GeV
/c)
p (1.107)pi+ (0.687)pi- (0.562)K+ (0.031)K- (0.007)
Figure 4.2: Proton, pion and kaon spectra for 8 GeV protons incident on a copper tar-
get (1.5λI length, 1 cm radius) in the 28-T solenoid. Total particle yields are shown in
parentheses.
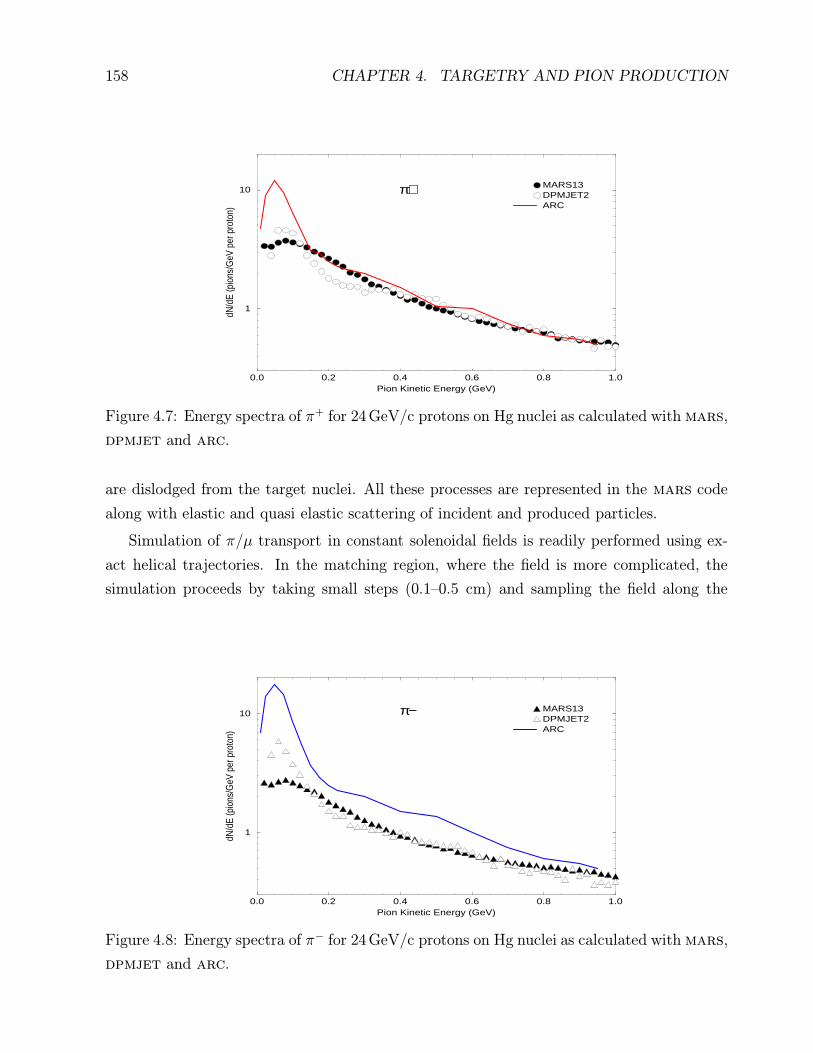
(See Tb. 4.1). The discrepancy for proton energies E ≥ 20 GeV appears as an excess of pions
below 100 MeV kinetic energy (200 MeV/c momentum) (see Fig. 4.7–Fig. 4.8).
This region is not well measured experimentally. A BNL experiment (E910) is in progress
to clarify this situation. If an appreciable fraction of these low energy pions escape the target,
their presence may affect the optimization of the phase rotation cavities. The cavity system
however is designed to collect pions up to at least 700 MeV so the presence of extra low
energy pions should not drastically change overall muon yields.
The mars code describes all the physics processes, so particle decay, interaction, and
transport down the solenoid channel can be simulated within a single run as well. It is found
preferable in this case to write a special, fast code for tracking particles after the target,
using as input a particle file generated by mars at the end of the target. The tracking code
is used as an aid in optimizing target performance, and does not include debuncher cavities.
The detailed description of the decay channel with rotation cavities following the target is
left to the next chapter.
The special code keeps track of vectorial positions and momenta of each particle as it
traverses the beamline as well as time elapsed since the arrival of the incident proton at
the target. In addition the code performs π/K → µ decay Monte Carlo selection and
full kinematics. Muons are progressively downweighted by their decay probability as they
traverse the channel. Pions and muons intercepting the beampipe are considered lost. In
4.1. TARGET AND COLLECTION OPTIMIZATION FOR MUON COLLIDERS 155
0.0 0.5 1.0 1.5Transverse Kinetic Energy (GeV)
10-1
100
101
102
103
104
105
106
Inva
riant
Cro
ss S
ectio
n (m
b/G
eV**
2)
14.6 GeV/c protons on Au
MARS13DPMJET2ARCE-802x100
2.2<y<2.4
x101.6<y<1.8
1<y<1.2
π+
Figure 4.3: Positive pion production cross section for 14.6 GeV/c protons incident on a gold
thin target as calculated with mars, dpmjet and arc and measured in E-802 experiment
at BNL [7].
principle there is a small (but presumably negligible) fraction which may scatter back out of
the wall or—in the case of a pion—produce a secondary pion which may rejoin the beam.
A large variety of particles is produced by primary protons and subsequently by sec-
ondary and higher generation particles. For 8 GeV p–p interactions the average charged
particle multiplicity is about three [8] with a modest increase expected for p–nucleus colli-
156 CHAPTER 4. TARGETRY AND PION PRODUCTION
0.0 0.5 1.0 1.5Transverse Kinetic Energy (GeV)
10-1
100
101
102
103
104
105
106
Inva
riant
Cro
ss S
ectio
n (m
b/G
eV**
2)
14.6 GeV/c protons on Au
MARS13DPMJET2ARCE-802
x1002.2<y<2.4
x101.6<y<1.8
1<y<1.2
π−
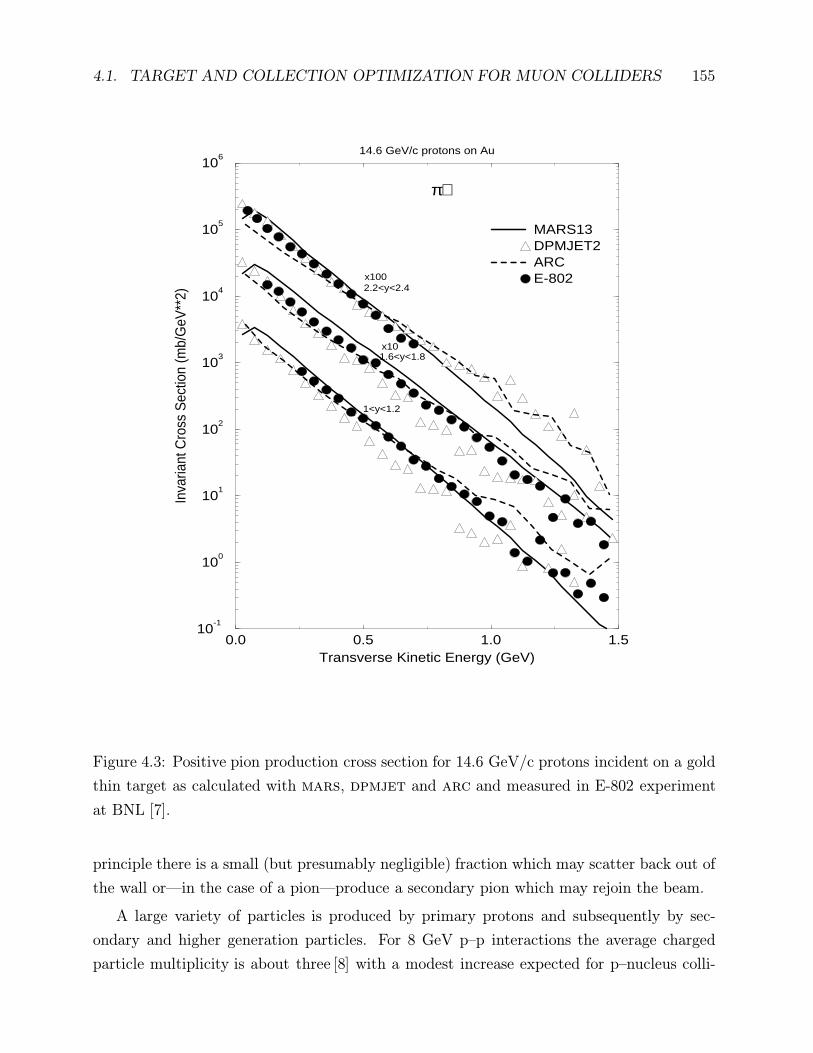
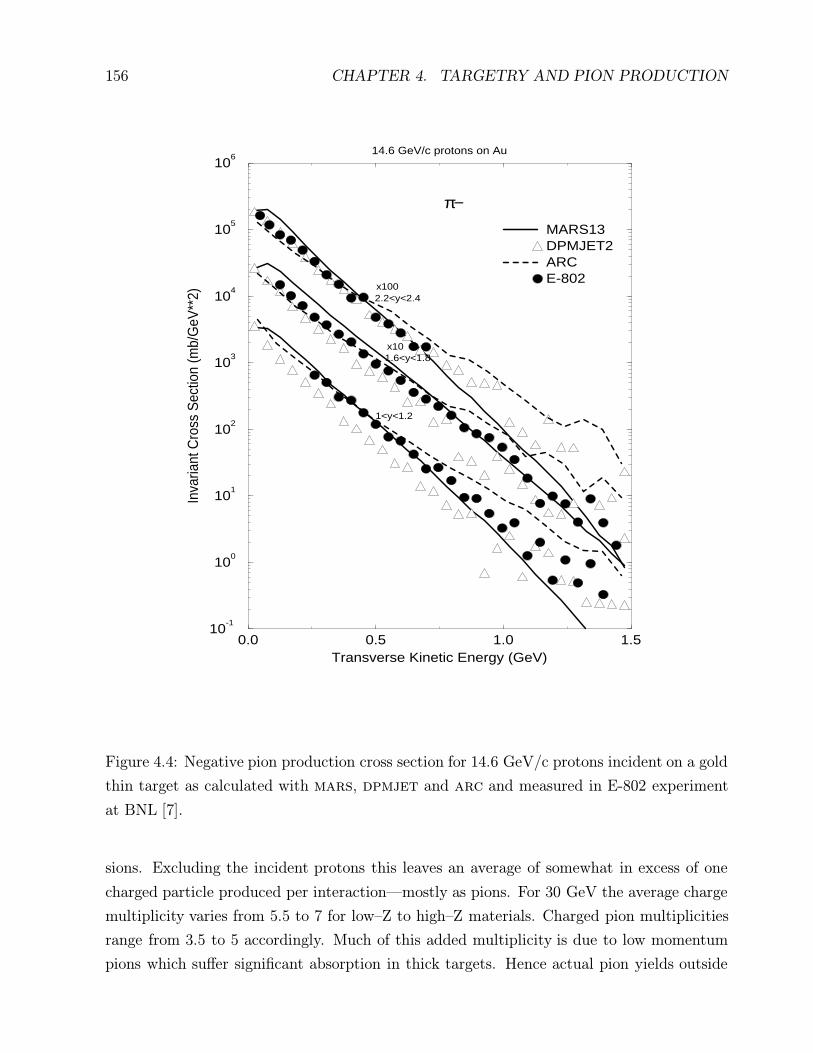
Figure 4.4: Negative pion production cross section for 14.6 GeV/c protons incident on a gold
thin target as calculated with mars, dpmjet and arc and measured in E-802 experiment
at BNL [7].
sions. Excluding the incident protons this leaves an average of somewhat in excess of one
charged particle produced per interaction—mostly as pions. For 30 GeV the average charge
multiplicity varies from 5.5 to 7 for low–Z to high–Z materials. Charged pion multiplicities
range from 3.5 to 5 accordingly. Much of this added multiplicity is due to low momentum
pions which suffer significant absorption in thick targets. Hence actual pion yields outside
4.1. TARGET AND COLLECTION OPTIMIZATION FOR MUON COLLIDERS 157
5 10 15 20 25 30 35Beam Momentum (GeV/c)
0.5
1.0
1.5
2.0
2.5
3.0
Yiel
d (p
ion
per p
roto
n)
BeAlCuAu
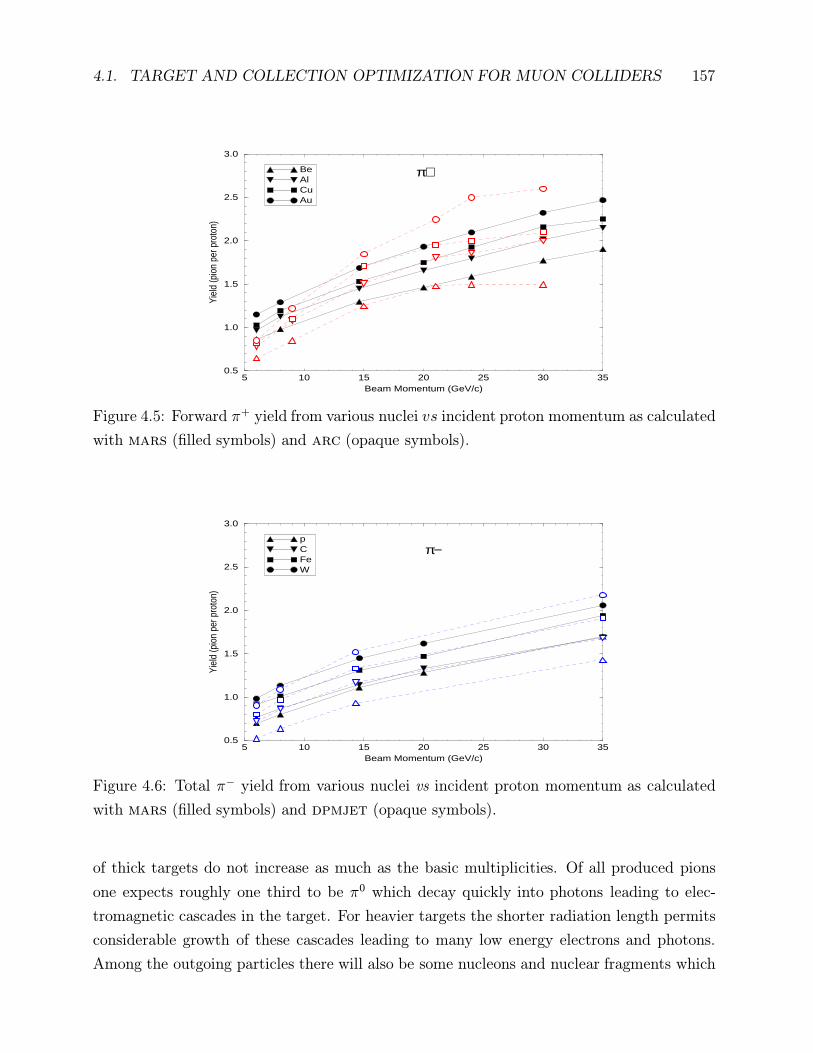
π+
Figure 4.5: Forward π+ yield from various nuclei vs incident proton momentum as calculated
with mars (filled symbols) and arc (opaque symbols).
5 10 15 20 25 30 35Beam Momentum (GeV/c)
0.5
1.0
1.5
2.0
2.5
3.0
Yiel
d (p
ion
per p
roto
n)
pCFeW
π−
Figure 4.6: Total π− yield from various nuclei vs incident proton momentum as calculated
with mars (filled symbols) and dpmjet (opaque symbols).
of thick targets do not increase as much as the basic multiplicities. Of all produced pions
one expects roughly one third to be π0 which decay quickly into photons leading to elec-
tromagnetic cascades in the target. For heavier targets the shorter radiation length permits
considerable growth of these cascades leading to many low energy electrons and photons.
Among the outgoing particles there will also be some nucleons and nuclear fragments which
158 CHAPTER 4. TARGETRY AND PION PRODUCTION
0.0 0.2 0.4 0.6 0.8 1.0Pion Kinetic Energy (GeV)
1
10
dN/d
E (p
ions
/GeV
per
pro
ton)
MARS13DPMJET2ARC
π+
Figure 4.7: Energy spectra of π+ for 24 GeV/c protons on Hg nuclei as calculated with mars,
dpmjet and arc.
are dislodged from the target nuclei. All these processes are represented in the mars code
along with elastic and quasi elastic scattering of incident and produced particles.
Simulation of π/µ transport in constant solenoidal fields is readily performed using ex-
act helical trajectories. In the matching region, where the field is more complicated, the
simulation proceeds by taking small steps (0.1–0.5 cm) and sampling the field along the
0.0 0.2 0.4 0.6 0.8 1.0Pion Kinetic Energy (GeV)
1
10
dN/d
E (p
ions
/GeV
per
pro
ton)
MARS13DPMJET2ARC
π−
Figure 4.8: Energy spectra of π− for 24 GeV/c protons on Hg nuclei as calculated with mars,
dpmjet and arc.

4.1. TARGET AND COLLECTION OPTIMIZATION FOR MUON COLLIDERS 159
trajectory. The declining field in the matching region means that according to the ∇·B= 0
condition the field has a radial component: Br ' −12r∂Bz/∂z. For the above z-dependence
∂Br/∂z = −12r∂2Bz/∂z
2 6= 0 and it follows [9] from the ∇×B= 0 condition that Bz must
depend on r. This requires that an extra term be present in Bz which—in turn—requires
(via ∇· B= 0) an extra term in Br, etc. For the present simulations the iteration is pursued
up to quadratic correction terms:
Bz =B0
1 + αz
[1−
1
2
(αr
1 + αz
)2]
Br =B0αr
2(1 + αz)2
[1−
3
4
(αr
1 + αz
)2]. (4.3)
It should be remarked that the analysis simplifies considerably if Bz is made to decline lin-
early with distance in the matching region: Bz = B0(1−az). Then Br = 12raB0 independent
of z and both ∇·B= 0 and ∇×B= 0 are satisfied. Results of simulations performed with a
linear field do not differ significantly from those obtained with the (1 + αz)−1–dependence.
The results presented in the rest of this section on optimization of pion yield and on
energy deposition in the target and solenoid material are obtained with the current version
of the mars code [5].
Pion Yield
A crude target optimization with respect to yield starts by ‘tagging’ those pions (and kaons)
which result in an acceptable muon deep in the decay channel for different targets followed
by the ‘standard’ geometry as described in Section 4.1 (see Fig. 4.1). In excess of 90% of
all accepted muons are thus shown from mars and dpmjet to be the progeny of pions in
the momentum range 0.2–2.5 GeV/c for both 8 and 30 GeV protons. As mentioned earlier,
the arc code predicts an excess of pions below 200 MeV/c and the effect of these extra
pions on decay channel optimization is discussed in the next chapter. Then for a series of
mars runs, pion yield at the target exit and in the above momentum range is determined
for various target parameters—without simulation of the collection channel. In addition
to contributing little to the muon yield outside the target, pions with momenta less than
0.2 GeV/c have velocities below 0.82 c and thus will quickly drop far behind the main pulse
of faster particles unless the debuncher cavities are placed very near the target. Fig. 4.9 show
momentum versus time scatter plots of pions, kaons and muons for an 8 GeV proton beam
with σt = 3 nsec incident on a 22.5 cm copper target. In all plots t= 0 refers to the center
of the proton bunch at the target entrance. Materials investigated as target candidates are
carbon, aluminum, copper, gallium, tungsten, iridium, mercury and lead. This set spans the
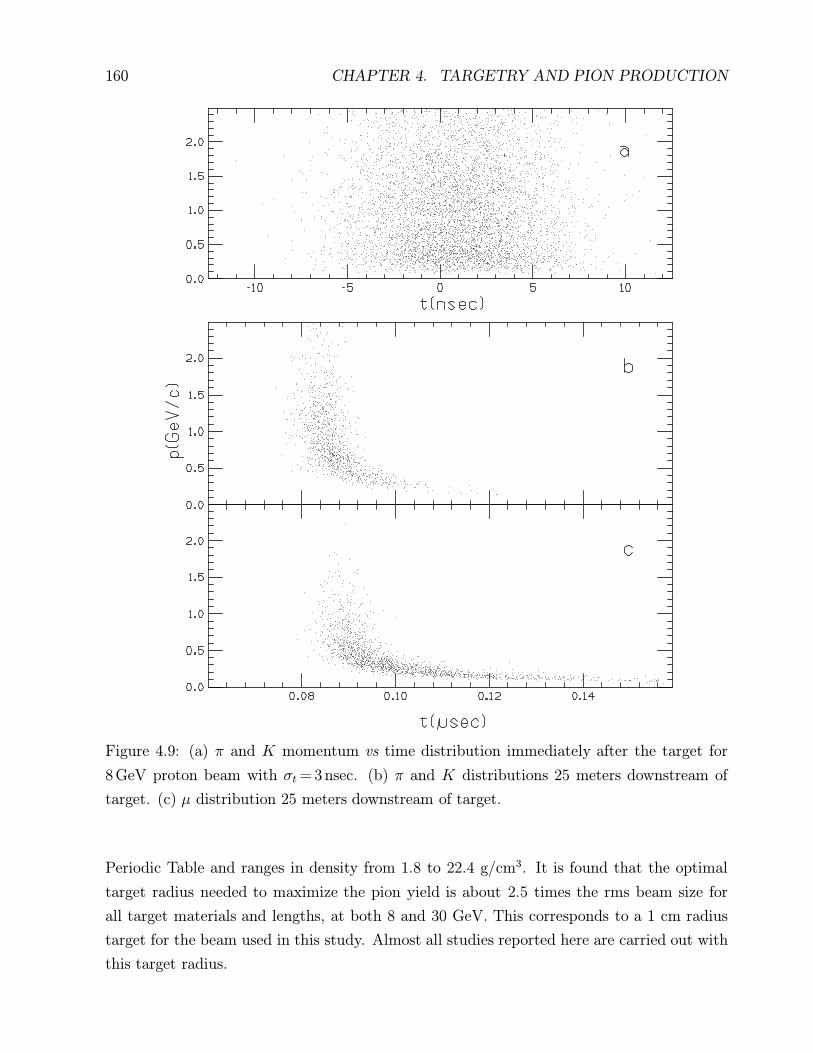
160 CHAPTER 4. TARGETRY AND PION PRODUCTION
Figure 4.9: (a) π and K momentum vs time distribution immediately after the target for
8 GeV proton beam with σt = 3 nsec. (b) π and K distributions 25 meters downstream of
target. (c) µ distribution 25 meters downstream of target.
Periodic Table and ranges in density from 1.8 to 22.4 g/cm3. It is found that the optimal
target radius needed to maximize the pion yield is about 2.5 times the rms beam size for
all target materials and lengths, at both 8 and 30 GeV. This corresponds to a 1 cm radius
target for the beam used in this study. Almost all studies reported here are carried out with
this target radius.
4.1. TARGET AND COLLECTION OPTIMIZATION FOR MUON COLLIDERS 161
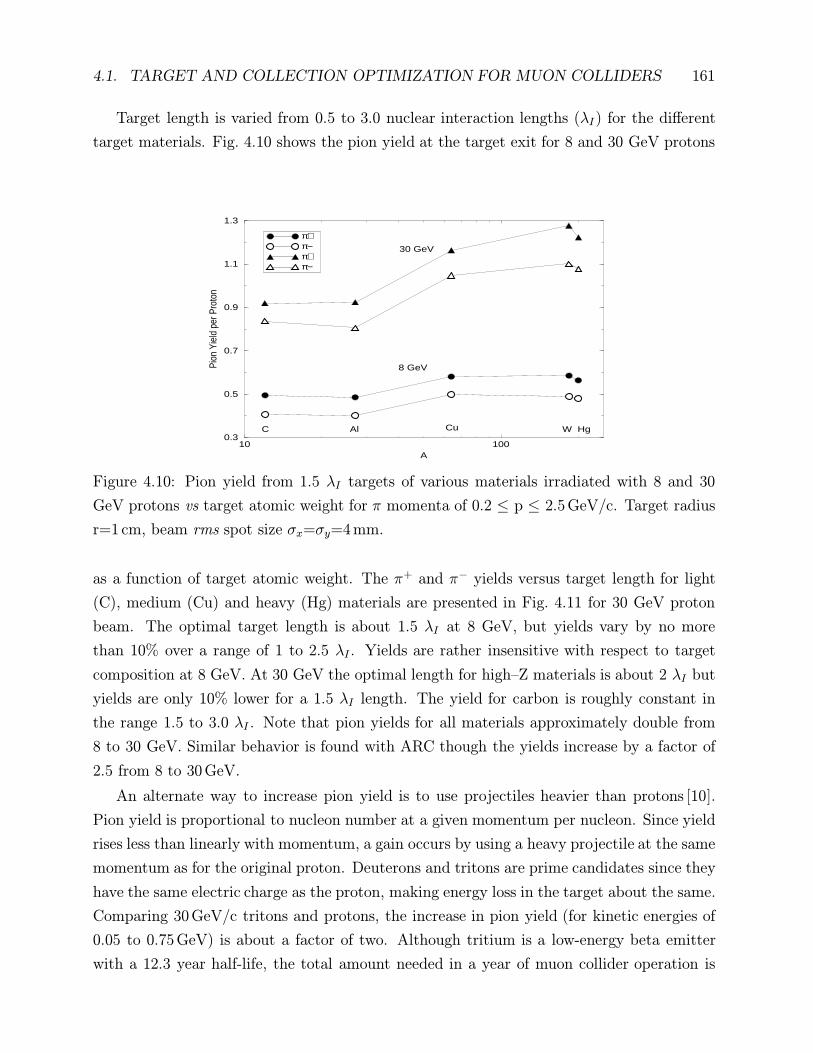
Target length is varied from 0.5 to 3.0 nuclear interaction lengths (λI) for the different
target materials. Fig. 4.10 shows the pion yield at the target exit for 8 and 30 GeV protons
10 100A
0.3
0.5
0.7
0.9
1.1
1.3Pi
on Y
ield
per
Pro
ton
π+π−π+π−
C Al Cu W Hg
8 GeV
30 GeV
Figure 4.10: Pion yield from 1.5 λI targets of various materials irradiated with 8 and 30
GeV protons vs target atomic weight for π momenta of 0.2 ≤ p ≤ 2.5 GeV/c. Target radius
r=1 cm, beam rms spot size σx=σy=4 mm.
as a function of target atomic weight. The π+ and π− yields versus target length for light
(C), medium (Cu) and heavy (Hg) materials are presented in Fig. 4.11 for 30 GeV proton
beam. The optimal target length is about 1.5 λI at 8 GeV, but yields vary by no more
than 10% over a range of 1 to 2.5 λI . Yields are rather insensitive with respect to target
composition at 8 GeV. At 30 GeV the optimal length for high–Z materials is about 2 λI but
yields are only 10% lower for a 1.5 λI length. The yield for carbon is roughly constant in
the range 1.5 to 3.0 λI . Note that pion yields for all materials approximately double from
8 to 30 GeV. Similar behavior is found with ARC though the yields increase by a factor of
2.5 from 8 to 30 GeV.
An alternate way to increase pion yield is to use projectiles heavier than protons [10].
Pion yield is proportional to nucleon number at a given momentum per nucleon. Since yield
rises less than linearly with momentum, a gain occurs by using a heavy projectile at the same
momentum as for the original proton. Deuterons and tritons are prime candidates since they
have the same electric charge as the proton, making energy loss in the target about the same.
Comparing 30 GeV/c tritons and protons, the increase in pion yield (for kinetic energies of
0.05 to 0.75 GeV) is about a factor of two. Although tritium is a low-energy beta emitter
with a 12.3 year half-life, the total amount needed in a year of muon collider operation is
162 CHAPTER 4. TARGETRY AND PION PRODUCTION
0.0 0.5 1.0 1.5 2.0 2.5 3.0 3.5Target Thickness in Units of Interaction Length
0.3
0.5
0.7
0.9
1.1
1.3
1.5
Pion
Yie
ld p
er 1
Inci
dent
Pro
ton
CCuHg
π+
π−
π+π−π+
π−
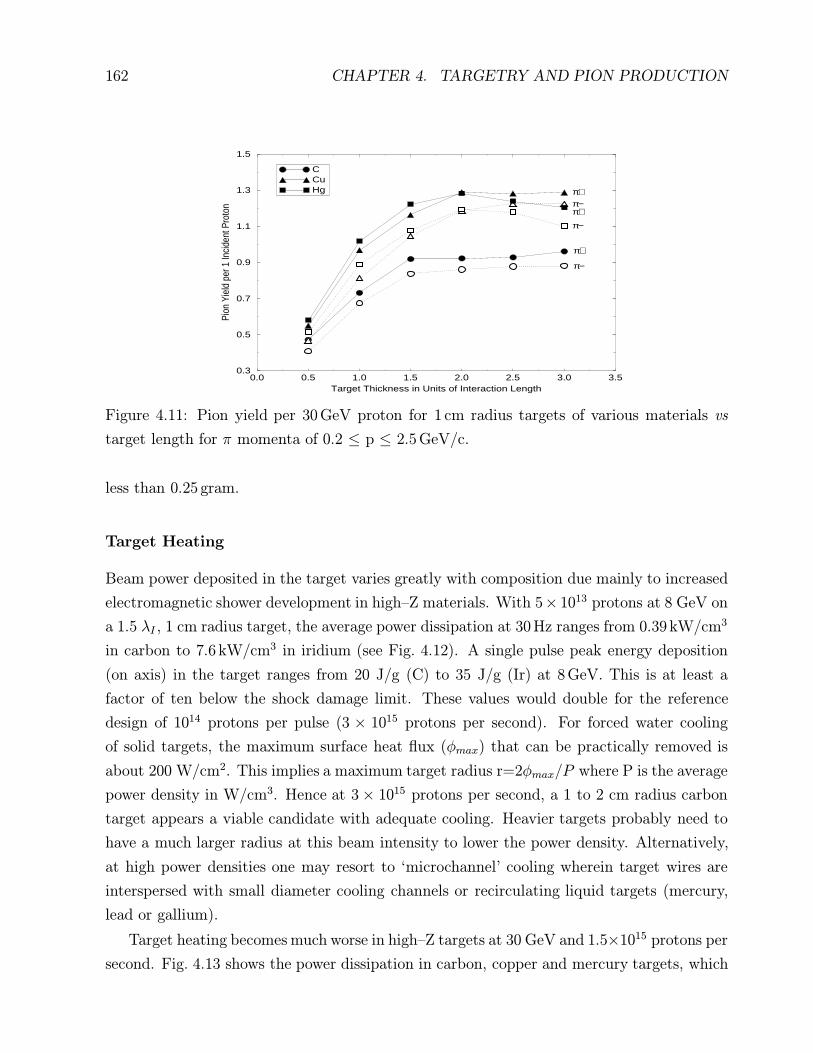
Figure 4.11: Pion yield per 30 GeV proton for 1 cm radius targets of various materials vs
target length for π momenta of 0.2 ≤ p ≤ 2.5 GeV/c.
less than 0.25 gram.
Target Heating
Beam power deposited in the target varies greatly with composition due mainly to increased
electromagnetic shower development in high–Z materials. With 5× 10¹³ protons at 8 GeV on
a 1.5 λI , 1 cm radius target, the average power dissipation at 30 Hz ranges from 0.39 kW/cm3
in carbon to 7.6 kW/cm3 in iridium (see Fig. 4.12). A single pulse peak energy deposition
(on axis) in the target ranges from 20 J/g (C) to 35 J/g (Ir) at 8 GeV. This is at least a
factor of ten below the shock damage limit. These values would double for the reference
design of 1014 protons per pulse (3 × 10¹⁵ protons per second). For forced water cooling
of solid targets, the maximum surface heat flux (φmax) that can be practically removed is
about 200 W/cm2. This implies a maximum target radius r=2φmax/P where P is the average
power density in W/cm3. Hence at 3× 10¹⁵ protons per second, a 1 to 2 cm radius carbon
target appears a viable candidate with adequate cooling. Heavier targets probably need to
have a much larger radius at this beam intensity to lower the power density. Alternatively,
at high power densities one may resort to ‘microchannel’ cooling wherein target wires are
interspersed with small diameter cooling channels or recirculating liquid targets (mercury,
lead or gallium).
Target heating becomes much worse in high–Z targets at 30 GeV and 1.5×10¹⁵ protons per
second. Fig. 4.13 shows the power dissipation in carbon, copper and mercury targets, which
4.1. TARGET AND COLLECTION OPTIMIZATION FOR MUON COLLIDERS 163
0.0 0.3 0.6 0.9 1.2 1.5Target Thickness in Units of Interaction Length
0
50
100
150
200
250
300
350
Pow
er D
issi
patio
n (k
W p
er 1
.5E1
5 p/
sec)
C
Al
Cu
W
Ir
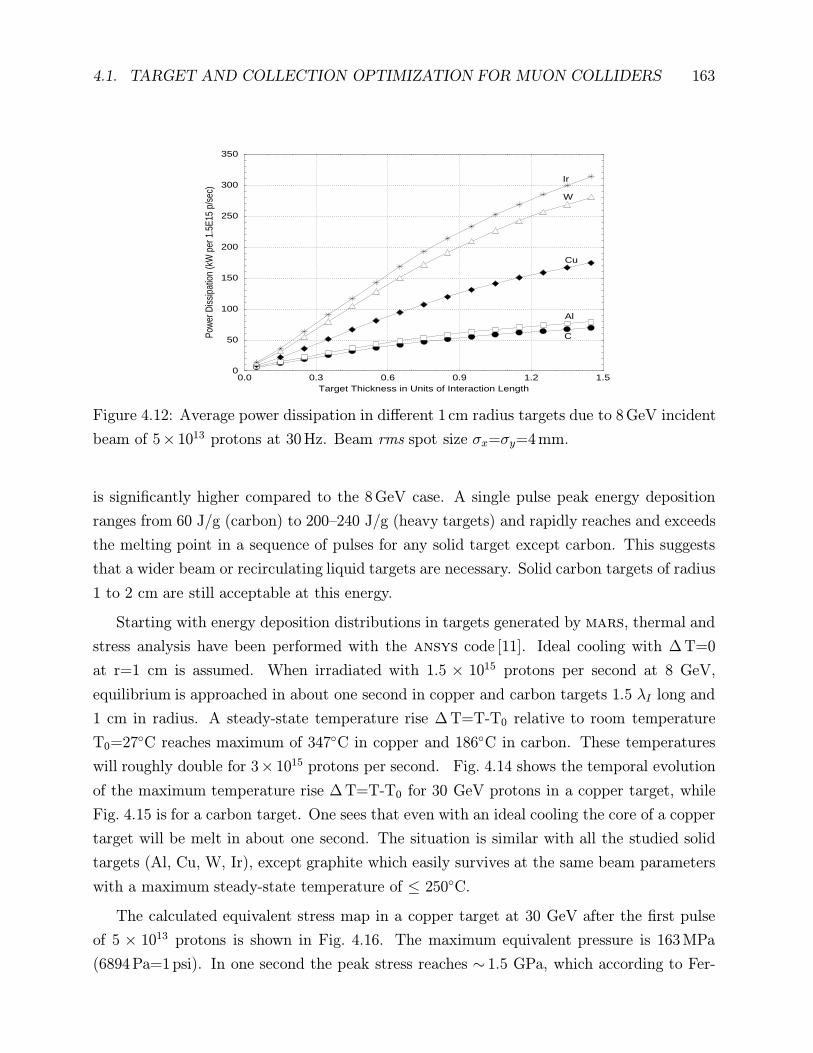
Figure 4.12: Average power dissipation in different 1 cm radius targets due to 8 GeV incident
beam of 5× 10¹³ protons at 30 Hz. Beam rms spot size σx=σy=4 mm.
is significantly higher compared to the 8 GeV case. A single pulse peak energy deposition
ranges from 60 J/g (carbon) to 200–240 J/g (heavy targets) and rapidly reaches and exceeds
the melting point in a sequence of pulses for any solid target except carbon. This suggests
that a wider beam or recirculating liquid targets are necessary. Solid carbon targets of radius
1 to 2 cm are still acceptable at this energy.
Starting with energy deposition distributions in targets generated by mars, thermal and
stress analysis have been performed with the ansys code [11]. Ideal cooling with ∆ T=0
at r=1 cm is assumed. When irradiated with 1.5 × 10¹⁵ protons per second at 8 GeV,
equilibrium is approached in about one second in copper and carbon targets 1.5 λI long and
1 cm in radius. A steady-state temperature rise ∆ T=T-T0 relative to room temperature
T0=27◦C reaches maximum of 347◦C in copper and 186◦C in carbon. These temperatures
will roughly double for 3× 10¹⁵ protons per second. Fig. 4.14 shows the temporal evolution
of the maximum temperature rise ∆ T=T-T0 for 30 GeV protons in a copper target, while
Fig. 4.15 is for a carbon target. One sees that even with an ideal cooling the core of a copper
target will be melt in about one second. The situation is similar with all the studied solid
targets (Al, Cu, W, Ir), except graphite which easily survives at the same beam parameters
with a maximum steady-state temperature of ≤ 250◦C.
The calculated equivalent stress map in a copper target at 30 GeV after the first pulse
of 5 × 10¹³ protons is shown in Fig. 4.16. The maximum equivalent pressure is 163 MPa
(6894 Pa=1 psi). In one second the peak stress reaches ∼ 1.5 GPa, which according to Fer-

164 CHAPTER 4. TARGETRY AND PION PRODUCTION
0.0 0.5 1.0 1.5 2.0 2.5 3.0Target Thickness in Units of Interaction Length
0
200
400
600
800
1000
1200
1400
Pow
er D
issi
patio
n (k
W p
er 1
.E15
p/s
ec) Hg
Cu
C
Figure 4.13: Average power dissipation in different 1 cm radius targets due to 30 GeV incident
beam of 5× 10¹³ protons at 30 Hz. Beam rms spot size σx=σy=4 mm.
miLab antiproton source experience is right at the limit of what can be accommodated in a
copper target. For tungsten alloys and all other solid targets except carbon, the situation is
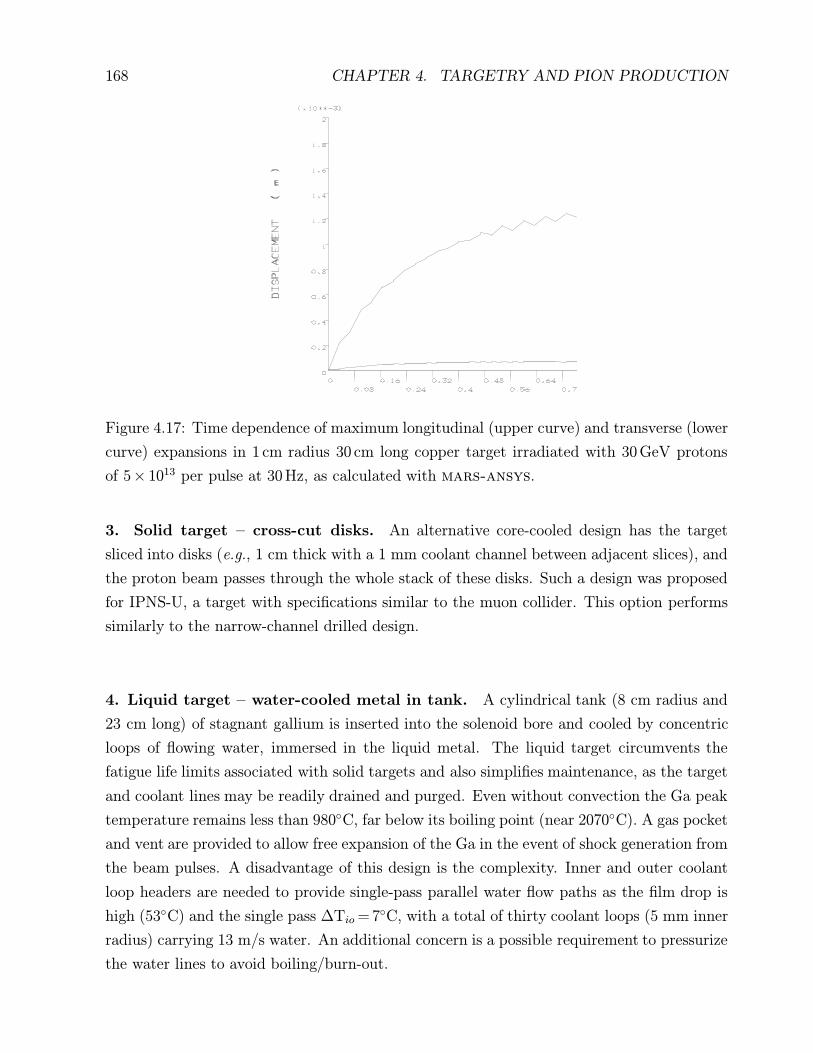
even worse. Another problem is the expansion of solid targets. For 30 GeV protons on a 2λI
(30 cm) long, 1 cm radius copper target, Fig. 4.17 shows the maximal deformation along the
target axis and in the radial direction at shower maximum as a function of irradiation time.
Maximal longitudinal and radial displacements after one second are∼1.3 mm and∼ 0.05 mm,
respectively.
There are then three possibilities for targetry at 30 GeV:
• medium or heavy solid targets – copper, tungsten alloys, iridium – using special tech-
niques to reduce a peak power density (beam sweeping, target rotation, larger beam
spot size);
• graphite target with a very low power dissipation (Fig. 4.13) and power density/temperature
rise (Fig. 4.15) and very good thermal properties; pion yield is lower by only 40% com-
pared to copper and heavier targets;
• liquid metal targets (gallium, mercury or lead) which recirculate to remove heat.
Target Options
In order to compare performance of different target options, a scoping survey was made of
a variety of possibilities. Solid targets ranged from high–Z (high melting point tungsten
4.1. TARGET AND COLLECTION OPTIMIZATION FOR MUON COLLIDERS 165
TEMP
2D thermal analysis, Copper target
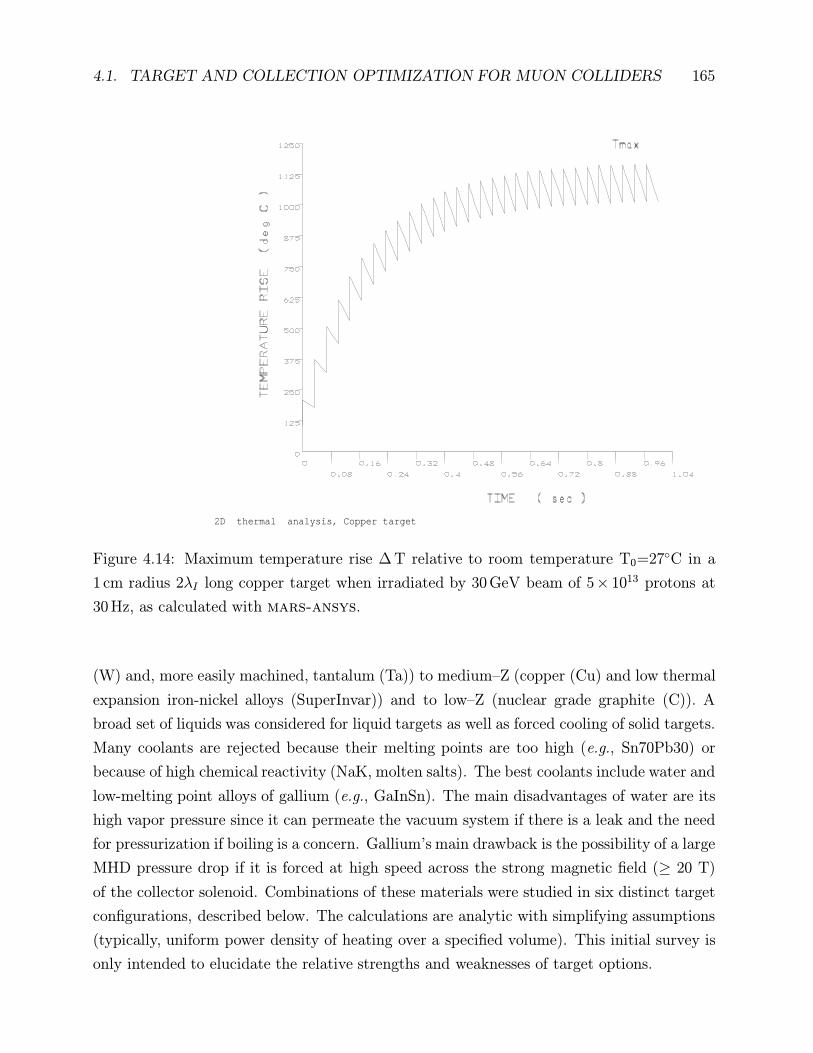
Figure 4.14: Maximum temperature rise ∆ T relative to room temperature T0=27◦C in a
1 cm radius 2λI long copper target when irradiated by 30 GeV beam of 5× 10¹³ protons at
30 Hz, as calculated with mars-ansys.
(W) and, more easily machined, tantalum (Ta)) to medium–Z (copper (Cu) and low thermal
expansion iron-nickel alloys (SuperInvar)) and to low–Z (nuclear grade graphite (C)). A
broad set of liquids was considered for liquid targets as well as forced cooling of solid targets.
Many coolants are rejected because their melting points are too high (e.g., Sn70Pb30) or
because of high chemical reactivity (NaK, molten salts). The best coolants include water and
low-melting point alloys of gallium (e.g., GaInSn). The main disadvantages of water are its
high vapor pressure since it can permeate the vacuum system if there is a leak and the need
for pressurization if boiling is a concern. Gallium’s main drawback is the possibility of a large
MHD pressure drop if it is forced at high speed across the strong magnetic field (≥ 20 T)
of the collector solenoid. Combinations of these materials were studied in six distinct target
configurations, described below. The calculations are analytic with simplifying assumptions
(typically, uniform power density of heating over a specified volume). This initial survey is
only intended to elucidate the relative strengths and weaknesses of target options.
166 CHAPTER 4. TARGETRY AND PION PRODUCTION
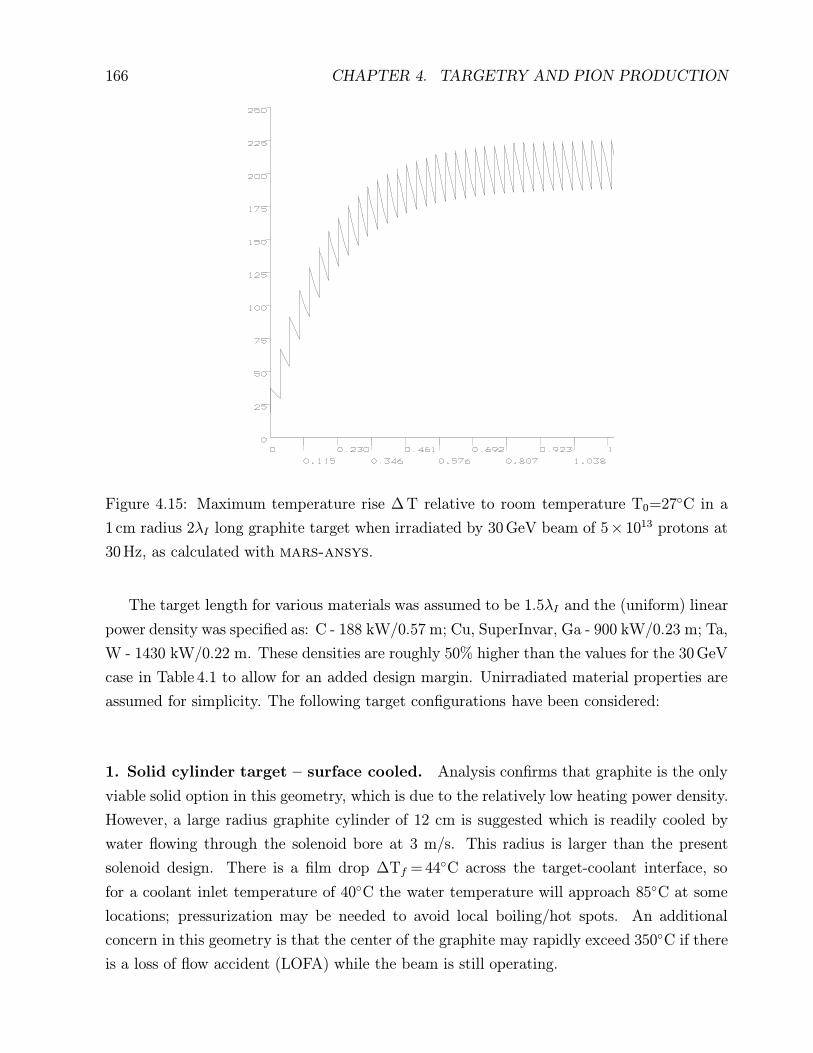
Figure 4.15: Maximum temperature rise ∆ T relative to room temperature T0=27◦C in a
1 cm radius 2λI long graphite target when irradiated by 30 GeV beam of 5× 10¹³ protons at
30 Hz, as calculated with mars-ansys.
The target length for various materials was assumed to be 1.5λI and the (uniform) linear
power density was specified as: C - 188 kW/0.57 m; Cu, SuperInvar, Ga - 900 kW/0.23 m; Ta,
W - 1430 kW/0.22 m. These densities are roughly 50% higher than the values for the 30 GeV
case in Table 4.1 to allow for an added design margin. Unirradiated material properties are
assumed for simplicity. The following target configurations have been considered:
1. Solid cylinder target – surface cooled. Analysis confirms that graphite is the only
viable solid option in this geometry, which is due to the relatively low heating power density.
However, a large radius graphite cylinder of 12 cm is suggested which is readily cooled by
water flowing through the solenoid bore at 3 m/s. This radius is larger than the present
solenoid design. There is a film drop ∆Tf = 44◦C across the target-coolant interface, so
for a coolant inlet temperature of 40◦C the water temperature will approach 85◦C at some
locations; pressurization may be needed to avoid local boiling/hot spots. An additional
concern in this geometry is that the center of the graphite may rapidly exceed 350◦C if there
is a loss of flow accident (LOFA) while the beam is still operating.

4.1. TARGET AND COLLECTION OPTIMIZATION FOR MUON COLLIDERS 167
ANSYS 5.1SEP 17 199611:11:07PLOT NO. 1NODAL SOLUTIONSTEP=1SUB =1TIME=0.100E-04SEQV (AVG)DMX =0.907E-05SMN =0.163E+08SMX =0.153E+09SMXB=0.163E+09
1
AAA
BBB
CC
B
BB
D
C
C
BB
C
D
DC C
DC
CC
D CC
D CC
D
D
C
CC
D C C
C C
C
CC
C
C
BBC
BB
B
BB
B B
B
BB
BB
AAAA
AAAA
MN
MX
A =0.334E+08B =0.676E+08C =0.102E+09D =0.136E+09
2D structural analysis, Copper target
Figure 4.16: Stress isocontours (Pa) in 1 cm radius 30 cm long copper target after a single
pulse of 5× 10¹³ protons at 30 GeV, as calculated with mars-ansys. Maximum value is
163 MPa.
2. Solid target – core cooled with narrow channels. Again graphite performs well,
but even high–Z materials are satisfactory for steady-state heat removal. In this geometry
a long bar (e.g., graphite, 57 cm long) is the target, and the power density is kept modest
by using a large cross-section (14 cm× 14 cm). Coolant channels (1 mm radius, spaced
7.5 mm apart) are drilled across the bar. This close spacing of coolant channels guarantees
a very small temperature variation through the target (∆T≈ 1◦C for graphite). Such small
∆T values minimize thermal stress and increase the lifetime against thermal fatigue. Water
supplied at a volumetric flow rate of 710 gpm (41 liter/s) is adequate to provide 10 m/s flow
through the channels, with a small film drop (1.6◦C) and a small inlet/outlet temperature
rise (∆Tio = 1◦C) for the water. There is evidently little need to consider pressurized water
for this application. Hole-plugging from various causes is a potential concern.
168 CHAPTER 4. TARGETRY AND PION PRODUCTION
Figure 4.17: Time dependence of maximum longitudinal (upper curve) and transverse (lower
curve) expansions in 1 cm radius 30 cm long copper target irradiated with 30 GeV protons
of 5× 10¹³ per pulse at 30 Hz, as calculated with mars-ansys.
3. Solid target – cross-cut disks. An alternative core-cooled design has the target
sliced into disks (e.g., 1 cm thick with a 1 mm coolant channel between adjacent slices), and
the proton beam passes through the whole stack of these disks. Such a design was proposed
for IPNS-U, a target with specifications similar to the muon collider. This option performs
similarly to the narrow-channel drilled design.
4. Liquid target – water-cooled metal in tank. A cylindrical tank (8 cm radius and
23 cm long) of stagnant gallium is inserted into the solenoid bore and cooled by concentric
loops of flowing water, immersed in the liquid metal. The liquid target circumvents the
fatigue life limits associated with solid targets and also simplifies maintenance, as the target
and coolant lines may be readily drained and purged. Even without convection the Ga peak
temperature remains less than 980◦C, far below its boiling point (near 2070◦C). A gas pocket
and vent are provided to allow free expansion of the Ga in the event of shock generation from
the beam pulses. A disadvantage of this design is the complexity. Inner and outer coolant
loop headers are needed to provide single-pass parallel water flow paths as the film drop is
high (53◦C) and the single pass ∆Tio = 7◦C, with a total of thirty coolant loops (5 mm inner
radius) carrying 13 m/s water. An additional concern is a possible requirement to pressurize
the water lines to avoid boiling/burn-out.
4.1. TARGET AND COLLECTION OPTIMIZATION FOR MUON COLLIDERS 169
5. Liquid target – self-cooled metal in tank. The target is simplified if a single
liquid serves both as the beam target and as the heat removal agent. Water cannot be ruled
out as a target option, but, like organic coolants, it has a relatively low boiling point and
suffers decomposition from radiolysis. Flowing liquid Ga does appear to be attractive. In
this design inlet and outlet headers flow the liquid parallel to the solenoid’s magnetic field
in order to minimize the MHD pressure drops. Within the steel tank (10 cm radius, so a
larger solenoid is again required) the Ga flows a short distance across the magnetic field at
a slow speed (0.041 m/s) calculated to minimize the MHD pressure drop (0.044 MPa), yet
adequate to keep the Ga outlet temperature less than 380◦C. Further optimization should
aim towards 200◦C as a goal, to minimize liquid metal corrosion concerns. The volumetric
flow rate of Ga, 17 gpm, is roughly that achieved for the silicon diffraction crystals of the
APS at Argonne National Laboratory. A thin ceramic coating (e.g., 10 µm Al2O3) inside
the steel tank will essentially eliminate the MHD pressure drop, permitting larger flow rates
and an even smaller temperature rise in the coolant.
6. Liquid target – free-falling metal curtain. The previous designs all require the
proton beam to pass through a window (e.g., Be or Ti) which offers additional concerns
regarding mechanical integrity and activation. Liquid metals, like gallium, have such low
vapor pressure that they might be left open to vacuum. In this scheme the inlet header
provides liquid Ga to an upper trough which supplies a falling curtain of liquid or droplets
to a collecting trough leading to the outlet header. The height and width of the falling shower
(6 cm× 1 cm) is an adequate target cross-section area for a proton beam with σx=σy=0.4 cm.
Issues here include MHD effects on falling Ga in a strong field and the possible generation
of high velocity droplets from beam-generated shocks. The gravity head in the lower trough
is adequate to allow flow rates of 17 gpm, with associated outlet temperatures of 380◦C.
Shock and Fatigue Damage to Target
Fatigue is not an issue for liquid target designs (except for the windows) but is a problem
for solid components. Graphite is certainly one of the best solid target material choices,
considering that the target receives up to a billion high energy density pulses per year.
Shock resistance is a different property - the ability to survive a single pulse. A figure
of merit which measures shock resistance is R = (SmCp)/(Eα), where Sm is the yield stress,
Cp is the heat capacity, E is Young’s modulus, and α is the thermal expansion coefficient.
If the peak energy density deposited in a short pulse is ε, then shock resistance is likely
whenever R � ε. Metals like Ta, W, and Cu have R in the range 20–40 kJ/kg, whereas
graphite has R= 900 kJ/kg and SuperInvar has R= 4500 kJ/kg, showing the superiority of
170 CHAPTER 4. TARGETRY AND PION PRODUCTION
these latter two candidates. By spreading the beam size to about 10 cm radius the peak beam
energy density might be reduced nearly two orders of magnitude to values of ε= 2.8 kJ/kg
for SuperInvar and ε= 0.9 kJ/kg for graphite. For these two materials R� ε, as desired.
Liquid targets offer different shock-generation concerns – cavitation, erosion, and conduit
cracking. Such concerns, if they are serious problems, might be mitigated by adding gas
bubbles to the liquid. Further work is needed to analyze this as well as other constraints:
target lifetime limitations (fatigue, shocks, corrosion, radiation swelling, etc.), target and
solenoid activation, off-normal events (LOFA, leaks, crack response), and reliability and ease
of maintenance. Whereas solid targets (C or SuperInvar) cooled with water appear viable
solutions, it would appear that the simplest approach is to use the coolant itself as the target.
If the MHD effects of liquid metals in strong magnetic fields can be easily handled, then Ga
appears superior to water as the liquid target choice. Window lifetime is an issue for any
closed-conduit liquid system; such concerns are minimized with a flowing Ga curtain open
to the vacuum – a design which, however, presents its own unique problems.
Solenoid Heating
Energy deposition in the primary 28 Tesla solenoid resulting from the intense radiation
environment around the target might cause quenching. Based on hybrid designs reported in
the literature, the solenoid is nominally assumed to consist of a normal-conducting ‘insert’,
starting at 7.5 cm radius, and a superconducting ‘outsert’ starting at 30 cm. The latter will
quench if the heat load becomes excessive.
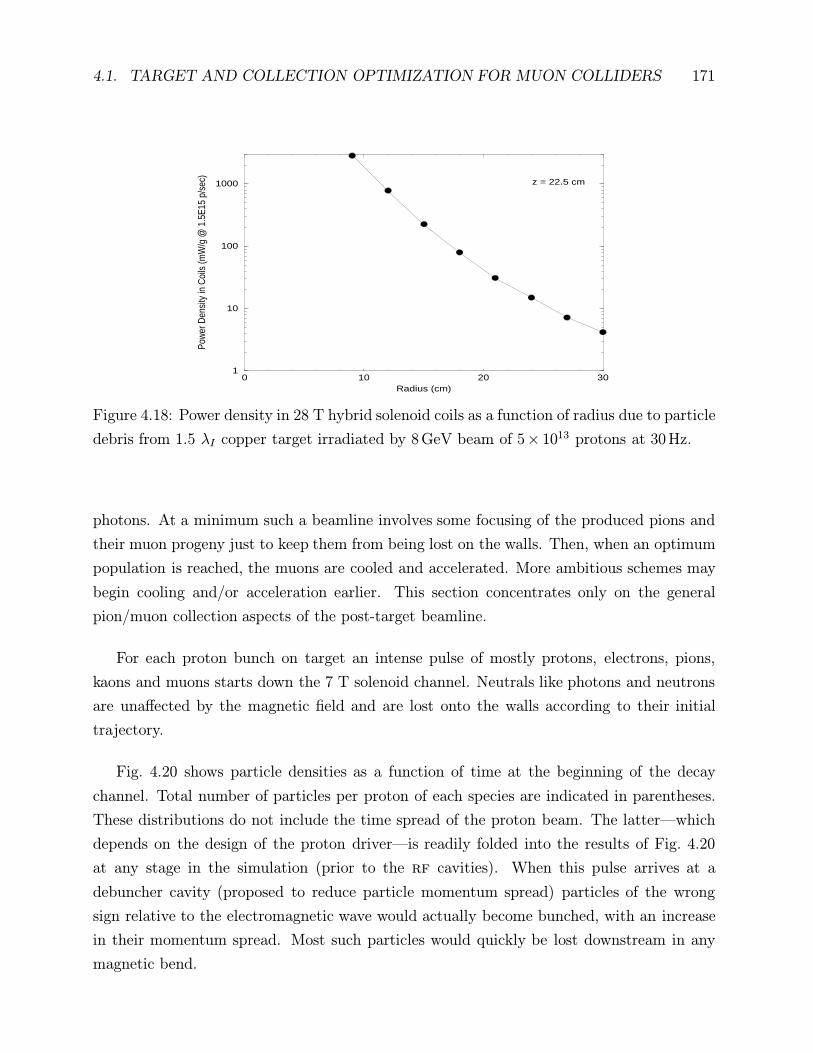
Fig. 4.18 shows average power density as a function of radius for 5×10¹³, 8 GeV protons
at 30 Hz on a 1.5 λI Cu target. The end of the target coincides with the end of the primary
solenoid. Instantaneous energy deposition and power density are highest at the downstream
end of the solenoid (see Fig. 4.19) and are lower everywhere for lower–Z targets.
For proton energies of 8 and 30 GeV, at 30 cm radius—where the superconducting
solenoid starts—both peak instantaneous energy deposition and the power density are close
but below the experimentally determined quench limits for FermiLab Tevatron dipoles (0.5 mJ/g
and 8 mW/g, respectively). For 1014 protons per pulse the power density will approximately
reach this quench limit for a copper target but not for carbon.
4.1.3 Pion and Muon Collection
Particles produced in the target are transported along a beamline which forms the first stage
of muon collection and acceleration IN route to the collider. Attention must also be paid
at this point to disposal of the other non-µ-producing particles, mostly nucleons, e±, and
4.1. TARGET AND COLLECTION OPTIMIZATION FOR MUON COLLIDERS 171
0 10 20 30Radius (cm)
1
10
100
1000
Pow
er D
ensi
ty in
Coi
ls (m
W/g
@ 1
.5E1
5 p/
sec) z = 22.5 cm
Figure 4.18: Power density in 28 T hybrid solenoid coils as a function of radius due to particle
debris from 1.5 λI copper target irradiated by 8 GeV beam of 5× 10¹³ protons at 30 Hz.
photons. At a minimum such a beamline involves some focusing of the produced pions and
their muon progeny just to keep them from being lost on the walls. Then, when an optimum
population is reached, the muons are cooled and accelerated. More ambitious schemes may
begin cooling and/or acceleration earlier. This section concentrates only on the general
pion/muon collection aspects of the post-target beamline.
For each proton bunch on target an intense pulse of mostly protons, electrons, pions,
kaons and muons starts down the 7 T solenoid channel. Neutrals like photons and neutrons
are unaffected by the magnetic field and are lost onto the walls according to their initial
trajectory.
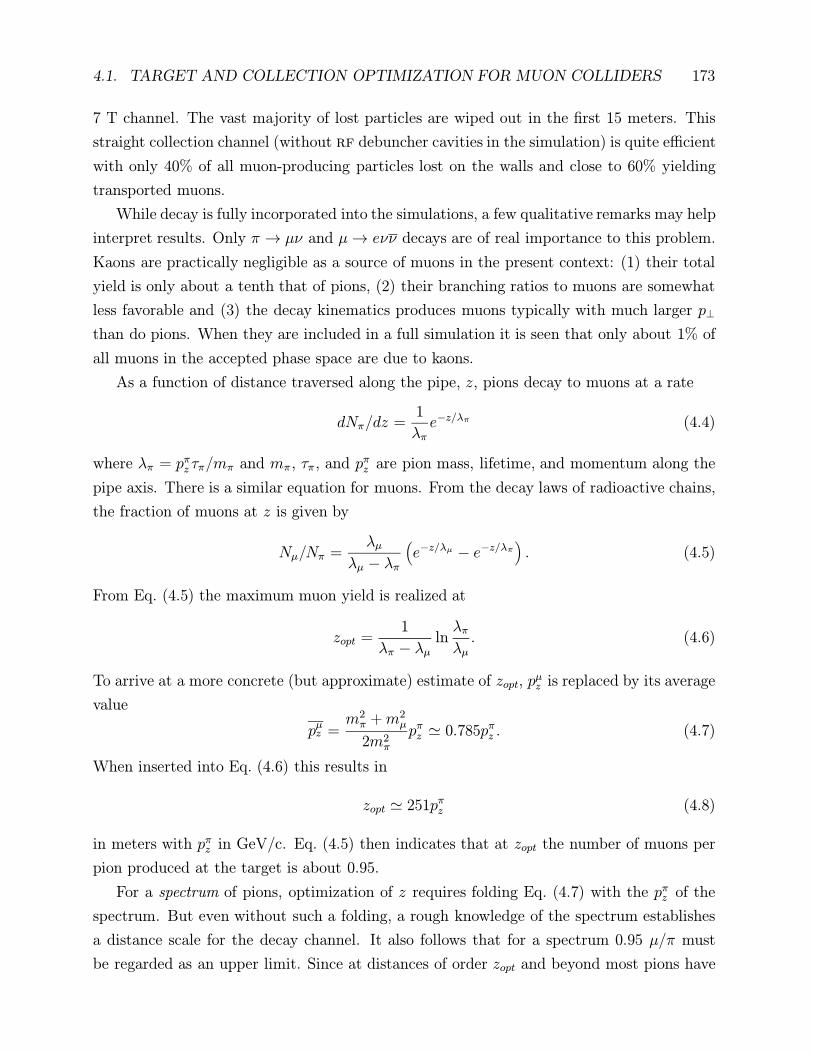
Fig. 4.20 shows particle densities as a function of time at the beginning of the decay
channel. Total number of particles per proton of each species are indicated in parentheses.
These distributions do not include the time spread of the proton beam. The latter—which
depends on the design of the proton driver—is readily folded into the results of Fig. 4.20
at any stage in the simulation (prior to the rf cavities). When this pulse arrives at a
debuncher cavity (proposed to reduce particle momentum spread) particles of the wrong
sign relative to the electromagnetic wave would actually become bunched, with an increase
in their momentum spread. Most such particles would quickly be lost downstream in any
magnetic bend.
172 CHAPTER 4. TARGETRY AND PION PRODUCTION
0 5 10 15 20 25 30Length (cm)
10-2
10-1
100
101
102
103
Ener
gy D
epos
ition
Den
sity
(mJ/
g pe
r 5.E
13 p
pp)
r=8 cm
r=11 cm
r=16 cm
r=21 cm
r=26 cm
r=31 cm
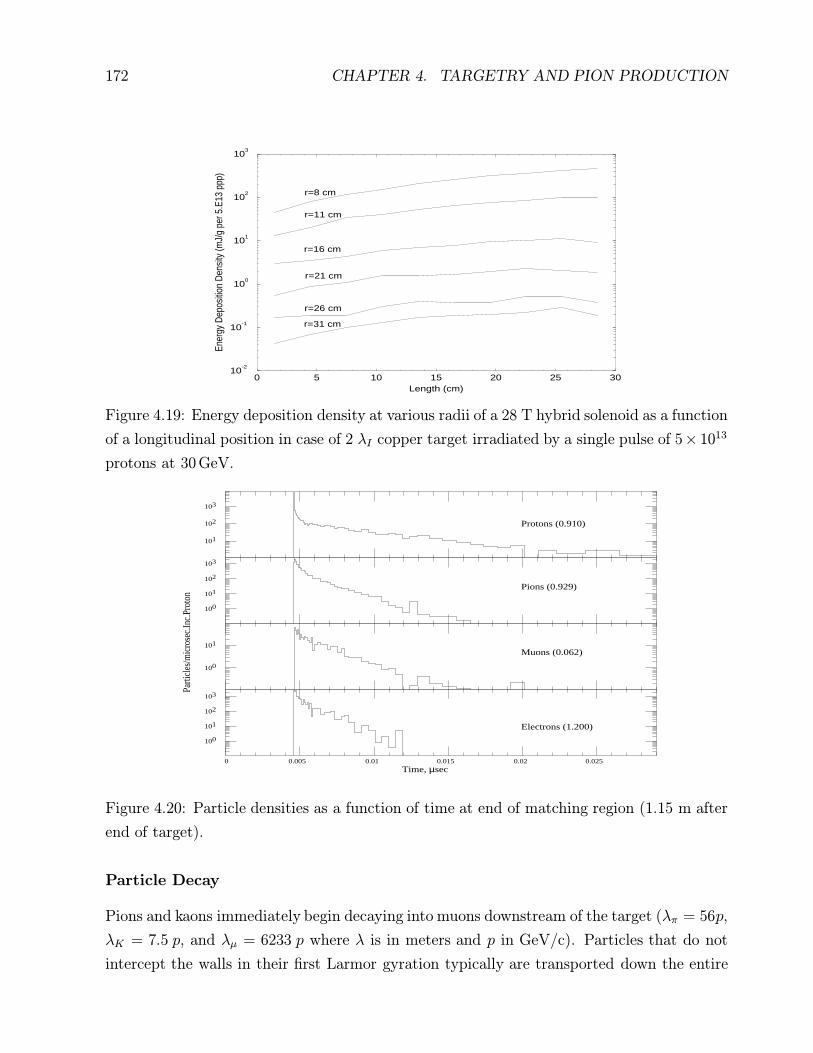
Figure 4.19: Energy deposition density at various radii of a 28 T hybrid solenoid as a function
of a longitudinal position in case of 2 λI copper target irradiated by a single pulse of 5× 10¹³
protons at 30 GeV.
Parti
cles
/mic
rose
c.In
c.Pr
oton
Time, µsec
101
102
103
Protons (0.910)
100
101
102
103
Pions (0.929)
100
101
Muons (0.062)
0 0.005 0.01 0.015 0.02 0.025
100
101
102
103
Electrons (1.200)
Figure 4.20: Particle densities as a function of time at end of matching region (1.15 m after
end of target).
Particle Decay
Pions and kaons immediately begin decaying into muons downstream of the target (λπ = 56p,
λK = 7.5 p, and λµ = 6233 p where λ is in meters and p in GeV/c). Particles that do not
intercept the walls in their first Larmor gyration typically are transported down the entire
4.1. TARGET AND COLLECTION OPTIMIZATION FOR MUON COLLIDERS 173
7 T channel. The vast majority of lost particles are wiped out in the first 15 meters. This
straight collection channel (without rf debuncher cavities in the simulation) is quite efficient
with only 40% of all muon-producing particles lost on the walls and close to 60% yielding
transported muons.
While decay is fully incorporated into the simulations, a few qualitative remarks may help
interpret results. Only π → µν and µ→ eνν decays are of real importance to this problem.
Kaons are practically negligible as a source of muons in the present context: (1) their total
yield is only about a tenth that of pions, (2) their branching ratios to muons are somewhat
less favorable and (3) the decay kinematics produces muons typically with much larger p⊥
than do pions. When they are included in a full simulation it is seen that only about 1% of
all muons in the accepted phase space are due to kaons.
As a function of distance traversed along the pipe, z, pions decay to muons at a rate
dNπ/dz =1
λπe−z/λπ (4.4)
where λπ = pπz τπ/mπ and mπ, τπ, and pπz are pion mass, lifetime, and momentum along the
pipe axis. There is a similar equation for muons. From the decay laws of radioactive chains,
the fraction of muons at z is given by
Nµ/Nπ =λµ
λµ − λπ
(e−z/λµ − e−z/λπ
). (4.5)
From Eq. (4.5) the maximum muon yield is realized at
zopt =1
λπ − λµlnλπ
λµ. (4.6)
To arrive at a more concrete (but approximate) estimate of zopt, pµz is replaced by its average
value
pµz =m2π +m2
µ
2m2π
pπz ' 0.785pπz . (4.7)
When inserted into Eq. (4.6) this results in
zopt ' 251pπz (4.8)
in meters with pπz in GeV/c. Eq. (4.5) then indicates that at zopt the number of muons per
pion produced at the target is about 0.95.
For a spectrum of pions, optimization of z requires folding Eq. (4.7) with the pπz of the
spectrum. But even without such a folding, a rough knowledge of the spectrum establishes
a distance scale for the decay channel. It also follows that for a spectrum 0.95 µ/π must
be regarded as an upper limit. Since at distances of order zopt and beyond most pions have
174 CHAPTER 4. TARGETRY AND PION PRODUCTION
z, meter
Muo
ns p
er in
c pr
oton
0 100 200 300 4000.0
0.1
0.2
0.3
0.4
0.5
µ+
µ-
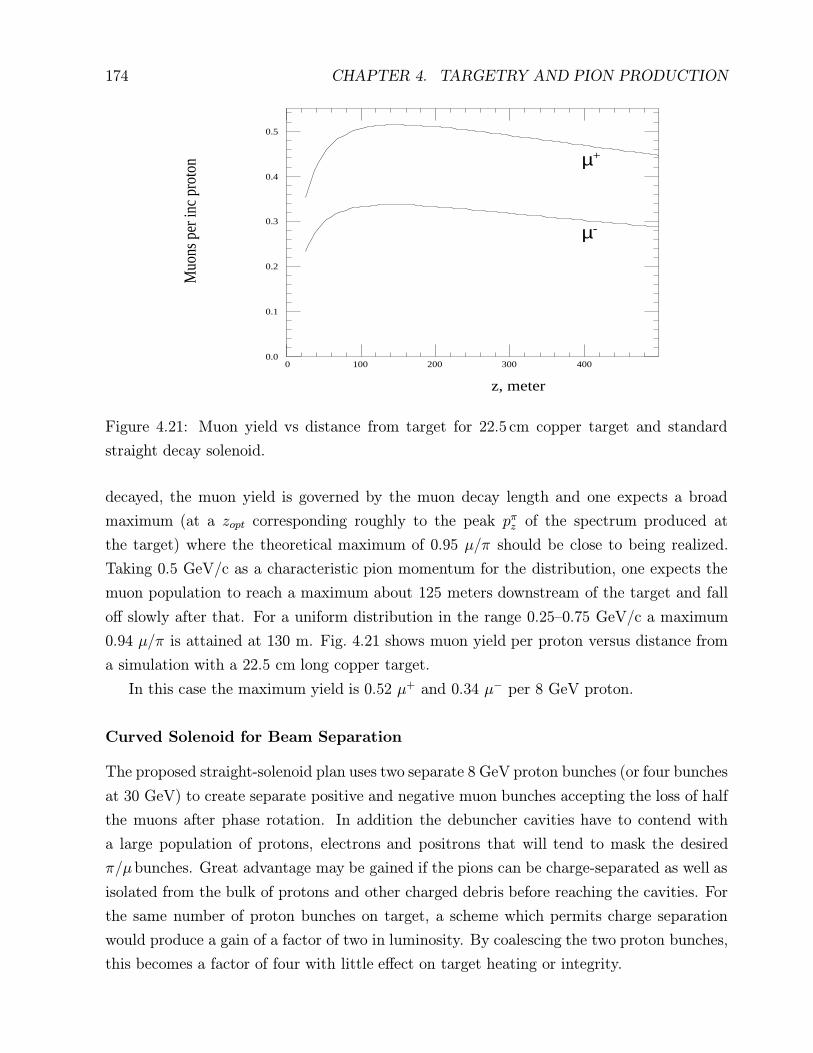
Figure 4.21: Muon yield vs distance from target for 22.5 cm copper target and standard
straight decay solenoid.
decayed, the muon yield is governed by the muon decay length and one expects a broad
maximum (at a zopt corresponding roughly to the peak pπz of the spectrum produced at
the target) where the theoretical maximum of 0.95 µ/π should be close to being realized.
Taking 0.5 GeV/c as a characteristic pion momentum for the distribution, one expects the
muon population to reach a maximum about 125 meters downstream of the target and fall
off slowly after that. For a uniform distribution in the range 0.25–0.75 GeV/c a maximum
0.94 µ/π is attained at 130 m. Fig. 4.21 shows muon yield per proton versus distance from
a simulation with a 22.5 cm long copper target.
In this case the maximum yield is 0.52 µ+ and 0.34 µ− per 8 GeV proton.
Curved Solenoid for Beam Separation
The proposed straight-solenoid plan uses two separate 8 GeV proton bunches (or four bunches
at 30 GeV) to create separate positive and negative muon bunches accepting the loss of half
the muons after phase rotation. In addition the debuncher cavities have to contend with
a large population of protons, electrons and positrons that will tend to mask the desired
π/µbunches. Great advantage may be gained if the pions can be charge-separated as well as
isolated from the bulk of protons and other charged debris before reaching the cavities. For
the same number of proton bunches on target, a scheme which permits charge separation
would produce a gain of a factor of two in luminosity. By coalescing the two proton bunches,
this becomes a factor of four with little effect on target heating or integrity.
4.1. TARGET AND COLLECTION OPTIMIZATION FOR MUON COLLIDERS 175
The solenoid causes all charged particles to execute Larmor gyrations as they travel down
the decay line. As is well known from plasma physics, a gradient in the magnetic field or a
curvature in the field produces drifts of the particle guide centers. Drift directions for this
case are opposite for oppositely charged particles. Drift velocities depend quadratically on
particle velocity components. This is exploited here by introducing a gentle curvature to the
7 T decay solenoid [3].
In the decay line, most particles moving in the curved solenoid field have a large velocity
parallel to the magnetic field (vs of order c) and a smaller perpendicular velocity (v⊥ ' 0.3 c
or less) associated with their Larmor gyration. In the curved solenoid the vs motion gives
rise to a centrifugal force and an associated ‘curvature drift’ perpendicular to both this force
and the magnetic field. The field in the curved solenoid also has a gradient (field lines are
closer near the inner radius than near the outer radius) resulting in an added ‘gradient drift’
in the same direction as the curvature drift. Averaged over a Larmor gyration, the combined
drift velocities can be written as [12]
~vR + ~v∇B =mγ
q
R×B
R2B2(v2s +
1
2v2⊥), (4.9)
where mγ is the relativistic particle mass, q the particle charge, and R is the radius of
curvature of the solenoid with central field B. Note that in the present application the
curvature drift (∝ v2s) is typically much larger than the gradient drift (∝ v2
⊥/2). This is in
contrast to a plasma where these contributions are comparable.
The drift velocity changes sign according to charge so positive and negative pions become
transversely separated. For unit charge and for R ⊥ B the magnitude of the drift velocity
can be written in convenient units as
βd =E(β2s + 1
2β2⊥
)0.3RB
, (4.10)
where E is particle energy in GeV, R is in meters and B in Tesla. The total drift displacement,
D, experienced by a particle moving for a distance, s, along the field follows immediately
from Eq. (4.10)
D =1
0.3B
s
R
p2s + 1
2p2⊥
ps(4.11)
with D in meters, B in Tesla and momenta in GeV/c. Note that only the ratio s/R appears
in Eq. (4.11) which corresponds to the angle traversed along the curved sole-
noid. A typical 0.5 GeV pion (p⊥ � ps) in a 7 T solenoid with R = 25 m has a drift velocity
of about 10−2c. After moving 20 meters downstream in the solenoid, a 0.5 GeV positive and
negative pion should be separated by about 35 cm.
176 CHAPTER 4. TARGETRY AND PION PRODUCTION
The present study considers only circularly curved solenoids. Here the curvature and
the ∇×B= 0 condition requires the field, which is nonzero only along φ (i.e. along the
axis of the curved beampipe) to have a 1R
-dependence. This is readily incorporated in the
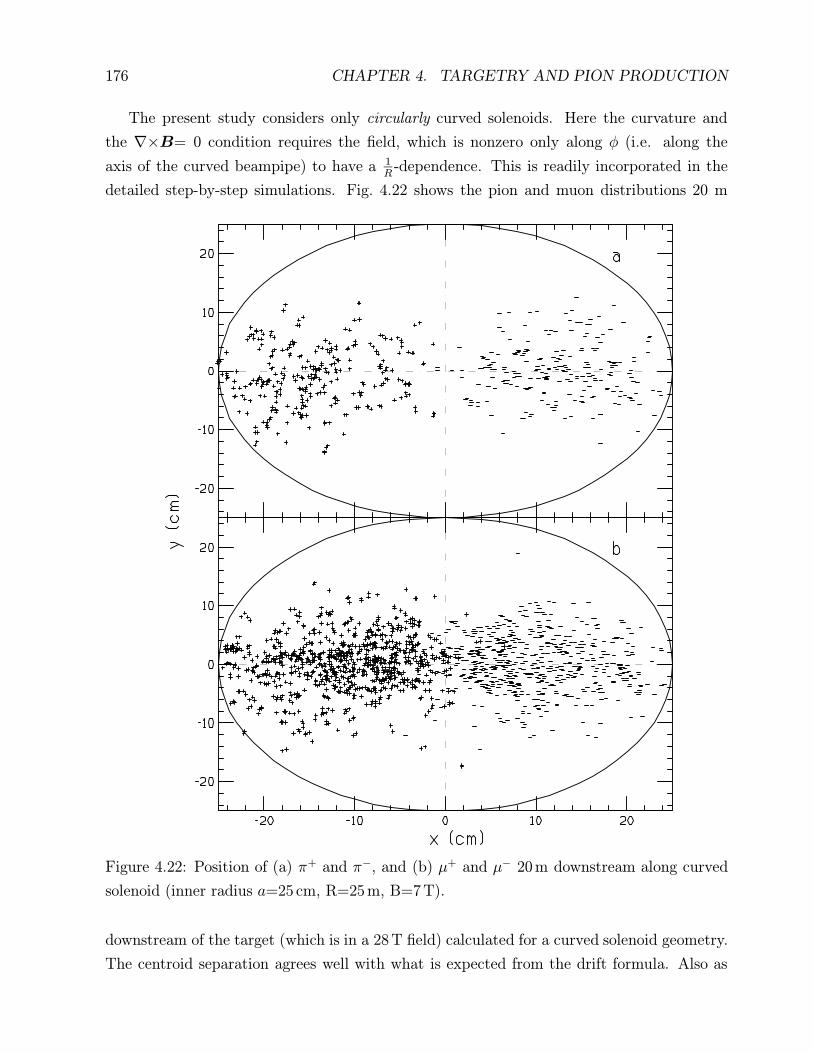
detailed step-by-step simulations. Fig. 4.22 shows the pion and muon distributions 20 m
Figure 4.22: Position of (a) π+ and π−, and (b) µ+ and µ− 20 m downstream along curved
solenoid (inner radius a=25 cm, R=25 m, B=7 T).
downstream of the target (which is in a 28 T field) calculated for a curved solenoid geometry.
The centroid separation agrees well with what is expected from the drift formula. Also as
4.1. TARGET AND COLLECTION OPTIMIZATION FOR MUON COLLIDERS 177
expected, higher energy pions are shifted farther and low energy pions less. Decay muons
created up to this point are separated by a comparable margin. At this point one could
place a septum in the solenoid channel and send the two beams down separate lines to their
own debunching cavities. Note the pion and muon transverse beam sizes are not excessively
large after charge separation.
The curved solenoid also serves well to rid the beamline of neutral particles and most
of the remnant protons after the target. Neutrals like photons and neutrons intercept the
curved solenoid with their straight trajectories and deposit their energy over a large area.
Beam protons which underwent little or no interaction in the target have such large forward
momenta that they are unable to complete one full gyration before intercepting the curved
wall downstream. Hence Larmor-averaged drift formulae cannot be applied.
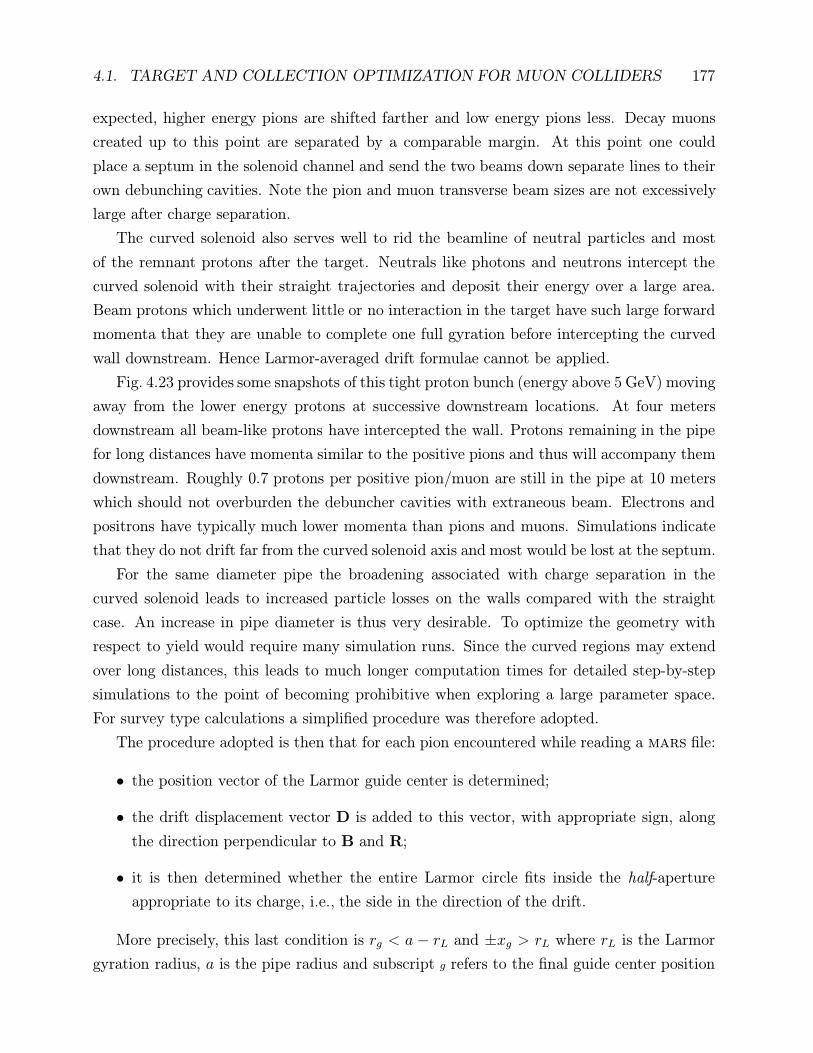
Fig. 4.23 provides some snapshots of this tight proton bunch (energy above 5 GeV) moving
away from the lower energy protons at successive downstream locations. At four meters
downstream all beam-like protons have intercepted the wall. Protons remaining in the pipe
for long distances have momenta similar to the positive pions and thus will accompany them
downstream. Roughly 0.7 protons per positive pion/muon are still in the pipe at 10 meters
which should not overburden the debuncher cavities with extraneous beam. Electrons and
positrons have typically much lower momenta than pions and muons. Simulations indicate
that they do not drift far from the curved solenoid axis and most would be lost at the septum.
For the same diameter pipe the broadening associated with charge separation in the
curved solenoid leads to increased particle losses on the walls compared with the straight
case. An increase in pipe diameter is thus very desirable. To optimize the geometry with
respect to yield would require many simulation runs. Since the curved regions may extend
over long distances, this leads to much longer computation times for detailed step-by-step
simulations to the point of becoming prohibitive when exploring a large parameter space.
For survey type calculations a simplified procedure was therefore adopted.
The procedure adopted is then that for each pion encountered while reading a mars file:
• the position vector of the Larmor guide center is determined;
• the drift displacement vector D is added to this vector, with appropriate sign, along
the direction perpendicular to B and R;
• it is then determined whether the entire Larmor circle fits inside the half-aperture
appropriate to its charge, i.e., the side in the direction of the drift.
More precisely, this last condition is rg < a− rL and ±xg > rL where rL is the Larmor
gyration radius, a is the pipe radius and subscript g refers to the final guide center position
178 CHAPTER 4. TARGETRY AND PION PRODUCTION
Figure 4.23: Scatter plot of x,y coordinates of protons above 5 GeV while traversing curved
solenoid. Distance along center of curved solenoid is in upper right hand corner.
with the sign of xg dependent on particle charge. If a pion meets these criteria it is assumed
to contribute to the yield.
The study of pion/muon yield in a circularly curved beampipe (starting immediately
after the target) with constant central field can thus be reduced to a problem with just
three parameters B, s/R, and a. Some sensible range of values can thus be readily explored
over a reasonably dense grid. An optimization based on yields alone is perhaps somewhat
unrealistic. A measure of how effectively one can separate the two components into different
beamlines is provided by computing the centroid of each distribution as well as its rms radius.
4.1. TARGET AND COLLECTION OPTIMIZATION FOR MUON COLLIDERS 179
Computation is very fast and readily repeated for different sets of parameters to perform a
more complete optimization.
A more realistic scenario starts with a 28 T field surrounding the target followed by a
curved matching region which accomplishes simultaneously both transition to lower field and
charge separation. The changing field causes an adiabatic decline in p⊥ according to
p2⊥f = p2
⊥i
Bf
Bi
(4.12)
along with a corresponding change in ps so as to conserve total p. Subscript i refers to
initial and f to final values of B and p⊥, i.e., those prevailing at S, the total distance along
the central field line. Ignoring the other field components due to the declining field (cf.
Eq. (4.3)), the total drift becomes
D =∫vDdt =
∫vDds
vs=∫ S
0
1
300BR
p2s + 1
2p2⊥
psds, (4.13)
where now B, ps and p⊥ all depend on s. Assuming a linear decline of the central field
B = Bi(1− as), and the dependence of ps and p⊥ on s this entails, one obtains
D =S
300(Bi −Bf )Rp0
[ln
(p0 − psf )(p0 + psi)
(p0 + psf )(p0 − psi)+ psf − psi
], (4.14)
where p0 is the total momentum of the pion.
Thus for fixed Bi the problem remains confined to three parameters: Bf , S/R, and a.
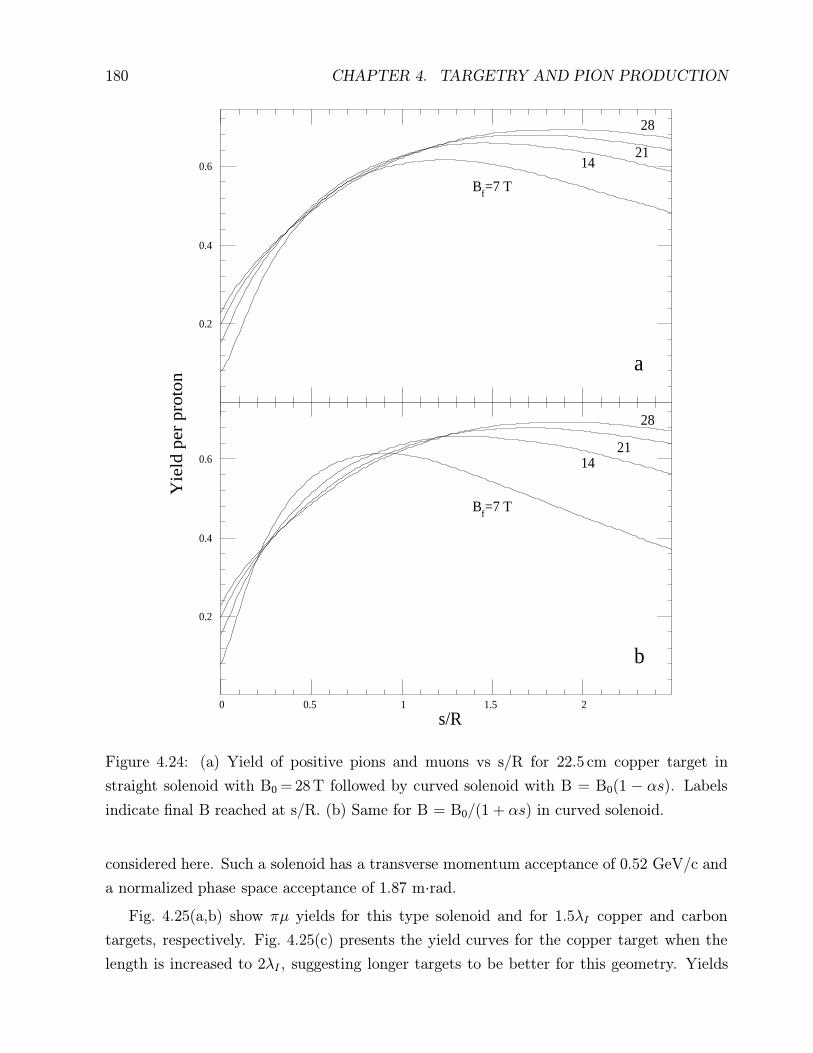
Note also that the Larmor radius changes with s here. Fig. 4.24(a) shows π+µ+ yield in a
curved solenoid with a constant 50 cm pipe radius for different values of the final magnetic
field at the end of the matching region for a 22.5 cm long copper target. Eq. (4.13) can
also be applied to a field having the B0/(1 + αs) dependence. Again an expression for
D, though somewhat lengthier than Eq. (4.14), is readily obtained and again the problem
remains one of the same three parameters. For comparison, Fig. 4.24(b) shows π+µ+ yield
for the 1/(1 + αs) field dependence with everything else as in Fig. 4.24(a). Note that the
yields peak at somewhat smaller s/R.
Because of the advanced magnet technology required for very high field (> 15T) solenoids,
it is of interest to investigate yields obtained when lower magnetic fields prevail throughout
the entire geometry including the target. To keep matters simple a constant 7 T field
and 50 cm solenoid radius is assumed—which might be considered state-of-the-art [13]. The
solenoid is straight for the target portion, then curves to affect the desired charge separation,
then straightens again to form the decay channel. In this last portion separation of plus
and minus beams at a septum is to take place but details of this implementation are not
180 CHAPTER 4. TARGETRY AND PION PRODUCTION
s/R
Yie
ld p
er p
roto
n
0.2
0.4
0.6
Bf=7 T
1421
28
a
0 0.5 1 1.5 2
0.2
0.4
0.6
Bf=7 T
1421
28
b
Figure 4.24: (a) Yield of positive pions and muons vs s/R for 22.5 cm copper target in
straight solenoid with B0 = 28 T followed by curved solenoid with B = B0(1 − αs). Labels
indicate final B reached at s/R. (b) Same for B = B0/(1 + αs) in curved solenoid.
considered here. Such a solenoid has a transverse momentum acceptance of 0.52 GeV/c and
a normalized phase space acceptance of 1.87 m·rad.
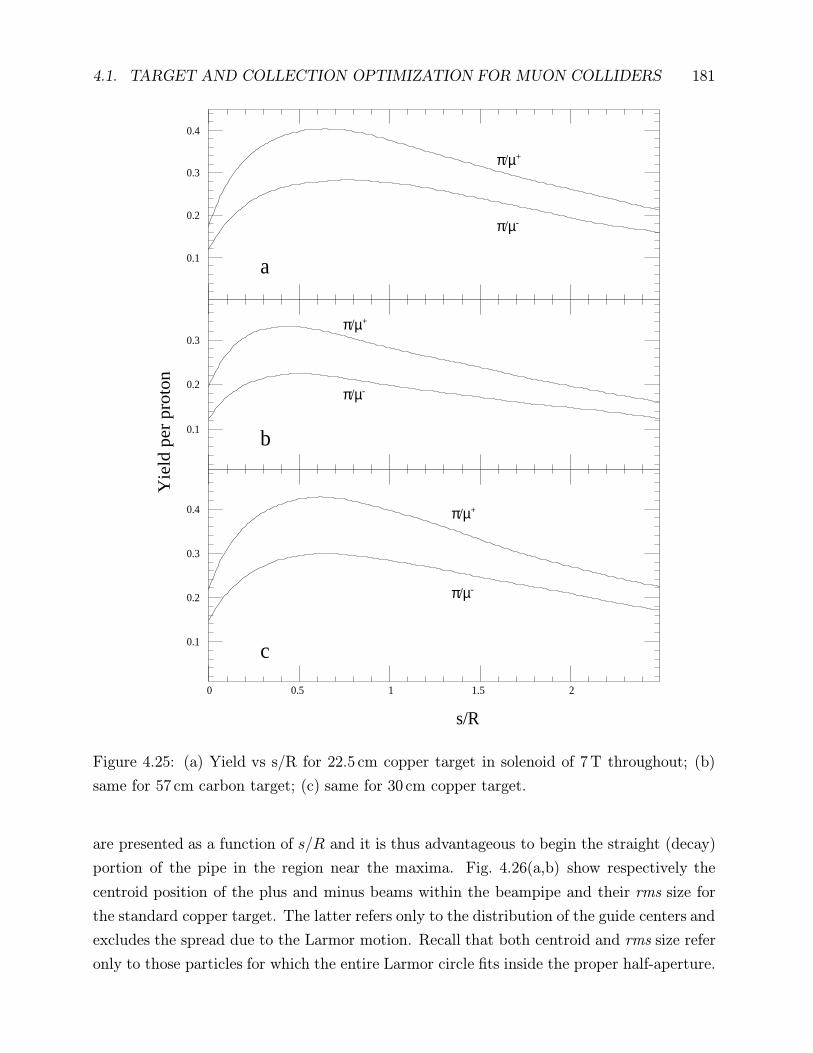
Fig. 4.25(a,b) show πµ yields for this type solenoid and for 1.5λI copper and carbon
targets, respectively. Fig. 4.25(c) presents the yield curves for the copper target when the
length is increased to 2λI , suggesting longer targets to be better for this geometry. Yields
4.1. TARGET AND COLLECTION OPTIMIZATION FOR MUON COLLIDERS 181
s/R
Yie
ld p
er p
roto
n
0.1
0.2
0.3
0.4
a
π/µ+
π/µ-
0.1
0.2
0.3
b
π/µ+
π/µ-
0 0.5 1 1.5 2
0.1
0.2
0.3
0.4
c
π/µ+
π/µ-
Figure 4.25: (a) Yield vs s/R for 22.5 cm copper target in solenoid of 7 T throughout; (b)
same for 57 cm carbon target; (c) same for 30 cm copper target.
are presented as a function of s/R and it is thus advantageous to begin the straight (decay)
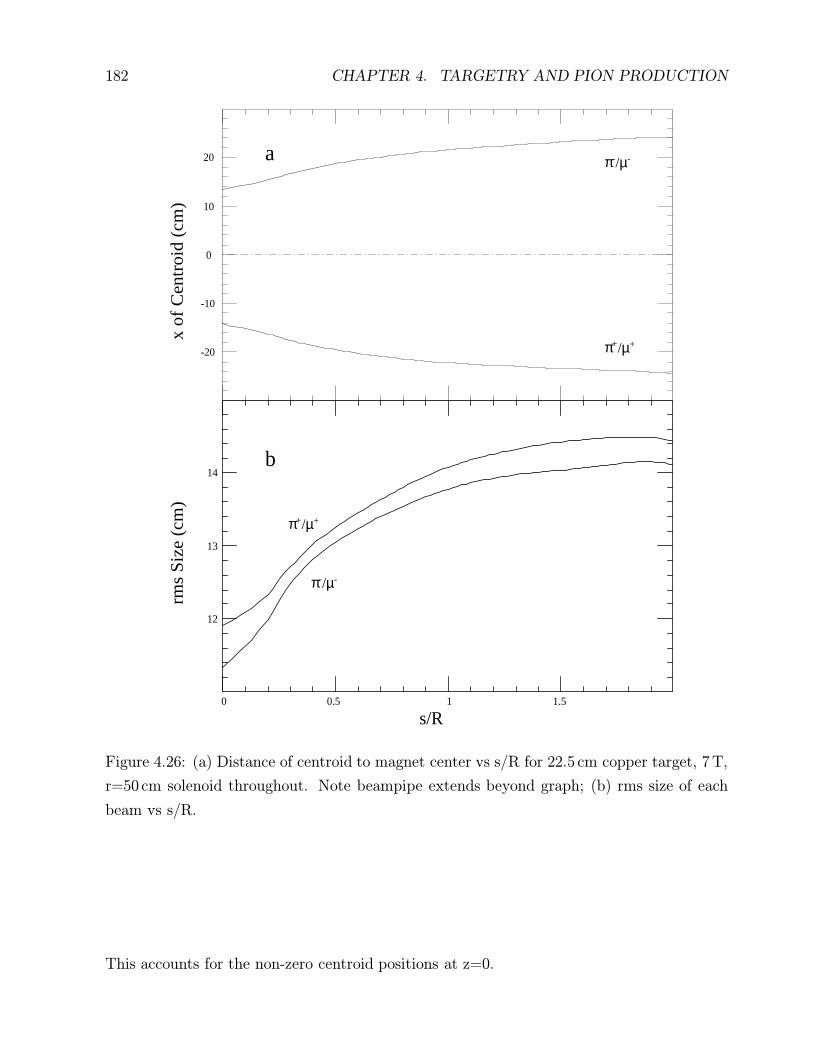
portion of the pipe in the region near the maxima. Fig. 4.26(a,b) show respectively the
centroid position of the plus and minus beams within the beampipe and their rms size for
the standard copper target. The latter refers only to the distribution of the guide centers and
excludes the spread due to the Larmor motion. Recall that both centroid and rms size refer
only to those particles for which the entire Larmor circle fits inside the proper half-aperture.
182 CHAPTER 4. TARGETRY AND PION PRODUCTION
s/R
x of
Cen
troi
d (c
m)
-20
-10
0
10
20 a π-/µ-
π+/µ+
rms
Siz
e (c
m)
0 0.5 1 1.5
12
13
14b
π-/µ-
π+/µ+
Figure 4.26: (a) Distance of centroid to magnet center vs s/R for 22.5 cm copper target, 7 T,
r=50 cm solenoid throughout. Note beampipe extends beyond graph; (b) rms size of each
beam vs s/R.
This accounts for the non-zero centroid positions at z=0.
4.1. TARGET AND COLLECTION OPTIMIZATION FOR MUON COLLIDERS 183
4.1.4 Conclusions
The target studies show that while a 1 to 2 λI copper target is optimum for yield, lower-Z
targets are not much worse—about 20% depending on the collection geometry for 8 GeV
protons. Hence lower-Z targets, because of the lower energy deposition associated with them,
may still be the targets of choice. A 30 GeV proton beam is not preferred on the basis of
yield per megawatt of power deposited in the target, but may be needed to make short (1
nsec) bunches. The use of tritons instead of protons at the same momentum can increase
pion yield per projectile on target by up to a factor of two.
Target heating is very severe in high Z materials at 30 GeV. Spreading the beam diameter
to a large fraction of the solenoid bore generally helps by lowering the average heating power
density and the shock energy density deposition. A variety of configurations appear to satisfy
the steady-state heat removal target requirements. Microchannel cooling, large diameter
beams and targets or recirculating liquid targets may be used to deal with the severe target
heating problems in high Z targets. Solid carbon targets however are still workable with
adequate cooling. In some of the considered target configurations the transverse size of the
target assembly exceeds the 15 cm inner solenoid diameter. In subsequent designs some
compromise is then required between the solenoid and target parameters. Lower energy
proton beams at lower repetition rates (e.g., 8 GeV, 15 Hz) would also help reduce target
powers substantially.
Quenching due to energy deposition in superconducting solenoids near the target is a
problem only for high-field/small-diameter magnets and high Z targets. Lower field solenoids
with larger diameter are much less likely to quench and also pose less technological difficul-
ties. While the yields associated with them are somewhat lower there certainly exists some
reasonable trade-off.
The simulations confirm the superiority of muon collection with the solenoid scheme in
this energy regime. Total yields of about 0.5 muons or more per proton of either charge
appear to be obtainable. Considerations of π/µ decay indicate a collection limit of about
0.95 muons per pion. Kaons appear to contribute far less than their numbers to the usable
muon flux and are practically negligible in this application. The pion momentum spectrum
after the target generated by either 8 GeV or 30 GeV protons peaks in the range 0.2 to
0.3 GeV/c in MARS and DPMJET. The collection system with phase rotation tends to
favor the lower energies and most muons are expected to be in the 0.2 to 0.5 GeV/c range
as discussed in the next chapter.
Charge separation by curved solenoids practically doubles the number of muons collected
and appears to be beneficial in disposing of the host of unwanted particles generated in the
184 CHAPTER 4. TARGETRY AND PION PRODUCTION
target along with the through-going proton beam. Yields are sensitive to field strengths
and solenoid diameter as well as to the s/R parameter—which indicates where to end the
curvature and send the beams their separate ways. The curved solenoid is not part of
the reference design, but this study indicates there certainly are ways to perform charge
separation and beam disposal after the target.
4.2 Design Studies of Capture Magnet Systems
4.2.1 Introduction
The capture solenoid system includes the following components: 1) the 20 Tesla solenoid
that captures the various particles that result from the proton beam interaction with the
target; and 2) a transition solenoid system that transfers the captured particles from the 20
Tesla capture induction to a 5 Tesla transport induction that will be used through out the
phase rotation process.
4.2.2 The Capture Solenoid System
The basic capture system consists of a high field solenoid to capture all pions with a transverse
momentum of less than 225 MeV. The high field in the capture region changes to a lower
field so that the cloud of particles, which comes from the target can be transported to and
through the phase rotation system. Capture of the pions from the target can occur in a
solenoid of any induction provided the solenoid bore is large enough[14, 15]. In order to
make the capture bore and the bore of the phase rotation solenoids small enough, pion
capture has to occur at a magnetic induction in the range of 20 - 30 T. The induction of
solenoids used to transport the pions and muons in the phase rotation system has should be
in the 3 to 7 T range.
The capture induction was set at 20 T. The selection of 20 T for the capture induction
allows one to use a Bitter type water cooled solenoid alone or as part of a hybrid magnet
system in conjunction with a superconducting outsert solenoid using niobium titanium. The
hybrid magnet option was selected for the following reasons: 1) The operating power for the
hybrid solenoid is substantially lower if a superconducting outsert is used. 2) The current
density in the water cooled Bitter solenoid can be low enough to insure that its life time will
be long (A reasonable life time goal might be 25000 hours.) 3) Additional space inside the
Bitter solenoid can be made available for a heavy metal water cooled shield. This reduces
the incident energy from the target into the water cooled solenoid and the surrounding
4.2. DESIGN STUDIES OF CAPTURE MAGNET SYSTEMS 185
superconducting solenoid.
The inside radius of the capture solenoid is inversely proportional to the induction of the
capture solenoid and is directly proportional to the transverse momentum of the particles
captured from the target. The length of the capture solenoid is approximately proportional
to the length of the target (in our case, about 1.4 to 1.6 times the length of the target).
The most efficient production of pions comes from a target that is about 1.5 interaction
lengths long. A carbon target would be about 600 mm long while a copper target would be
about 225 mm long. High Z targets such as those made from mercury or gold would be even
shorter. High Z targets will produce more pions, but they also absorb more of the incident
energy from the proton beam. There is a trade off between pion production and the ability
of the target to survive being struck by the incident proton beam.
The inner clear bore radius of the capture solenoid was set at 75 mm. At 20 T, particles
with a transverse momentum of about 225 MeV/c can be captured. With proper target
selection a large number of low energy pions will be created. Depending on the model used
for particle production from the target, the number of pions produced by the target can
range from 1.0 to 1.5 pions per incident 30 GeV proton on the target. Many of these pions
will be at energies around 200 MeV. Most of these low energy pions will have a transverse
momentum less than 200 MeV/c and thus will be captured by a 20 T solenoid with a clear
bore radius of 75 mm. The length of the capture region for the solenoid magnet system
described here is based on a 225 mm long copper target.
4.2.3 Water-Cooled Bitter Solenoid Insert
The water cooled Bitter solenoid insert shown in Fig. 4.27 has an inner radius of 120 mm.
The extra inner bore radius allows a heavy metal (tungsten or some other high Z, high density
metal) shield that is 30 mm thick to be inserted around the target region. An extra 15 mm
on the inside of the solenoid is allotted for water cooling channels for the Bitter magnet. The
Bitter solenoid insert outer radius has been set at 345 mm. The superconducting outsert
solenoid cryostat starts at a radius of 370 mm. The 25 mm between the Bitter solenoid
and the cryostat wall is allocated for water cooling. Much of the space at the ends of the
Bitter insert solenoid should be filled with a water cooled heavy metal shield to protect the
superconducting solenoids on the outside from uncaptured particles coming from the target.
The Bitter solenoid insert is divided along its length into three regions, each with a
different current density[16]. The gradation of the current density in the windings allows for
the magnetic field to be shaped along the solenoid axis, in the high field region. The current
density in the Bitter solenoid section can be changed by changing the thickness of the plates

186 CHAPTER 4. TARGETRY AND PION PRODUCTION
in the solenoid. The thick plates in a turn mean a lower the current density in that turn.
Along the boundary where the current density changes, there is a change in coil strain. This
may affect the overall dimensions of the solenoid as it is powered to full current while it is
in the outsert coil field. The location of the Bitter solenoid sections is shown in Figures 4.27
and 4.30. The Bitter solenoid system is the same in both of these figures.
Tb.4.2 shows the dimensions and design current densities for the three sections of the
Bitter solenoid. The highest current density section has an overall current density of 69.3 A
mm−2, which is a factor of two lower than the highest current density sections of some of
the high field hybrid solenoids[17, 18]. Most of the magnet power is dissipated in the highest
current density section. The highest current density sections are most prone to failure due
to fatigues and strain of the Bitter coil conductor.
The cooling water must be properly treated to reduce corrosion as a factor in the reduction
of magnet life time. The cooling system must handle about 12 MW (7.2 MW of resistive
heating and 4.8 MW of beam power).
There appear to be a number options for the Bitter solenoid to increase its life time.
These options include: 1) reducing the current density in the plates (Up to a point this
will reduce the stress in the magnet.); 2) increasing the induction generated by the outsert
solenoid (This would require the outsert solenoid to have niobium tin sections.); and 3)
changing the alloy of the bitter coil plates to make them more resistant to corrosion and
to make them stronger. Decreasing the current density of the Bitter solenoid will make it
thicker (for a given induction produced by the Bitter solenoid). This has the advantage of
decreasing the heating in the superconducting outsert solenoids from the target.
Liquid nitrogen cooling of the Bitter solenoid section could be considered. The potential
advantages of a nitrogen cooled magnet are: 1) lower direct power consumption (by as much
as a factor of six) with a smaller power supply for the magnet, 2) higher conductor strength
and greater fatigue resistance, and 3) virtually no corrosion in the cooling channel. Liquid
nitrogen cooling has several disadvantages: 1) More space is required for cooling because one
is dealing with a boiling cryogenic fluid; 2) The input power requirements for the nitrogen
refrigerator and the magnet power supply will be larger than the input power required for
the water cooled magnet (about a factor of 2 higher); 3) The radial space required for
a liquid nitrogen cooled solenoid would be larger for a given coil current density because
there is a cryostat; and 4) the insert solenoid will be more costly. 5) At least some of the
beam power will be absorbed in the Bitter solenoid, further increasing the input power to
the refrigerator. It is probable that the disadvantages of a nitrogen cooled Bitter solenoid
outweigh its advantages, so a water cooled insert solenoid has been chosen for the preliminary
design.
4.2. DESIGN STUDIES OF CAPTURE MAGNET SYSTEMS 187
4.2.4 Superconducting Outsert Solenoid
The water cooled Bitter insert solenoid is surrounded by a superconducting outsert solenoid
system. The combination of the Bitter magnet insert and the superconducting outsert will
generate a magnetic induction of 20 Tesla in the region of the target. For our purposes,
the superconducting outsert is defined as the three coils that are immediately outside of
the Bitter magnet insert. Other superconducting solenoids downstream from the outsert
coils form the transition region that shapes the magnetic field between the target and the
phase rotation system. The transition region solenoid can share a common cryostat with
the superconducting outsert solenoids. The space inside the outsert solenoids at the ends
of the Bitter insert solenoid must be filled with water cooled energy absorbers to absorb
energetic particles that come from the target but are not captured by the capture solenoid
system. The energy absorber must be thick enough to prevent heating of the superconductor
in the outsert and transition region coils. The energy absorber must extend some distance
downstream from the target. As a result, the outsert solenoid cryostat can start at a radius
of 370 mm.
The outsert coil alone is designed to produce a central induction of over 6 Tesla. Op-
erating under this condition, the outsert solenoid can be made from niobium titanium in a
copper matrix operating at 4.2 K. The outsert solenoid has three coils with an inner radius
of 400 mm. The outer radius of these coils is about 540 mm. The peak magnetic induction
in the outsert coil region is about 6.9 Tesla when the insert coils are fully powered. The peak
field in the outsert coil system at full design current goes down to 6.4 Tesla when the Bitter
insert coils are not powered. Tb.4.3 shows the coil dimensions, average coil current density
and peak magnetic induction in the coil for the three outsert coils labeled coils 4, 5 and 6.
In Tb.4.3, the current density in coils is kept constant. The outer radius of the outsert
coils could be kept constant and the current density can be varied. Correction coils can be
used to correct the field leaving the target region into the pion transfer section. It should
be noted that the current density given for the coils is the average current density including
helium and insulation. The matrix current density in the winding is about 1.5 times the
average coil current density given in Tb. 4.3.
The superconducting outsert solenoids are shown in Figures 4.27 and 4.29. The outsert
solenoid system consists of the three superconducting solenoids mounted outside the Bitter
solenoid insert system. In both figures the outsert superconducting solenoids are the same.
A change in the current density in the third outsert solenoid (the one down stream from the
target) may be used to help shape the field downstream from the target where the solenoid
induction drops from 20 T to 5 T before the pions are transported to the phase rotation
188 CHAPTER 4. TARGETRY AND PION PRODUCTION
system.
4.2.5 The Transfer Solenoid System
The transfer solenoid system guides the magnetic field so that the magnetic induction de-
creases in a smooth fashion from 20 to 5 T at the start of the phase rotation channel. A
smooth transition of the magnetic induction can be achieved if the magnetic induction B(z)
as a function of the distance from the end of the target z has the following relationship;
B (z) =B0
z + A(4.15)
where B0 and A are fitting parameters. If one wants to get the magnetic field down from 20
T to 5 T in 1.2 m, B0 = 8 Tm and A = 0.4 m. Once the magnetic induction has reached
the design value for phase rotation or pion beam transport, it is desirable for the induction
to remain at a constant value.
The inside radius of the beam pipe increases as the induction decreases. The minimum
radius for the beam pipe r(z) at a distance z from the end of the target, can be calculated
using the following relationship;
r (z) =
√√√√B (0)
B (z)r (0) (4.16)
where r(0) is the radius of the beam pipe at the end of the target and B(0) is the magnetic
induction at the end of the target. Equation 4.16 recognizes that transverse pion momentum
has been transferred to forward pion momentum as the magnetic induction is decreased. In
our case, the radius for pion capture around the target r(0) = 75 mm when B(0) = 20 T. A
transfer of the captured pions from the 20 Tesla target region to the 5 Tesla beam transport
and phase rotation region requires an increase in the minimum beam pipe radius to 150 mm.
Once the solenoid magnetic induction has been brought down to the field in the pion
decay channel or phase rotation channel, the diameter of the solenoid coils must be changed
to match the diameter of the coils in the decay channel solenoids or the solenoids in the phase
rotation cavities. The change in solenoid diameter must be accomplished without altering
the desired induction along the solenoid axis. Two options for a transfer solenoid system
were studied. The option that is to be used depends on the location of the 5 Tesla solenoid
within the first set of RF cavities in the phase rotation system.
The first option has the final 5 Tesla solenoid coil diameter set at 400 mm. The system
is suitable for transfer into phase rotation cavities that have their superconducting solenoids
inside the cavities. Superconducting solenoids inside the cavities is suitable option if a large
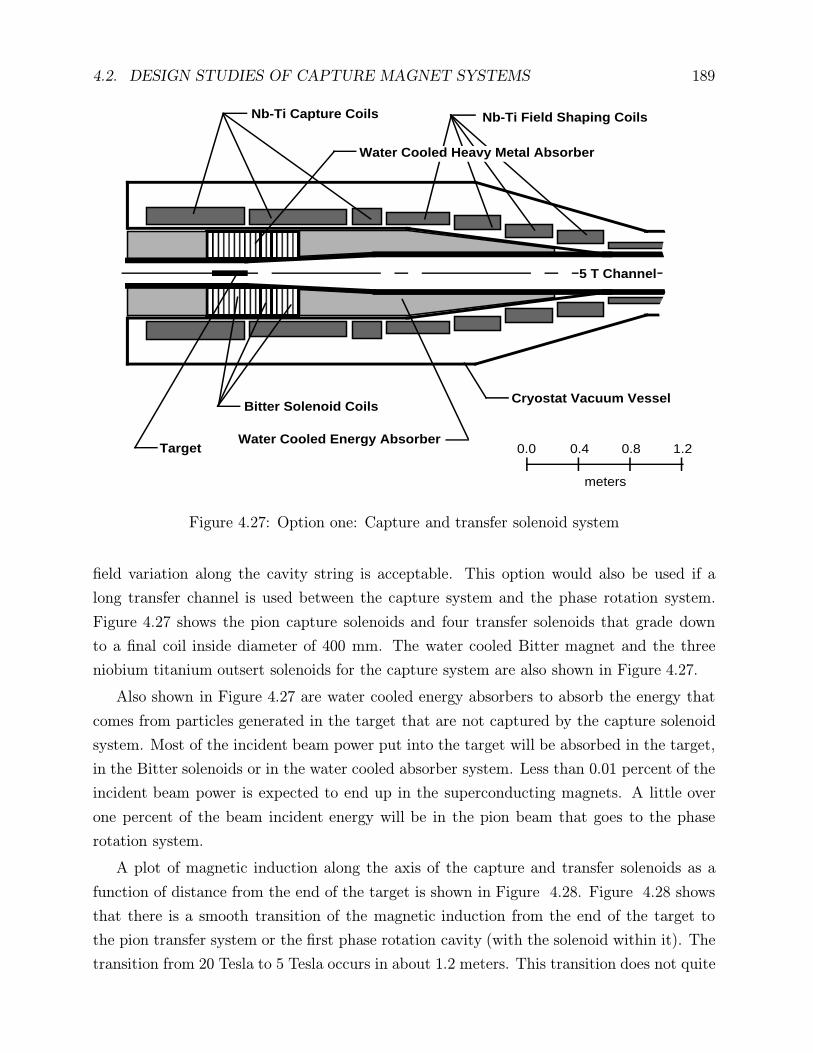
4.2. DESIGN STUDIES OF CAPTURE MAGNET SYSTEMS 189
AAAAAAAAAAAA
AAAAAAAAAAAA
0.0 0.4 0.8 1.2
meters
Bitter Solenoid Coils
TargetWater Cooled Energy Absorber
Cryostat Vacuum Vessel
5 T Channel
Nb-Ti Capture Coils
Water Cooled Heavy Metal Absorber
Nb-Ti Field Shaping Coils
Figure 4.27: Option one: Capture and transfer solenoid system
field variation along the cavity string is acceptable. This option would also be used if a
long transfer channel is used between the capture system and the phase rotation system.
Figure 4.27 shows the pion capture solenoids and four transfer solenoids that grade down
to a final coil inside diameter of 400 mm. The water cooled Bitter magnet and the three
niobium titanium outsert solenoids for the capture system are also shown in Figure 4.27.
Also shown in Figure 4.27 are water cooled energy absorbers to absorb the energy that
comes from particles generated in the target that are not captured by the capture solenoid
system. Most of the incident beam power put into the target will be absorbed in the target,
in the Bitter solenoids or in the water cooled absorber system. Less than 0.01 percent of the
incident beam power is expected to end up in the superconducting magnets. A little over
one percent of the beam incident energy will be in the pion beam that goes to the phase
rotation system.
A plot of magnetic induction along the axis of the capture and transfer solenoids as a
function of distance from the end of the target is shown in Figure 4.28. Figure 4.28 shows
that there is a smooth transition of the magnetic induction from the end of the target to
the pion transfer system or the first phase rotation cavity (with the solenoid within it). The
transition from 20 Tesla to 5 Tesla occurs in about 1.2 meters. This transition does not quite

190 CHAPTER 4. TARGETRY AND PION PRODUCTION
0
1 0
2 0
3 0
- 1 0 1 2 3 4
Ma
gn
eti
c I
nd
uc
tio
n o
n t
he
Ax
is (
T)
Distance from the Target End (m)
Figure 4.28: The on axis magnetic induction as a function of distance from the target in the
option one capture solenoid system
fit Equation 4.15, but the transition is probably smooth enough to allow for good efficiency
of pion transfer from the capture solenoid to the phase rotation channel. The magnetic field
on axis can be shaped using correction coils in order to insure efficient pion transfer.
The second option chosen has the size of the solenoids growing as the field drops to 5 Tesla
for transfer into the phase rotation system. This option would be used if the superconducting
solenoid is outside the phase rotation RF cavities. When the solenoid lies outside the cavity,
the field along the phase rotation channel is relatively uniform (to one or two percent). The
obvious disadvantage of the phase rotation solenoids on the outside is the cavity is the large
stored energy of the solenoid system on the outside of the cavities.
The solenoid inside coil diameter chosen for option two is 1600 mm. This solenoid is
large enough to surround the first two sets of cavities of the high energy (200 to 700 MeV)
phase rotation cavities. For the low energy (50 to 250 MeV) phase rotation cavities, the first
stage solenoid coil inside diameter would be about 1900 mm. Figure 4.29 shows the pion
capture solenoids and the transfer solenoids that grade up to a final coil inside diameter of
1600 mm. The water cooled Bitter magnet and the three niobium titanium outsert solenoids
for the capture system are also shown in Figure 4.29. Figure 4.29 shows water cooled energy
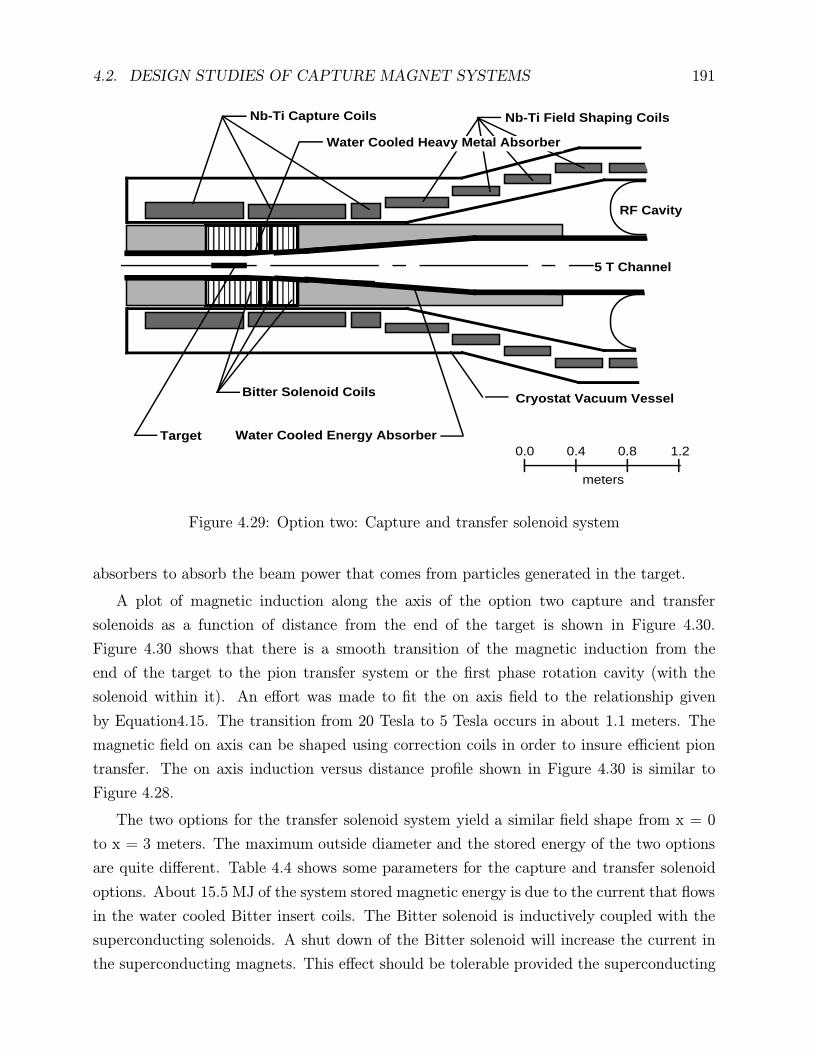
4.2. DESIGN STUDIES OF CAPTURE MAGNET SYSTEMS 191
0.0 0.4 0.8 1.2
meters
AAAAAAAAAAA
AAAAAAAAAAAA
Bitter Solenoid Coils
Target Water Cooled Energy Absorber
Cryostat Vacuum Vessel
Nb-Ti Capture Coils
Water Cooled Heavy Metal Absorber
Nb-Ti Field Shaping Coils
RF Cavity
5 T Channel
Figure 4.29: Option two: Capture and transfer solenoid system
absorbers to absorb the beam power that comes from particles generated in the target.
A plot of magnetic induction along the axis of the option two capture and transfer
solenoids as a function of distance from the end of the target is shown in Figure 4.30.
Figure 4.30 shows that there is a smooth transition of the magnetic induction from the
end of the target to the pion transfer system or the first phase rotation cavity (with the
solenoid within it). An effort was made to fit the on axis field to the relationship given
by Equation4.15. The transition from 20 Tesla to 5 Tesla occurs in about 1.1 meters. The
magnetic field on axis can be shaped using correction coils in order to insure efficient pion
transfer. The on axis induction versus distance profile shown in Figure 4.30 is similar to
Figure 4.28.
The two options for the transfer solenoid system yield a similar field shape from x = 0
to x = 3 meters. The maximum outside diameter and the stored energy of the two options
are quite different. Table 4.4 shows some parameters for the capture and transfer solenoid
options. About 15.5 MJ of the system stored magnetic energy is due to the current that flows
in the water cooled Bitter insert coils. The Bitter solenoid is inductively coupled with the
superconducting solenoids. A shut down of the Bitter solenoid will increase the current in
the superconducting magnets. This effect should be tolerable provided the superconducting

192 CHAPTER 4. TARGETRY AND PION PRODUCTION
0
1 0
2 0
3 0
- 1 0 1 2 3 4
Ma
gn
eti
c I
nd
uc
tio
n o
n t
he
Ax
is (
T)
Distance from the Target End (m)
Figure 4.30: The on axis magnetic induction as a function of distance from the target in the
option two capture solenoid system
solenoids are well cooled. A loss of current in the Bitter solenoids system will probably cause
the superconducting solenoids to turn normal.
Two types of superconducting solenoids could be used in the superconducting part of
the capture solenoid system shown in Figures 4.28 and 4.30. One could use either a cable
in conduit conductor (CICC) or a magnet with well-cooled copper stabilized conductor in a
helium bath. Either approach can be used in the stored energy range shown in Table 4.4.
The CICC system has the advantage of having the helium inside the conductor. The shell
around the cable and the helium forms part of the magnet support structure. It is probable
that no other support structure is needed. Therefore, CICC conductors appear to be an
attractive option. In either case, the heating from the target must be minimized. CICC
magnets have been designed for use in an environment where heating is an important factor.
A fully stabilized conductor magnet would likely be made from a copper stabilized con-
ductor in the half hard state. A pure aluminum matrix conductor is also a possibility, but
additional support is needed to support the hoop forces in the magnet. Therefore, the pure
aluminum conductor option is probably not attractive.
If energy deposition in the superconductor is a factor, the superconducting magnet di-
4.2. DESIGN STUDIES OF CAPTURE MAGNET SYSTEMS 193
ameter can be increased to accommodate more material to absorb energy from particles
that come from the target. If the field shape is not good enough to insure efficient transfer
of the pions from the target to the phase rotation system, the field shape in the capture
and transport solenoids can be improved by using additional water cooled correction coils
between the water-cooled beam pipe and the superconducting solenoids.
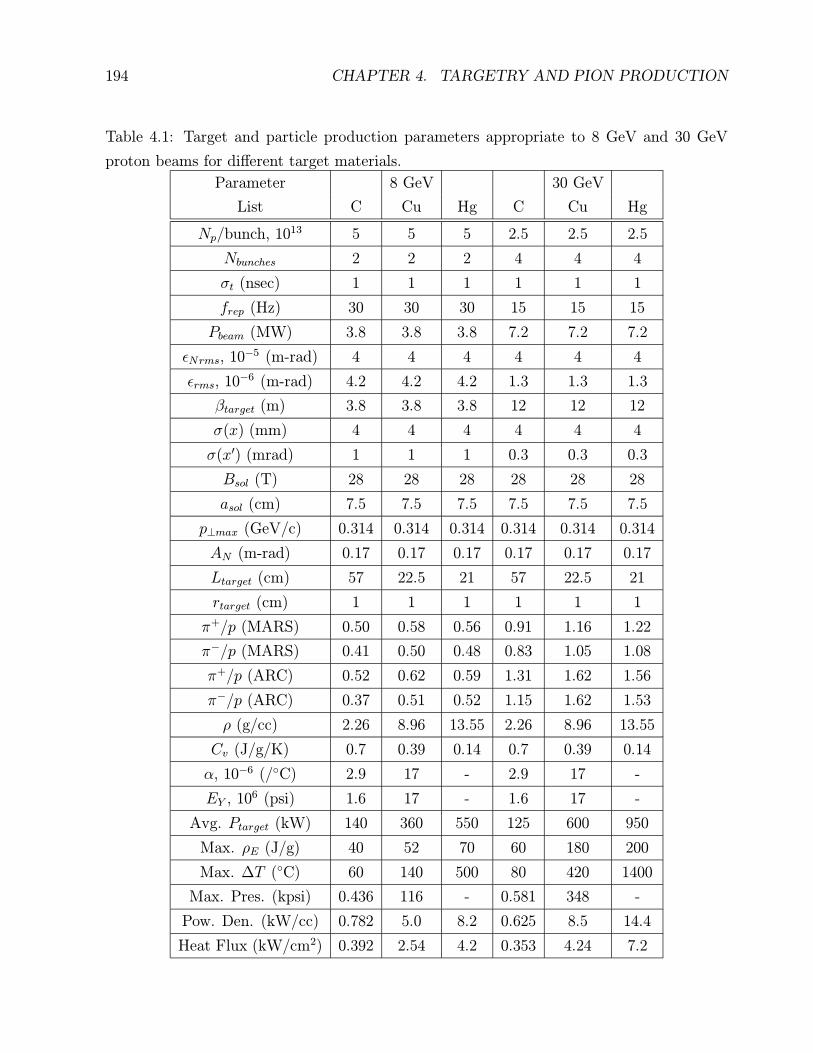
194 CHAPTER 4. TARGETRY AND PION PRODUCTION
Table 4.1: Target and particle production parameters appropriate to 8 GeV and 30 GeV
proton beams for different target materials.
Parameter 8 GeV 30 GeV
List C Cu Hg C Cu Hg
Np/bunch, 1013 5 5 5 2.5 2.5 2.5
Nbunches 2 2 2 4 4 4
σt (nsec) 1 1 1 1 1 1
frep (Hz) 30 30 30 15 15 15
Pbeam (MW) 3.8 3.8 3.8 7.2 7.2 7.2
εNrms, 10−5 (m-rad) 4 4 4 4 4 4
εrms, 10−6 (m-rad) 4.2 4.2 4.2 1.3 1.3 1.3
βtarget (m) 3.8 3.8 3.8 12 12 12
σ(x) (mm) 4 4 4 4 4 4
σ(x′) (mrad) 1 1 1 0.3 0.3 0.3
Bsol (T) 28 28 28 28 28 28
asol (cm) 7.5 7.5 7.5 7.5 7.5 7.5
p⊥max (GeV/c) 0.314 0.314 0.314 0.314 0.314 0.314
AN (m-rad) 0.17 0.17 0.17 0.17 0.17 0.17
Ltarget (cm) 57 22.5 21 57 22.5 21
rtarget (cm) 1 1 1 1 1 1
π+/p (MARS) 0.50 0.58 0.56 0.91 1.16 1.22
π−/p (MARS) 0.41 0.50 0.48 0.83 1.05 1.08
π+/p (ARC) 0.52 0.62 0.59 1.31 1.62 1.56
π−/p (ARC) 0.37 0.51 0.52 1.15 1.62 1.53
ρ (g/cc) 2.26 8.96 13.55 2.26 8.96 13.55
Cv (J/g/K) 0.7 0.39 0.14 0.7 0.39 0.14
α, 10−6 (/◦C) 2.9 17 - 2.9 17 -
EY , 106 (psi) 1.6 17 - 1.6 17 -
Avg. Ptarget (kW) 140 360 550 125 600 950
Max. ρE (J/g) 40 52 70 60 180 200
Max. ∆T (◦C) 60 140 500 80 420 1400
Max. Pres. (kpsi) 0.436 116 - 0.581 348 -
Pow. Den. (kW/cc) 0.782 5.0 8.2 0.625 8.5 14.4
Heat Flux (kW/cm2) 0.392 2.54 4.2 0.353 4.24 7.2
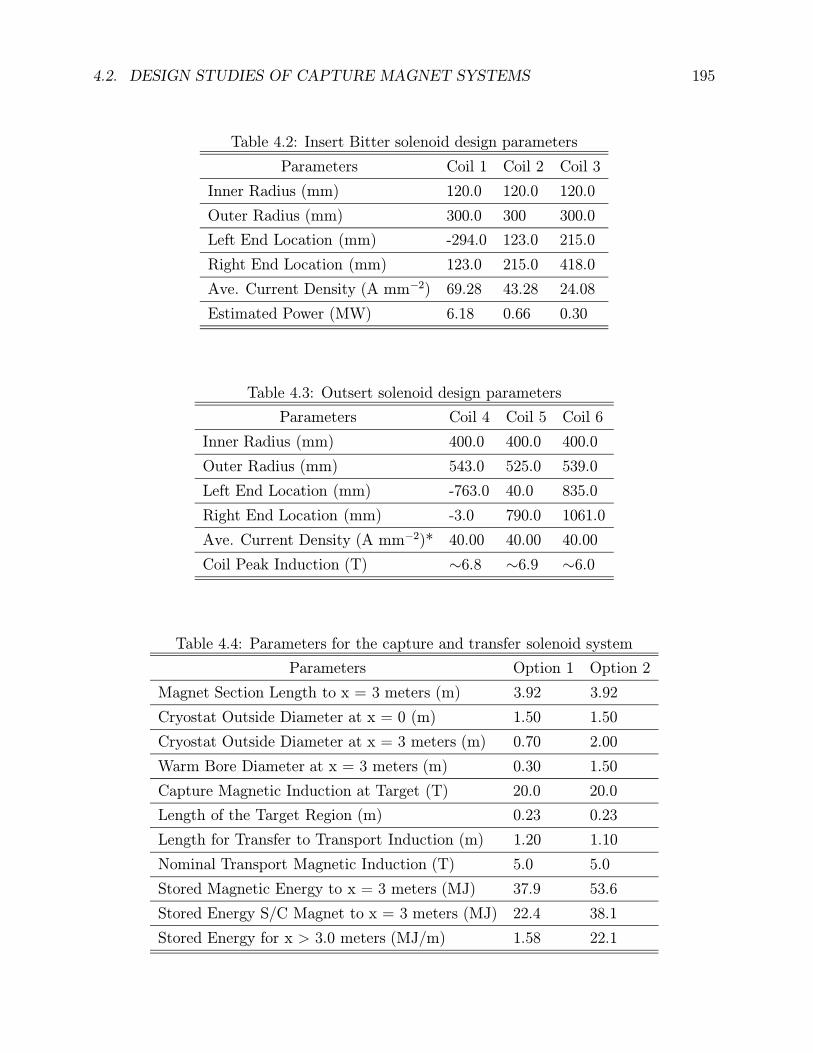
4.2. DESIGN STUDIES OF CAPTURE MAGNET SYSTEMS 195
Table 4.2: Insert Bitter solenoid design parameters
Parameters Coil 1 Coil 2 Coil 3
Inner Radius (mm) 120.0 120.0 120.0
Outer Radius (mm) 300.0 300 300.0
Left End Location (mm) -294.0 123.0 215.0
Right End Location (mm) 123.0 215.0 418.0
Ave. Current Density (A mm−2) 69.28 43.28 24.08
Estimated Power (MW) 6.18 0.66 0.30
Table 4.3: Outsert solenoid design parameters
Parameters Coil 4 Coil 5 Coil 6
Inner Radius (mm) 400.0 400.0 400.0
Outer Radius (mm) 543.0 525.0 539.0
Left End Location (mm) -763.0 40.0 835.0
Right End Location (mm) -3.0 790.0 1061.0
Ave. Current Density (A mm−2)* 40.00 40.00 40.00
Coil Peak Induction (T) ∼6.8 ∼6.9 ∼6.0
Table 4.4: Parameters for the capture and transfer solenoid system
Parameters Option 1 Option 2
Magnet Section Length to x = 3 meters (m) 3.92 3.92
Cryostat Outside Diameter at x = 0 (m) 1.50 1.50
Cryostat Outside Diameter at x = 3 meters (m) 0.70 2.00
Warm Bore Diameter at x = 3 meters (m) 0.30 1.50
Capture Magnetic Induction at Target (T) 20.0 20.0
Length of the Target Region (m) 0.23 0.23
Length for Transfer to Transport Induction (m) 1.20 1.10
Nominal Transport Magnetic Induction (T) 5.0 5.0
Stored Magnetic Energy to x = 3 meters (MJ) 37.9 53.6
Stored Energy S/C Magnet to x = 3 meters (MJ) 22.4 38.1
Stored Energy for x > 3.0 meters (MJ/m) 1.58 22.1

196 CHAPTER 4. TARGETRY AND PION PRODUCTION
Bibliography
[1] R. J. Noble, Proc. 3rd Int. Workshop on Advanced Accelerator Concepts, Port Jefferson,
NY, AIP Conf. Proc. No. 279, 949 (1993).
[2] R. Palmer et al., BNL–61581 (1995).
[3] N. V. Mokhov, R. J. Noble and A. Van Ginneken,“Targetry and Collection Optimization
for Muon Colliders”, FermiLab–Conf–96/006, and Proceedings of the 9th Advanced
ICFA Beam Dynamics Workshop, Ed. J. C. Gallardo, AIP Conference Proceedings 372,
1996.
[4] R. Palmer et al., “Muon Collider Design”, BNL–62949 (1996).
[5] N. V. Mokhov, “The mars Code System User’s Guide, version 13 (95)”, FNAL–FN–628
(1995).
[6] J. Ranft, “The dpmjet Code System” (1995).
[7] D. Kahana and Y. Torun, “Analysis of Pion Production Data from E-802 at 14.6 GeV/c
using arc”, BNL–61983 (1995).
[8] Review of Particle Properties, Phys. Rev. D50, 1177 (1994).
[9] J. D. Jackson, Classical Electrodynamics, 2nd Ed., J. Wiley, New York, 1975.
[10] A. Van Ginneken, “Deuterons or Tritons for Muon Collider Driver”, FermiLab–FN–647
(1996).
[11] ansys (rev. 5.1), Swanson Analysis System, Inc., SASI/DN–P511:51, Houston (1994).
[12] F. F. Chen, Introduction to Plasma Physics, Plenum, New York, pp. 23–26 (1974).
[13] M. Green, “Pion Capture Magnet System”,Proceedings of the 9th Advanced ICFA Beam
Dynamics Workshop, Ed. J. C. Gallardo, AIP Conference Proceedings 372, 1996.
198 BIBLIOGRAPHY
[14] N. V. Mokhov, R. J. Noble and A. Van Ginneken, Targetry and Collection Optimization
for Muon Colliders FermiLab-Conf-96/006 to appear in the Proceedings of the 9th
Advanced ICFA Beam Dynamics Workshop, October 1995, Montauk, NY .
[15] M. A. Green, Some Options for the Muon Collider Capture and Decay Solenoids,
Lawrence Berkeley National Laboratory Report LBL-37995, to appear in the Proceed-
ings of the 9th Advanced ICFA Beam Dynamics Workshop, October 1995, Montauk,
NY.
[16] J. Weggel, Collector Magnets for µ+µ− Colliders, an unpublished report concerning
preliminary design studies of capture magnets system for 2 TeV on 2 TeV and demon-
stration colliders.
[17] Miller, J. R., Bird, M. D., Bole, S., et al, An Overview of the 45T Hybrid Magnet System
for he National High Field Magnet Laboratory, IEEE Transactions on Magnetics 30, No.
4, p 1563, (1994).
[18] Iwasa,Y., Leupold, M. J., Weggel, R. J., and Williams J. E. C., Hybrid III: The System,
Test Results, the Next Step, IEEE Transactions on Applied Superconductivity 3, No. 1,
p 58, (1993).
Contributors
• Robert J. Noble, (FermiLab), Editor
• David Ehst, (ANL)
• Michael Green, (LBNL)
• David Kahana, (BNL)
• Nikolai Mokhov, (FermiLab)
• Igor Novitski, (FermiLab)
• Yagmur Torun, (SUNY, Stony Brook)
• Andy Van Ginneken, (FermiLab)

200 BIBLIOGRAPHY
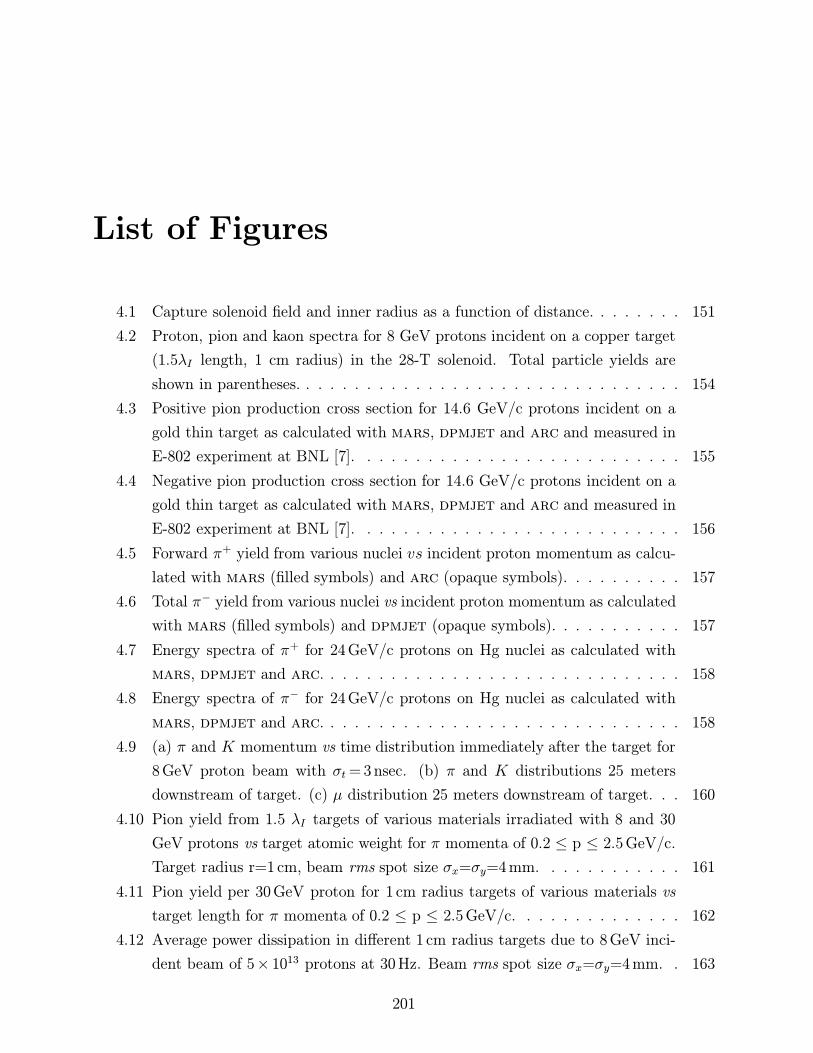
List of Figures
4.1 Capture solenoid field and inner radius as a function of distance. . . . . . . . 151
4.2 Proton, pion and kaon spectra for 8 GeV protons incident on a copper target
(1.5λI length, 1 cm radius) in the 28-T solenoid. Total particle yields are
shown in parentheses. . . . . . . . . . . . . . . . . . . . . . . . . . . . . . . . 154
4.3 Positive pion production cross section for 14.6 GeV/c protons incident on a
gold thin target as calculated with mars, dpmjet and arc and measured in
E-802 experiment at BNL [7]. . . . . . . . . . . . . . . . . . . . . . . . . . . 155
4.4 Negative pion production cross section for 14.6 GeV/c protons incident on a
gold thin target as calculated with mars, dpmjet and arc and measured in
E-802 experiment at BNL [7]. . . . . . . . . . . . . . . . . . . . . . . . . . . 156
4.5 Forward π+ yield from various nuclei vs incident proton momentum as calcu-
lated with mars (filled symbols) and arc (opaque symbols). . . . . . . . . . 157
4.6 Total π− yield from various nuclei vs incident proton momentum as calculated
with mars (filled symbols) and dpmjet (opaque symbols). . . . . . . . . . . 157
4.7 Energy spectra of π+ for 24 GeV/c protons on Hg nuclei as calculated with
mars, dpmjet and arc. . . . . . . . . . . . . . . . . . . . . . . . . . . . . . 158
4.8 Energy spectra of π− for 24 GeV/c protons on Hg nuclei as calculated with
mars, dpmjet and arc. . . . . . . . . . . . . . . . . . . . . . . . . . . . . . 158
4.9 (a) π and K momentum vs time distribution immediately after the target for
8 GeV proton beam with σt = 3 nsec. (b) π and K distributions 25 meters
downstream of target. (c) µ distribution 25 meters downstream of target. . . 160
4.10 Pion yield from 1.5 λI targets of various materials irradiated with 8 and 30
GeV protons vs target atomic weight for π momenta of 0.2 ≤ p ≤ 2.5 GeV/c.
Target radius r=1 cm, beam rms spot size σx=σy=4 mm. . . . . . . . . . . . 161
4.11 Pion yield per 30 GeV proton for 1 cm radius targets of various materials vs
target length for π momenta of 0.2 ≤ p ≤ 2.5 GeV/c. . . . . . . . . . . . . . 162
4.12 Average power dissipation in different 1 cm radius targets due to 8 GeV inci-
dent beam of 5× 10¹³ protons at 30 Hz. Beam rms spot size σx=σy=4 mm. . 163
201
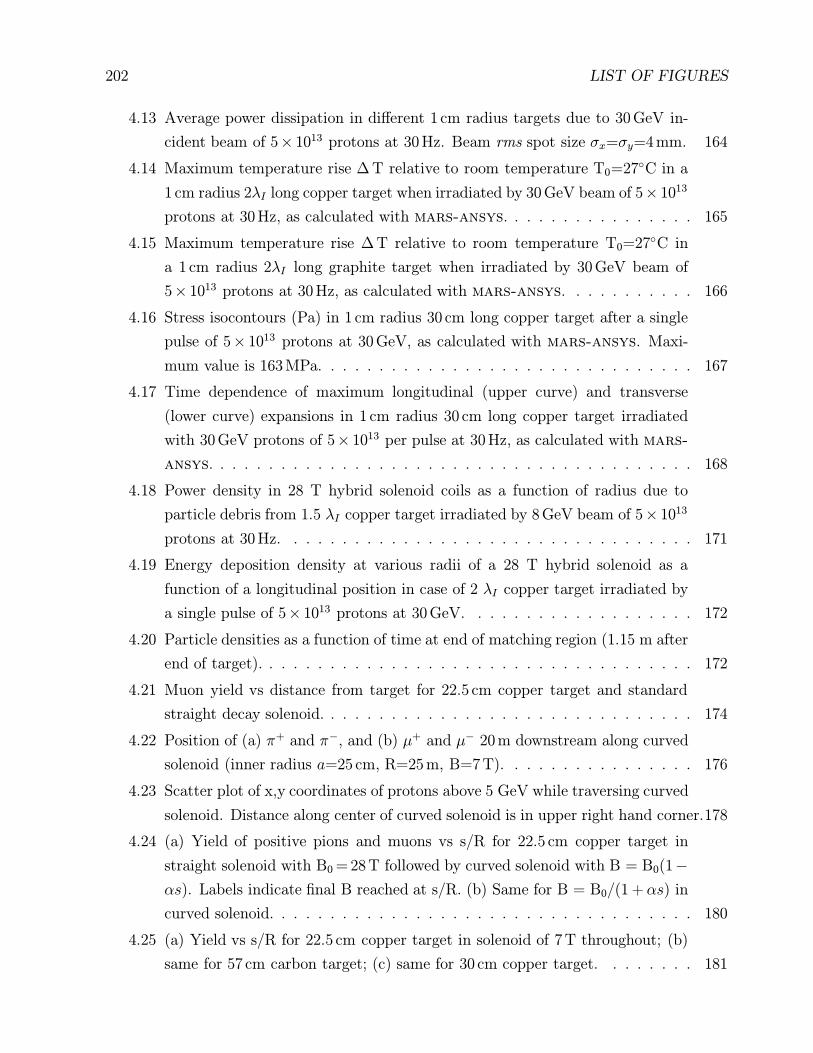
202 LIST OF FIGURES
4.13 Average power dissipation in different 1 cm radius targets due to 30 GeV in-
cident beam of 5× 10¹³ protons at 30 Hz. Beam rms spot size σx=σy=4 mm. 164
4.14 Maximum temperature rise ∆ T relative to room temperature T0=27◦C in a
1 cm radius 2λI long copper target when irradiated by 30 GeV beam of 5× 10¹³
protons at 30 Hz, as calculated with mars-ansys. . . . . . . . . . . . . . . . 165
4.15 Maximum temperature rise ∆ T relative to room temperature T0=27◦C in
a 1 cm radius 2λI long graphite target when irradiated by 30 GeV beam of
5× 10¹³ protons at 30 Hz, as calculated with mars-ansys. . . . . . . . . . . 166
4.16 Stress isocontours (Pa) in 1 cm radius 30 cm long copper target after a single
pulse of 5× 10¹³ protons at 30 GeV, as calculated with mars-ansys. Maxi-
mum value is 163 MPa. . . . . . . . . . . . . . . . . . . . . . . . . . . . . . . 167
4.17 Time dependence of maximum longitudinal (upper curve) and transverse
(lower curve) expansions in 1 cm radius 30 cm long copper target irradiated
with 30 GeV protons of 5× 10¹³ per pulse at 30 Hz, as calculated with mars-
ansys. . . . . . . . . . . . . . . . . . . . . . . . . . . . . . . . . . . . . . . . 168
4.18 Power density in 28 T hybrid solenoid coils as a function of radius due to
particle debris from 1.5 λI copper target irradiated by 8 GeV beam of 5× 10¹³
protons at 30 Hz. . . . . . . . . . . . . . . . . . . . . . . . . . . . . . . . . . 171
4.19 Energy deposition density at various radii of a 28 T hybrid solenoid as a
function of a longitudinal position in case of 2 λI copper target irradiated by
a single pulse of 5× 10¹³ protons at 30 GeV. . . . . . . . . . . . . . . . . . . 172
4.20 Particle densities as a function of time at end of matching region (1.15 m after
end of target). . . . . . . . . . . . . . . . . . . . . . . . . . . . . . . . . . . . 172
4.21 Muon yield vs distance from target for 22.5 cm copper target and standard
straight decay solenoid. . . . . . . . . . . . . . . . . . . . . . . . . . . . . . . 174
4.22 Position of (a) π+ and π−, and (b) µ+ and µ− 20 m downstream along curved
solenoid (inner radius a=25 cm, R=25 m, B=7 T). . . . . . . . . . . . . . . . 176
4.23 Scatter plot of x,y coordinates of protons above 5 GeV while traversing curved
solenoid. Distance along center of curved solenoid is in upper right hand corner.178
4.24 (a) Yield of positive pions and muons vs s/R for 22.5 cm copper target in
straight solenoid with B0 = 28 T followed by curved solenoid with B = B0(1−
αs). Labels indicate final B reached at s/R. (b) Same for B = B0/(1 +αs) in
curved solenoid. . . . . . . . . . . . . . . . . . . . . . . . . . . . . . . . . . . 180
4.25 (a) Yield vs s/R for 22.5 cm copper target in solenoid of 7 T throughout; (b)
same for 57 cm carbon target; (c) same for 30 cm copper target. . . . . . . . 181
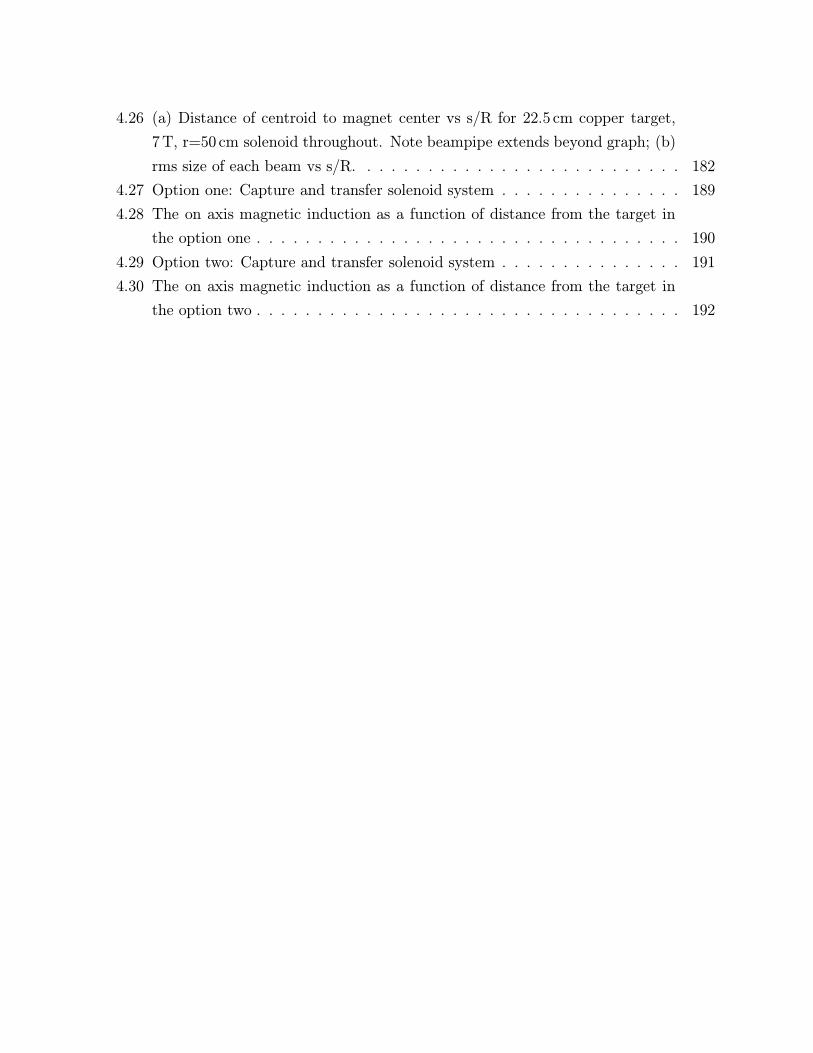
4.26 (a) Distance of centroid to magnet center vs s/R for 22.5 cm copper target,
7 T, r=50 cm solenoid throughout. Note beampipe extends beyond graph; (b)
rms size of each beam vs s/R. . . . . . . . . . . . . . . . . . . . . . . . . . . 182
4.27 Option one: Capture and transfer solenoid system . . . . . . . . . . . . . . . 189
4.28 The on axis magnetic induction as a function of distance from the target in
the option one . . . . . . . . . . . . . . . . . . . . . . . . . . . . . . . . . . . 190
4.29 Option two: Capture and transfer solenoid system . . . . . . . . . . . . . . . 191
4.30 The on axis magnetic induction as a function of distance from the target in
the option two . . . . . . . . . . . . . . . . . . . . . . . . . . . . . . . . . . . 192

204 LIST OF FIGURES
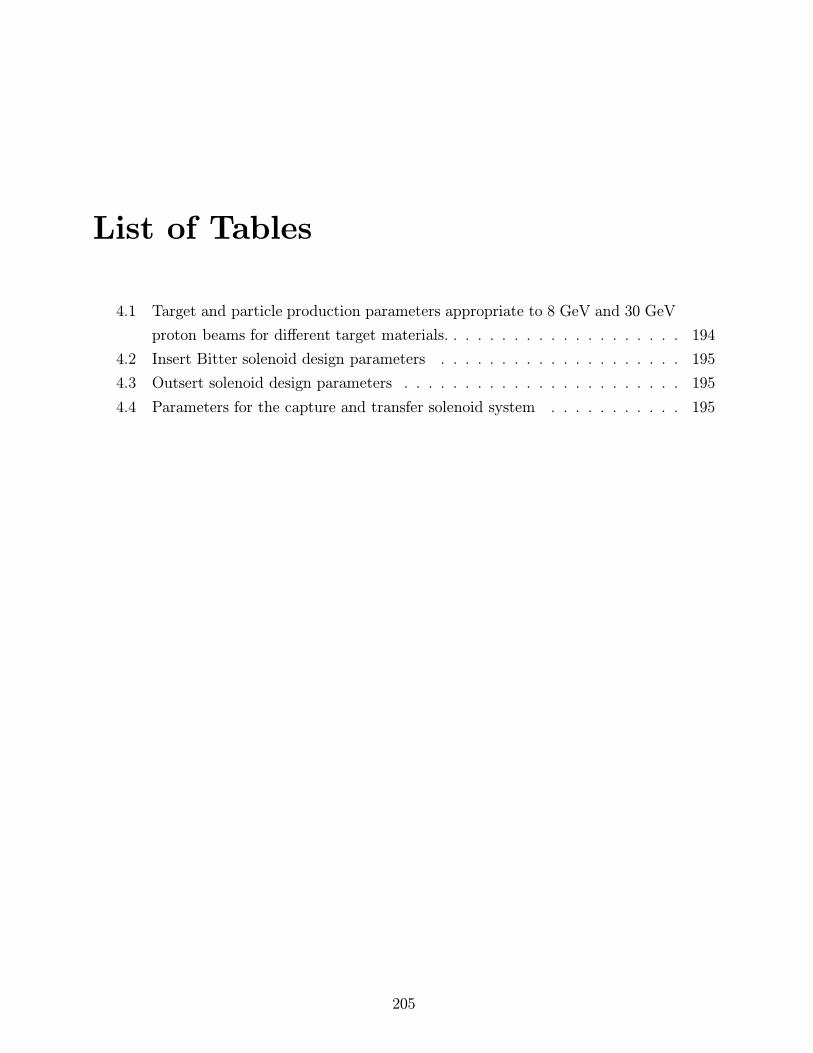
List of Tables
4.1 Target and particle production parameters appropriate to 8 GeV and 30 GeV
proton beams for different target materials. . . . . . . . . . . . . . . . . . . . 194
4.2 Insert Bitter solenoid design parameters . . . . . . . . . . . . . . . . . . . . 195
4.3 Outsert solenoid design parameters . . . . . . . . . . . . . . . . . . . . . . . 195
4.4 Parameters for the capture and transfer solenoid system . . . . . . . . . . . 195
205