Chapter 4: Plutonium Processing at Los Alamos...E- Theoretical Division Offices W- Van de Graaff...
30
DRAFT FINAL REPORT OF CDC’S LAHDRA PROJECT – Chapter 4 4-1 Chapter 4: Plutonium Processing at Los Alamos One of the important early roles of the Los Alamos laboratory was the processing of the newly created and largely unknown material plutonium (Hammel 1998). The assignments taken on by Project Y scientists in the mid-1940s were to: • Perform the final purification of the plutonium received at Los Alamos, • Reduce the plutonium to its metallic state, • Determine the metal’s relevant physical and metallurgical properties, and • Develop the necessary weapon component fabrication technologies. Los Alamos was the first site in the world to receive quantities of plutonium large enough to manufacture weapon components. Initial plutonium processing was performed in the Original Technical Area, which was located near Ashley Pond and later became known as Technical Area 1 (TA-1) (see Fig. 4-1). Key to Selected Buildings: C- Shops U- Chemistry and Physics Labs D- Plutonium Plant V- Shops E- Theoretical Division Offices W- Van de Graaff Machines G- Graphite Fabrication X- Cyclotron J- Research Laboratories Y- Cryogenics Laboratory Q- Medical Offices Z- Cockcroft-Walton Generator R- Laboratories Gamma- Research for M Division S- Stockroom Sigma- Metals, Plastics, Ceramic Med Lab = Medical Laboratory Fabrication Fig. 4-1. Map of the Original Technical Area (later called TA-1)
Transcript of Chapter 4: Plutonium Processing at Los Alamos...E- Theoretical Division Offices W- Van de Graaff...
DRAFT FINAL REPORT OF CDC’S LAHDRA PROJECT – Chapter 4 4-1
Chapter 4: Plutonium Processing at Los Alamos
One of the important early roles of the Los Alamos laboratory was the processing of the newly created
and largely unknown material plutonium (Hammel 1998). The assignments taken on by Project Y
scientists in the mid-1940s were to:
• Perform the final purification of the plutonium received at Los Alamos,
• Reduce the plutonium to its metallic state,
• Determine the metal’s relevant physical and metallurgical properties, and
• Develop the necessary weapon component fabrication technologies.
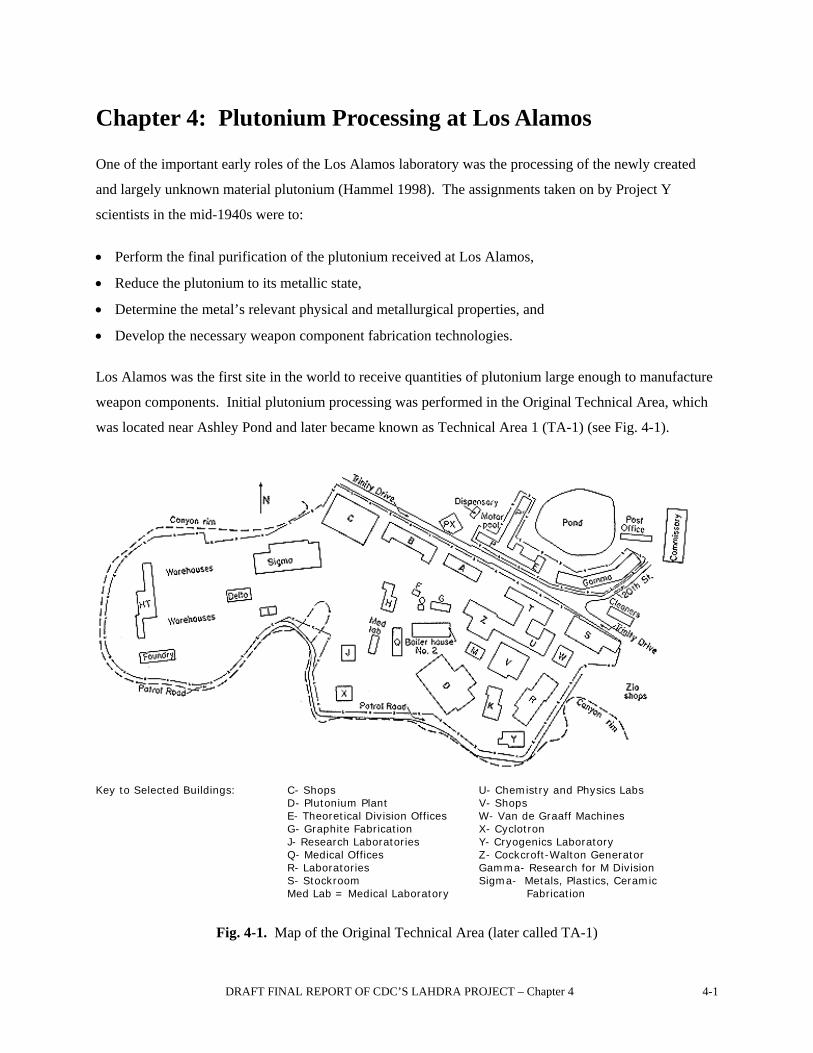
Los Alamos was the first site in the world to receive quantities of plutonium large enough to manufacture
weapon components. Initial plutonium processing was performed in the Original Technical Area, which
was located near Ashley Pond and later became known as Technical Area 1 (TA-1) (see Fig. 4-1).
Key to Selected Buildings: C- Shops U- Chemistry and Physics Labs D- Plutonium Plant V- Shops E- Theoretical Division Offices W- Van de Graaff Machines G- Graphite Fabrication X- Cyclotron J- Research Laboratories Y- Cryogenics Laboratory Q- Medical Offices Z- Cockcroft-Walton Generator
R- Laboratories Gamma- Research for M Division S- Stockroom Sigma- Metals, Plastics, Ceramic
Med Lab = Medical Laboratory Fabrication
Fig. 4-1. Map of the Original Technical Area (later called TA-1)
4-2 DRAFT FINAL REPORT OF CDC’S LAHDRA PROJECT – Chapter 4
Early Plutonium Processing at D-Building
The initial handling and processing of plutonium that took place at the original technical areas involved
the following main facilities:
• D Building- housed plutonium chemistry, metallurgy, and processing
• D-2 Building- housed contaminated laundry and glassware decontamination
• D-5 Sigma Vault- storage facility for 239Pu and 235U
• ML Building- Housed the Medical laboratory, site of human uptake and excretion
studies by H-4 and H-5 groups and urine assay
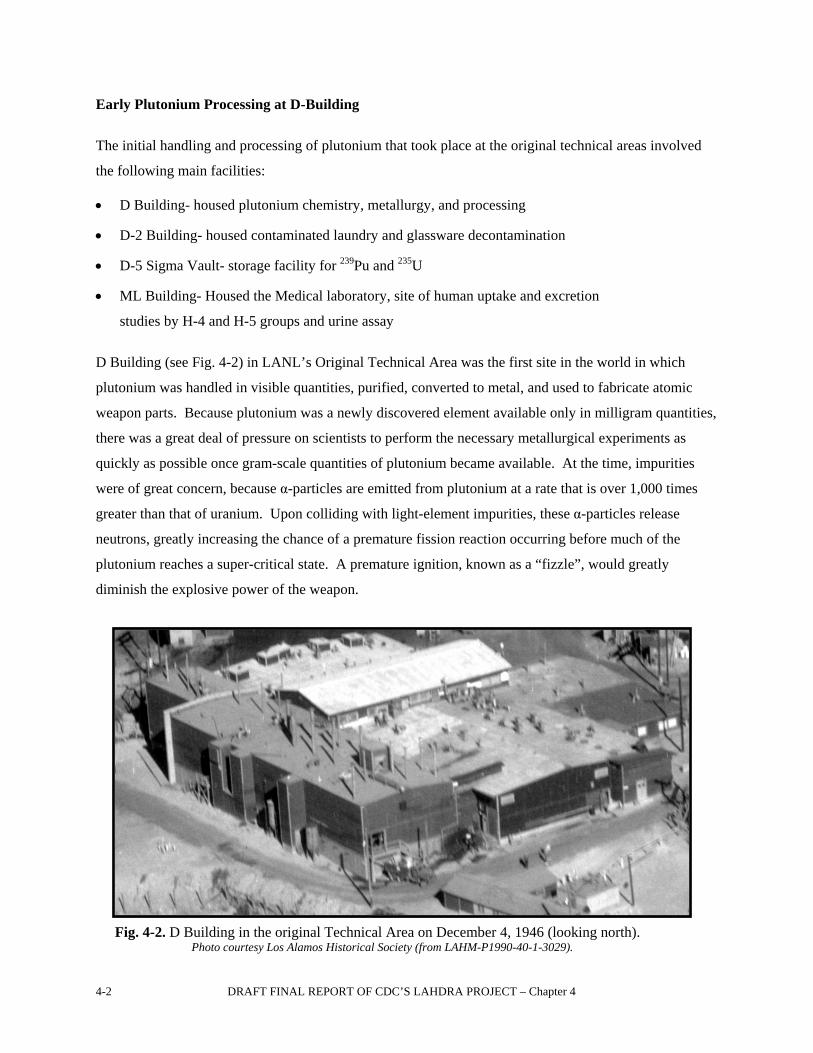
D Building (see Fig. 4-2) in LANL’s Original Technical Area was the first site in the world in which
plutonium was handled in visible quantities, purified, converted to metal, and used to fabricate atomic
weapon parts. Because plutonium was a newly discovered element available only in milligram quantities,
there was a great deal of pressure on scientists to perform the necessary metallurgical experiments as
quickly as possible once gram-scale quantities of plutonium became available. At the time, impurities
were of great concern, because α-particles are emitted from plutonium at a rate that is over 1,000 times
greater than that of uranium. Upon colliding with light-element impurities, these α-particles release
neutrons, greatly increasing the chance of a premature fission reaction occurring before much of the
plutonium reaches a super-critical state. A premature ignition, known as a “fizzle”, would greatly
diminish the explosive power of the weapon.
Fig. 4-2. D Building in the original Technical Area on December 4, 1946 (looking north). Photo courtesy Los Alamos Historical Society (from LAHM-P1990-40-1-3029).
DRAFT FINAL REPORT OF CDC’S LAHDRA PROJECT – Chapter 4 4-3
D-Building was constructed as an answer to this impurity problem in December 1943. To mitigate light-
element dust from settling onto experimental surfaces, D-Building was built with a state-of-the-art air
conditioning and ventilation system that provided laboratory conditions that were as dust-free and clean
as possible. The building’s air intakes were filtered, but its exhaust vents were not. Starting in late 1943,
scientists and engineers in D Building used equipment and procedures that are considered extremely
crude by modern-day standards to process the new and largely unknown element plutonium under
demanding schedules and extreme wartime pressures. Progress reports indicate that D Building and its
roof became highly contaminated, and about 85 rooftop vents released contaminated air without
monitoring and for the most part with no filtration. A former Los Alamos plutonium worker wrote that
“During the War years, partly because of ignorance and partly because of the stress of wartime
conditions, operations with plutonium in D Building were conducted with greater laxity than has ever
been tolerated since” and “D Building was known to be hotter than a firecracker” (Coffinberry 1961).
There are no records or LANL estimates of airborne plutonium releases from D Building, which ceased
main plutonium production functions when DP West site became operational in late 1945 but remained
active until around 1953.
Flow of Plutonium Operations within D Building
Operations within D Building can be considered a chemical process with the key objective of converting
plutonium nitrate into the highly purified metallic hemispheres used in the Trinity and Nagasaki devices.
While many other supporting projects were conducted within D-Building, including uranium chemistry
and metallurgy, design of tampers and polonium initiators, as well as the development of various
refractory materials, this report focuses specifically on the numerous stages of plutonium processing.
These stages are represented generally by the flow diagram shown in Fig. 4-3, which most accurately
represents plutonium processing from about December 1944 until D-Building was decommissioned in
September 1945. These production-scale processes, in operation for only about 9 mo, were refined from
many months of prior chemical and metallurgical research starting in December 1943 when construction
of D-Building was completed. It is most likely, however, that the vast majority of plutonium
contamination was a direct result of these production-scale operations, as the first few milligrams of
plutonium didn’t arrive on site until January 1944, and gram quantities until March 1944 (Hammel 1998).
Moreover, by late April 1945, D-Building had produced only about 1 kg of plutonium (see Fig. 4-4), yet
would receive about 26 kg of additional plutonium from Hanford Site in Washington (Site W) by the end
of August 1945, as shown in Fig. 4-5 (Site Y 1945). Because of this trend, this report focuses mainly on
the production-scale processes.
4-4
D
RA
FT F
INA
L R
EPO
RT
OF
CD
C’S
LA
HD
RA
PR
OJE
CT
– C
hapt
er 4
CM
-10
Rec
over
y
Pu →
PuN
O3
CM
-11
Met
allu
rgic
alex
perim
ents
CM
-8R
educ
tion
PuF 4→
met
allic
Pu
CM
-5Fl
uorin
atio
n
PuO
2→
PuF 4
CM
-5Pu
rific
atio
n
PuN
O3→
Pu(I
II) o
xala
te
CM
-5
Pu(I
II) o
xala
te →
PuO
2
PuN
O3
past
e fr
om W
Pu(I
II)
oxal
ate
PuO
2Pu
F 4
Slag
, con
tam
inat
ed
cruc
ible
s, et
c.
PuN
O3
syru
pSu
pern
atan
ts
cont
aini
ng P
u
“Dry
Che
mis
try”
CM
-11
Fabr
icat
ion:
rem
eltin
g, c
astin
g, c
old
forg
ing,
rolli
ng, d
rillin
g,
shea
ring
Com
bat h
emis
pher
es
Met
allic
Pu
for
rese
arch
Use
d m
etal
lic P
u sa
mpl
es
Res
idue
s(s
mal
l)R
esid
ues
(sm
all)
CM
-11
Surf
ace
prot
ectio
n,
coat
ing,
ele
ctro
plat
ing,
et
c.
95-9
7%
3-5%
2 ×
50,0
00
gallo
n W
aste
tank
sat
DP
site
“Wet
Che
mis
try”
95%
-99%
1-5%
Met
allic
Pu
for
rese
arch
Oxi
des,
scra
p m
etal
Var
ious
Pu
solu
tions
and
susp
ensi
ons
CM
-10
Rec
over
y
Pu →
PuN
O3
CM
-11
Met
allu
rgic
alex
perim
ents
CM
-8R
educ
tion
PuF 4→
met
allic
Pu
CM
-5Fl
uorin
atio
n
PuO
2→
PuF 4
CM
-5Pu
rific
atio
n
PuN
O3→
Pu(I
II) o
xala
te
CM
-5
Pu(I
II) o
xala
te →
PuO
2
PuN
O3
past
e fr
om W
Pu(I
II)
oxal
ate
PuO
2Pu
F 4
Slag
, con
tam
inat
ed
cruc
ible
s, et
c.
PuN
O3
syru
pSu
pern
atan
ts
cont
aini
ng P
u
“Dry
Che
mis
try”
CM
-11
Fabr
icat
ion:
rem
eltin
g, c
astin
g, c
old
forg
ing,
rolli
ng, d
rillin
g,
shea
ring
Com
bat h
emis
pher
es
Met
allic
Pu
for
rese
arch
Use
d m
etal
lic P
u sa
mpl
es
Res
idue
s(s
mal
l)R
esid
ues
(sm
all)
CM
-11
Surf
ace
prot
ectio
n,
coat
ing,
ele
ctro
plat
ing,
et
c.
95-9
7%
3-5%
2 ×
50,0
00
gallo
n W
aste
tank
sat
DP
site
“Wet
Che
mis
try”
95%
-99%
1-5%
Met
allic
Pu
for
rese
arch
Oxi
des,
scra
p m
etal
Var
ious
Pu
solu
tions
and
susp
ensi
ons
Fig.
4-3
. Fl
ow c
hart
of p
luto
nium
ope
ratio
ns in
D B
uild
ing

DRAFT FINAL REPORT OF CDC’S LAHDRA PROJECT – Chapter 4 4-5
Fig. 4-4. Monthly amounts of plutonium produced from plutonium nitrate in D-Building. This graph is not cumulative− by 1 September 1945, purification operations were producing just over 9 kg of purified plutonium per month, roughly ten times what the rate had been on 1 April 1945 (Hammel 1998)
Fig. 4-5. Cumulative amounts of plutonium received from Hanford in 1945 (Site Y 1945)
4-6 DRAFT FINAL REPORT OF CDC’S LAHDRA PROJECT – Chapter 4
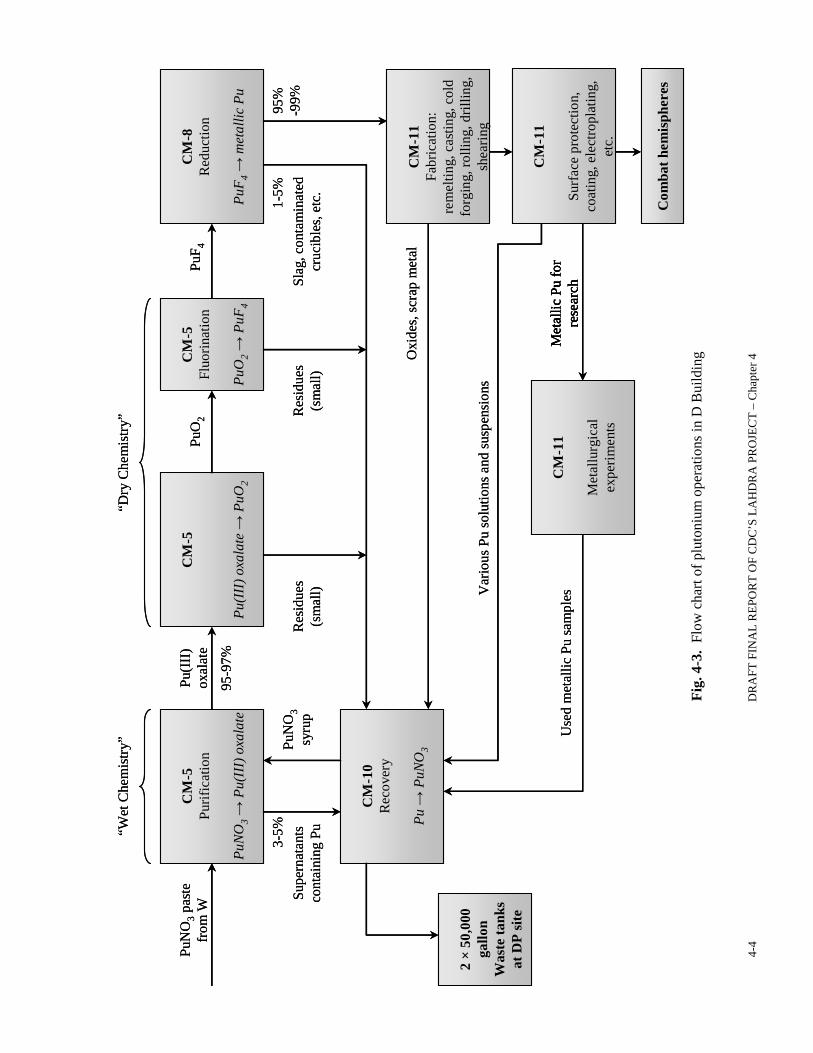
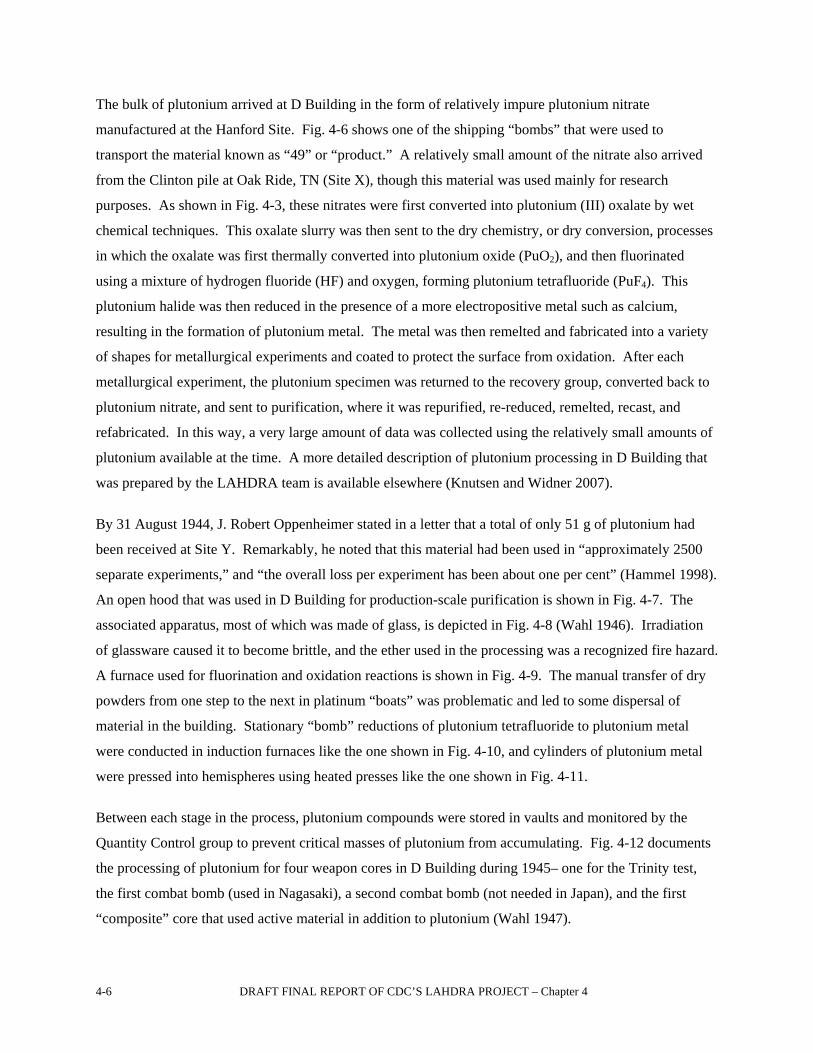
The bulk of plutonium arrived at D Building in the form of relatively impure plutonium nitrate
manufactured at the Hanford Site. Fig. 4-6 shows one of the shipping “bombs” that were used to
transport the material known as “49” or “product.” A relatively small amount of the nitrate also arrived
from the Clinton pile at Oak Ride, TN (Site X), though this material was used mainly for research
purposes. As shown in Fig. 4-3, these nitrates were first converted into plutonium (III) oxalate by wet
chemical techniques. This oxalate slurry was then sent to the dry chemistry, or dry conversion, processes
in which the oxalate was first thermally converted into plutonium oxide (PuO2), and then fluorinated
using a mixture of hydrogen fluoride (HF) and oxygen, forming plutonium tetrafluoride (PuF4). This
plutonium halide was then reduced in the presence of a more electropositive metal such as calcium,
resulting in the formation of plutonium metal. The metal was then remelted and fabricated into a variety
of shapes for metallurgical experiments and coated to protect the surface from oxidation. After each
metallurgical experiment, the plutonium specimen was returned to the recovery group, converted back to
plutonium nitrate, and sent to purification, where it was repurified, re-reduced, remelted, recast, and
refabricated. In this way, a very large amount of data was collected using the relatively small amounts of
plutonium available at the time. A more detailed description of plutonium processing in D Building that
was prepared by the LAHDRA team is available elsewhere (Knutsen and Widner 2007).
By 31 August 1944, J. Robert Oppenheimer stated in a letter that a total of only 51 g of plutonium had
been received at Site Y. Remarkably, he noted that this material had been used in “approximately 2500
separate experiments,” and “the overall loss per experiment has been about one per cent” (Hammel 1998).
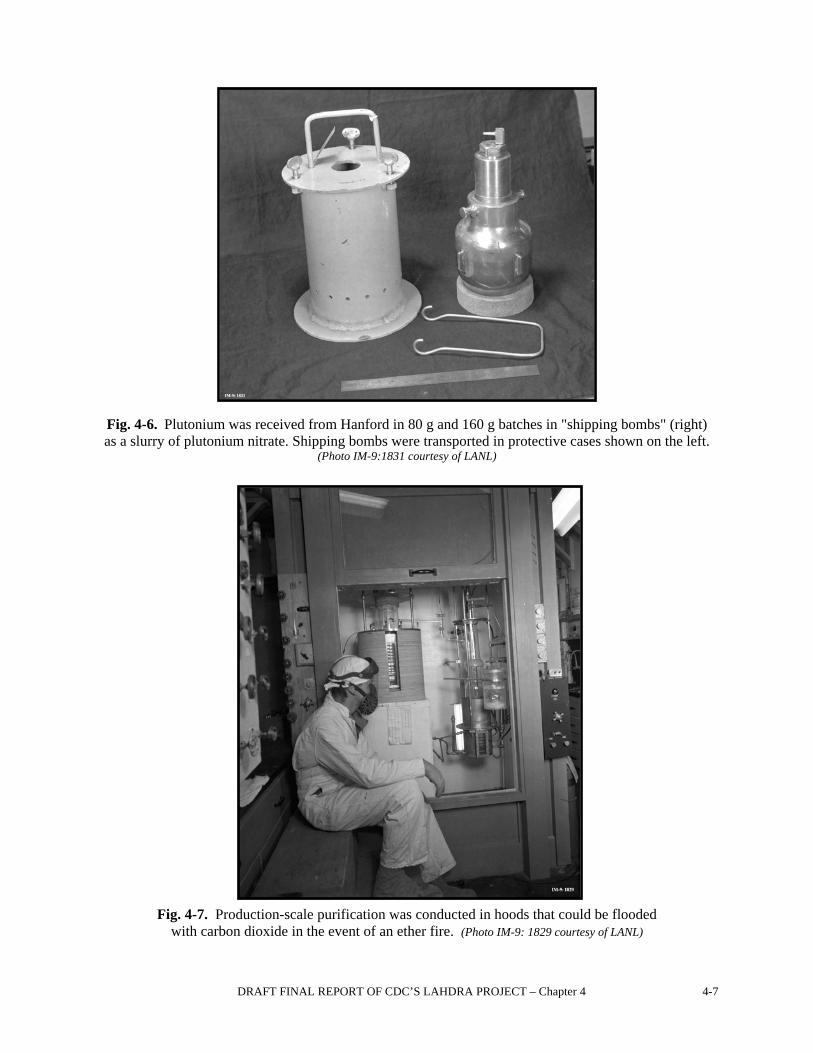
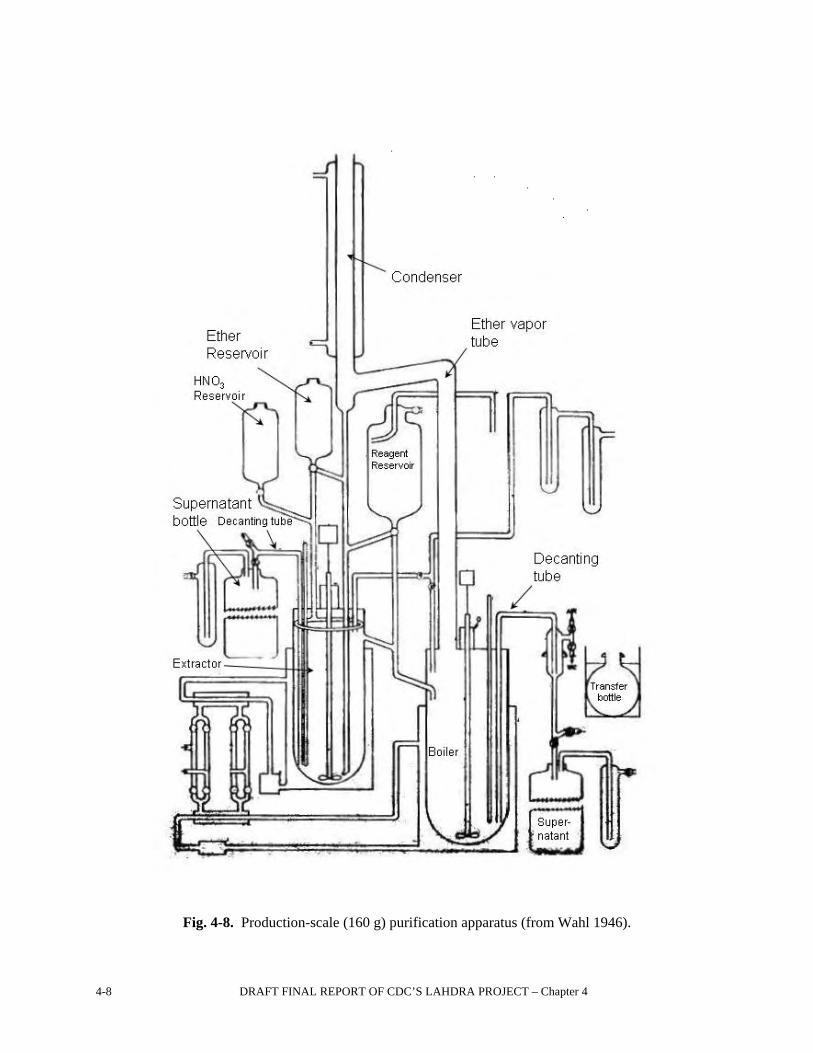
An open hood that was used in D Building for production-scale purification is shown in Fig. 4-7. The
associated apparatus, most of which was made of glass, is depicted in Fig. 4-8 (Wahl 1946). Irradiation
of glassware caused it to become brittle, and the ether used in the processing was a recognized fire hazard.
A furnace used for fluorination and oxidation reactions is shown in Fig. 4-9. The manual transfer of dry
powders from one step to the next in platinum “boats” was problematic and led to some dispersal of
material in the building. Stationary “bomb” reductions of plutonium tetrafluoride to plutonium metal
were conducted in induction furnaces like the one shown in Fig. 4-10, and cylinders of plutonium metal
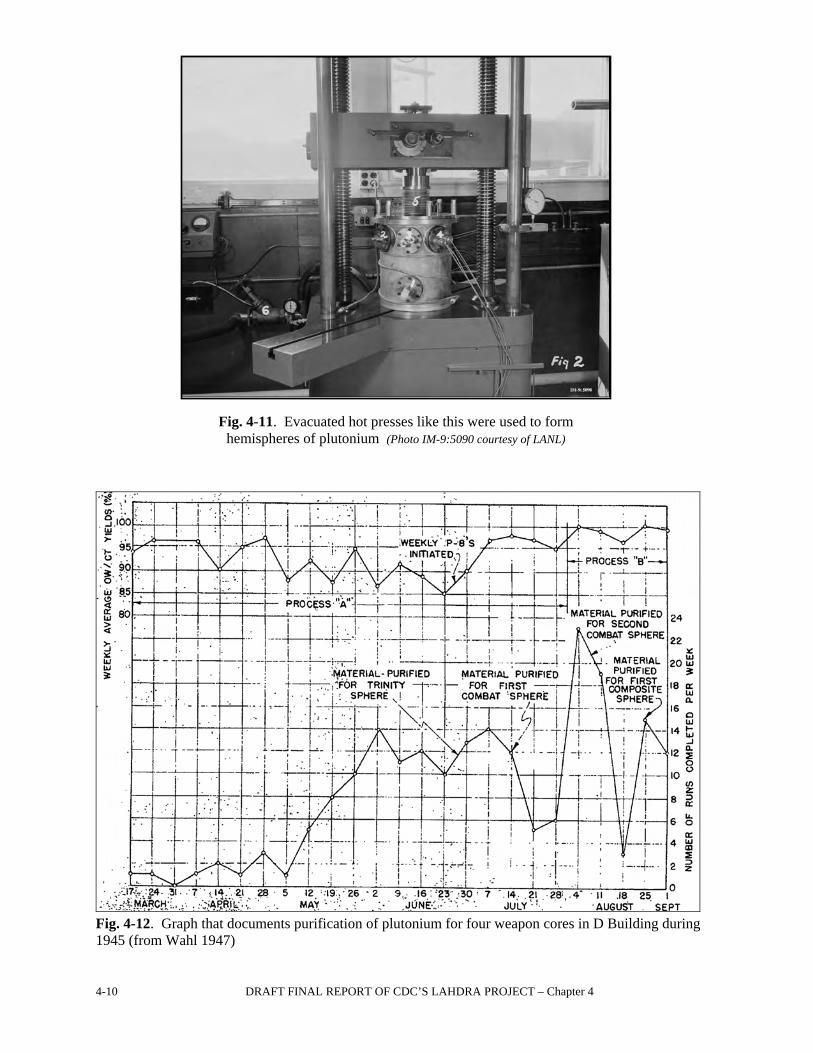
were pressed into hemispheres using heated presses like the one shown in Fig. 4-11.
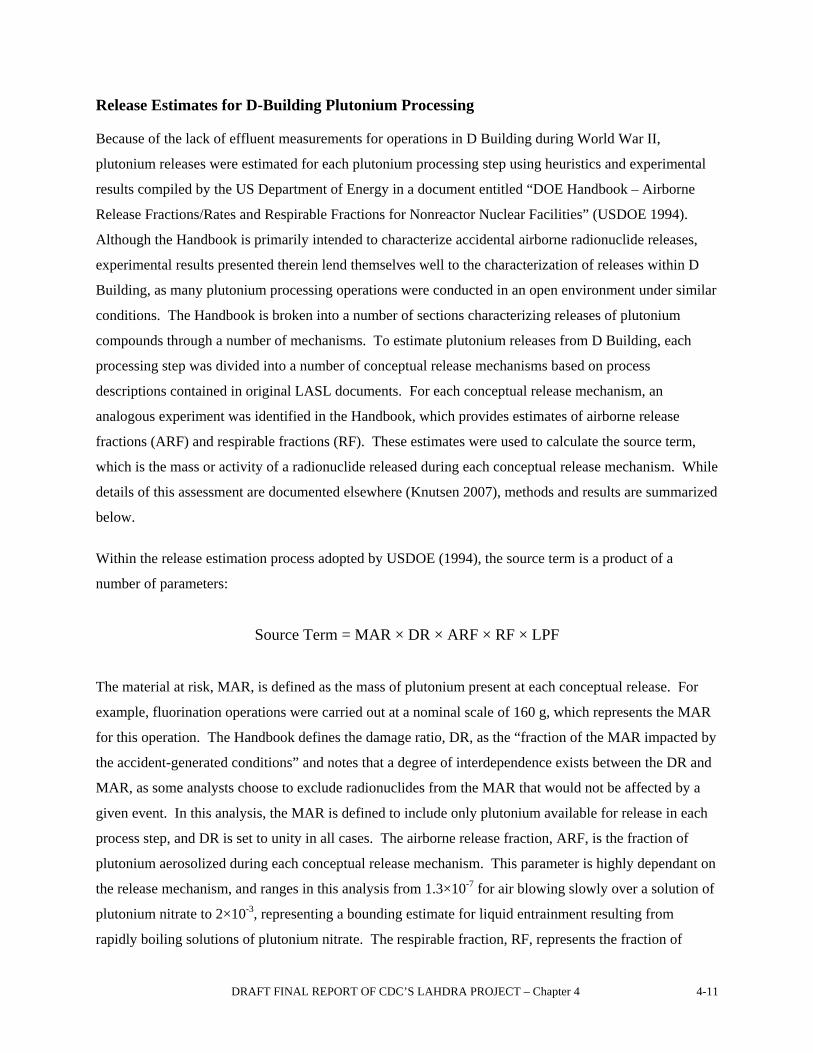
Between each stage in the process, plutonium compounds were stored in vaults and monitored by the
Quantity Control group to prevent critical masses of plutonium from accumulating. Fig. 4-12 documents
the processing of plutonium for four weapon cores in D Building during 1945– one for the Trinity test,
the first combat bomb (used in Nagasaki), a second combat bomb (not needed in Japan), and the first
“composite” core that used active material in addition to plutonium (Wahl 1947).
DRAFT FINAL REPORT OF CDC’S LAHDRA PROJECT – Chapter 4 4-7
Fig. 4-6. Plutonium was received from Hanford in 80 g and 160 g batches in "shipping bombs" (right) as a slurry of plutonium nitrate. Shipping bombs were transported in protective cases shown on the left.
(Photo IM-9:1831 courtesy of LANL)
Fig. 4-7. Production-scale purification was conducted in hoods that could be flooded with carbon dioxide in the event of an ether fire. (Photo IM-9: 1829 courtesy of LANL)
4-8 DRAFT FINAL REPORT OF CDC’S LAHDRA PROJECT – Chapter 4
Fig. 4-8. Production-scale (160 g) purification apparatus (from Wahl 1946).

DRAFT FINAL REPORT OF CDC’S LAHDRA PROJECT – Chapter 4 4-9
Fig. 4-10. This induction furnace powered by a 20 kW high frequency converter inside a fume hood was used to fire large-scale bomb reductions (from Baker 1946). (Photo IM-9:1824 courtesy of LANL)
Fig. 4-9. A furnace that was used for fluorination and oxidation reactions (Photo IM-9: 1832 courtesy of LANL)
4-10 DRAFT FINAL REPORT OF CDC’S LAHDRA PROJECT – Chapter 4
Fig. 4-12. Graph that documents purification of plutonium for four weapon cores in D Building during 1945 (from Wahl 1947)
Fig. 4-11. Evacuated hot presses like this were used to form hemispheres of plutonium (Photo IM-9:5090 courtesy of LANL)
DRAFT FINAL REPORT OF CDC’S LAHDRA PROJECT – Chapter 4 4-11
Release Estimates for D-Building Plutonium Processing
Because of the lack of effluent measurements for operations in D Building during World War II,
plutonium releases were estimated for each plutonium processing step using heuristics and experimental
results compiled by the US Department of Energy in a document entitled “DOE Handbook – Airborne
Release Fractions/Rates and Respirable Fractions for Nonreactor Nuclear Facilities” (USDOE 1994).
Although the Handbook is primarily intended to characterize accidental airborne radionuclide releases,
experimental results presented therein lend themselves well to the characterization of releases within D
Building, as many plutonium processing operations were conducted in an open environment under similar
conditions. The Handbook is broken into a number of sections characterizing releases of plutonium
compounds through a number of mechanisms. To estimate plutonium releases from D Building, each
processing step was divided into a number of conceptual release mechanisms based on process
descriptions contained in original LASL documents. For each conceptual release mechanism, an
analogous experiment was identified in the Handbook, which provides estimates of airborne release
fractions (ARF) and respirable fractions (RF). These estimates were used to calculate the source term,
which is the mass or activity of a radionuclide released during each conceptual release mechanism. While
details of this assessment are documented elsewhere (Knutsen 2007), methods and results are summarized
below.
Within the release estimation process adopted by USDOE (1994), the source term is a product of a
number of parameters:
Source Term = MAR × DR × ARF × RF × LPF
The material at risk, MAR, is defined as the mass of plutonium present at each conceptual release. For
example, fluorination operations were carried out at a nominal scale of 160 g, which represents the MAR
for this operation. The Handbook defines the damage ratio, DR, as the “fraction of the MAR impacted by
the accident-generated conditions” and notes that a degree of interdependence exists between the DR and
MAR, as some analysts choose to exclude radionuclides from the MAR that would not be affected by a
given event. In this analysis, the MAR is defined to include only plutonium available for release in each
process step, and DR is set to unity in all cases. The airborne release fraction, ARF, is the fraction of
plutonium aerosolized during each conceptual release mechanism. This parameter is highly dependant on
the release mechanism, and ranges in this analysis from 1.3×10⁻⁷ for air blowing slowly over a solution of
plutonium nitrate to 2×10⁻³, representing a bounding estimate for liquid entrainment resulting from
rapidly boiling solutions of plutonium nitrate. The respirable fraction, RF, represents the fraction of

4-12 DRAFT FINAL REPORT OF CDC’S LAHDRA PROJECT – Chapter 4
particles in a released aerosol small enough to be inhaled into the human respiratory system. The RF also
provides a method of estimating the fraction of aerosolized plutonium that could potentially reach the
rooftop of D Building via its ventilation system. The leak-path factor, LPF, is the fraction of aerosolized
particles that could be transported through a containment mechanism.
In this analysis, the LPF is used as a means to estimate plutonium released from apparatuses with
methods for containment in place. For example, production-scale purification and reduction processes
were designed to mitigate aerosolized releases, and the LPFs for these processes were set to a small value
based on professional judgment. The authors recognize that a high degree of uncertainty is associated
with each of these parameters. Therefore, a Monte Carlo simulation was conducted to assess the
sensitivity of each parameter to the overall D-Building source term. While the Handbook notes that
estimated parameter ranges “should not be used as a basis for an ARF statistical distribution” and
“specifically rejects citation as a defensible basis for such attempts,” a Monte Carlo approach was used in
this analysis as a means to assess parameter sensitivity and to provide some context to the range and
uncertainty associated with release estimates.
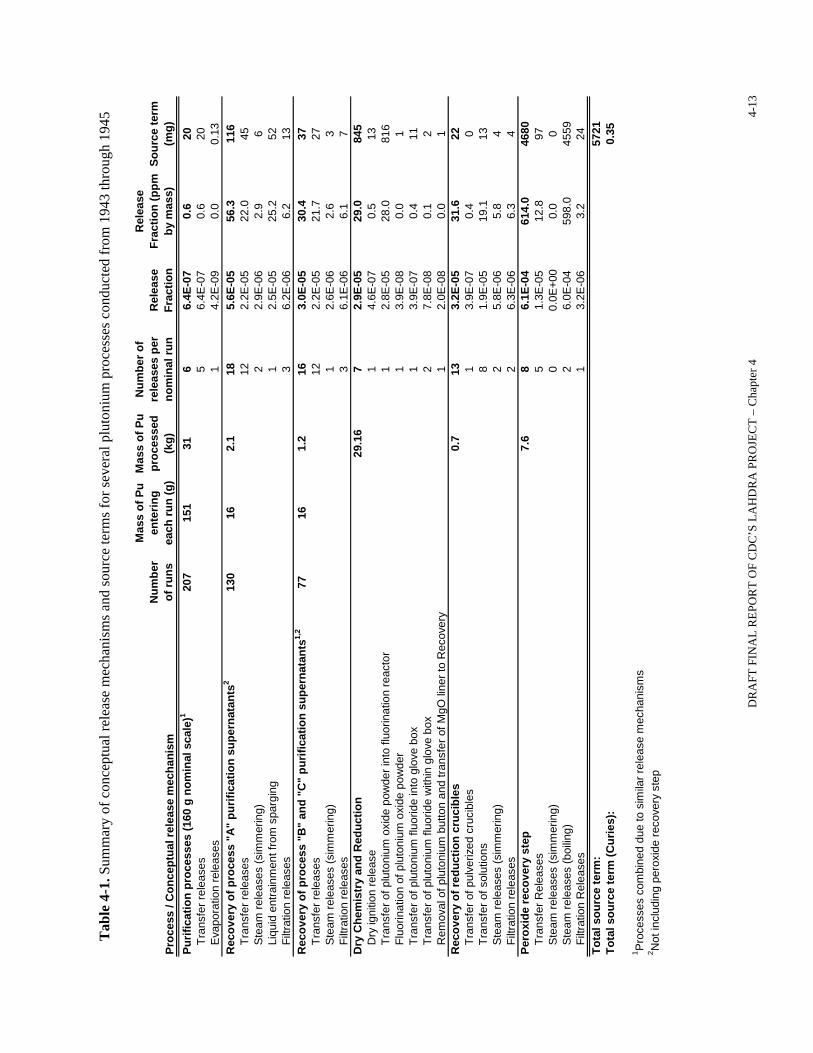
Shown in Table 4-1 are source terms estimated for various plutonium processing steps including
purification, dry chemistry, and reduction, in addition to the recovery of plutonium from residues
generated by each process. Note that source terms presented in Table 4-1 are calculated from nominal
values of ARF and RF for conceptual release mechanisms presented in the Handbook. Thus, the total
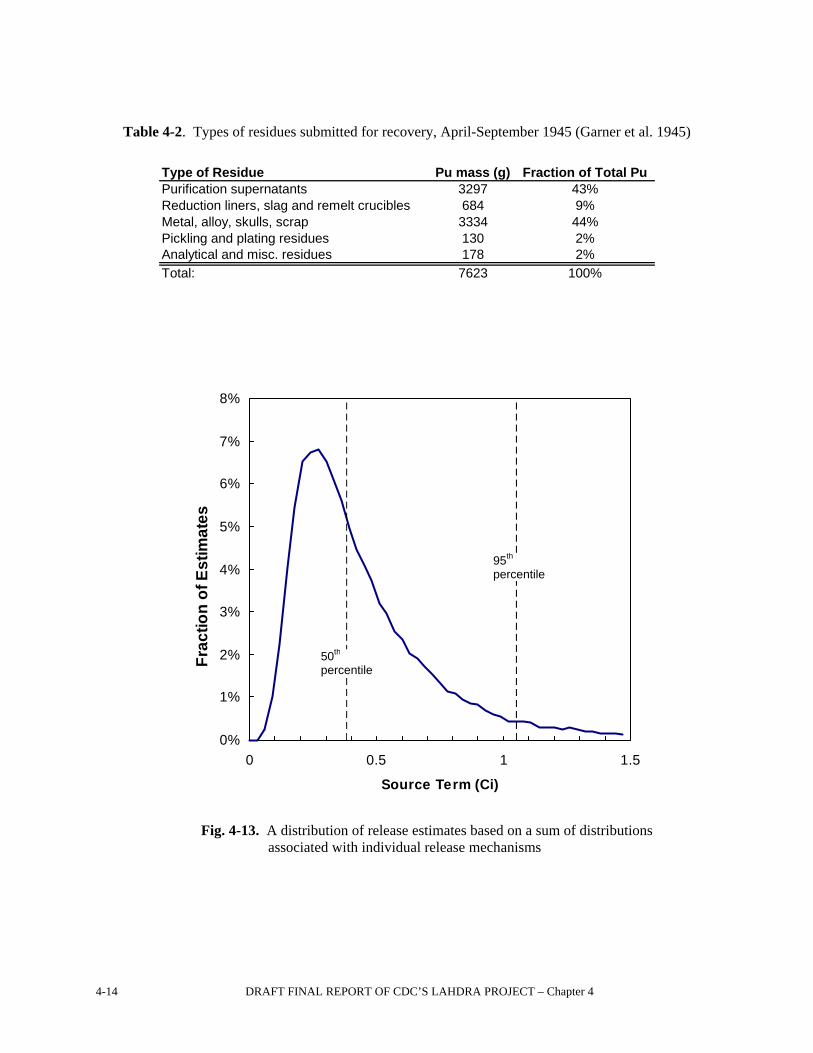
estimated source term of roughly 0.3 Ci is a nominal estimate, and a distribution of estimates shown in
Fig. 4-13 reveals a fairly large uncertainty, with a 95%-ile estimate of over 1 Ci. The details of release
estimates from one of the main plutonium process, plutonium recovery, are discussed below to illustrate
the process that was used.
Releases from Plutonium Recovery Recovery operations (Recovery) involved some open-air processing steps, and it was one of the most
contaminated groups in D Building (Duffy et al. 1945, Hemplemann et al. 1973). Recovery was
conducted without effective containment mechanisms because of the large variety of plutonium-
containing residues that Recovery received. This large variety of residues also makes it exceedingly
difficult in this analysis to characterize releases from all Recovery operations. Instead, releases associated
with more routine and well-documented recovery processes were focused on. As shown in Table 4-2, the
bulk of the plutonium-containing residues received for recovery were purification supernatants,
metallurgical samples (plutonium metal, alloy, skulls, scrap), and materials from reduction/remelting of
crucibles and slag (Garner et al. 1945).
D
RA
FT F
INA
L R
EPO
RT
OF
CD
C’S
LA
HD
RA
PR
OJE
CT
– C
hapt
er 4
4-
13
Tab
le 4
-1. S
umm
ary
of c
once
ptua
l rel
ease
mec
hani
sms a
nd so
urce
term
s for
seve
ral p
luto
nium
pro
cess
es c
ondu
cted
from
194
3 th
roug
h 19
45
Proc
ess
/ Con
cept
ual r
elea
se m
echa
nism
Num
ber
of ru
ns
Mas
s of
Pu
ente
ring
each
run
(g)
Mas
s of
Pu
proc
esse
d (k
g)
Num
ber o
fre
leas
es p
er
nom
inal
run
Rel
ease
Fr
actio
n
Rel
ease
Fr
actio
n (p
pm
by m
ass)
Sour
ce te
rm(m
g)Pu
rific
atio
n pr
oces
ses
(160
g n
omin
al s
cale
)120
715
131
66.
4E-0
70.
620
Tran
sfer
rele
ases
56.
4E-0
70.
620
Evap
orat
ion
rele
ases
14.
2E-0
90.
00.
13R
ecov
ery
of p
roce
ss "
A" p
urifi
catio
n su
pern
atan
ts2
130
162.
118
5.6E
-05
56.3
116
Tran
sfer
rele
ases
122.
2E-0
522
.045
Stea
m re
leas
es (s
imm
erin
g)2
2.9E
-06
2.9
6Li
quid
ent
rain
men
t fro
m s
parg
ing
12.
5E-0
525
.252
Filtr
atio
n re
leas
es3
6.2E
-06
6.2
13R
ecov
ery
of p
roce
ss "
B"
and
"C"
purif
icat
ion
supe
rnat
ants
1,2
7716
1.2
163.
0E-0
530
.437
Tran
sfer
rele
ases
122.
2E-0
521
.727
Stea
m re
leas
es (s
imm
erin
g)1
2.6E
-06
2.6
3Fi
ltrat
ion
rele
ases
36.
1E-0
66.
17
Dry
Che
mis
try
and
Red
uctio
n29
.16
72.
9E-0
529
.084
5D
ry ig
nitio
n re
leas
e1
4.6E
-07
0.5
13Tr
ansf
er o
f plu
toni
um o
xide
pow
der i
nto
fluor
inat
ion
reac
tor
12.
8E-0
528
.081
6Fl
uorin
atio
n of
plu
toni
um o
xide
pow
der
13.
9E-0
80.
01
Tran
sfer
of p
luto
nium
fluo
ride
into
glo
ve b
ox1
3.9E
-07
0.4
11Tr
ansf
er o
f plu
toni
um fl
uorid
e w
ithin
glo
ve b
ox2
7.8E
-08
0.1
2R
emov
al o
f plu
toni
um b
utto
n an
d tra
nsfe
r of M
gO li
ner t
o R
ecov
ery
12.
0E-0
80.
01
Rec
over
y of
redu
ctio
n cr
ucib
les
0.7
133.
2E-0
531
.622
Tran
sfer
of p
ulve
rized
cru
cibl
es1
3.9E
-07
0.4
0Tr
ansf
er o
f sol
utio
ns8
1.9E
-05
19.1
13St
eam
rele
ases
(sim
mer
ing)
25.
8E-0
65.
84
Filtr
atio
n re
leas
es2
6.3E
-06
6.3
4Pe
roxi
de re
cove
ry s
tep
7.6
86.
1E-0
461
4.0
4680
Tran
sfer
Rel
ease
s5
1.3E
-05
12.8
97St
eam
rele
ases
(sim
mer
ing)
00.
0E+0
00.
00
Stea
m re
leas
es (b
oilin
g)2
6.0E
-04
598.
045
59Fi
ltrat
ion
Rel
ease
s1
3.2E
-06
3.2
24To
tal s
ourc
e te
rm:
5721
Tota
l sou
rce
term
(Cur
ies)
:0.
35
1 Proc
esse
s co
mbi
ned
due
to s
imila
r rel
ease
mec
hani
sms
2 Not
incl
udin
g pe
roxi
de re
cove
ry s
tep
4-14 DRAFT FINAL REPORT OF CDC’S LAHDRA PROJECT – Chapter 4
0%
1%
2%
3%
4%
5%
6%
7%
8%
0 0.5 1 1.5
Source Term (Ci)
Frac
tion
of E
stim
ates
.
Table 4-2. Types of residues submitted for recovery, April-September 1945 (Garner et al. 1945)
Type of Residue Pu mass (g) Fraction of Total PuPurification supernatants 3297 43%Reduction liners, slag and remelt crucibles 684 9%Metal, alloy, skulls, scrap 3334 44%Pickling and plating residues 130 2%Analytical and misc. residues 178 2%Total: 7623 100%
Fig. 4-13. A distribution of release estimates based on a sum of distributions associated with individual release mechanisms
50th percentile
95th percentile
DRAFT FINAL REPORT OF CDC’S LAHDRA PROJECT – Chapter 4 4-15
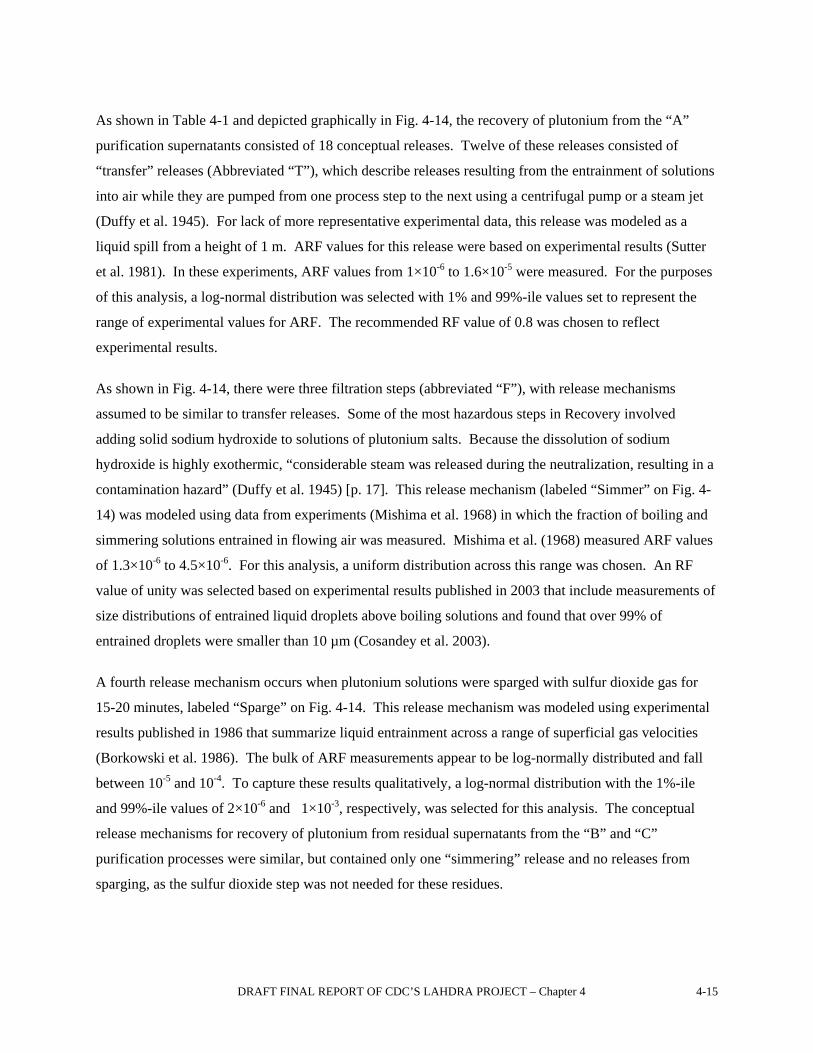
As shown in Table 4-1 and depicted graphically in Fig. 4-14, the recovery of plutonium from the “A”
purification supernatants consisted of 18 conceptual releases. Twelve of these releases consisted of
“transfer” releases (Abbreviated “T”), which describe releases resulting from the entrainment of solutions
into air while they are pumped from one process step to the next using a centrifugal pump or a steam jet
(Duffy et al. 1945). For lack of more representative experimental data, this release was modeled as a
liquid spill from a height of 1 m. ARF values for this release were based on experimental results (Sutter
et al. 1981). In these experiments, ARF values from 1×10⁻⁶ to 1.6×10⁻⁵ were measured. For the purposes
of this analysis, a log-normal distribution was selected with 1% and 99%-ile values set to represent the
range of experimental values for ARF. The recommended RF value of 0.8 was chosen to reflect
experimental results.
As shown in Fig. 4-14, there were three filtration steps (abbreviated “F”), with release mechanisms
assumed to be similar to transfer releases. Some of the most hazardous steps in Recovery involved
adding solid sodium hydroxide to solutions of plutonium salts. Because the dissolution of sodium
hydroxide is highly exothermic, “considerable steam was released during the neutralization, resulting in a
contamination hazard” (Duffy et al. 1945) [p. 17]. This release mechanism (labeled “Simmer” on Fig. 4-
14) was modeled using data from experiments (Mishima et al. 1968) in which the fraction of boiling and
simmering solutions entrained in flowing air was measured. Mishima et al. (1968) measured ARF values
of 1.3×10⁻⁶ to 4.5×10⁻⁶. For this analysis, a uniform distribution across this range was chosen. An RF
value of unity was selected based on experimental results published in 2003 that include measurements of
size distributions of entrained liquid droplets above boiling solutions and found that over 99% of
entrained droplets were smaller than 10 µm (Cosandey et al. 2003).
A fourth release mechanism occurs when plutonium solutions were sparged with sulfur dioxide gas for
15-20 minutes, labeled “Sparge” on Fig. 4-14. This release mechanism was modeled using experimental
results published in 1986 that summarize liquid entrainment across a range of superficial gas velocities
(Borkowski et al. 1986). The bulk of ARF measurements appear to be log-normally distributed and fall
between 10-5 and 10-4. To capture these results qualitatively, a log-normal distribution with the 1%-ile
and 99%-ile values of 2×10⁻⁶ and 1×10⁻³, respectively, was selected for this analysis. The conceptual
release mechanisms for recovery of plutonium from residual supernatants from the “B” and “C”
purification processes were similar, but contained only one “simmering” release and no releases from
sparging, as the sulfur dioxide step was not needed for these residues.
4-16 DRAFT FINAL REPORT OF CDC’S LAHDRA PROJECT – Chapter 4
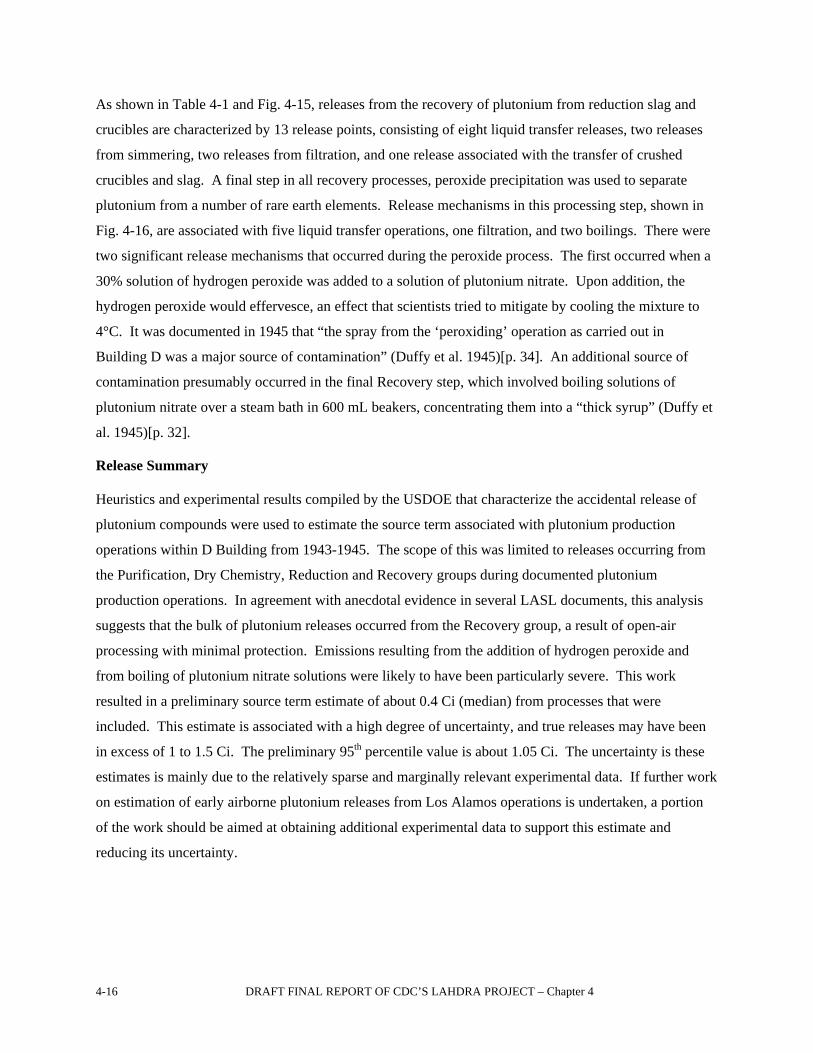
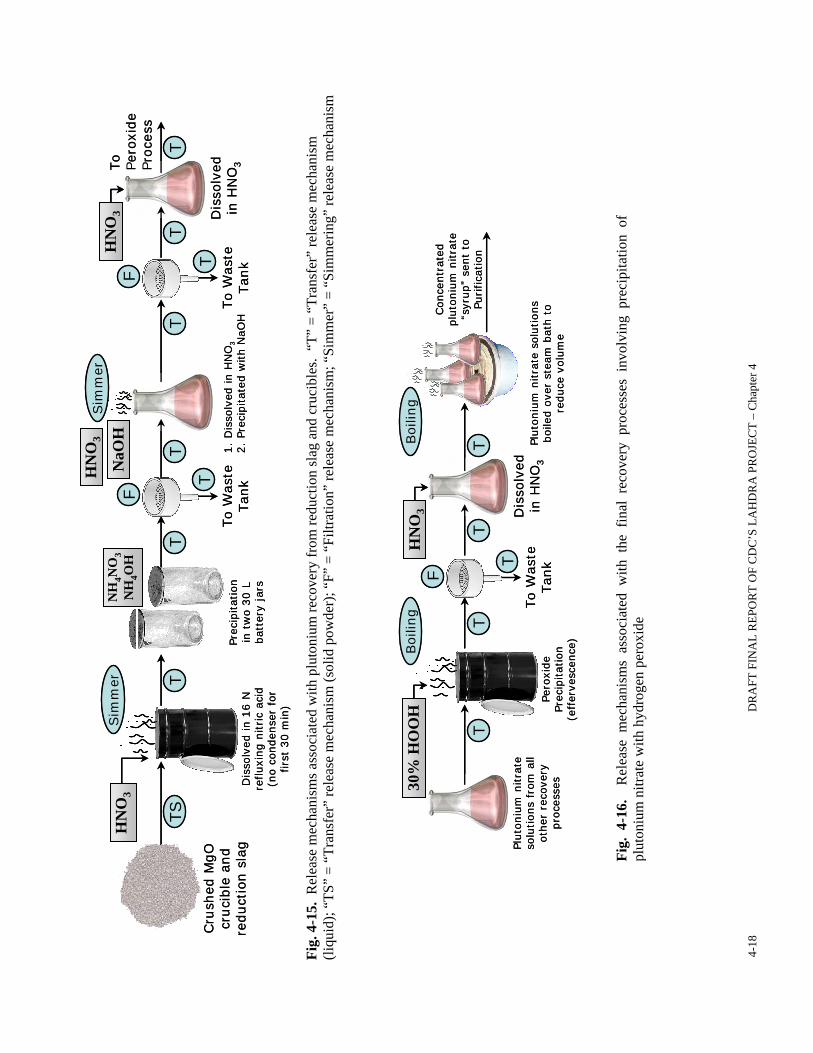
As shown in Table 4-1 and Fig. 4-15, releases from the recovery of plutonium from reduction slag and
crucibles are characterized by 13 release points, consisting of eight liquid transfer releases, two releases
from simmering, two releases from filtration, and one release associated with the transfer of crushed
crucibles and slag. A final step in all recovery processes, peroxide precipitation was used to separate
plutonium from a number of rare earth elements. Release mechanisms in this processing step, shown in
Fig. 4-16, are associated with five liquid transfer operations, one filtration, and two boilings. There were
two significant release mechanisms that occurred during the peroxide process. The first occurred when a
30% solution of hydrogen peroxide was added to a solution of plutonium nitrate. Upon addition, the
hydrogen peroxide would effervesce, an effect that scientists tried to mitigate by cooling the mixture to
4°C. It was documented in 1945 that “the spray from the ‘peroxiding’ operation as carried out in
Building D was a major source of contamination” (Duffy et al. 1945)[p. 34]. An additional source of
contamination presumably occurred in the final Recovery step, which involved boiling solutions of
plutonium nitrate over a steam bath in 600 mL beakers, concentrating them into a “thick syrup” (Duffy et
al. 1945)[p. 32].
Release Summary Heuristics and experimental results compiled by the USDOE that characterize the accidental release of
plutonium compounds were used to estimate the source term associated with plutonium production
operations within D Building from 1943-1945. The scope of this was limited to releases occurring from
the Purification, Dry Chemistry, Reduction and Recovery groups during documented plutonium
production operations. In agreement with anecdotal evidence in several LASL documents, this analysis
suggests that the bulk of plutonium releases occurred from the Recovery group, a result of open-air
processing with minimal protection. Emissions resulting from the addition of hydrogen peroxide and
from boiling of plutonium nitrate solutions were likely to have been particularly severe. This work
resulted in a preliminary source term estimate of about 0.4 Ci (median) from processes that were
included. This estimate is associated with a high degree of uncertainty, and true releases may have been
in excess of 1 to 1.5 Ci. The preliminary 95th percentile value is about 1.05 Ci. The uncertainty is these
estimates is mainly due to the relatively sparse and marginally relevant experimental data. If further work
on estimation of early airborne plutonium releases from Los Alamos operations is undertaken, a portion
of the work should be aimed at obtaining additional experimental data to support this estimate and
reducing its uncertainty.

DR
AFT
FIN
AL
REP
OR
T O
F C
DC
’S L
AH
DR
A P
RO
JEC
T –
Cha
pter
4
4-17
NaO
H
Sim
mer
Puri
fica
tion
Super
nat
ants
1,4
,6H
ydro
xide
Pre
cipitation
TT
To
Wast
eTan
kT
Puri
fica
tion
Super
nata
nts
2,3
1.
Sulfat
e Red
uct
ion
2.
Hyd
roxi
de
Prec
ipitat
ion
T
NaO
H
SO2
T
To W
aste
TankT
FF
Ace
tate
T
1.
Dis
solv
ed in n
itri
c ac
id2.
Prec
ipitat
ed w
ith a
ceta
te
HN
O3
T
Filtra
teRecy
cledT
F
Sim
mer
Spar
ge
T
Ace
tate
Wash
Dis
solv
edin
HN
O3
TT
To
Per
oxi
de
Proce
ss
Ace
tate
HN
O3
T F
= “
Tra
nsf
er”
Rel
ease
= “
Filtra
tion”
Rel
ease
NaO
H
Sim
mer
Puri
fica
tion
Super
nat
ants
1,4
,6H
ydro
xide
Pre
cipitation
TT
To
Wast
eTan
kT
Puri
fica
tion
Super
nata
nts
2,3
1.
Sulfat
e Red
uct
ion
2.
Hyd
roxi
de
Prec
ipitat
ion
T
NaO
H
SO2
T
To W
aste
TankT
FF
Ace
tate
T
1.
Dis
solv
ed in n
itri
c ac
id2.
Prec
ipitat
ed w
ith a
ceta
te
HN
O3
T
Filtra
teRecy
cledT
F
Sim
mer
Spar
ge
T
Ace
tate
Wash
Dis
solv
edin
HN
O3
TT
To
Per
oxi
de
Proce
ss
Ace
tate
HN
O3
T F
= “
Tra
nsf
er”
Rel
ease
= “
Filtra
tion”
Rel
ease
T F
= “
Tra
nsf
er”
Rel
ease
= “
Filtra
tion”
Rel
ease
Fig.
4-1
4. F
low
dia
gram
of r
ecov
ery
rele
ase
mec
hani
sms d
urin
g re
cove
ry o
f plu
toni
um fr
om re
sidu
al p
urifi
catio
n su
pern
atan
ts
4-18
DR
AFT
FIN
AL
REP
OR
T O
F C
DC
’S L
AH
DR
A P
RO
JEC
T –
Cha
pter
4
NH
4NO
3N
H4O
H
Cru
shed
MgO
cruci
ble
and
reduct
ion s
lag
TS
T
Sim
mer
HN
O3
Dis
solv
ed in 1
6 N
re
fluxi
ng n
itric
acid
(n
o c
onden
ser
for
firs
t 30 m
in)
Prec
ipitat
ion
in t
wo 3
0 L
bat
tery
jar
s
T
To
Wast
eTan
kT
F
T
NaO
H
1.
Dis
solv
ed in H
NO
32.
Prec
ipitat
ed w
ith N
aOH
HN
O3
Sim
mer
T
To
Wast
eTan
kT
F
Dis
solv
edin
HN
O3
TT
HN
O3
To
Pero
xide
Proce
ss
Pluto
niu
m n
itra
te
solu
tions
from
all
oth
er r
ecov
ery
pro
cess
es
T
To W
ast
eTankT
F
T
Pero
xide
Prec
ipitation
(eff
erve
scen
ce)
Dis
solv
edin
HN
O3
TT
HN
O3
Pluto
niu
m n
itra
te s
olu
tions
boile
d o
ver
stea
m b
ath t
o
reduce
volu
me
Boi
ling
Conce
ntr
ated
plu
toniu
m n
itra
te
“syr
up”
sent
to
Purifica
tion
30%
HO
OH
Boi
ling
Pluto
niu
m n
itra
te
solu
tions
from
all
oth
er r
ecov
ery
pro
cess
es
T
To W
ast
eTankT
F
T
Pero
xide
Prec
ipitation
(eff
erve
scen
ce)
Dis
solv
edin
HN
O3
TT
HN
O3
Pluto
niu
m n
itra
te s
olu
tions
boile
d o
ver
stea
m b
ath t
o
reduce
volu
me
Boi
ling
Conce
ntr
ated
plu
toniu
m n
itra
te
“syr
up”
sent
to
Purifica
tion
30%
HO
OH
Boi
ling
Fig.
4-1
5. R
elea
se m
echa
nism
s ass
ocia
ted
with
plu
toni
um re
cove
ry fr
om re
duct
ion
slag
and
cru
cibl
es.
“T”
= “T
rans
fer”
rele
ase
mec
hani
sm
(liqu
id);
“TS”
= “
Tran
sfer
” re
leas
e m
echa
nism
(sol
id p
owde
r); “
F” =
“Fi
ltrat
ion”
rele
ase
mec
hani
sm; “
Sim
mer
” =
“Sim
mer
ing”
rele
ase
mec
hani
sm
Fig.
4-1
6.
Rel
ease
mec
hani
sms
asso
ciat
ed w
ith t
he f
inal
rec
over
y pr
oces
ses
invo
lvin
g pr
ecip
itatio
n of
plut
oniu
m n
itrat
e w
ith h
ydro
gen
pero
xide
DRAFT FINAL REPORT OF CDC’S LAHDRA PROJECT – Chapter 4 4-19
Indoor Measurements of Airborne Radioactivity as a Source of Information about Plutonium Releases from D Building during World War II
One of the major operational areas from which plutonium releases were unmonitored was D-Building
operations from 1943 until 1954. D Building was the site of the process development, production of the
plutonium components of the early nuclear weapons, analytical chemistry operations, and metallurgical
research and development. Although major plutonium component production activities were transferred
to new processing facilities at DP West Site in late 1945, D Building continued to be an active and
expanding facility until the Chemistry and Metallurgical Research (CMR) Building at TA-3 became
operational around 1953.
As D Building was the first facility to process plutonium in visible quantities and fabricate weapon
components, many environmental safety and health practices considered routine today had not been
developed. Work that today would be carried out in glove boxes with multiple stages of HEPA filtration
on the exhaust was instead conducted in open hoods or on laboratory benches. Working conditions
experienced after multi-gram quantities of plutonium began to arrive at Los Alamos in late 1944 rapidly
deteriorated. In May of 1945, Wright Langham made a trip to Chicago to describe what steps were being
taken at Los Alamos to protect the workers, including the recently developed monitoring methods
utilizing bioassay. The push to develop and test the implosion device was considerable until the war was
successfully concluded.
Although LAHDRA team members were unable to locate any stack monitoring records for D Building for
any portions of its operational period, workers at Los Alamos frequently took measurements of the
airborne concentrations of plutonium in various rooms and locations around D Building. From these
concentrations, estimated room volumes, ventilation rates and some other assumptions, a lower bound
estimate of plutonium releases can be made. This estimate must be considered a lower bound for several
reasons. A large portion of releases apparently occurred from operational activities conducted in hoods,
glove boxes, and other enclosures. Releases of the contaminated air in laboratories would be expected to
be small compared to the unmonitored releases from work performed in laboratory hoods and other
primitive confinement devices that exhausted directly to the environment via roof-top vents. Those
releases are the subject of a separate analysis. Also, there were no measurements made during the highly
problematic startup period with larger quantities of plutonium, roughly from December 1944 to August
1945. The measurements that were reported were made after the end of the war and after efforts were
made to improve operational conditions within D Building. Finally, the rooms that had plutonium

4-20 DRAFT FINAL REPORT OF CDC’S LAHDRA PROJECT – Chapter 4
measurements reported had results for less than 14% of all months. Many had only a few measurements
during the entire period.
The monthly reports listed average (and at times, maximum) values recorded over the month. The
reporting of data clearly separated rooms that housed enriched uranium activities from those that housed
plutonium operations, and the room assignments do not appear to have been interchanged significantly
over time. This separation of uranium and plutonium operations must have been intended to simplify the
control and measurement of contamination and was later continued at DP Site.
Measurements were made in 116 unique areas within D Building. Some were rooms with the same
number but differing letters (such as D-116 and D-116A) and other areas were hallways, change rooms,
attics, and conference rooms. One might have had a total of 11,832 room-months of measurements (102
months times 116 rooms); however, a total of only 1,616 monthly measurements were reported for the
entire time period that started in August 1945.
The release of plutonium over time for the room air exhausted was calculated by the LAHDRA team
using the following assumptions:
• 25% of room air volume is contaminated (heuristic estimate)
• 30 air changes per h (based on interview with LANL staff)
• Room Height = 10 ft for all rooms
• Detector intrinsic efficiency of 80%
• Filter Burial Factor of 1.602 (LANL has suggested a value of 2, not yet incorporated into this part of the study)
• Counting Geometry Factor of 2
The last three assumptions result in a total factor of 4.005 for the conversion of air sample counting
results from counts per minute per liter (“c/m/l” or c/min/L) to disintegrations per minute per liter
(“d/m/l” or d/min/L).
The following equations were used to estimate the total release in a month for a given room:
(d/min/L) = (c/min/L) × 4.005
(d/min/h) = (d/min/L) × (room volume) × 0.25 of room air contaminated × 30 air changes h-1
(d/min released in a month) = (d/min/h) ×(d/month) × 24 h d-1
(Ci released) = (d/min released) / (3.7×10¹⁰ d s-1 Ci-1 × 60 s min-1)
DRAFT FINAL REPORT OF CDC’S LAHDRA PROJECT – Chapter 4 4-21
Room air concentration data were compiled from the CMR-12 monthly reports into a spreadsheet. Room
volumes were calculated based on LANL drawings of D Building. For areas with no defined volume,
such as hallways, the volume of the section of hallway immediately adjacent to a laboratory was used
(with a further reduction associated with the assumption that only 25% of that volume is contaminated).
At present, the limitation of the contamination to 25% of the room air and also to a small section of
hallway is felt to be non-conservative and produces a lower bound for the calculated releases.
To emphasize the degree of non-conservatism in this estimate, in 1948, LANL began to better understand
the nature of releases from D Building and glove boxes. In a study published in 1948, three rooms in D
Building were subjected to air sampling for a little more than one year (Kennedy 1948). These rooms
were used for processes that are not considered in the earlier section of this Chapter entitled “Release
Estimates for D-Building Plutonium Processing.” They included Room 134, which was used in 1947 for
preparation of plutonium alloys and samples. The air in this room would have released 1.5 mCi of
plutonium in 1947 with the room air model assumptions given above. The releases to room air comprise
a small fraction of the total plutonium released, since many of the operations were conducted in dryboxes.
The plutonium released to room air largely came from transfers of material through the room to other
boxes and from handling the material in the open. Releases from the dryboxes during grinding and
polishing to prepare metallurgical samples for analysis were unmeasured and were another significant
source of releases.
As mentioned above, the monthly reports yielded a total of 1,616 data points from 116 rooms over 102
months. This means that over 14% of the cells in the spreadsheet have values. All the data in a given
year was compiled into a distribution and tested. The data for each year followed a log-normal
distribution, with no year showing a smaller residual than 0.93. These distributions could be used, if
further evaluation of D-Building releases is undertaken, to stochastically estimate air concentrations for
rooms each month for which no measurements were reported.
The sum of estimated releases over all months with reported measurements is 0.0109 Ci of alpha emitting
radioactivity. Recall that this calculation is a partial representation of D-Building releases. In order to
account for the rooms each month that have no results reported, additional assumptions must be made.
This memo considers two possible approaches:
• One method would be to simply assume that the unmeasured rooms have the same average
contamination as the average measured room. Using this assumption, a value of 0.08 Ci is obtained.
This method essentially increases the total estimated for sampled rooms by a factor of the total of
11,832 room-months divided by 1,616 reported room-months.
4-22 DRAFT FINAL REPORT OF CDC’S LAHDRA PROJECT – Chapter 4
• Many rooms have low concentrations reported. An alternate approach is to assume that the average
measured concentration in a given room is constant for that room. Under this assumption, a total room
air release of 6.12 Ci is obtained. There are rooms with high concentrations and few measurements
that result in the larger release estimate under this approach, which assigns higher values to
unmeasured periods than the average of measurements across all rooms.
This range of estimates (from 0.08 to 6.12 Ci) does not include the troublesome startup period of D-
Building operations. Although this startup period represented 8% of the 102 months for which limited
monitoring data are available, improvements in confinement devices might easily have afforded a factor
of 10 reduction in air concentrations in a given laboratory by the time monitoring began. Thus, the early
8-month period during which multi-gram quantities of plutonium was being processed might have been
an important period for environmental releases that this preliminary assessment does not address.
TA-21 (DP Site) Historical Plutonium Processing— DP West
In January 1945, a serious fire that broke out in C Building within the Original Technical Area raised
concerns about the possibility of a fire in D Building. This, plus a dramatic increase in the amounts of
plutonium handled in D Building and concerns about the need to house plutonium and polonium safely,
led to planning of new facility to be called DP Site and later TA-21. DP West took over the plutonium
production functions of D Building. Most DP Site facilities were constructed in 1944-1945, and the
necessary process equipment was installed during this time as well. Operations appeared to have started
near the end of November 1945 (Meyer and Schulte 1944-1956).
The primary functions of DP West were to: 1) produce metal and alloys of plutonium and other
transuranic elements from nitrate solution feedstock; 2) fabricate these metals into precision shapes; 3)
provide and install protective claddings; 4) measure the chemical and physical properties of these metals
and alloys; and 5) recycle scrap or materials used in experiments (Valentine et al. 1982).
Fig. 4-17 shows the early layout of DP West (Christenson and Maraman 1969). Photos of DP West are
shown as Fig. 4-18 and Fig. 4-19. Buildings 2 and 3 housed wet chemistry processes, and Buildings 4
and 5 housed dry chemistry processes. Building 12 was the main filter building for exhausted air.

DRAFT FINAL REPORT OF CDC’S LAHDRA PROJECT – Chapter 4 4-23
1 2 35
Los Alamos Canyon
DP Canyon Building 12 (filter building) Exhaust
ductwork Manifold Main stacks (4)
4
East entrance road, to Los Alamos townsite
Fig. 4-17. Early DP West Site Building Layout and Main Functions
Fig. 4-18. DP West site, looking north, date unknown. Plutonium process buildings 2, 3, 4, and 5 are labeled, as arethe filter building (12) and associated ductwork, manifold, and stacks. From photo IM-9:15926 courtesy of LANL.

4-24 DRAFT FINAL REPORT OF CDC’S LAHDRA PROJECT – Chapter 4
Fig. 4-20 presents a flow diagram of process used in early DP West Site operations in processing of
plutonium and production of atomic weapon components (Kennedy 1947).
Following are summaries of the activities performed in each major building at DP West:
• Building 2 (TA-21-2)– housed gloveboxes for dissolution and recovery of plutonium and storage of 241Am wastes. The building housed a scrap incinerator, solvent extraction columns, and a liquid-
waste loading area. On 30 December 1958, a criticality accident occurred in Building 2 South
involving separated phases in a plutonium process tank. The operator (Cecil Kelley) died 36 hours
later.
• Building 3 (TA-21-3)– housed the oxalate precipitation operations.
• Building 4 (TA-21-4)– housed some development laboratories for plutonium research from 1945 to
1948 at which point the laboratories were converted to production areas for enriched uranium
hydride. In 1960, the hydride equipment was removed so that a hot cell could be added for the
examination of irradiated plutonium and enriched uranium fuel elements. In 1965, two glovebox
lines were added to support the 238Pu metal production. The above programs were part of Rooms 401
and 401E on the north end of the building (Valentine et al. 1982). Rooms 403, 404, 405, 406, and
407 also had gloveboxes that were used for 239Pu and 238Pu metal preparation during these early years.
Fig. 4-19. Primary buildings of DP West on 16 May 1947. Photo courtesy of LANL (IM-9: 05426)

D
RA
FT F
INA
L R
EPO
RT
OF
CD
C’S
LA
HD
RA
PR
OJE
CT
– C
hapt
er 4
4
-25
Fig.
4-2
0. A
flow
char
t of e
arly
plu
toni
um p
roce
ssin
g op
erat
ions
at D
P W
est S
ite (f
rom
Ken
nedy
194
7)

4-26 DRAFT FINAL REPORT OF CDC’S LAHDRA PROJECT – Chapter 4
• Building 21 (TA-21-21) – was a vault for storage of uranium and plutonium metal.
• Building 33 (TA-21-33) – housed research efforts into collecting additional plutonium from waste
streams.
• Building 150 (TA-21-150) – was built in 1963 as a plutonium fuels development building (Repos.
No. 2344). This building was built next to Building 5. Some of the programs the building supported
included: 1) the development of 238Pu heat sources for space electric power applications; 2)
investigations of various ceramic materials containing plutonium for use in the Liquid Metal Fast
Breeder Reactor (LMFBR) program; and 3) the development of 238Pu fuels for isotopic powered heat
sources for powering artificial organs (Valentine et al. 1982).
In an incident in DP West Building 150 on 7 October 1970, a sealed capillary broke, resulting in the
release of a reported 10 ug of 238Pu up a vent. Resulting concentrations were estimated to be 2,800
times the AEC maximum permissible concentration (MPC) for insoluble 238Pu. Air samples were
analyzed from the DP fence line, near private housing just west of the west end of the airport runway,
and at the airport terminal air particulate sampler. Maximum reported air concentrations were
1.27×10⁻¹⁴ µCi mL-1 238Pu at housing near the airport runway and 0.29×10⁻¹⁴ µCi mL-1 239Pu at the DP
Site fence (Kennedy 1970, Meyer 1970).
• Building 210 (TA-21-210) – housed additional research activities on the properties and uses of
plutonium.
DP West Air Handling and Stack Air Sampling
Buildings 2, 3, 4, and 5 each had an intake air fan. The air was filtered and then distributed by a system
of ducts that entered the rooms of the buildings at the ceiling. The exhaust air left the rooms by another
system of ducts that lead into a large common duct located on the roof of each building. All dryboxes and
hoods for each building were vented into this common exhaust duct (LAB-CMR-12-60).
These common ducts converged into a large manifold in Building 12, where the air was supposed to mix
to a uniform concentration. The air then passed through the precipitrons. The precipitrons were
electrostatic units that used electric fields to ionize and capture particles. The air then passed through a
single bank of American Air Filter Company type PL-24 filters (Christensen et al. 1975). The air was
finally discharged by exhaust fans out of four stacks that were approximately 57 feet tall. In the early
days of DP West, the exhaust air was sampled in the common exhaust ducts, the Building 12 manifold,

DRAFT FINAL REPORT OF CDC’S LAHDRA PROJECT – Chapter 4 4-27
and in each stack. Modified “Filter Queen” vacuum cleaners were used to sample the exhaust air at these
locations (Maraman et al. 1975).
The DP West Site exhaust treatment systems were improved over the decades of site operations
(Maraman et al. 1975). A single bank of HEPA filters was installed in the DP West Site’s combined
process exhaust system in 1959. The process exhaust system was separated from the plant exhaust
system at that time. As part of the work during 1959, a cleaning of the room exhaust plenum resulted in a
spike in measured airborne releases. The room exhaust plenum was again cleaned in 1973, leading to
another spike in releases. Two banks of HEPA filters were installed in the process exhaust system in
1973, the same year in which a single bank of HEPA filters was installed in the room air exhaust system.
More Recent Plutonium Processing
In 1969, the decision was made to build a new facility, TA-55, the Plutonium Facility Site. Processing of
plutonium and research on plutonium metallurgy are done at this site, which is also known as “PF Site.”
Operations at TA-55 include processing and recovery of 239Pu from scrap materials, recycle, metal
production, metal fabrication, and research & development. This was also the site of special isotope
separation research. The SIS-III was designed to provide special plutonium isotopes for LANL weapons
research. The site also has responsibility for manufacturing heat sources for weapons-related programs
(Cochran et al. 1987).
Plutonium has also been processed at TA-3, the new Core Area: [a.k.a. “South Mesa Site”]. The Lab’s
main technical facilities moved here from TA-1 in 1953. Areas at TA-3 that likely involved plutonium
processing include:
• TA-3-29 Chemical and Metallurgical Research (SM-29) (has Wings 1-9). • TA-3-32 Cryogenics • TA-3-34 Cryogenics • TA-3-35 Press Building • TA-3-39 Technical Shops • TA-3-40 Physics • TA-3-65 Source Storage (SM-65) • TA-3-66 Sigma Complex • TA-3-102 Tech Shops (handles beryllium, uranium, lithium per Repos. No. 225) • TA-3-141 Rolling Mill • TA-3-184 Occupational Health • TA-3-216 Weapons Test Support • TA-3-700 Acid Neutralization and Pump Bldg (also known as SM-700).
4-28 DRAFT FINAL REPORT OF CDC’S LAHDRA PROJECT – Chapter 4
As of 1969, the CMR Bldg, except for its Wing 9, was used for laboratory work on small quantities of
uranium and plutonium. Effluents were filtered through Aerosolve 95 filters. Wing 9 contained hot cells
handling irradiated uranium and sometimes plutonium. Effluents may also have contained mixed fission
products including iodine. HEPA and charcoal filters were reportedly used for treatment. Filters were
counted for both alpha and beta radiation.
Stack FE-19 of the CMR Building serves the glove box processes and rooms on the south side of Wing 3.
As of March 1980, the exhaust treatment system had a demister, one stage of M-80 prefilters, and one
stage of American Air Filter Continental 2000 filters (that is, bag filters with published 85% efficiency for
0.3 µm DOP). Prior to July 1976, the system included Aerosolve 95 filters.
Since early 1974, FE-19 has been major source of plutonium at LASL (up to 99% of the total in 1980).
Releases from FE-19 began to increase during Feb 1979, when two filters tore. During filter change-out,
flow reversal sent 143 µCi of Pu up FE-20 stack (Stafford et al. 1979-1982). February 1980 testing
showed FE-19 filters were only 29.3% efficient. The release from FE-19 from Jan 19 – Jan 26, 1979 was
91 µCi, which was greater than the total release for this stack in 1978.
Alpha activity in liquids flowing into the TA-50 waste treatment plant rose sharply in the years leading up
to 1973 because of increased use of 238Pu at the SM 29 building in TA-3. Concentrations at times reached
0.001 µCi/cc [pages from microfiche: TR7831, Envelope 51, dated 5/9/73].
References
Borkowski R, Bunz H, Schoeck W. Resuspension of Fission Products During Severe Accidents in Light-Water Reactors, KfK 3987. Karlsruhe, Germany: Kernforschungszentrum; EUR 10391 EN; 1986. Repos. No. 1584.
Christensen E, Garde R, Valentine A. Demolition of Building 12, an old plutonium filter facility. Los Alamos, NM: Los Alamos National Laboratory; LA-5755; 1975. Repos. No. 2349.
Christenson CW, Maraman WJ. Plutonium Processing at the Los Alamos Scientific Laboratory. Los Alamos, NM: Los Alamos National Laboratory; LA-3542; 1969. Repos. No. 2346.
Cochran TB, Arkin WM, Norris RS, Hoenig MM. Nuclear Weapons Databook Series, Volume III: U.S. Nuclear Warhead Facility Profiles. New York, NY: National Resources Defense Council; 1987.
Coffinberry AS. Later plutonium metallurgical research at Los Alamos. The Metal Plutonium; 1961.
Cosandey JO, Gunther A, von Rohr R. Transport of salts and micron-sized particles entrained form a boiling water pool. Experimental Thermal and Fluid Science 27: 877-889; 2003.
Duffy D, Fleming GB, Garner CS, Wolfe DL. Building D Plutonium Recovery Processes 11/2/1945. Los Alamos, NM: Los Alamos Scientific Laboratory; LA-443; 1945. Repos. No. 1574
DRAFT FINAL REPORT OF CDC’S LAHDRA PROJECT – Chapter 4 4-29
Garner CS, Duffy D, Wolfe DL, Fleming GB. D-Building Plutonium Recovery Processes Los Alamos, NM: Project Y; LA-443; 1945. Repos. No. 1574.
Hammel EF. Plutonium metallurgy at Los Alamos, 1943-1945: Recollections of Edward. F. Hammel. Los Alamos, NM: Los Alamos Historical Society; 1998.
Hemplemann LH, Richmond CR, Voelz GL. A Twenty-Seven Year Study of Selected Los Alamos Plutonium Workers 1/01/1973. Los Alamos, NM: Los Alamos Scientific Laboratory; LA-5148-MS; 1973. Repos. No. 4052.
Kennedy J. Volume 8, Chemistry of Uranium and Plutonium. Chapters 5 through 7, Section B. Los Alamos, NM: Los Alamos Scientific Laboratory; LA-1017; 1947. Repos. No. 3085.
Kennedy WR. Studies of Air-borne Contamination Resulting from Operations Handling Plutonium Metal and Plutonium Alloys Los Alamos, NM: Los Alamos Scientific Laboratory; LAMS-725; 1948. Repos. No. 1591.
Kennedy WR. Memo dated 14 October 1970 Detailing Incident at DP West on 7 October 1970. Los Alamos Scientific Laboratory. 1970. Repos. No. 246.
Knutsen JS. Release Estimates for D-Building Plutonium Processing. LAHDRA project draft work product. ChemRisk, Inc. 2007.
Knutsen JS, Widner TE. Description of Plutonium Processing Apparatus and Procedures in D Building during World War II LAHDRA project draft work product. ChemRisk, Inc. 2007.
Maraman WJ, McNeese WD, Stafford RG. Plutonium– health implications for man. Confinement facilities for handling plutonium. Health Phys 29: 469-80; 1975.
Meyer DD. Memorandum dated 16 October 1970 entitled Report on Radioactivity Release, October 7, 1970, at DP West 1970. Repos. No. 267.
Meyer DD, Schulte HF. CMR-12 Monthly Reports. Los Alamos Scientific Laboratory. 1944-1956. Repos. No. 139.
Mishima J, Schwendiman LC, Radasch CA. Plutonium Release Studies III: Release from Heated Plutonium Bearing Powders. Richland, WA: Pacific Northwewst Laboratory; BNWL-931; 1968.
Site Y. 49 Interim Processing Program Reports 9/11/1945. Los Alamos, NM: Site Y; 1945. Repos. No. 4662.
Stafford RG, Ahlquist AJ, Dummer JE, Ortiz J, Cucchiara AL, Stoker AK. Information on plutonium emissions from CMR Building FE-19 stack, ambient concentrations, and resulting doses. Memoranda. Los Alamos Scientific Laboratory. 1979-1982. Repos. No. 512.
Sutter SL, Johnson LJ, Mishima J. Aerosols Generated by Free Fall Spills of Powders and Solutions in Static Air. Richland, WA: Pacific Northwest Laboratories; NUREG/CR-2139 (PNL-3786); 1981.
USDOE. DOE Handbook - Airborne Release Fractions/Rates and Respirable Fractions for Nonreactor Nuclear Facilities; Volumes I and II. Washington, DC: U.S. Department of Energy; DOE-HDBK-3010-94; 1994.
Valentine AM, Garde R, Cox EJ. Los Alamos DP West Plutonium Facility Decontamination Project, 1978-1981 Los Alamos, NM: Los Alamos Scientific Laboratory; LA-9513-MS 1982. Repos. No. 2344.
Wahl AC. Plutonium Purification in D-Building 2/22/1946. Los Alamos, CA: Los Alamos Scientific Laboratory; 1946. Repos. No. 1583.
4-30 DRAFT FINAL REPORT OF CDC’S LAHDRA PROJECT – Chapter 4
Wahl AC. Chemical purification of plutonium, Chapter 3 of Los Alamos Technical Series, Volume 8, Chemistry of uranium and plutonium. Los Alamos, NM: Los Alamos Scientific Laboratory; LA-1016; 1947. Repos. No. 3084.