Chapter 4 | More health for the · PDF fileand growing demand. ... subject of this chapter. 4...
26
Chapter 4 | More health for the money
Transcript of Chapter 4 | More health for the · PDF fileand growing demand. ... subject of this chapter. 4...

Chapter 4 | More health for the money
60
Key messages
■■ All countries can do something, many of them a great deal, to improve the efficiency of their health systems, thereby releasing resources that could be used to cover more people, more services and/or more of the costs.
■■ Some of these actions would aim to improve efficiency in a particular area of the health system, such as medicines. Others would address the incentives inherent in the health financing system; in particular, how services are bought and providers paid.
■■ All countries can look to improve efficiency by taking a more strategic approach when providing or buying health services, e.g. decide which services to purchase based on information on the health needs of the population and link payments to providers on their performance and to information on service costs, quality and impact.
■■ All provider payment mechanisms have strengths and weaknesses, but particular care should be taken with fee-for-service payments, which offer incentives to over-service those people who can pay or who are covered from pooled funds, and to underservice those who cannot pay.
■■ Reducing fragmentation in the flow and pooling of funds for health and in service delivery will also increase efficiency.
■■ There is no convincing evidence that private-sector health facilities are more, or less, efficient than government facilities. It depends on the setting.
■■ By setting rules and ensuring they are followed, effective governance is the key to improving efficiency and equity.
■■ Donors can also contribute by helping to develop domestic financing institutions and by reducing the fragmented way their funds are delivered and countries are asked to report on their use. They could also reduce duplication at the global level.
61
Using resources wiselyHealth-care systems haemorrhage money. A recent study by the PricewaterhouseCoopers’ Health Research Institute estimated that more than half of the US$ 2 trillion-plus that the United States of America spends on health each year is wasted; a Thomson-Reuters study reported a lower but still substantial figure of US$ 600–850 billion per year (1, 2). The European Health care Fraud and Corruption Network says that of the annual global health expenditure of about US$ 5.3 trillion, a little less than 6%, or about US$ 300 billion, is lost to mistakes or corruption alone (3).
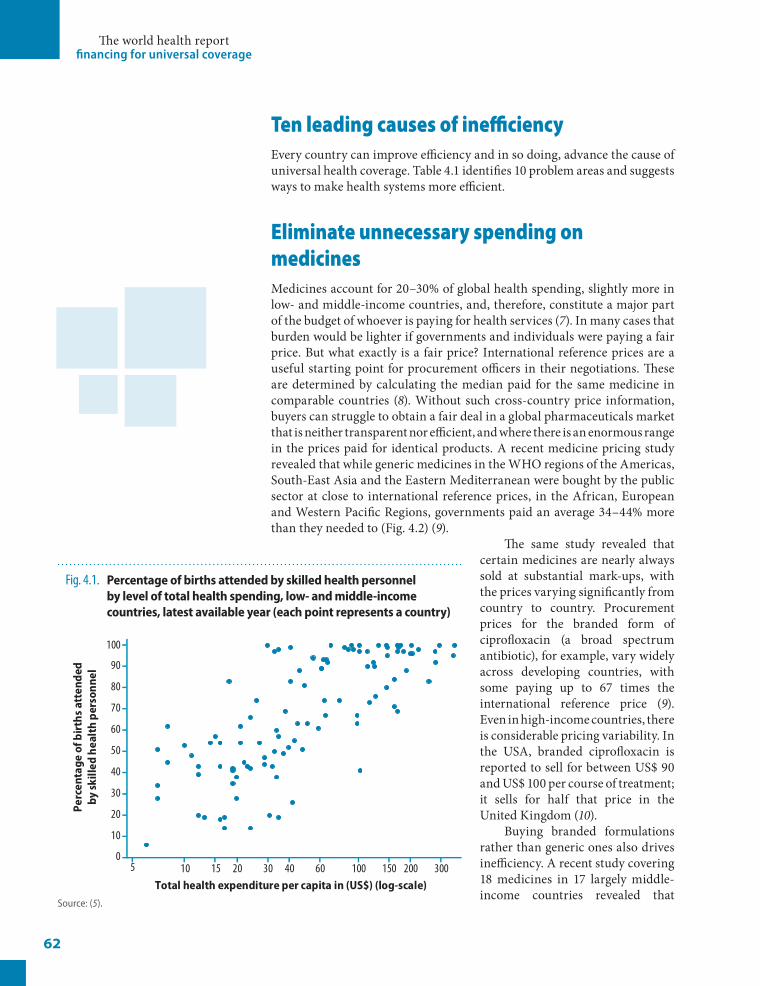
While some countries lose more than others, most, if not all, fail to fully exploit the resources available, whether through poorly executed procurement, irrational medicine use, misallocated and mismanaged human and technical resources or fragmented financing and administration. But there is nothing inevitable about this and there are many shades of inefficiency. Some countries obtain higher levels of coverage and better health outcomes for their money than others, and the gap between what countries achieve and what they could potentially achieve with the same resources is sometimes enormous (4). This is illustrated in Fig. 4.1, where substantial variations in the proportion of births attended by skilled health workers is shown, even for countries with similar total health expenditures.
While raising more money for health is crucial for lower-income countries striving to move closer to universal coverage, it is just as important to get the most out of the resources available. Finding the most efficient ways to meet the multiple challenges health systems face is also an issue for those countries that might be struggling to sustain high levels of coverage in the face of constantly increasing costs and growing demand.
There are many opportunities for efficiency gains. This does not mean simply cutting costs. Efficiency, as we will discuss in the following pages, is a measure of the quality and/or quantity of output (i.e. health outcomes or services) for a given level of input (i.e. cost). So efficiency gains could help to contain costs – an important objective in many countries – by reducing the costs of service delivery. However, no one wants to contain costs by reducing health outcomes, so seeking efficiency gains should also be seen as a means of extending coverage for the same cost.
How countries can improve the efficiency of their health-care systems is the subject of this chapter.
4More health for the money
The world health report financing for universal coverage
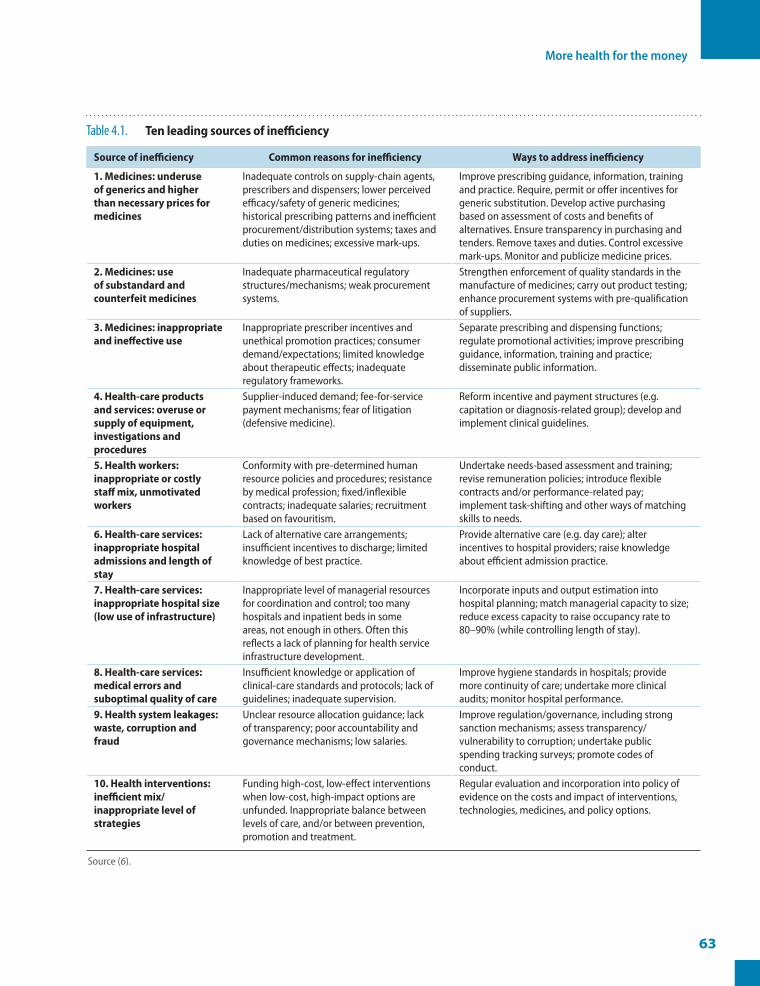
Ten leading causes of inefficiencyEvery country can improve efficiency and in so doing, advance the cause of universal health coverage. Table 4.1 identifies 10 problem areas and suggests ways to make health systems more efficient.
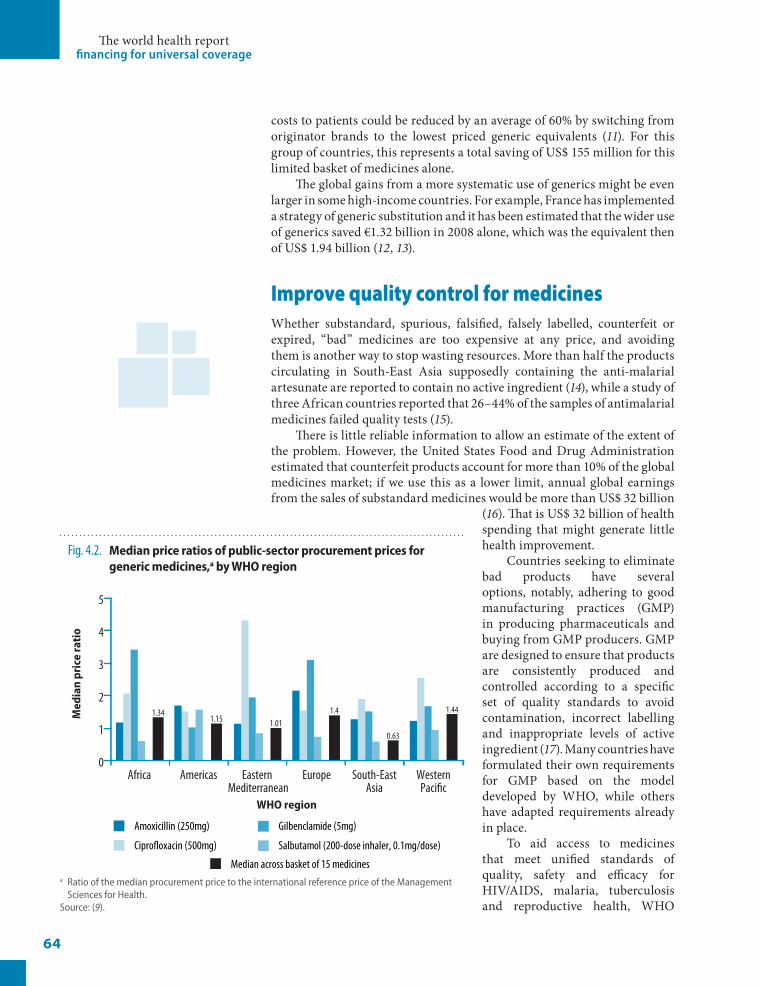
Eliminate unnecessary spending on medicinesMedicines account for 20–30% of global health spending, slightly more in low- and middle-income countries, and, therefore, constitute a major part of the budget of whoever is paying for health services (7). In many cases that burden would be lighter if governments and individuals were paying a fair price. But what exactly is a fair price? International reference prices are a useful starting point for procurement officers in their negotiations. These are determined by calculating the median paid for the same medicine in comparable countries (8). Without such cross-country price information, buyers can struggle to obtain a fair deal in a global pharmaceuticals market that is neither transparent nor efficient, and where there is an enormous range in the prices paid for identical products. A recent medicine pricing study revealed that while generic medicines in the WHO regions of the Americas, South-East Asia and the Eastern Mediterranean were bought by the public sector at close to international reference prices, in the African, European and Western Pacific Regions, governments paid an average 34–44% more than they needed to (Fig. 4.2) (9).
The same study revealed that certain medicines are nearly always sold at substantial mark-ups, with the prices varying significantly from country to country. Procurement prices for the branded form of ciprofloxacin (a broad spectrum antibiotic), for example, vary widely across developing countries, with some paying up to 67 times the international reference price (9). Even in high-income countries, there is considerable pricing variability. In the USA, branded ciprofloxacin is reported to sell for between US$ 90 and US$ 100 per course of treatment; it sells for half that price in the United Kingdom (10).
Buying branded formulations rather than generic ones also drives inefficiency. A recent study covering 18 medicines in 17 largely middle-income countries revealed that
62
Fig. 4.1. Percentageofbirthsattendedbyskilledhealthpersonnelbyleveloftotalhealthspending,low-andmiddle-incomecountries,latestavailableyear(eachpointrepresentsacountry)
0
10
20
30
40
50
60
70
80
90
100
Perc
enta
ge o
f birt
hs a
tten
ded
by sk
illed
hea
lth
pers
onne
l
5 10 15 20 30 40 60 100 150 200 300Total health expenditure per capita in (US$) (log-scale)
Source: (5).
More health for the money
63
Table 4.1. Tenleadingsourcesofinefficiency
Sourceofinefficiency Commonreasonsforinefficiency Waystoaddressinefficiency
1.Medicines:underuseofgenericsandhigherthannecessarypricesformedicines
Inadequate controls on supply-chain agents, prescribers and dispensers; lower perceived efficacy/safety of generic medicines; historical prescribing patterns and inefficient procurement/distribution systems; taxes and duties on medicines; excessive mark-ups.
Improve prescribing guidance, information, training and practice. Require, permit or offer incentives for generic substitution. Develop active purchasing based on assessment of costs and benefits of alternatives. Ensure transparency in purchasing and tenders. Remove taxes and duties. Control excessive mark-ups. Monitor and publicize medicine prices.
2.Medicines:useofsubstandardandcounterfeitmedicines
Inadequate pharmaceutical regulatory structures/mechanisms; weak procurement systems.
Strengthen enforcement of quality standards in the manufacture of medicines; carry out product testing; enhance procurement systems with pre-qualification of suppliers.
3.Medicines:inappropriateandineffectiveuse
Inappropriate prescriber incentives and unethical promotion practices; consumer demand/expectations; limited knowledge about therapeutic effects; inadequate regulatory frameworks.
Separate prescribing and dispensing functions; regulate promotional activities; improve prescribing guidance, information, training and practice; disseminate public information.
4.Health-careproductsandservices:overuseorsupplyofequipment,investigationsandprocedures
Supplier-induced demand; fee-for-service payment mechanisms; fear of litigation (defensive medicine).
Reform incentive and payment structures (e.g. capitation or diagnosis-related group); develop and implement clinical guidelines.
5.Healthworkers:inappropriateorcostlystaffmix,unmotivatedworkers
Conformity with pre-determined human resource policies and procedures; resistance by medical profession; fixed/inflexible contracts; inadequate salaries; recruitment based on favouritism.
Undertake needs-based assessment and training; revise remuneration policies; introduce flexible contracts and/or performance-related pay; implement task-shifting and other ways of matching skills to needs.
6.Health-careservices:inappropriatehospitaladmissionsandlengthofstay
Lack of alternative care arrangements; insufficient incentives to discharge; limited knowledge of best practice.
Provide alternative care (e.g. day care); alter incentives to hospital providers; raise knowledge about efficient admission practice.
7.Health-careservices:inappropriatehospitalsize(lowuseofinfrastructure)
Inappropriate level of managerial resources for coordination and control; too many hospitals and inpatient beds in some areas, not enough in others. Often this reflects a lack of planning for health service infrastructure development.
Incorporate inputs and output estimation into hospital planning; match managerial capacity to size; reduce excess capacity to raise occupancy rate to 80–90% (while controlling length of stay).
8.Health-careservices:medicalerrorsandsuboptimalqualityofcare
Insufficient knowledge or application of clinical-care standards and protocols; lack of guidelines; inadequate supervision.
Improve hygiene standards in hospitals; provide more continuity of care; undertake more clinical audits; monitor hospital performance.
9.Healthsystemleakages:waste,corruptionandfraud
Unclear resource allocation guidance; lack of transparency; poor accountability and governance mechanisms; low salaries.
Improve regulation/governance, including strong sanction mechanisms; assess transparency/vulnerability to corruption; undertake public spending tracking surveys; promote codes of conduct.
10.Healthinterventions:inefficientmix/inappropriatelevelofstrategies
Funding high-cost, low-effect interventions when low-cost, high-impact options are unfunded. Inappropriate balance between levels of care, and/or between prevention, promotion and treatment.
Regular evaluation and incorporation into policy of evidence on the costs and impact of interventions, technologies, medicines, and policy options.
Source (6).
The world health report financing for universal coverage
costs to patients could be reduced by an average of 60% by switching from originator brands to the lowest priced generic equivalents (11). For this group of countries, this represents a total saving of US$ 155 million for this limited basket of medicines alone.
The global gains from a more systematic use of generics might be even larger in some high-income countries. For example, France has implemented a strategy of generic substitution and it has been estimated that the wider use of generics saved €1.32 billion in 2008 alone, which was the equivalent then of US$ 1.94 billion (12, 13).
Improve quality control for medicinesWhether substandard, spurious, falsified, falsely labelled, counterfeit or expired, “bad” medicines are too expensive at any price, and avoiding them is another way to stop wasting resources. More than half the products circulating in South-East Asia supposedly containing the anti-malarial artesunate are reported to contain no active ingredient (14), while a study of three African countries reported that 26–44% of the samples of antimalarial medicines failed quality tests (15).
There is little reliable information to allow an estimate of the extent of the problem. However, the United States Food and Drug Administration estimated that counterfeit products account for more than 10% of the global medicines market; if we use this as a lower limit, annual global earnings from the sales of substandard medicines would be more than US$ 32 billion
(16). That is US$ 32 billion of health spending that might generate little health improvement.
Countries seeking to eliminate bad products have several options, notably, adhering to good manufacturing practices (GMP) in producing pharmaceuticals and buying from GMP producers. GMP are designed to ensure that products are consistently produced and controlled according to a specific set of quality standards to avoid contamination, incorrect labelling and inappropriate levels of active ingredient (17). Many countries have formulated their own requirements for GMP based on the model developed by WHO, while others have adapted requirements already in place.
To aid access to medicines that meet unified standards of quality, safety and efficacy for HIV/AIDS, malaria, tuberculosis and reproductive health, WHO
64
Fig. 4.2. Medianpriceratiosofpublic-sectorprocurementpricesforgenericmedicines,abyWHOregion
0
1
2
3
4
5
EuropeAmericasAfrica WesternPaci�c
South-EastAsia
Eastern Mediterranean
Med
ian
pric
e ra
tio
WHO region
Amoxicillin (250mg)
Cipro�oxacin (500mg)
Gilbenclamide (5mg)
Salbutamol (200-dose inhaler, 0.1mg/dose)
Median across basket of 15 medicines
1.341.15 1.01
1.4
0.63
1.44
a Ratio of the median procurement price to the international reference price of the Management Sciences for Health.
Source: (9).
More health for the money
set up a prequalification programme in 2001. It was intended to support United Nations procurement agencies but, over time, the list of prequalified medicines has become a resource for anyone bulk-buying medicines, including national procurement agencies (18).
Use medicines appropriatelyThe irrational use of medicines not only leads to suffering and death, it draws resources away from effective, evidence-based interventions. Despite the fact that many countries have adopted national medicines policies and essential medicines programmes that encourage appropriate use, fewer than half of all patients treated in low- and middle-income countries receive care according to clinical guidelines for common diseases in primary care (19). It is estimated that more than half of all medicines globally are prescribed, dispensed or sold inappropriately (19), and that half of all patients fail to take their medication as prescribed or dispensed (20). Irrational use may take many forms, including the use of harmful medicine mixtures (polypharmacy), the overuse of antibiotics and injections, failure to prescribe in accordance with clinical guidelines, or inappropriate self-medication (21).
Overuse and misuse of antibiotics is a particularly serious global problem, with two thirds of all antibiotics being sold without prescription through unregulated private markets. Many patients are prescribed incorrect or inadequate doses or fail to complete the course prescribed. Fewer than half of all patients with acute diarrhoea obtain treatment with cheap and extremely effective oral rehydration salts, while more than half are given expensive and – for this purpose – useless antibiotics. As an example, the overuse of antibiotics to treat acute respiratory tract infections in low- and middle-income countries is estimated to add an average 36% to the cost of care (22).
Get the most out of technologies and servicesMedical technologies can be crucial to providing good health services, provided they are selected and used properly, based on scientific evidence and best practice (23). Too often procurement policy is distorted by the marketing pressure of equipment manufacturers. This is as true for high- as it is for low-income countries, perhaps more so given the greater scope for spending. Modern medical technology is a major contributor to rising costs in Organization for Economic Co-operation and Development (OECD) countries and the extent to which any particular country embraces it is not always based on need. Among OECD countries, the highest number of magnetic resonance imaging (MRI) and computed tomography (CT) scanners per capita is found in Japan, while the USA leads the world in diagnostic imaging referrals: 91.2 MRI examinations per 1000 of population (compared with an OECD average of 41.3 per 1000); and 227.8 CT scans per 1000 (compared with an OECD average of 110) (24). A significant proportion of these tests are believed to be medically unnecessary.
Unnecessary purchase and use of equipment can also occur in low-income countries, but generally speaking, resource-poor settings have other technology
65
The world health report financing for universal coverage
challenges. It is estimated that at least 50% of medical equipment in developing countries is either partly usable or totally unusable (25). In subSaharan Africa, up to 70% of medical equipment stands idle. Studies suggest there are several reasons for this type of broad systemic failure, including mismanagement of the technology acquisition process, and a lack of user training and effective technical support (26). Where medical technology is available for use, it is too often the cause of substandard or hazardous diagnosis, or treatment that can pose a threat to the safety of patients. Inappropriate medical technology also imposes a financial burden on systems that can ill afford it.
Ironically, one of the biggest causes of inefficiency as it relates to medical technologies in low-income countries is donations. In some countries, almost 80% of health-care equipment comes from international donors or foreign governments, much of it remaining idle for various reasons. A recent study carried out in the West Bank and Gaza Strip offers an example (27). Large consignments of such equipment were sent to the Gaza Strip after hostilities ended in January 2009. While some of the donated equipment was useful, a significant proportion could not be integrated into the health-care system and sat in warehouses.
This type of problem could be avoided if development partners consulted with recipient countries to clarify their needs and capacities to service donated equipment. It is also incumbent on recipient governments to establish rational management systems, organizing the storage of medical devices by type, model and manufacturer, and checking each donated item for completeness, compatibility and quality.
What applies to technologies also applies to health services. A study comparing the services obtained by patients under the Medicare programme in the USA concluded that “residents in high-spending regions received 60% more care but did not have lower mortality rates, better functional status or higher satisfaction” (28, 29). The differences in practice patterns could not be attributed to differences in medical need and about 30% of the costs of treatment could have been saved if the providers generating high spending reduced their provision of services to the levels found in safe, but conservative treatment regions (30). Similar variations in practice patterns have been found in many countries, indicating similar opportunities for reducing costs and improving efficiency (31–34).
While it is often difficult to establish the precise need for a medical intervention at the individual level, policy-makers can monitor variations in practice patterns within a country, focusing on providers or institutions that provide a large number of services compared with others, or those that provide comparatively few. Reducing this variation can both save resources and improve health outcomes.
Motivate peopleHealth workers are at the core of a health system and typically account for about half of all health spending in a country (35). While a shortage of health workers is often a major obstacle to strengthening health systems, ineffective recruiting, inappropriate training, poor supervision and maldistribution within countries also undermine efficiency, while inadequate compensation
66
More health for the money
drives excessive turnover or attrition (36). The inevitable result of these compounded failings is reduced productivity and performance.
But exactly how much is lost to workforce inefficiency? Without reliable comprehensive data, it is hard to be precise, but there have been several attempts to measure health-worker productivity in specific contexts. In the United Republic of Tanzania, for example, unexplained absences plus time spent on breaks, on social contacts and on waiting for patients has been reported to reduce productivity levels by 26% (37). In Brazil, Sousa et al. found that the efficiency with which health workers achieve coverage of antenatal care across municipalities in Brazil ranged from less than 20% to more than 95% (38).
Taking admittedly limited examples as indicative of global trends and applying a conservative average level of reported inefficiency (15–25%) to the proportion of total health spending on human resources (45–65%, depending on world income region), it is possible to arrive at a worldwide workforce inefficiency cost that exceeds US$ 500 billion annually.
How to reduce that loss – how to improve the productivity and performance of health workers – is analysed in The world health report 2006, which highlighted, among other things, the importance of adequate remuneration and better matching of skills to tasks (36). The matter of provider payment and payment for performance is further discussed below.
Improve hospital efficiency – size and length of stayIn many countries, hospital care absorbs more than half and up to two thirds of total government spending on health, with (often excessive) inpatient admissions and length of stay being significant categories of outlay. Four separate studies of adult inpatients in Canada’s health system, for example, found that 24–90% of admissions and 27–66% of inpatient days were inappropriate (39).
Another source of inefficiency is the inappropriate size of some facilities and the range of services they offer. While it might make economic sense to enlarge the size and scope of a hospital to fully exploit available expertise, infrastructure and equipment, there is a point at which efficiency starts to decline. Similarly, small hospitals become inefficient where the fixed infrastructure and administrative costs are shared across too small a caseload, thereby pushing up the cost of an average hospital episode. Research mainly in the USA and the United Kingdom indicates that inefficiencies start below about 200 beds and above 600 (40). A good indicator of hospital efficiency is the use of inpatient facilities as measured by capacity rates. A WHO study of 18 low- and middle-income countries revealed that in district hospitals only 55% of beds were occupied on average, well below the recommended level of 80–90% (6).
A recent review of more than 300 studies looking at the efficiency and productivity of health-care delivery found that hospital efficiency, on average, was about 85%, meaning the hospitals could achieve 15% more than they do for the same cost, or the same levels of service at a 15% reduction in cost (41). No substantial difference was reported between hospitals in
67
The world health report financing for universal coverage
the USA, Europe and other parts of the world, although interestingly, public hospitals proved more efficient than both private for-profit and private not-for-profit hospitals (Box 4.1). Applying a median inefficiency rate of 15% to the proportion of total health spending consumed by hospitals in each world income region, almost US$ 300 billion is lost annually to hospital-related inefficiency.
Get care right the first timeMedical error costs money as well as causing suffering. Because of the lack of reliable epidemiological data, the prevalence and magnitude of medical error globally is unknown, but estimates suggest that as many as one in 10 patients in developed countries is harmed while receiving hospital care; in developing countries the number may be significantly higher (49). At any given time, 1.4 million people worldwide suffer from infections acquired in hospitals (50). What this costs health authorities is unknown, but a study in 1999 suggested that preventable medical errors might be killing as many as 98 000 people a year in the USA, at a cost of US$ 17–29 billion (51).
One simple measure to reduce medical error is to encourage hand hygiene. Another is to promote safe injection practices. A third is to ensure accurate diagnostics.
A simple life-saving procedure is the use of checklists, such as the one advocated in WHO’s Safe Surgery Saves Lives initiative. Striking results
have already been achieved with checklists, notably in Michigan, USA, where a state-wide initiative sought to reduce catheter-associated bloodstream infections by instituting a short checklist. Among other things, the checklist empowered nurses to ensure that doctors were following procedure (52). Bloodstream infections across the participating intensive care units dropped to 1.4 per 1000 days of catheter use, less than 20% of the rate before implementation, saving an estimated 1800 lives over four years. Checklist initiatives can now be found in several countries, including China, Jordan, Thailand, and the United Kingdom.
A more punitive (and potentially controversial) approach to reducing medical errors is to withhold payment for mistakes. This approach is being tested in the USA, where, since October 2008, Medicare, the government-administered social insurance programme providing
68
Box 4.1. Therelativeefficiencyofpublicandprivateservicedelivery
The relative roles of the public and private (for-profit or not-for-profit) sectors in health-care provision have evolved over time and have continued to engender strong debate on ideological grounds. Ultimately, empirical evidence should assist in determining what type of institution most efficiently provides specific services.
Most available studies have focused on the efficiency of hospitals, responsible for about 45–69% of government health spending in subSaharan Africa (42). Hollingsworth (41) recently conducted a meta-analysis of 317 published works on efficiency measures and concluded that, if anything, “public provision may be potentially more efficient than private.” However, country studies suggest that the impact of ownership on efficiency is mixed. Lee et al. (43) determined that non-profit hospitals in the USA were more efficient than for-profit hospitals. On the other hand, Swiss hospital efficiency levels did not vary according to ownership (44, 45). In Germany, some studies found private hospitals less technically efficient than publicly owned hospitals, others concluded the inverse, while yet others found no difference at all (46, 47).
There is a dearth of studies measuring the relative efficiencies of public and private health facilities in low- and middle-income countries. Masiye (48) is perhaps the only study that has reported on the significantly positive effect of private ownership on efficiency in Zambian hospitals (mean efficiency for private hospitals was 73% compared with 63% for public hospitals).
This emphasizes that it is unsafe to generalize about which ownership model is best across countries. At the same time, the evidence shows that average levels of efficiency are substantially lower than they could be in all types of hospitals. Hospitals can become more efficient, regardless of ownership, by reducing waste and producing cost-effective interventions. To ensure this happens requires strong government stewardship to set and enforce the rules of operation.
More health for the money
health coverage to people aged 65-plus, has ceased to reimburse hospitals for so-called never-events, those medical errors it deems “reasonably preventable.” These include major mistakes, such as operating on the wrong body part, but also complications such as severe bedsores, and certain injuries caused by patient falls. By refusing to pay for mistakes, Medicare hopes to reduce the estimated 98 000 deaths that occur each a year due to medical errors (53).
Eliminate waste and corruptionAn estimated 10–25% of public spending on health linked to procurement – buying the necessary inputs such as medicines, equipment and infrastructure – is lost each year to corrupt practices (54). In developed countries alone, fraud and other forms of abuse in health care have been estimated to cost individual governments as much as US$ 12–23 billion per year (55). Because the production and distribution of medicines is a complex multiphase process, there are particular opportunities for many abuses in this area, although the problem extends to all areas of procurement.
Experience has shown that to significantly curb corruption in buying and distributing medicines, two complementary strategies need to be applied: first, a discipline approach that tends to be top-down and based on legislative reforms, establishing the laws, administrative structures and processes needed to ensure transparent medicine regulation and procurement; and second, a more bottom-up values approach that promotes institutional integrity through moral values and principles, and tries to motivate ethical conduct by public servants.
Since 2004, 26 countries have introduced good governance for medicines programmes based on these principles, resulting in a reduction in spending on medicines (56). The Medicines Transparency Alliance is another initiative that focuses on affordability and availability of good-quality medicines through country-level actions that promote efficiencies in the drug-purchasing chain, notably through transparency and accountability (57).
These principles, however, are not limited to buying and distributing medicines, and can be applied to all activities in health. They are underpinned by the core principles of good government, which include accountability, transparency and respect for the rule of law (58). Core regulatory functions that can effectively combat budgetary and other leakages range from registering, accrediting and licensing health providers, facilities and products (to improve quality), to internal oversight and audit functions. Improved governance also requires intelligence and better use of information, so that breaches of practice can be identified and changes monitored.
Critically assess which services are neededThe cost of gaining one healthy year of life has been estimated to range from less than US$ 10 to more than US$ 100 000, depending on the intervention (59, 60). Put another way, if you choose an intervention costing US$ 10 per healthy year of life saved, you can save 100 000 years for US$ 1million. If you choose the US$ 100 000 intervention, you save only 10 healthy years.
69
The world health report financing for universal coverage
There is no general rule on which interventions will be most cost effective in a country, with price levels, disease patterns and coverage levels all to be considered. It is not even true that prevention is always more cost effective than treatment. Some forms of prevention are cost effective and underused, some are not. Ideally, each country needs to assess cost–effectiveness and efficiency in its own setting, although the WHO-CHOICE (CHOosing Interventions that are Cost Effective) work programme and two rounds of the Disease Control Priorities Project have provided guidance on the cost–effectiveness of a wide range of interventions in different settings (61).
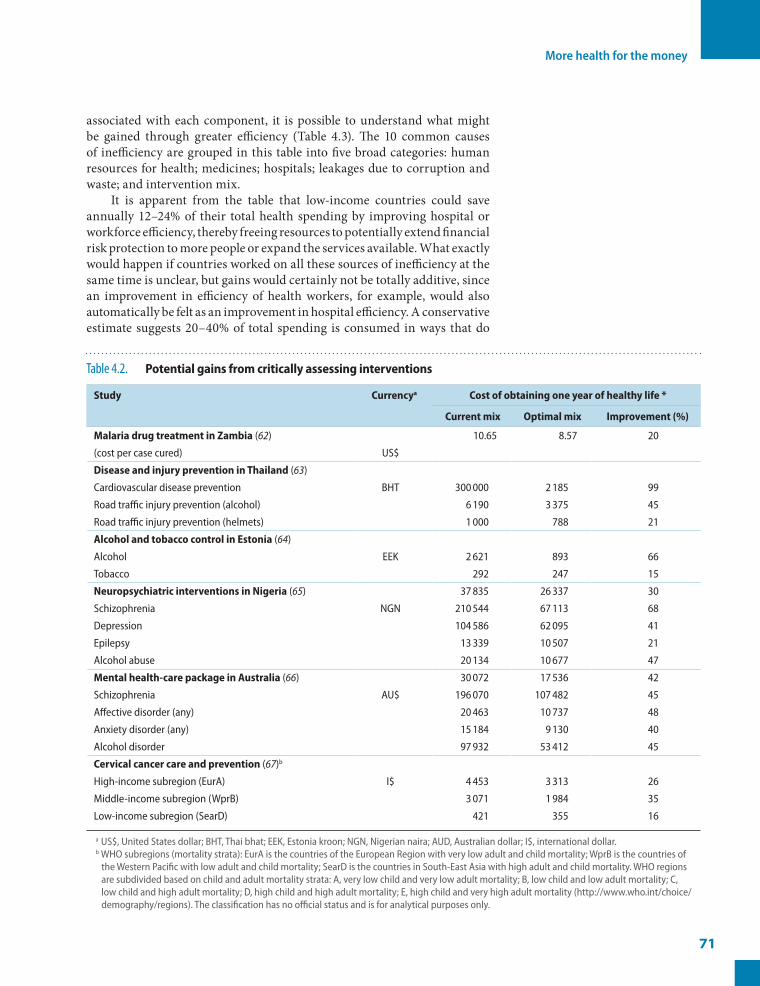
What is clear, however, is that for a variety of reasons, high-cost, low-impact interventions tend to be overused while low-cost, high-impact interventions are underexploited (59, 60). Switching resources from the former to the latter is, therefore, an obvious way to achieve greater efficiencies. Our review of the few studies that compare the status quo with a potentially more appropriate mix of interventions for particular disease complexes or conditions (Table 4.2) suggests that the same health gains could have been obtained with between 16% and 99% of current spending depending on the condition. These savings could then make important contributions to improving health in other ways.
Even allowing for the transaction costs of making the necessary reallocations, the evidence of Table 4.2 suggests that efficiency gains of about 20% would be feasible in countries that prioritize cost-effective interventions. The cost-effective interventions differ, obviously, by country, but in low-income settings, many of the most cost-effective interventions – preventive care and treatment for maternal and neonatal health, or basic childhood vaccinations – are not yet fully implemented, at great cost in human life.
Cost–effectiveness is not the only consideration when deciding on an optimal mix of interventions. In cases where fairness, equity or basic decency are at issue, the social value of a particular health intervention may differ from the value of the health benefits it produces. Consider end-of-life care. It is expensive: in the USA, for example, care during the last year of a patient’s life accounts for almost one third of annual Medicare spending, despite these patients accounting for only 5% of enrolments (68). Social values rather than cost–effectiveness considerations determine that societies will continue to provide end-of-life care. A less extreme example, but one often confronting policy-makers in low- and middle-income settings, is the diminishing cost–effectiveness of extending coverage of interventions to remote rural areas. As stated in Chapter 1, the commitment to universal coverage depends to a significant degree on social solidarity, a readiness to make choices that balance efficiency and equity.
While considerations of equity are paramount, it is crucial that governments continue to focus on cost–effectiveness so that they can engage in more active purchasing of services to ensure that the system obtains the best value for money. This is further discussed later in the chapter.
The potential benefits of improving efficiencyBy taking the average levels of inefficiency identified in the earlier sections and multiplying them by the average proportions of total health spending
70
More health for the money
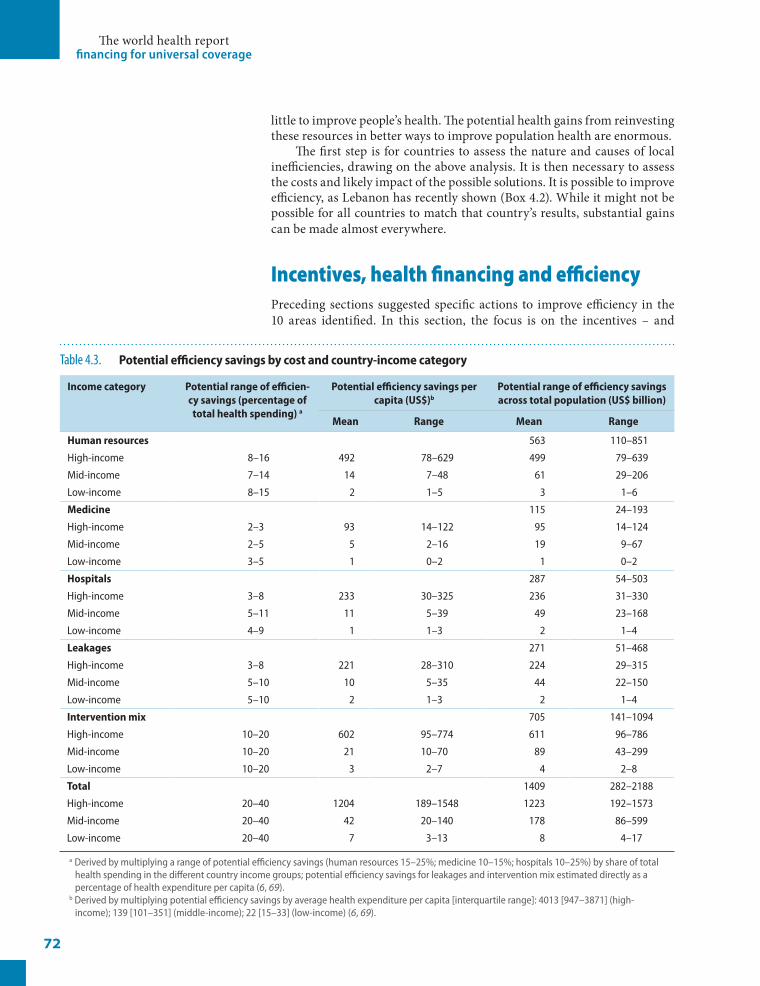
associated with each component, it is possible to understand what might be gained through greater efficiency (Table 4.3). The 10 common causes of inefficiency are grouped in this table into five broad categories: human resources for health; medicines; hospitals; leakages due to corruption and waste; and intervention mix.
It is apparent from the table that low-income countries could save annually 12–24% of their total health spending by improving hospital or workforce efficiency, thereby freeing resources to potentially extend financial risk protection to more people or expand the services available. What exactly would happen if countries worked on all these sources of inefficiency at the same time is unclear, but gains would certainly not be totally additive, since an improvement in efficiency of health workers, for example, would also automatically be felt as an improvement in hospital efficiency. A conservative estimate suggests 20–40% of total spending is consumed in ways that do
71
Table 4.2. Potentialgainsfromcriticallyassessinginterventions
Study Currencya Costofobtainingoneyearofhealthylife*
Currentmix Optimalmix Improvement(%)
MalariadrugtreatmentinZambia (62) 10.65 8.57 20
(cost per case cured) US$
DiseaseandinjurypreventioninThailand (63)
Cardiovascular disease prevention BHT 300 000 2 185 99
Road traffic injury prevention (alcohol) 6 190 3 375 45
Road traffic injury prevention (helmets) 1 000 788 21
AlcoholandtobaccocontrolinEstonia (64)
Alcohol EEK 2 621 893 66
Tobacco 292 247 15
NeuropsychiatricinterventionsinNigeria (65) 37 835 26 337 30
Schizophrenia NGN 210 544 67 113 68
Depression 104 586 62 095 41
Epilepsy 13 339 10 507 21
Alcohol abuse 20 134 10 677 47
Mentalhealth-carepackageinAustralia (66) 30 072 17 536 42
Schizophrenia AU$ 196 070 107 482 45
Affective disorder (any) 20 463 10 737 48
Anxiety disorder (any) 15 184 9 130 40
Alcohol disorder 97 932 53 412 45
Cervicalcancercareandprevention (67)b
High-income subregion (EurA) I$ 4 453 3 313 26
Middle-income subregion (WprB) 3 071 1 984 35
Low-income subregion (SearD) 421 355 16
a US$, United States dollar; BHT, Thai bhat; EEK, Estonia kroon; NGN, Nigerian naira; AUD, Australian dollar; I$, international dollar.b WHO subregions (mortality strata): EurA is the countries of the European Region with very low adult and child mortality; WprB is the countries of
the Western Pacific with low adult and child mortality; SearD is the countries in South-East Asia with high adult and child mortality. WHO regions are subdivided based on child and adult mortality strata: A, very low child and very low adult mortality; B, low child and low adult mortality; C, low child and high adult mortality; D, high child and high adult mortality; E, high child and very high adult mortality (http://www.who.int/choice/demography/regions). The classification has no official status and is for analytical purposes only.
The world health report financing for universal coverage
little to improve people’s health. The potential health gains from reinvesting these resources in better ways to improve population health are enormous.
The first step is for countries to assess the nature and causes of local inefficiencies, drawing on the above analysis. It is then necessary to assess the costs and likely impact of the possible solutions. It is possible to improve efficiency, as Lebanon has recently shown (Box 4.2). While it might not be possible for all countries to match that country’s results, substantial gains can be made almost everywhere.
Incentives, health financing and efficiencyPreceding sections suggested specific actions to improve efficiency in the 10 areas identified. In this section, the focus is on the incentives – and
72
Table 4.3. Potentialefficiencysavingsbycostandcountry-incomecategory
Incomecategory Potentialrangeofefficien-cysavings(percentageoftotalhealthspending)a
Potentialefficiencysavingspercapita(US$)b
Potentialrangeofefficiencysavingsacrosstotalpopulation(US$billion)
Mean Range Mean Range
Humanresources 563 110–851
High-income 8–16 492 78–629 499 79–639
Mid-income 7–14 14 7–48 61 29–206
Low-income 8–15 2 1–5 3 1–6
Medicine 115 24–193
High-income 2–3 93 14–122 95 14–124
Mid-income 2–5 5 2–16 19 9–67
Low-income 3–5 1 0–2 1 0–2
Hospitals 287 54–503
High-income 3–8 233 30–325 236 31–330
Mid-income 5–11 11 5–39 49 23–168
Low-income 4–9 1 1–3 2 1–4
Leakages 271 51–468
High-income 3–8 221 28–310 224 29–315
Mid-income 5–10 10 5–35 44 22–150
Low-income 5–10 2 1–3 2 1–4
Interventionmix 705 141–1094
High-income 10–20 602 95–774 611 96–786
Mid-income 10–20 21 10–70 89 43–299
Low-income 10–20 3 2–7 4 2–8
Total 1409 282–2188
High-income 20–40 1204 189–1548 1223 192–1573
Mid-income 20–40 42 20–140 178 86–599
Low-income 20–40 7 3–13 8 4–17
a Derived by multiplying a range of potential efficiency savings (human resources 15–25%; medicine 10–15%; hospitals 10–25%) by share of total health spending in the different country income groups; potential efficiency savings for leakages and intervention mix estimated directly as a percentage of health expenditure per capita (6, 69).
b Derived by multiplying potential efficiency savings by average health expenditure per capita [interquartile range]: 4013 [947–3871] (high-income); 139 [101–351] (middle-income); 22 [15–33] (low-income) (6, 69).
More health for the money
disincentives – inherent in different financing systems that can promote or compromise efficiency.
One of the key considerations is the way health service providers are paid. Payment mechanisms for hospitals and health facilities, and the doctors, nurses, physiotherapists, etc. who run them, vary substantially between systems, and many provide incentives for inefficiency. The most rudimentary payment system, as already discussed, is the health-care provider being paid by the patient at the time of need. The many disadvantages of this system – notably the financial barrier to access it places in the way of the poor and the associated levels of financial hardship it imposes on people who are forced to use services – have already been discussed at length. However, this fee-for-service payment also encourages over-servicing for the people who can afford to pay. This is another form of inefficiency.
Fee for service is a common form of payment even where funds are pooled, most commonly in insurance schemes. It is common and it is costly. Because the insurer is paying, neither the doctor nor the patient has an incentive to restrict costs and over-servicing is the inevitable result. This over-servicing often takes the form of the overuse of prescription medicines but is not limited to that. A recent study into the factors responsible for the increasing incidence of Caesarean-section deliveries provides another example. There are many determinants but both the increased demand from patients, and the increased supply by the doctors who are paid per intervention, play a role (70). Despite Caesarean-section delivery being linked to increased maternal mortality, maternal and infant morbidity and increased complications for subsequent deliveries (71–73), such deliveries increasingly take place even when natural birth presents no particular risk (74). In 69 of the 137 countries for which information is available, Caesarean-section rates are rising, costing these countries an estimated US$ 7 billion per year in unnecessary procedures (Box 4.3).
The degree to which Caesarean-section delivery is being promoted to patients by people who have a financial interest in performing them is unclear, but according to the same supply-and-demand study, where health services are provided by government, Caesarean-section rates plummet. Specifically, a doubling in the share of health spending derived from government sources was found to correspond to a 29.8% (9.6–50%) decrease in Caesarean-section rates (70).
73
Box 4.2. Lebanon’sreforms:improvinghealthsystemefficiency,increasingcoverageandloweringout-of-pocketspending
In 1998 Lebanon spent 12.4% of its GDP on health, more than any other country in the Eastern Mediterranean Region. Out-of-pocket payments, at 60% of total health spending, were also among the highest in the region, constituting a significant obstacle to low-income people. Since then, a series of reforms has been implemented by the Ministry of Health to improve equity and efficiency.
The key components of this reform have been: a revamping of the public-sector primary-care network; improving quality in public hospitals; and improving the rational use of medical technologies and medicines. The latter has included increasing the use of quality-assured generic medicines. The Ministry of Health has also sought to strengthen its leadership and governance functions through a national regulatory authority for health and biomedical technology, an accreditation system for all hospitals, and contracting with private hospitals for specific inpatient services at specified prices. It now has a database that it uses to monitor service provision in public and private health facilities.
Improved quality of services in the public sector, at both the primary and tertiary levels, has resulted in increased utilization, particularly among the poor. Being a more significant provider of services, the Ministry of Health is now better able to negotiate rates for the services it buys from private hospitals and can use the database to track the unit costs of various hospital services.
Utilization of preventive, promotive and curative services, particularly among the poor, has improved since 1998, as have health outcomes. Reduced spending on medicines, combined with other efficiency gains, means that health spending as a share of GDP has fallen from 12.4% to 8.4%. Out-of-pocket spending as a share of total health spending fell from 60% to 44%, increasing the levels of financial risk protection.
The world health report financing for universal coverage
Most systems which pay user fees from insurance funds have introduced controls on service providers to counter over-servicing. Many countries have also introduced co-payments or other forms of cost-sharing to encourage patients to consider whether they need to use a health service. But these measures can be costly to implement, require considerable capacity to monitor and fail to address the major cause of the problem – the incentives to over-service in a system based on remuneration per service provided.
One strategy to restrict over-servicing is to limit, through capitation, the amount paid to service providers. Capitation is commonly used at the primary-care level, whereby health-care providers are paid a predetermined fee to cover all the health needs of each person registered with them. Making the primary-care physician or facility, in effect, the fundholder, responsible for paying for any care they administer to their patients or for the care of those patients they refer to higher levels of the system, encourages a focus on prevention. Preventing more severe illness reduces referrals and stops them losing part of their funds. This might, however, also encourage physicians to delay referrals.
Capitation is sometimes used to pay primary-care providers or facilities for their services, independent of how secondary and tertiary care is financed. In this case, primary-care providers may well have an incentive to refer upwards early, or when patients do not really need higher-level care, as a way of protecting their budgets.
In hospitals, the equivalent of fee-for-service payments is payment according to length of stay. As with fee-for-service payments for clinical services, payment according to length of stay consistently leads to longer periods of inpatient care and, hence, higher costs than are medically necessary (76, 77).
A more efficient mechanism uses case-based payment of some sort, such as diagnostic-related groups (DRGs), where different pathologies are bundled into homogenous cost groups that are then ascribed an average treatment cost. A fixed reimbursement goes to the hospital regardless of how intensively it decides to treat patients or how long they stay there. The downside is that hospitals can discharge patients early so they can readmit
them to gain an additional payment for a new DRG episode. Many countries and insurance funds – and not just those in high-income settings – have introduced some form of case-based payment in their hospital financing systems to control costs and encourage efficiency. Such countries include Kazakhstan, Kyrgyzstan, Thailand and Turkey (78–81).
In Sweden, a comparison of local government areas (counties) that used DRG-based remuneration with those that did not suggested cost savings of about 10% (82). In
74
Box 4.3. GlobalvariationinrecoursetoCaesareansection
The number of Caesarean sections varies enormously between countries, with richer ones and those in transition having excessive recourse to the procedure, and economically deprived countries, mainly in Africa, failing to meet demand. Data for Caesarean sections performed in 137 countries in 2007 show that in 54 countries, Caesarean births represented less than 10% of all births; in 69 countries, the percentage was more than 15%. Only 14 countries reported rates in the recommended 10–15% range.
A country-specific analysis based on WHO-CHOICE (CHOosing Interventions that are Cost Effective) methods reveals that the cost of global excess Caesarean sections is over US$ 2 billion annually. Unnecessary global Caesarean sections in 2008 outnumbered necessary ones. Because of the overwhelming concentration of excess Caesarean sections in countries with high income levels (and therefore high price levels), the cost of the global excess Caesarean sections in 2008 could have potentially financed needed procedures in poorer countries nearly 6 times over.
Source: (75).
More health for the money
the USA, the average length of hospital stays is reported to have fallen under DRG regimes compared with other remuneration methods (83). However, both capitation and DRG-based remuneration require the ability to measure costs accurately before they are implemented and to monitor their impact over time.
The alternative to remunerating health-care workers per service or by capitation is to pay fixed salaries. The challenge here is to offer incentives to people who otherwise have no financial stake in doing better. The United Kingdom’s National Health Service introduced a bonus incentive scheme for general practitioners in 2004 designed to encourage them to improve care, especially in monitoring certain conditions (heart failure, asthma, diabetes). The bonus can amount to several thousand pounds a year and form a substantial part of a practitioner’s income (84).
Several countries have begun to develop mixed-payment systems at both the hospital and individual service provider levels on the assumption that a judicious mix of payment methods can achieve greater efficiency and quality than a single-payment model (85). The German system, for example, combines budgets with DRG payment at hospital level with incentives to control costs. In Finland, doctors are paid through a mix of salary, capitation and fee for service.
Paying for performancePaying for good performance is conceptually the opposite of Medicare’s so-called never-events approach, rewarding doctors and nurses for getting it right rather than refusing to pay when they get it wrong. Many performance-incentive schemes have been implemented over the past few decades under a variety of labels – pay for performance, performance-based contracting, performance-based financing and results-based financing – but all boil down to rewarding the delivery of specific services to encourage higher coverage, better quality or improved health outcomes (86).
Some have had positive outcomes in several high-income countries in addition to the United Kingdom experience outlined previously in this chapter. In the USA there are more than 200 pay-for-performance programmes, France has a national programme, and Spain and Italy have local-level or small-scale pilot projects (84). Evaluations suggest that the performance-incentive schemes have improved physician and/or hospital performance against a set of measures that vary by setting but include quality indicators, such as adherence to best practices in care, controlling blood pressure levels in patients and reducing diabetes complication rates (87, 88). There is evidence, however, that these incentives sometimes have not resulted in improved provider performance (89). Even where they appear to have some impact, their cost–effectiveness has rarely been considered. Are the improved levels of performance worth the additional payments to secure them? Are there more cost-effective ways to achieve the same outcomes? These questions have not been addressed (90).
In recent years, this type of payment mechanism has been introduced in various forms in developing countries, often as a pilot project with donor funding, and often for child and maternal care interventions (91).
75
The world health report financing for universal coverage
Such countries include Burundi, Cambodia, Cameroon, the Democratic Republic of Congo, Egypt, Haiti, India, Nicaragua and Rwanda. Improved performance has been reported in several areas of care, including the number of antenatal visits, the proportion of women delivering in a health facility and child immunization coverage (92, 93).
However, the promising results need to be regarded with caution given the limited evidence and less than robust evaluation studies, though a recent cross-country review suggested that they can be a useful tool to improve efficiency if implemented correctly (94). This requires a clear statement of the rules of the game and what is expected from each participant. It might also involve strengthening the information system and monitoring function to counter perverse incentives, where providers try to exploit the system by focusing on higher-reward procedures and patients to boost income, or neglect procedures and patients that offer lower rewards. This type of behaviour has been reported in both high- and low-income settings (95–97).
There are two further concerns about performance-incentive schemes. First, if payment for performance is introduced for different programmes separately and independently, the result may well be competitive performance incentives – each programme vying to get the providers to do their work rather than that of other programmes. Where donors are involved, recipient countries need to be making the decisions, determining how performance incentives fit in with their overall health financing and service delivery strategies, and how, where and for what, incentives should be paid.
Second, the focus on financial rewards can affect provider behaviour in more subtle ways by making individual health workers, for example, feel that their competence is being questioned or that their intrinsic desire to do a good job is unappreciated or being rejected (98). Such a focus can also encourage health workers to expect bonuses for every act performed (99).
Strategic purchasingPaying for performance is only one of the considerations when allocating funds to ensure that good quality services are available to those who need them and that the system functions efficiently. Traditionally, providers have been reimbursed for the services they provide and/or governments allocate budgets to various levels of government, departments and programmes based largely on the funding they received the previous year. This has been termed passive purchasing (100, 101). More active purchasing can improve quality and efficiency by examining: population health needs and how they vary across the country; the interventions and services that best meet these needs and community expectations given the available resources, and the optimum mix of promotion, prevention, treatment and rehabilitation; how these interventions and services should be purchased or provided, including contractual mechanisms and provider payment systems such as those discussed earlier in this chapter; and from whom should they be purchased, taking into account the availability of providers and their levels of quality and efficiency (102).
It is not a simple choice between passive and active purchasing. Countries will decide where they can operate based on their ability to
76
More health for the money
collect, monitor and interpret the necessary information, and encourage and enforce standards of quality and efficiency. Passive purchasing leads to inefficiency. Even if countries feel they do not yet have the technical and informational capacities to move rapidly towards active purchasing, they can develop a framework for doing so over time. There may well be a role for payment based on performance under active purchasing, but it is likely to work better if it is part of an overall approach that includes all the other elements.
The instruments used for strategic purchasing might need to be changed and modified over time. As already indicated, most advanced health financing systems exploit several methods of provider payment to try to achieve the right mix of incentives. Many countries have moved back and forth between them, sometimes for technical and sometimes for political reasons. This is the reality of health-care systems: policy-makers must juggle various options while engaging in broader – and often politicized – debates about the merits of various methods for paying providers and purchasing services to meet population needs.
FragmentationEach country needs to find pragmatic solutions for paying providers and purchasing services that reflect local conditions. Whatever choices are made, some degree of pre-payment and pooling will form the basis of health-care systems that best serve the needs of their populations. The bigger the risk pools, the better. Large pools offer several advantages, notably a greater capacity to meet the costs of occasional, costly diseases. The most efficient health systems avoid fragmentation in pooling but also in channelling funds and distributing resources. As discussed in previous chapters, fragmentation limits the scope for the cross-subsidies that are necessary in a pooling system, between rich and poor, and the healthy and sick. In the USA, fragmented pooling is perceived to be one of the reasons for the failure to reach universal coverage despite high levels of health spending (103).
Fragmentation can also be inefficient. Systems with multiple funding channels and pools, each with its own administrative costs, duplicate effort, are expensive to run and require coordination. Similarly, fragmentation in other parts of the system – running hospitals, distributing medicines and equipment, supporting laboratory systems – results in unnecessary waste and duplication.
Public health programmes, such as those for tuberculosis (TB) and HIV control, are often hampered by fragmented financial flows and service delivery (104). Where budget allocations flow from the government (often supplemented with international funds) to the programme, the programme then takes responsibility for pooling the funds and allocating them to service providers. In many cases, programmes have their own specific service-delivery arrangements, such as a TB hospital. In Kyrgyzstan, for example, the desired strategy was to have about 50% of TB patients managed by primary-care facilities, but only 3–4% of total spending on TB occurred at this level because of the way most domestic and external funds for TB were pooled separately from those in the main provider payment system and
77
The world health report financing for universal coverage
flowed predominantly to TB hospitals (105). These procedures have recently been modified and starting in 2011 some of these funds will be added to the more general pool of funds for health that can support primary-level care for TB patients.
Analysis of financial flows to HIV and drug-abuse programmes in Estonia also revealed unnecessary duplication. Injecting drug users were a target group for each programme, which contracted separately with NGOs skilled at outreach (106). In response, the government introduced a more efficient single contracting process, combining resources and packaging the interventions of both programmes (107).
Fragmentation is common but not restricted to the health system. A recent World Bank report suggested that there would be both efficiency and equity gains from better integrating social assistance and social insurance (including health insurance) systems in Latin American countries (108).
Nor is fragmentation a concern solely for national governments. There is increasing recognition in the development community that fragmented international aid delivery leads to high administrative costs for donors and recipients, unnecessary duplication and variations in policy guidance and quality standards at country level (109). An illustration of such duplication and waste is the high number of capacity-building seminars held each year. Often, the same people from a recipient country attend several training workshops in the course of a year, each covering similar topics, each funded by a different donor (110).
It is imperative, therefore, in the spirit of the Paris Declaration on Aid Effectiveness, that major donors not only commit, but act to align their efforts to promote national ownership of health plans and strategies. They can do this by reducing fragmentation in the way funds are channelled to recipient countries and by reducing duplication in the systems of training, service provision, monitoring and reporting they require. There is much to do: the number of international partnerships and global initiatives in health, each pooling and channelling funds to countries, has increased substantially since 2000 (111).
Redressing inequalityImproving efficiency will achieve better, more cost-effective health outcomes, but it will not be sufficient on its own. For health is more than the aggregate level of population health, neatly expressed by an indicator such as life expectancy. Health systems have multiple, sometimes competing goals: improving the overall level of health; reducing health inequalities; improving the responsiveness of the system to people’s needs and expectations; and ensuring financial fairness in the way funds for health are collected (112). Ideally, efficiency would be measured by the system’s ability to move forward on all these goals simultaneously.
At a minimum, progress in the overall level of population health and intervention coverage needs to be assessed against inequalities both within this aggregate level of coverage and in health outcomes. The substantial coverage inequalities in access to skilled health workers during child delivery and to diphtheria–tetanus–pertussis immunization within countries – taken from
78
More health for the money
recent Demographic and Health Surveys in mostly low-income countries with high maternal and child mortality – were described in Chapter 1. But inequalities exist even in the richest countries, as highlighted by the recent Commission on Social Determinants of Health (113). A recent study in Australia suggested that patients with cardiovascular disease were much less likely to receive interventions if they were in a lower socioeconomic group. At the extreme, low socioeconomic status patients were 52% less likely than their more affluent counterparts to undergo angiography (114). Similar examples of inequalities in health outcomes or access to services can be found from a wide range of countries, across all income levels (115, 116).
Migrants are one of the few remaining groups not covered by health insurance in Costa Rica, where in many other respects, great strides have been made towards universal coverage (117). Indigenous populations also deserve special attention, living shorter lives, in worse health, than their non-indigenous compatriots in almost every country. A recent study reports that in seven Central and South American countries, for example, the proportion of indigenous women receiving antenatal care or giving birth at health facilities was much lower than for non-indigenous women; this inequality in coverage is one of the causes of the disparity in maternal health outcomes between the indigenous and non-indigenous populations (118). African-American women in the same countries also gave birth at health facilities less frequently and had poorer maternal health outcomes than other women (118). Different types of inequalities in access to health services exist between indigenous and non-indigenous people in high-income countries such as Australia, Canada, New Zealand and the USA, linked frequently to distance and transport costs. Whatever the reasons, health outcomes remain persistently lower for indigenous people (119).
Ensuring that a high proportion of the available funds for health are prepaid and pooled increases financial risk protection and access to services for all people in the population. Government subsidies derived from general revenues for people who cannot pay further increases financial risk protection and access to services. Cash transfers, vouchers and other mechanisms for reducing the financial barriers associated with transport and accommodation costs and lost work time, increase coverage further still. But redressing inequalities requires more than good health financing systems. A broader set of initiatives outside health, linked largely to socioeconomic determinants, is necessary. That said, no health system can ensure equitable coverage without the health financing mechanisms of the kind described in this report.
ConclusionWe estimate that 20–40% of all health spending is wasted through inefficiency. It is an indicative estimate, based on relatively limited data, but does highlight that there are substantial gains to be made by reducing inefficiency. Every country could do something, sometimes a great deal, to improve efficiency. The international community could also do more to improve the efficiency of the global health architecture and to support recipient countries’ attempts to become more efficient.
79
The world health report financing for universal coverage
This chapter discusses some of the most direct and practical ways to reduce waste. Policy-makers should draw on them according to their own needs, recognizing that there may be other opportunities in their own settings. Perhaps counter-intuitively, reducing inefficiency does not necessarily require reducing expenditure; inefficiency can result from insufficient, rather than too much, spending. For example, low salaries can result in health workers supplementing income with second jobs during the hours of their primary employment. Solutions need to be tailored to each country’s needs, but eliminating just some of this waste would enable poor countries to move more rapidly towards universal coverage, while richer countries would be able to improve the availability and quality of the services they offer. ■
80
References1. The price of excess: identifying waste in healthcare spending. PricewaterhouseCoopers’ Health Research Institute, 2009 (http://www.
pwc.com/us/en/healthcare/publications/the-price-of-excess.jhtml, accessed 7 July 2010).2. Where can $700 billion in waste be cut annually from the US healthcare system? Thomson Reuters, 2009 (http://www.factsforhealthcare.
com/whitepaper/HealthcareWaste.pdf, accessed 06 July 2010).3. The financial cost of healthcare fraud. European Healthcare Fraud and Corruption Network, 2010 (http://www.ehfcn.org/media/docu-
ments/The-Financial-Cost-of-Healthcare-Fraud---Final-(2).pdf, accessed 2 July 2010).4. Roses M. Hacia un desarrollo integrado e inclusivo en América Latina y el Caribe, 2010 (http://www.paho.org/Spanish/D/D_III_ForoPo-
liticaSocial_OPS_final.ppt, accessed 06 July 2010).5. World health statistics 2010. Geneva, World Health Organization, 2010.6. Chisholm D, Evans DB. Improving health system efficiency as a means of moving towards universal coverage. World health report 2010
background paper, no. 28 (http://www.who.int/healthsystems/topics/financing/healthreport/whr_background/en).7. Lu Y et al. Medicine expenditures. In: The world medicines situation. Geneva, World Health Organization, 2010 (http://dosei.who.int/).8. International drug price indicator guide. Management Sciences for Health, 2008 (http://erc.msh.org/dmpguide, accessed 06 July 2010).9. Cameron A et al. Medicine prices, availability, and affordability in 36 developing and middle-income countries: a secondary analysis.
Lancet, 2009,373:240-249. doi:10.1016/S0140-6736(08)61762-6 PMID:1904201210. Medicine prices, availability, affordability and price components. Health Action International, 2008 (http://www.haiweb.org/medicine-
prices, accessed 7 July 2010).11. Cameron A. Cost savings of switching consumption from originator brand medicines to generic equivalents. World health report 2010
background paper, no. 35 (http://www.who.int/healthsystems/topics/financing/healthreport/whr_background/en).12. Médicaments génériques: plus d’1 milliard d’euros d’économie en 2009. Caisse Nationale D’Assurance Maladie, 2009 (http://www.ameli.
fr/fileadmin/user_upload/documents/CP_generiques_nov_09_vdef.pdf, accessed 2 July 2010).13. Mémento medicament 2009. Fédération Nationale de la Mutualité Française, 2009 (http://www.mutualite.fr/L-actualite/Kiosque/
Communiques-de-presse/La-Mutualite-francaise-publie-l-edition-2009-de-son-Memento-medicament, accessed 2 July 2010).14. Dondorp AM et al. Fake antimalarials in Southeast Asia are a major impediment to malaria control: multinational cross-sectional
survey on the prevalence of fake antimalarials. Tropical medicine & international health : TM & IH, 2004,9:1241-1246. doi:10.1111/j.1365-3156.2004.01342.x PMID:15598255
15. Survey of the quality of selected antimalarial medicines circulating in Madagascar, Senegal, and Uganda. The United States Pharmacopeia and USAID, 2010 (http://www.usaid.gov/our_work/global_health/hs/publications/qamsa_report_1109.pdf, accessed 6 July 2010).
16. Cockburn R et al. The global threat of counterfeit drugs: why industry and governments must communicate the dangers. PLoS Medi-cine, 2005,2:e100- doi:10.1371/journal.pmed.0020100 PMID:15755195
17. Production of medicines. Geneva, World Health Organization (http://www.who.int/medicines/areas/quality_safety/quality_assuran-ce/production, accessed 6 July 2010).
18. Prequalification programme: a United Nations programme managed by WHO. Geneva, World Health Organization (http://apps.who.int/prequal/default.htm, accessed 6 July 2010).
19. Medicines use in primary care in developing and transitional countries. Geneva, World Health Organization, 2009 (http://www.who.int/medicines/publications/who_emp_2009.3, accessed 7 July 2010).
20. Adherence to long-term therapies: evidence for action. Geneva, World Health Organization, 2003 (http://www.who.int/chp/knowledge/publications/adherence_full_report.pdf, accessed 7 July 2010).
More health for the money
21. Holloway K, Dijk E. Rational use of medicines. In: The world medicines situation. Geneva, World Health Organization, 2010 (http://dosei.who.int/).
22. Abegunde D. Inefficiencies due to poor access to and irrational use of medicines to treat acute respiratory tract infections in children. World health report 2010 background paper, no. 52 (http://www.who.int/healthsystems/topics/financing/healthreport/whr_background/en).
23. Essential health technologies. Geneva, World Health Organization (http://www.who.int/eht, accessed 7 July 2010). 24. Health at a glance 2009. Paris, Organisation for Economic Co-operation and Development, 2009.25. Issakov A. Health care equipment: a WHO perspective. In: Van Gruting CWD, eds. Medical devices: international perspectives on health
and safety. Amsterdam, Elsevier, 1994.26. Guidelines for health care equipment donations. Geneva, World Health Organization, 2000 (http://www.who.int/selection_medicines/
emergencies/guidelines_medicine_donations/en/index.html, accessed 6 July 2010). 27. Medical equipment in Gaza’s hospitals: internal management, the Israeli blockade and foreign donations. Cairo, World Health Orga-
nization Regional Office for the Eastern Mediterranean, 2009 (http://www.emro.who.int/Palestine/reports/monitoring/WHO_spe-cial_monitoring/gaza/Medical%20equipment%20in%20Gaza%20EB%20report(July09).pdf, accessed 6 July 2010).
28. Fisher ES et al. The implications of regional variations in Medicare spending. Part 1: the content, quality, and accessibility of care. Annals of Internal Medicine, 2003,138:273-287. PMID:12585825
29. Fisher ES et al. The implications of regional variations in Medicare spending. Part 2: health outcomes and satisfaction with care. Annals of Internal Medicine, 2003,138:288-298. PMID:12585826
30. Fisher ES. Medical care–is more always better? The New England Journal of Medicine, 2003,349:1665-1667. doi:10.1056/NEJMe038149 PMID:14573739
31. Maynard A. Payment for performance (P4P): international experience and a cautionary proposal for Estonia. Copenhagen, World Health Organization Regional Office for Europe, 2008 (Health Financing Policy Paper; http://www.euro.who.int/__data/assets/pdf_file/0009/78975/P4P_Estonia.pdf, accessed 13 July 2010).
32. Fox KAA et al. Management of acute coronary syndromes. Variations in practice and outcome; findings from the Global Registry of Acute Coronary Events (GRACE). European Heart Journal, 2002,23:1177-1189. doi:10.1053/euhj.2001.3081 PMID:12127920
33. Peterson S, Eriksson M, Tibblin G. Practice variation in Swedish primary care. Scandinavian Journal of Primary Health Care, 1997,15:68-75. doi:10.3109/02813439709018490 PMID:9232706
34. de Jong J, Groenewegen P, Westert GP. Medical practice variation: Does it cluster within general practitioners’ practices? In: Westert GP, Jabaaij L, Schellevis GF, eds. Morbidity, performance and quality in primary care. Dutch general practice on stage. Abingdon, Rad-cliffe, 2006.
35. Hernandez P et al. Measuring expenditure for the health workforce: evidence and challenges. World health report 2006 background paper (http://www.who.int/nha/docs/Paper%20on%20HR.pdf, accessed 7 July 2010).
36. The world health report 2006 - working together for health. Geneva, World Health Organization, 2006. 37. Kurowski C et al. Human resources for health: requirements and availability in the context of scaling-up priority interventions in low-in-
come countries - case studies from Tanzania and Chad. London, London School of Hygiene and Tropical Medicine, 2003 (HEFP working paper 01/04).
38. Sousa A et al. Measuring the efficiency of human resources for health for attaining health outcomes across sub-national units in Brazil. World health report 2006 background paper (http://www.who.int/hrh/documents/measuring_efficiency_Brazil.pdf, accessed 7 July 2010).
39. DeCoster C et al. Inappropriate hospital use by patients receiving care for medical conditions: targeting utilization review. CMAJ : Canadian Medical Association journal = journal de l’Association medicale canadienne, 1997,157:889-896. PMID:9327796
40. Posnett J. Are bigger hospitals better? In: Mckee M, Healy J, eds. Hospitals in a changing Europe. Buckingham, Open University Press, 2002.41. Hollingsworth B. The measurement of efficiency and productivity of health care delivery. Health Economics, 2008,17:1107-1128.
doi:10.1002/hec.1391 PMID:1870209142. Zere E et al. Technical efficiency of district hospitals: evidence from Namibia using data envelopment analysis. Cost effectiveness and
resource allocation : C/E, 2006,4:5- doi:10.1186/1478-7547-4-5 PMID:1656681843. Lee KH, Yang SB, Choi M. The association between hospital ownership and technical efficiency in a managed care environment.
Journal of Medical Systems, 2009,33:307-315. doi:10.1007/s10916-008-9192-2 PMID:1969769744. Steinmann L, Zweifel P. On the (in)efficiency of Swiss hospitals. Applied Economics, 2003,35:361-370. doi:10.1080/0003684021016718345. Filippini M, Farsi M. An analysis of efficiency and productivity in Swiss hospitals. Report to Swiss Federal Statistical Office and Swiss
Federal Office for Social Security, 2004 (http://www.bfs.admin.ch/bfs/portal/de/index/themen/14/03/01/dos/01.Document.80194.pdf, accessed 7 July 2010).
46. Herr A. Cost and technical efficiency of German hospitals: does ownership matter? Health Economics, 2008,17:1057-1071. doi:10.1002/hec.1388 PMID:18702100
47. Staat M. Efficiency of hospitals in Germany: a DEA-bootstrap approach. Applied Economics, 2006,38:2255-2263. doi:10.1080/00036840500427502
81

The world health report financing for universal coverage
48. Masiye F. Investigating health system performance: an application of data envelopment analysis to Zambian hospitals. BMC Health Services Research, 2007,7:58- doi:10.1186/1472-6963-7-58 PMID:17459153
49. Bates DW et al. Research Priority Setting Working Group of the WHO World Alliance for Patient SafetyGlobal priorities for patient safety research. BMJ, 2009,338:b1775- doi:10.1136/bmj.b1775 PMID:19443552
50. First Global Patient Safety Challenge. World Health Organization Alliance of Patient Safety (http://www.who.int/gpsc/country_work/burden_hcai/en/index.html, accessed 4 June 2010).
51. Kohn TL, Corrigan MJ, Donaldson SM. To err is human: building a safer health system. Committee on Quality of Health Care in America, Institute of Medicine. Washington, DC, National Academy Press, 1999.
52. Pronovost P et al. An intervention to decrease catheter-related bloodstream infections in the ICU. The New England Journal of Medi-cine, 2006,355:2725-2732. doi:10.1056/NEJMoa061115 PMID:17192537
53. Humphreys G. When the patient falls out of bed, who pays? Bulletin of the World Health Organization, 2009,87:169-170. doi:10.2471/BLT.09.030309 PMID:19377709
54. Handbook for curbing corruption in public procurement - experiences from Indonesia, Malaysia and Pakistan. Berlin, Transparency Inter-national, 2006.
55. Becker D, Kessler D, McClellan M. Detecting Medicare abuse. Journal of Health Economics, 2005,24:189-210. doi:10.1016/j.jheale-co.2004.07.002 PMID:15617794
56. Baghdadi-Sabeti G, Serhan F. Good governance form medicines programme: an innovative approach to prevent corruption in the pharmaceutical sector. World health report 2010 background paper, no. 25 (http://www.who.int/healthsystems/topics/financing/healthreport/whr_background/en).
57. Medicines Transparency Alliance (MeTA). (http://www.medicinestransparency.org/, accessed 6 July 2010).58. Siddiqi S et al. Framework for assessing governance of the health system in developing countries: gateway to good governance.
Health policy (Amsterdam, Netherlands), 2009,90:13-25. doi:10.1016/j.healthpol.2008.08.005 PMID:1883818859. WHO CHOICE Database. Geneva, World Health Organization, 2010 (http://www.who.int/choice, accessed 7 July 2010).60. Disease Control Priorities Project. (http://www.dcp2.org, accessed 7 July 2010).61. Hutubessy R, Chisholm D, Edejer TTT. Generalized cost-effectiveness analysis for national-level priority-setting in the health sector.
Cost effectiveness and resource allocation : C/E, 2003,1:8- doi:10.1186/1478-7547-1-8 PMID:1468742062. Chanda P et al. A cost-effectiveness analysis of artemether lumefantrine for treatment of uncomplicated malaria in Zambia. Malaria
Journal, 2007,6:21- doi:10.1186/1475-2875-6-21 PMID:1731368263. Unpublished analysis from the SPICE project (Setting Priorities using Information on Cost-Effectiveness): informing policy choices and
health system reform in Thailand. Brisbane, University of Queensland, 2010 (http://www.uq.edu.au/bodce/docs/Spice_Brochure.pdf, accessed 7 July 2010).
64. Lai T et al. Costs, health effects and cost-effectiveness of alcohol and tobacco control strategies in Estonia. Health policy (Amsterdam, Netherlands), 2007,84:75-88. doi:10.1016/j.healthpol.2007.02.012 PMID:17403551
65. Gureje O et al. Cost-effectiveness of an essential mental health intervention package in Nigeria. World psychiatry : official journal of the World Psychiatric Association (WPA), 2007,6:42-48. PMID:17342226
66. Andrews G et al. Utilising survey data to inform public policy: comparison of the cost-effectiveness of treatment of ten mental disor-ders. The British journal of psychiatry : the journal of mental science, 2004,184:526-533. doi:10.1192/bjp.184.6.526 PMID:15172947
67. Ginsberg GM et al. Screening, prevention and treatment of cervical cancer – a global and regional generalized cost-effectiveness analysis. Vaccine, 2009,27:6060-6079. doi:10.1016/j.vaccine.2009.07.026 PMID:19647813
68. Hogan C et al. Medicare beneficiaries’ costs of care in the last year of life. Health Aff (Millwood), 2001,20:188-195. doi:10.1377/hlt-haff.20.4.188 PMID:11463076
69. National Health Accounts [online database]. Geneva, World Health Organization (http://www.who.int/nha, accessed 7 July 2010).70. Lauer JA et al. Determinants of caesarean section rates in developed countries: supply, demand and opportunities for control. World health
report 2010 background paper, no. 29 (http://www.who.int/healthsystems/topics/financing/healthreport/whr_background/en). 71. Minkoff H, Chervenak FA. Elective primary cesarean delivery. The New England Journal of Medicine, 2003,348:946-950. doi:10.1056/
NEJMsb022734 PMID:1262114072. Bewley S, Cockburn JI. I. The unethics of ‘request’ caesarean section. BJOG : an international journal of obstetrics and gynaecology,
2002,109:593-596. PMID:1211863373. Villar J et al. WHO 2005 global survey on maternal and perinatal health research groupCaesarean delivery rates and pregnancy
outcomes: the 2005 WHO global survey on maternal and perinatal health in Latin America. Lancet, 2006,367:1819-1829. doi:10.1016/S0140-6736(06)68704-7 PMID:16753484
74. Declercq E, Menacker F, MacDorman M. Rise in “no indicated risk” primary caesareans in the United States, 1991–2001: cross sectional analysis. BMJ (Clinical research ed.), 2005,330:71-72. doi:10.1136/bmj.38279.705336.0B PMID:15556953
82
More health for the money
75. Gibbons L et al. The global numbers and costs of additionally needed and unnecessary caesarean sections performed per year: overuse as a barrier to universal coverage. World health report 2010 background paper, no. 30 (http://www.who.int/healthsystems/topics/financing/healthreport/whr_background/en).
76. McDonagh MS, Smith DH, Goddard M. Measuring appropriate use of acute beds. A systematic review of methods and results. Health policy (Amsterdam, Netherlands), 2000,53:157-184. doi:10.1016/S0168-8510(00)00117-2 PMID:10996065
77. Pileggi C et al. Inappropriate hospital use by patients needing urgent medical attention in Italy. Public Health, 2004,118:284-291. doi:10.1016/j.puhe.2003.06.002 PMID:15121437
78. Kutzin J et al. Bismarck meets Beveridge on the Silk Road: coordinating funding sources to create a universal health financing system in Kyrgyzstan. Bulletin of the World Health Organization, 2009,87:549-554. doi:10.2471/BLT.07.049544 PMID:19649370
79. Burduja D. Health services policies and case mix - what would you expect (or not) to happen? Selected findings from Romania and Turkey, 2000–2008. BMC Health Services Research, 2008,8:Suppl 1A5- doi:10.1186/1472-6963-8-S1-A5
80. Hirunrassamee S, Ratanawijitrasin S. Does your health care depend on how your insurer pays providers? Variation in utilization and outcomes in Thailand. International Journal of Health Care Finance and Economics, 2009,9:153-168. doi:10.1007/s10754-009-9062-6 PMID:19396629
81. O’Dougherty S et al. Case Based Hospital Payment System. In: Langenbrunner JC, Cashin C, O’Dougherty S, eds. Designing and Im-plementing Health Care Provider Payment Systems. Washington, DC, The World Bank, 2009.
82. Gerdtham UG et al. Internal markets and health care efficiency: a multiple-output stochastic frontier analysis. Health Economics, 1999,8:151-164. doi:10.1002/(SICI)1099-1050(199903)8:2<151::AID-HEC411>3.0.CO;2-Q PMID:10342728
83. Culyer A, Newhouse J. Government purchasing of health services. In: Chalkey M, Malcomson J, eds. Handbook of health economics. Amsterdam, Elsevier, 2010.
84. Elovainio R. Performance incentives for health in high-income countries – key issues and lessons learned. World health report 2010 back-ground paper, no. 32 (http://www.who.int/healthsystems/topics/financing/healthreport/whr_background/en).
85. Park M et al. Provider payments and cost-containment – lessons from OECD countries. Geneva, World Health Organization, 2007 (Health Systems Financing Technical Briefs for Policy-makers, WHO/HSS/HSF/PB/07/02; http://www.who.int/health_financing/documents/pb_e_07_2-provider_payments.pdf, accessed 6 July 2010).
86. Perrot J et al. Performance incentives for health care providers. Geneva, World Health Organization, 2010 (Health Systems Financing Discussion Paper, HSS/HSF/DP.E.10.1; http://www.who.int/contracting/DP_10_1_EN.pdf, accessed 7 July 2010).
87. Campbell S et al. Quality of primary care in England with the introduction of pay for performance. The New England Journal of Medi-cine, 2007,357:181-190. doi:10.1056/NEJMsr065990 PMID:17625132
88. Lindenauer PK et al. Public reporting and pay for performance in hospital quality improvement. The New England Journal of Medicine, 2007,356:486-496. doi:10.1056/NEJMsa064964 PMID:17259444
89. Oldroyd J et al. Providing healthcare for people with chronic illness: the views of Australian GPs. The Medical Journal of Australia, 2003,179:30-33. PMID:12831381
90. Fleetcroft R, Cookson R. Do the incentive payments in the new NHS contract for primary care reflect likely population health gains? Journal of Health Services Research & Policy, 2006,11:27-31. doi:10.1258/135581906775094316 PMID:16378529
91. Eichler R, Levine R, Performance-based Incentives Working Group, eds. Performance incentives for global health: potential and pitfalls. Washington, DC, Center for Global Development, 2009.
92. Eichler R et al. Going to scale with a performance incentive model. In: Eichler R, Levine R, Performance-based Incentives Working Group, eds. Performance incentives for global health. Washington, DC, Center for Global Development, 2009.
93. Basinga P et al. Paying primary health care centers for performance in Rwanda. Washington, DC, The World Bank, 2010 (Policy Research Working Paper No. 5190).
94. Toonen J et al. Learning lessons on implementing performance based financing from a multi-country evaluation. Royal Tropical Institute in collaboration with Cordaid and the World Health Organization. Amsterdam, Royal Tropical Institute, 2009 (http://www.who.int/contracting/PBF.pdf, accessed 4 June 2010).
95. Oxman AD, Fretheim A. An overview of research on the effects of results-based financing. Oslo, Norwegian Knowledge Centre for Health Services, 2008.
96. Petersen LA et al. Does pay-for-performance improve the quality of health care? Annals of Internal Medicine, 2006,145:265-272. PMID:16908917
97. Cowley J. Effects of health worker incentive payment on safe motherhood indicators in Burundi. Presentation at STI symposium, Basel, 27 November 2008. (http://www.swisstph.ch/fileadmin/user_upload/Pdfs/STI_Symposium_08_Cowley.pdf, accessed on Au-gust 4 2010).
98. Wynia MK. The risks of rewards in health care: how pay-for-performance could threaten, or bolster, medical professionalism. Journal of General Internal Medicine, 2009,24:884-887. doi:10.1007/s11606-009-0984-y PMID:19387747
83
The world health report financing for universal coverage
99. McDonald R, Roland M. Pay for performance in primary care in England and California: comparison of unintended consequences. Annals of Family Medicine, 2009,7:121-127. doi:10.1370/afm.946 PMID:19273866
100. Figueras J, Robinson R, Jakubowski E. Purchasing to improve health systems performance: drawing the lessons. In: Figueras J, Robin-son R, Jakubowski E, eds. Purchasing to improve health systems performance. World Health Organization on behalf of the European Observatory for Health Systems and Policies. Maidenhead, Open University Press, 2005.
101. Kutzin J. A descriptive framework for country-level analysis of health care financing arrangements. Health Policy, 2001,56:171-204. doi:10.1016/S0168-8510(00)00149-4 PMID:11399345
102. Preker AS et al. Public ends, private means. Strategic purchasing of health services: strategic purchasing of value for money in health care. Washington, DC, The World Bank, 2007.
103. Walgate R. European health systems face scrutiny in US debate. Lancet, 2009,374:1407-1408. doi:10.1016/S0140-6736(09)61845-6 PMID:19866517
104. Kutzin J, Cashin C, Jakab M. Financing of public health services and programs: time to look into the black box. Implementing health finan-cing reform: lessons from countries in transition. Copenhagen, World Health Organization Regional Office for Europe and the European Observatory on Health Systems and Policies, 2010.
105. Akkazieva B et al. Review of total health expenditures on TB programme in Kyrgyzstan, 2007: NHA sub-accounts on TB control programme. Bishkek, Health Policy Analysis Centre, 2007 (Policy Research Paper No. 55; http://pdf.usaid.gov/pdf_docs/PNADP453.pdf, accessed 7 July 2010).
106. Alban A, Kutzin J. Scaling up treatment and care for HIV/AIDS and TB and accelerating prevention within the health system in the Baltic States (Estonia, Latvia, Lithuania). Economic, health financing and health system implications. Copenhagen, World Health Organization Regional Office for Europe, 2007 (http://www.euro.who.int/__data/assets/pdf_file/0011/78905/E90675.pdf, accessed 2 July 2010).
107. Politi C, Torvand T. Financing HIV/AIDS and Tuberculosis interventions in Estonia. Copenhagen, World Health Organization Regional Office for Europe, 2007 (http://www.euro.who.int/__data/assets/pdf_file/0010/78904/E90770.pdf, accessed 7 July 2010).
108. Ferreira FHG, Robalino D. Social Protection in Latin America: achievements and limitation. Washington, DC, The World Bank, Latin America and the Caribbean Region, Office of the Chief Economist and Human Development Network, Social Protection and Labor Unit, 2010 (Policy Research Working Paper WPS5305; http://www-wds.worldbank.org/external/default/WDSContentServer/IW3P/IB/2010/05/10/000158349_20100510134942/Rendered/PDF/WPS5305.pdf, accessed 7 July 2010).
109. Raising and channeling funds. Working Group 2 report. Geneva, Taskforce on Innovative International Financing for Health Systems, 2009 (http://www.internationalhealthpartnership.net//CMS_files/documents/working_group_2_report:_raising_and_channe-ling_funds_EN.pdf, accessed 2 July 2010).
110. Reforming allowances: a win-win approach to improved service delivery, higher salaries for civil servants and saving money. Dar es Sa-laam, Tanzania Policy Forum, 2009 (Technical policy brief 9; http://www.policyforum-tz.org/files/ReformingAllowances.pdf, acces-sed 04 June 2010).
111. Waddington C et al. Global aid architecture and the health Millennium Development Goals. Study report 1/2009. Oslo, Norwegian Agency for Development Cooperation, 2009 (http://www.norad.no/en/Tools+and+publications/Publications/Publication+Page?key=146674, accessed 7 July 2010).
112. Everybody’s business: strengthening health systems to improve health outcomes. WHO’s Framework for Action. Geneva, World Health Organization, 2007 (http://www.who.int/healthsystems/strategy/everybodys_business.pdf, accessed 7 July 2010).
113. Closing the gap in a generation: Health equity through action on the social determinants of health. A report of the WHO Commission on Social Determinants of Health. Geneva, World Health Organization, 2008.
114. Korda RJ, Clements MS, Kelman CW. Universal health care no guarantee of equity: comparison of socioeconomic inequalities in the receipt of coronary procedures in patients with acute myocardial infarction and angina. BMC Public Health, 2009,9:460- doi:10.1186/1471-2458-9-460 PMID:20003401
115. Huber M et al. Quality in and equality of access to healthcare services. European Commission Directorate-General for Employment, Social Affairs and Equal Opportunities, 2008 (http://www.euro.centre.org/data/1237457784_41597.pdf, accessed 7 July 2010).
116. Gwatkin DR et al. Socio-economic differences in health, nutrition, and population within developing countries: an overview. Washington, DC, The World Bank, 2007 (http://siteresources.worldbank.org/INTPAH/Resources/IndicatorsOverview.pdf, accesssed 2 July 2010).
117. Sáenz M, Bermudez JM, Acosta M. Costa Rican health care system. World health report 2010 background paper, no. 11. (http://www.who.int/healthsystems/topics/financing/healthreport/whr_background/en).
118. Parodi CT, Munoz S, Sanhueza A. Acceso y gasto de salud para grupos étnicos /raciales en la región de las Américas. World health report 2010 background paper, no. 46 (http://www.who.int/healthsystems/topics/financing/healthreport/whr_background/en).
119. Jackson Pulver LR et al. Indigenous health: Australia, Canada, Aotearoa, New Zealand and the United States: laying claim to a future that embraces health for us all. World health report 2010 background paper, no. 33 (http://www.who.int/healthsystems/topics/financing/healthreport/whr_background/en).
84