Chapter-4 Measurement of LIII subshell absorption edge...
22
98 Chapter-4 Measurement of L III subshell absorption edge jump ratio ( III L r ) and jump factor ( III L J ) 4.1 Introduction In this Chapter, measurements of L III subshell absorption edge jump ratios ( III L r ) and jump factors ( III L J ) of W, Au, Hg and Pb by using EDXRF technique are presented in detail. Comparison of the measured values with theoretically calculated values of the jump ratio ( III L r ) and jump factor ( III L J ) as well as the associated parameters needed for their determination are given in subsequent sections. A plot of L III subshell photo effect cross-section as a function of photon energy for a given target gives a saw-tooth structure around the L III subshell edge. The upper energy branch corresponds to photoelectric cross-section due to the L III subshell, M and higher shells and the lower energy branch corresponds to M and higher shells. Therefore, the ratio of the photoelectric cross-section of the upper energy branch to that of the lower energy branch gives the L III subshell absorption jump ratio. Similarly absorption jump factor is associated with photoelectric absorption coefficient for different shells/subshells (i.e. K LI , LII ….) and is defined as the fraction of the total Part of this work has been published in a) Journal of Electron Spectroscopy and Related Phenomena, 184 (2011) 177–179. b) Radiat. Phys. Chem., 80 (2011)688-691.
Transcript of Chapter-4 Measurement of LIII subshell absorption edge...

98
Chapter-4
Measurement of LIII subshell absorption edge jump ratio
(III
Lr ) and jump factor (III
LJ )
4.1 Introduction
In this Chapter, measurements of LIII subshell absorption edge jump ratios (IIILr )
and jump factors (IIILJ ) of W, Au, Hg and Pb by using EDXRF technique are presented
in detail. Comparison of the measured values with theoretically calculated values of the
jump ratio (IIILr ) and jump factor (
IIILJ ) as well as the associated parameters needed for
their determination are given in subsequent sections.
A plot of LIII subshell photo effect cross-section as a function of photon energy
for a given target gives a saw-tooth structure around the LIII subshell edge. The upper
energy branch corresponds to photoelectric cross-section due to the LIII subshell, M and
higher shells and the lower energy branch corresponds to M and higher shells.
Therefore, the ratio of the photoelectric cross-section of the upper energy branch to that
of the lower energy branch gives the LIII subshell absorption jump ratio. Similarly
absorption jump factor is associated with photoelectric absorption coefficient for
different shells/subshells (i.e. KLI, LII ….) and is defined as the fraction of the total
Part of this work has been published in
a) Journal of Electron Spectroscopy and Related Phenomena, 184 (2011)
177–179.
b) Radiat. Phys. Chem., 80 (2011)688-691.
99
absorption that is associated with a given subshell rather than for any other shells.
For example, LIII shell jump ratio rLIII is given as
...)(...)(
.......)(
VIIIIIIIIIIIII
IIIIIIIII
III
NNNNMMM
MMML
Lr
(4.1)
Similarly, LIII shell absorption jump factor JLIII is given as
VIIIIIIIIIIIIIIII
III
III
NNNNMMML
L
LJ
(...)( (4.2)
where i is photoelectric cross-section of ith
shell/subshell.
Recently Kaya et al.(2008) has measured LIII subshell absorption jump ratio and
jump factor for bismuth by measuring mass attenuation coefficient values using
nineteen different elements whose K’s and L’s energies lies on both side of LIII
subshell absorption edge of Bismuth. He has measured mass attenuation coefficient at
36 energies in order to deduce the value of LIII subshell absorption jump ratio. Clearly
this method is expensive, exhaustive and requires many monoenergetic gamma sources
or many thin foils. Thus keeping in mind, the limitations of above used method, LIII
subshell absorption jump ratio and jump factor of W, Hg, Au and Pb has been measured
employing an alternative technique to fulfill the following objectives:
to evolve an experimental technique for measuring of LIII subshell
absorption edge jump ratio and jump factor which would be less
expensive, less time consuming and works more efficiently.
to provide experimental data relevant to LIII subshell edge jump ratio and
jump factor for above said high Z elements, where no experimental data
except for Bismuth ( Kaya et al. 2008) is available in literature.
EDXRF method involve the determination of LIII subshell jump ratio and jump
factor from the measured values of LIII subshell X-ray production cross-section, total
LIII subshell atomic cross-section and calculated value of LIII subshell fluorescent yield.

100
The values of LIII subshell X-ray production cross-section ( x
LIII ) has been
determined from the experimentally measured values of Li shell X-ray production cross-
section iL ( i= ,and by subtracting the contribution due to LI and LII subshell
cross-sections. Where as, the values of total LIII subshell atomic cross-section were
obtained from the experimentally measured values of total atomic cross-section ( t ) by
subtracting the contribution of scattering and K, LI and LII shell/subshell
photoionization cross-sections. Detail description of the method of measurement has
been given in subsequent paragraphs.
4.2 Method of computation and measurement
4.2.1 Measurement of LIII subshell absorption edge jump
factor (III
LJ )
LIII-subshell jump factor of an element has been measured using the following
relation
3
III
III
III
tL
x
L
LJ (4.3)
where x
LIII represent LIII subshell X-ray production cross-section ,
IIItL represent total
photo ionization cross-section of LIII and higher subshells and 3 represent LIII
subshell fluorescence yield.
4.2.2 Measurement of LIII subshell X-ray production cross-section
( x
LIIIσ )
L shell X-ray emission spectrum is relatively more complex than that of the K
X-ray, the investigations relating to the L X-ray spectrum is the simultaneous presence
of X-rays characteristic of all the three subshells in some of the L X-ray groups. The

101
separation between the L subshell edges is very small and is comparable to that of the
binding energies of the outer shell electrons that jump to fill the L shell vacancies’
resulting in the emission of X-ray. Consequently several L X-rays lines of closely
spaced energies fall under one photo peak and are not fully resolved even with the
presently available best resolution energy dispersive spectrometers. Within the present
limit of resolution of the energy dispersive spectrometers, L X-ray spectra can be
resolved into four main groups Ll, Lα, Lβ and Lγ in most of the high Z elements. Out of
these four peaks, Ll and Lα originate purely from the transitions to LIII subshell with
J=3/2, whereas Lβ peak of X-rays contains contributions from all the three subshells of
L shell. However Lγ X-ray peak contains only the contribution from L1 and L2 (J=1/2)
subshell and has been rejected. Thus the author has measured the X-ray production
cross-sections for Ll, Lα and Lβ groups of L X-ray lines in different elements in the
range 74≤Z≤82.
Details of the experimental setup used for the present measurements of Ll, Lα
and Lβ partial X-ray production cross-sections is same as given in section 3.2. In
present investigation, self supporting target of Hg made from its stable chemical
compound HgCl2 using the technique described elsewhere (Tirasoglu, 2006) and
metallic targets of W, Au and Pb has been used. All the targets were procured from
Sigma-Aldrich and were 99.999 % pure as quoted by manufacturer. It is evident from
the spectrum of W (figure 4.1) that all the L X-ray lines present in the spectrum are not
fully resolved from each other due to limited resolution of the spectrometer, instead
they appear as four distinct groups of lines corresponding to Ll, Lα ,Lβ and Lγ groups.
But out of these four major peaks, only three peaks Ll, Lα and Lβ were used for the
present investigations. The natural background counts were also recorded for equal
time. This was done by removing 241
Am source from its original position. This

102
background was subtracted from the L X-ray spectrum recorded with 59.54 keV gamma
rays incident upon the target. The experiment with each target was run for a sufficiently
long time to achieve statistical uncertainty ~2% in the counts under L peak of all
elements. In other L X-ray peaks ( L and L ) the statistical uncertainty in the counts
were ~1%.
From the elementary considerations as discussed in section 3.3.1, the number of
L X-ray, LiN (i= ,and , counted per unit time under the peak iL using energy
dispersive X-ray spectrometer is given as:
LiLi
X
Lia
Li tM
NSN
2
21
)4( (4.4)
where S= the number of gamma rays emitted from the source per unit time.
1 = solid angle subtended by source on target.
2 = solid angle subtended by target on detector.
= the correction factor which takes into accounts, the absorption of gamma rays in the
source and the target
M
N a = number of atoms per gm of the target material.
t = thickness of target in gm/cm2
Li = the correction factor which takes into account the effect of absorption of incident
gamma rays and emitted iL group of L X-rays in the target.
X
Li = the cross-section for the production of iL group of L X-rays at the incident
gamma ray energy.
Li = the Si(Li) detector photo peak detection efficiency for iL group of L X-rays
emitted from the target.

103
Re-writing expression (4.4), we get
2
21
)4(
aLi
Li
LiX
LiNS
t
MN (4.5)
Where i= ,and
It is clear from the expression (4.5) that the partial Li subshell X-ray production
cross-section can be determined from the equation using the measured values of LiN ,
the geometrical efficiency factor 2
21
)4(
aLi NS and the calculated values of the target self
absorption correction factor, target thickness and mass of the target element .
4.2.2.1 Measurement of ( LiN )
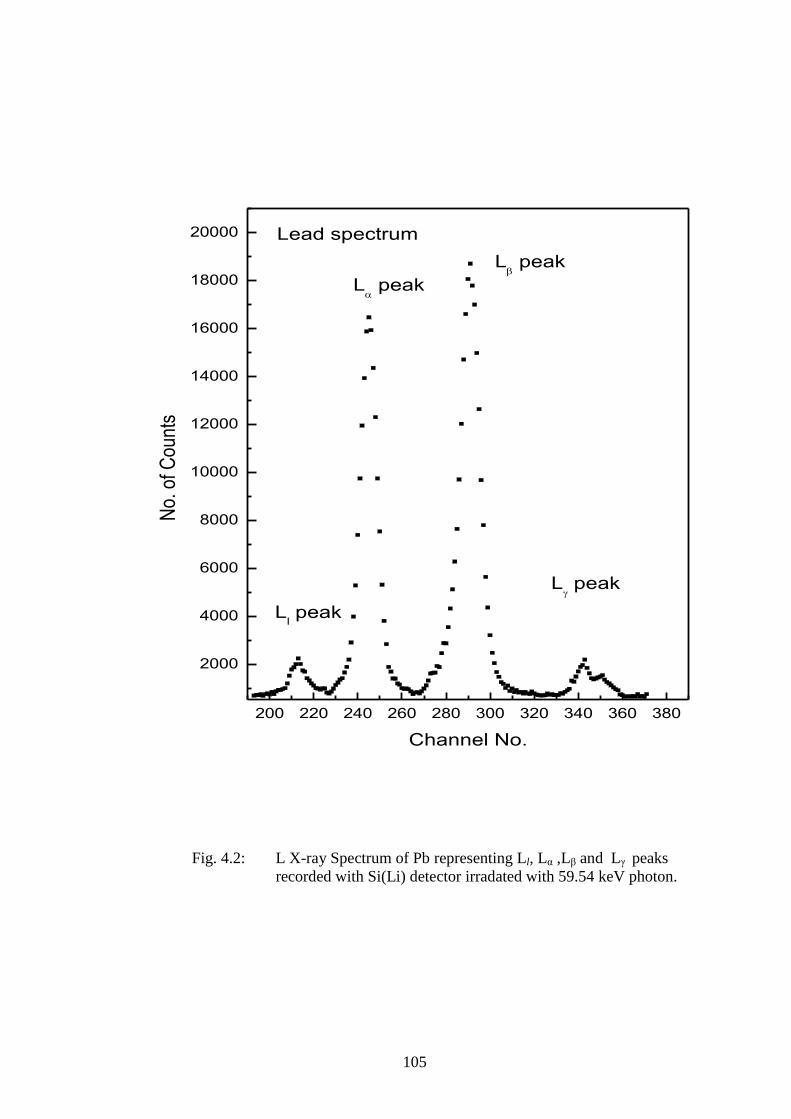
Targets of elements W, Au, Hg and Pb were irradiated with 59.54 keV gamma
rays and the L X-ray spectra were recorded in each case. From these spectra, the
counting rates, LiN , under the different L X-ray peaks i.e. L , L and L etc. were
noted. Typical spectra of W and Pb target elements have been given in figure 4.1 and
4.2 respectively.
4.2.2.2 Determination of self-absorption correction factor ( Liβ )
The targets of elements under investigation were not infinitely thin. As a result,
these targets absorb a fraction of the incident gamma rays before interaction with the
atoms of target elements and fraction of emitted L X-rays before they came out of the
target for detection. The correction for this absorption amounts to replacing the target
of thickness ‘t’ by a target of effective thickness tteff , where ‘ ’ is the correction
factor which takes into account the absorption of incident ray and emitted X-rays in the

104
160 180 200 220 240 260 280 300
500
1000
1500
2000
2500
3000
3500
No.
of C
ount
s
Channel No.
L peakL
l peak
L peak
L peak
W-Spectrum
Fig. 4.1: L X-ray Spectrum of W representing Ll, Lα ,Lβ and Lγ peaks
recorded with Si(Li) detector irradated with 59.54 keV photon.
105
200 220 240 260 280 300 320 340 360 380
2000
4000
6000
8000
10000
12000
14000
16000
18000
20000
L peak
L peak
L peak
No.
of C
ount
s
Channel No.
Ll peak
Lead spectrum
Fig. 4.2: L X-ray Spectrum of Pb representing Ll, Lα ,Lβ and Lγ peaks
recorded with Si(Li) detector irradated with 59.54 keV photon.

106
target and is known as self–absorption correction factor as discussed in section 3.3.1.
Following expression has been used for evaluating Li :
cos/)(
]cos/)(exp[1
t
t
Lip
Lip
Li
(4.6)
As 045 in present case, so expression (4.6) can be rewritten as
t
t
Lip
Lip
Li2)(
]2)(exp[1
(4.7)
where p and Li are absorption coefficients of target element at incident photon and
weighted average energy of emitted ith
group of iL X-ray. The self–absorption
correction factor Li for aforesaid target elements has been calculated using absorption
coefficients from WinXCom (Gerward et al., 2001) computer code.
4.2.2.3 Determination of geometrical efficiency related factor
2
aLi21
)(4π
NεωωSα
Value of factor 2
21
)4(
aLi NS in expression (4.5) which contains the terms
related to flux of 59.54 keV gamma-ray emitted from source, geometrical factor,
absolute efficiency of detector needed for the determination of L X-ray production
cross-section has been determined experimentally in a separate experiment. For this
purpose some low Z target elements with atomic number in the range 27≤Z≤42 having
same size as the experimental targets, have been so chosen that the K X-rays emitted
from them lie in the energy region of the L X-rays of the experimental targets. The
experimental targets were replaced by the low Z element targets and K X-rays emitted
from them were counted by the same detector in the same experiment setup. The counts

107
KiN for low Z targets, as measured by the detector under the photo peak is given:
KiKi
X
KiKi tM
NSN
2
21
)4( (4.8)
Various terms in this expression have the same meaning as in expression (4.4) but
correspond to K X-rays of low Z elements.
Expression (4.8) can be rewritten as:
X
KiKi
KiKi
t
MNNS
2
21
)4( (4.9)
The theoretical values of X
Ki needed in expression (4.9) has been calculated using
relation (3.27) by making use of the values of K-shell photo ionization cross-section p
k
tabulated by Scofield (1973), k the K shell fluorescence yield by Krause (1979), Fki
the fractional Ki X-ray emission rates by Scofield (1974a). The values of KiN were
determined by measuring the areas under the Ki X-ray peaks in the spectrum taken with
low Z targets. The energy of Ki X-ray emitted by the low Z targets ranges between 7
keV to 17 keV.
The value of the factor X
KK
K
t
MN
against the Ki X-ray energies (of these low Z
target elements) has been plotted. A third degree polynomial fit was obtained from the
plotted values. The value of this factor at energies of Li X-ray peak needed to determine
the Li (i=l,and subshell X-ray production cross-section of the elements under
study were then read from the plot. Fitted values of factor2
21
)4(
aLi NS generated from
the fitted polynomial against Li X-ray energies of experimental targets have been given
in Table 4.1.

108
Table 4.1: Values of factor 2
aLi21
)(4π
NεωαωS for W, Au, Hg and Pb targets at
Li(i= l, and ) X-ray energies.
S.No. Element Li X-ray group
Value of factor
2
aLi21
)(4π
NεωSα
1. W
L
2.04 ×10
7
L
2.22×10
7
L
2.33×10
7
2. Au
L
2.23×10
7
L
2.33×10
7
L
2.29×10
7
3. Hg
L
2.26×10
7
L
2.34×10
7
L
2.25×10
7
4. Pb
L
2.30×10
7
L
2.34×10
7
L
2.14×10
7

109
4.3 Measurement of LIII subshell photoionization cross-section (IIItLσ )
For this, first total atomic cross-section ( t ) of incident gamma-rays in
elements W, Au, Hg and Pb have been measured employing narrow beam transmission
geometry as shown in figure 3.8. Incident (Io) and transmitted beam intensity (I) for
each sample were measured for sufficiently large fixed preset time so that the statistical
uncertainty could be kept below 1%. Stability and reproducibility of the procedure has
been tested before and after each run. Total atomic cross-section ( t ) for these elements
under examination has been calculated from the relation
t
I
I
N
M o
a
t
ln
(4.10)
where ‘t’ is thickness of target element, M is atomic mass of target sample and Na is
Avogadro’s number.
From the experimentally measured total atomic interaction cross-sections t ,
contribution of scattering cross-section as well as K, L1 and LII shell/subshell photo
ionization cross-section has been subtracted to obtain the value ofIIItL .
Measured values of LIII subshell X-ray production cross-section x
LIII , total photo
ionization cross-section of LIII and higher subshellsIIItL along with theoretical values of
LIII subshell fluorescence yield 3 (Krause, 1979) has been then used in expression
(4.3) to obtain the value of LIII subshell absorption edge jump factor(IIILJ ).
4.4 Measurement of LIII subshell absorption edge jump ratio (III
Lr )
The presently measured values of LIII-subshell absorption edge jump factor
(IIILJ ) has been further used to deduced the values of corresponding jump ratios (
IIILr ) in
110
elements under study by using the relation
III
III
L
LJ
r
1
1 (4.11)
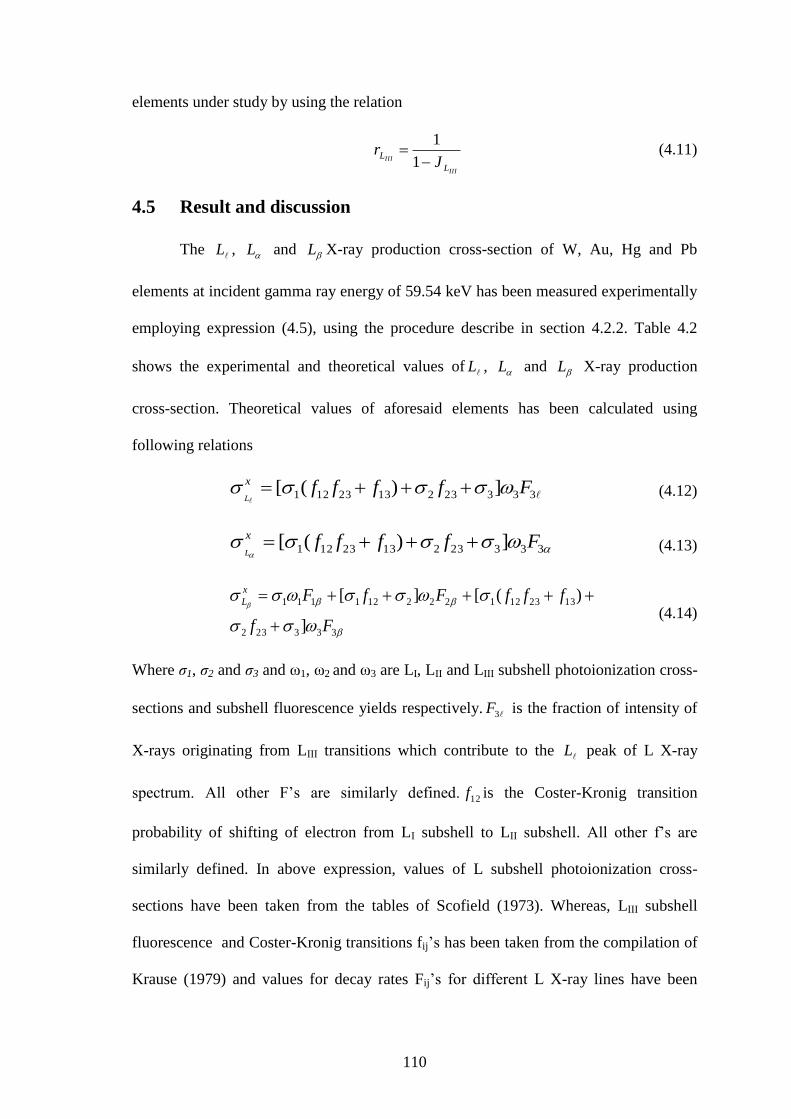
4.5 Result and discussion
The L , L and L X-ray production cross-section of W, Au, Hg and Pb
elements at incident gamma ray energy of 59.54 keV has been measured experimentally
employing expression (4.5), using the procedure describe in section 4.2.2. Table 4.2
shows the experimental and theoretical values of L , L and L X-ray production
cross-section. Theoretical values of aforesaid elements has been calculated using
following relations
3332321323121 ])([ Fffffx
L (4.12)
3332321323121 ])([ Fffffx
L (4.13)
333232
1323121222121111
]
)([][
Ff
fffFfFx
L
(4.14)
Where σ1, σ2 and σ3 and ω1, ω2 and ω3 are LI, LII and LIII subshell photoionization cross-
sections and subshell fluorescence yields respectively. 3F is the fraction of intensity of
X-rays originating from LIII transitions which contribute to the L peak of L X-ray
spectrum. All other F’s are similarly defined. 12f is the Coster-Kronig transition
probability of shifting of electron from LI subshell to LII subshell. All other f’s are
similarly defined. In above expression, values of L subshell photoionization cross-
sections have been taken from the tables of Scofield (1973). Whereas, LIII subshell
fluorescence and Coster-Kronig transitions fij’s has been taken from the compilation of
Krause (1979) and values for decay rates Fij’s for different L X-ray lines have been

111
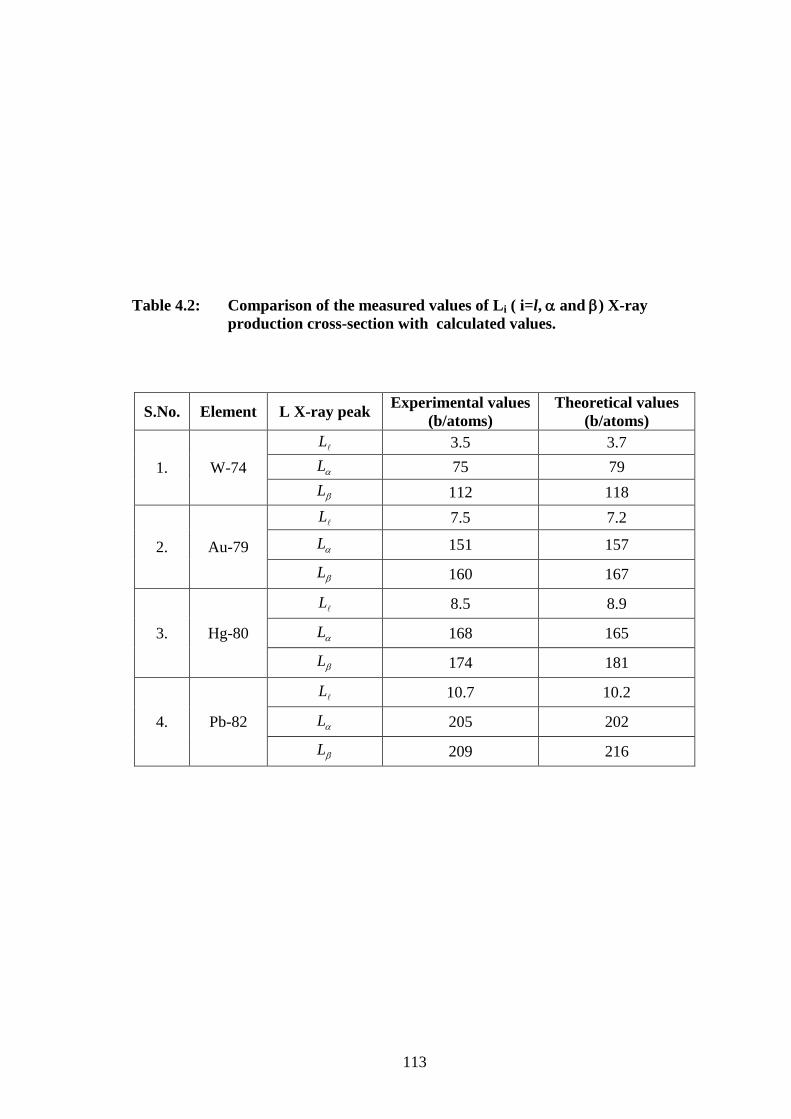
taken from the compilation of Scofield et al.(1974b). A comparison of the present
experimentally measured values of Li X-ray production cross-section with theoretical
values shows that values are in good agreement within experimental uncertainty.
From the measured values of x
L , x
L and
x
L ,the contribution of LI and LII
subshell cross-sections have been subtracted to obtain the values of x
LIII ,
x
LIII and
x
LIII
X-ray production cross-sections of LIII subshell only. Finally the values of
x
LIII has been obtained using following relation
x
LIII
x
LIII
x
LIII
x
LIII (4.15)
In second phase of experiment, total interaction cross-section ( t ) of aforesaid
target elements has been measured using expression 4.10 employing transmission
geometry in a different experimental setup as shown in figure 3.8. Results have been
shown both in tabular form (Table 4.3) and in graphical form (figure 4.3). A good
agreement has been achieved between experimental and theoretical values. Total photo
ionization cross-section IIItL of LIII and higher subshells has been obtained from the
measured values of total atomic cross-section ( t ) by subtracting the scattering
contribution and photoionization contribution of K, LI and LII shell/subshell.
Finally, the measured values of LIII subshell absorption edge jump factor
(IIILJ )and absorption edge jump ratio (
IIILr ) along with theoretical values calculated
using XCOM (Berger and Hubbell, 1987) and FFAST (Chantler et al., 2005) for
elements W, Au, Hg and Pb has been shown in Table 4.4 and 4.5 as well as in
graphical form as shown in figure 4.4 and 4.5 respectively. It has been observed from
these Tables and figures that the measured values of LIII subshell absorption edge jump

112
factor (IIILJ ) and absorption edge jump ratio (
IIILr ) are in good agreement with
calculated values within experimental uncertainties.
The overall estimated error associated with present measurement is of the order
of ~6%, which include uncertainty involved in evaluation of different parameters such
as such area under photo peak ( i.e statistical 1%), target thickness and self absorption
correction factor(~2-3%) and critical geometrical factor <5 % etc. Present results clearly
show that EDXRF technique used is an efficient and reliable for measuring LIII subshell
absorption edge jump ratio and jump factor.
113
Table 4.2: Comparison of the measured values of Li ( i=l, and ) X-ray
production cross-section with calculated values.
S.No. Element L X-ray peak Experimental values
(b/atoms)
Theoretical values
(b/atoms)
1. W-74
L 3.5 3.7
L 75 79
L 112 118
2. Au-79
L 7.5 7.2
L 151 157
L 160 167
3. Hg-80
L 8.5 8.9
L 168 165
L 174 181
4. Pb-82
L 10.7 10.2
L 205 202
L 209 216

114
Table 4.3: Comparison of the measured values of total atomic cross-
section ( t ) with calculated values.
a Obtained using standard transmission geometry.
b XCOM (Berger and Hubbell, 1987) values
S.No. Element Experimental values
(b/atoms) a
Theoretical values
(b/atoms) b
1. W-74 1162 1156
2. Au-79 1499 1511
3. Hg-80 1571 1590
4. Pb-82 1739 1761

115
Table 4.4: Comparison of the measured values of LIII subshell absorption edge
jump factors (IIILJ ) with calculated values.
a XCOM (Berger and Hubbell, 1987) values
bFFAST
Chantler et al.(2005) values
S.NO. Element
Absorption jump factor (IIILJ )
Experimental
Theoretical
1. W-74 0.604 0.605
a
0.622b
2. Au-79 0.600 0.594
a
0.603b
3. Hg-80 0.594 0.591
a
0.599b
4. Pb-82 0.584 0.586
a
0.594b

116
Table 4.5: Comparison of the measured values of LIII subshell absorption edge
jump ratios (IIILr ) with calculated values.
a XCOM (Berger and Hubbell, 1987) values
bFFAST
Chantler et al.(2005) values
S.No.
Element
Absorption jump ratio (IIILr )
Experimental
Theoretical
1. W-74 2.525 2.532
a
2.647b
2. Au-79 2.500 2.467
a
2.520b
3. Hg-80 2.463 2.448
a
2.502b
4. Pb-82 2.404 2.418
a
2.465b

117
74 78 80 821100
1200
1300
1400
1500
1600
1700
1800 Experimental values
XCOM( Berger and Hubbell
,1987)values
Tot
al a
tom
ic c
ross
-sec
tion
(t)
(b/a
tom
)
Atomic number (Z)
Fig. 4.3: Variation of total atomic cross-section (t as a function of atomic
number (Z).

118
74 78 80 825.2x10
-1
5.4x10⁻¹
5.6x10⁻¹
5.8x10⁻¹
6.0x10⁻¹
6.2x10⁻¹
6.4x10⁻¹
6.6x10⁻¹
6.8x10⁻¹
7.0x10⁻¹
Experimental values
XCOM(Hubbell and Seltzer,1987)
values
FFAST(Chantler et al.,2005) values
Jum
p fa
cto
r (J
LII
I) x1
0-1
Atomic Number (Z)
Fig. 4.4: Variation of LIII subshell jump factor (IIILJ ) as a function of atomic
number (Z).

119
74 78 80 822.2
2.3
2.4
2.5
2.6
2.7
2.8
Experimental values
XCOM(Berger and Hubbell,1987)
values
FFAST(Chantler et al.,2005) values
Ju
mp
ra
tio (
r LII
I)
Atomic number (Z)
Fig. 4.5: Variation of LIII subshell jump ratio (IIILr ) as a function of atomic
number (Z).