
CHAPTER 4 Interventions - WHO · Safety impact assessments of transport and land-use plans...
48
CHAPTER 4 Interventions
Transcript of CHAPTER 4 Interventions - WHO · Safety impact assessments of transport and land-use plans...

CHAPTER 4
Interventions


CHAPTER 4. INTERVENTIONS • 109
A road traffi c system designed for safe, sustainable useRoad traffi c deaths and serious injuries are to a great extent preventable, since the risk of incurring injury in a crash is largely predictable and many countermeasures, proven to be effective, exist. Road traffi c injury needs to be considered along-side heart disease, cancer and stroke as a prevent-able public health problem that responds well to targeted interventions (1). The provision of safe, sustainable and affordable means of travel is a key objective in the planning and design of road traffi c systems. To achieve it requires fi rm political will, and an integrated approach involving close collaboration of many sectors, in which the health sector plays a full and active role. In such a systems-based approach, it is possible at the same time to tackle other major problems associated with road traffi c, such as con-gestion, noise emission, air pollution and lack of physical exercise (2). Progress is being made in many parts of the world where multisectoral strategic plans are leading to incremental reductions in the number of road deaths and injuries (3, 4). Such strategies address the three prime elements of the traffi c sys-tem – vehicles, road users and the road infrastruc-ture. Vehicle and road engineering measures need to take into account the safety needs and physi-cal limitations of road users. Vehicle technology needs to consider roadside equipment. Measures involving the road infrastructure must be compat-ible with the characteristics of vehicles. Vehicle measures should be complemented by appropriate behaviour on the part of road users, such as wear-ing seat-belts. In all these strategies, managing speed is a fundamental factor. This chapter provides an overview of the wide range of interventions for road safety, examining what is known about their practicability, effectiveness, cost and acceptability to the public. Proven interventions in one setting, of course, may not easily be transfer-able elsewhere, but will instead require careful adap-tation and evaluation. Where effective interventions are altogether lacking, scientifi c research is needed to develop and test new measures.
Managing exposure to risk through transport and land-use policiesPerhaps the least used of all road safety intervention strategies are those that aim to reduce exposure to risk. Yet the underlying factors determining expo-sure to risk can have important effects (5). While further research is required to fully explore inter-vention strategies, it is known that exposure to road injury risk can be decreased by strategies that include:
— reducing the volume of motor vehicle traffi c by means of better land use;
— providing effi cient networks where the shortest or quickest routes coincide with the safest routes;
— encouraging people to switch from higher-risk to lower-risk modes of transport;
— placing restrictions on motor vehicle users, on vehicles, or on the road infrastructure.
The impact of strategies aimed at infl uencing mobility and access tends to be cumulative and mutually reinforcing, and such strategies can most effectively be implemented in combination. In high-income countries, it has been estimated that a comprehensive programme with a complementary set of cost-effective measures could reduce the total amount of car travel, per capita, by 20–40% (6). Many countries are now addressing these issues, mainly in the interests of sustainable mobility. Bogotá in Colombia, for instance, has attempted to reduce exposure to risk through measures that include a mass transit programme for vulnerable road users and restrictions on motor vehicle access to the city during certain times (7, 8).
Reducing motor vehicle traffi cEffi cient land useThe organization of land use affects the number of trips people make, by what means they choose to travel, the length of trips and the route taken (9). Different land use creates different sets of traffi c patterns (10). The main aspects of land use that infl uence road safety are (9):
— the spatial distribution of origins and desti-nations of road journeys;

110 • WORLD REPORT ON ROAD TRAFFIC INJURY PREVENTION
— urban population density and patterns of urban growth;
— the confi guration of the road network;— the size of residential areas;— alternatives to private motorized transport.
Land-use planning practices and “smart growth” land-use policies – development of high-density, compact buildings with easily acces-sible services and amenities – can serve to lessen the exposure risk of road users. The creation of clustered, mixed-use community services, for example, can cut the distances between commonly used destinations, curtailing the need to travel and reducing dependence on private motor vehicles (6).
Safety impact assessments of transport and land-use plansEvaluations of the impact on safety of transport projects usually focus on the individual project, with little consideration of the effect on the wider network (11). This can result in strategies for improving mobility, reducing congestion and improving the environment that are incompatible with road safety. The likely effects of planning decisions to do with transport or land use on the whole of the road network should therefore be considered at an early stage, to avoid unintended, adverse consequences for road safety (9, 10, 12). Area-wide safety impact assessments should be routinely conducted at the same time as other assessments of policies and projects related to transport and land use. Safety impact assessments are not yet carried out either routinely or system-atically in most places, though there has been expe-rience with them in the Netherlands, and to some extent elsewhere (13).
Providing shorter, safer routesIn an effi cient road network, exposure to crash risk can be minimized by ensuring that trips are short and routes direct, and that the quickest routes are also the safest routes. Route management tech-niques can achieve these objectives by decreasing travel times on desired routes, increasing travel times on undesired routes, and re-directing traf-
fi c (14). Having to take a detour in a car means that extra fuel will be used, but for pedestrians it means extra physical exertion. There is thus a strong incentive to fi nd the easiest and most direct route. Studies have, in fact, shown that pedestrians and cyclists place a higher value on journey time than do drivers or those using public transport – a fi nding that should be refl ected in planning deci-sions (15, 16). Safe crossing facilities for pedestrians and cyclists are likely not to be used if many steps need to be climbed, if long detours are involved, or if the crossings are poorly lit or underpasses badly maintained. A study in Brazil showed that many pedestrians who had been struck by vehicles had chosen to climb over central traffi c-lane barriers, rather than climb a fl ight of stairs to a footbridge (17). Interviews with pedestrian crash survivors in Mexico found that one of the main underlying risk factors was the presence of bridges that were poorly located or regarded as unsafe (18). In Uganda, the construction of an overpass for pedestrians on a major highway in Kampala had little effect either on pedestrian road behaviour or on the incidence of crashes and injuries because of its inappropriate location (19).
Trip reduction measuresIt has been estimated from studies in high-income countries that, under certain conditions, for each 1% reduction in motor vehicle distance travelled, there is a corresponding 1.4–1.8% reduction in the incidence of crashes (20, 21). Measures that may reduce the distance travelled include:
— making greater use of electronic means of communications as a substitute for deliver-ing communications by road;
— encouraging more people to work from home, using e-mail to communicate with their workplace;
— better management of commuter transport, and of transport to and from schools and colleges;
— better management of tourist transport;— bans on freight transport;— restrictions on vehicle parking and road use.

CHAPTER 4. INTERVENTIONS • 111
Encouraging use of safer modes of travelWhether measured by the time spent travelling or by the number of trips, travel by bus and train is many times safer than any other mode of road travel. Policies that stimulate the use of public trans-port, and its combination with walking and cycling, are thus to be encouraged. While the walking and cycling parts of journeys bear relatively high risks, pedestrians and cyclists create less risk for other road users than do motor vehicles (6). However, by implementing known safety measures, it should be possible to achieve a growth in healthier forms of travel, such as walking and cycling, and at the same time reduce the incidence of deaths and injuries among pedestrians and cyclists. These are goals that are increasingly being adopted in national transport policies in high-income countries (15). Strategies that may increase the use of public transport include (6):
— improved mass transit systems (including improvements to routes covered and ticket-ing procedures, shorter distances between stops, and greater comfort and safety of both the vehicle and the waiting areas);
— better coordination between different modes of travel (including the coordination of sched-ules and the harmonization of tariff schemes);
— secure shelters for bicycles;— allowing bicycles to be carried on board
trains, ferries and buses;— “park and ride” facilities, where users can
park their cars near public transport stops;— improvements to taxi services;— higher fuel taxes and other pricing reforms
that discourage private car use in favour of public transport.
Financial incentives have proved successful in some highly-motorized countries; for example, in the Netherlands, a free public transport pass for students has resulted in lower car use (22). In many low-income countries, however, public transport services often operate without regulation and create unacceptable levels of risk, both for their occupants and for those outside the vehicle. These risks arise from overloaded vehicles, long working hours of drivers, speeding and other dangerous behaviour. All
the same, an improved public transport system with proper regulation and enforcement, combined with non-motorized transportation – cycling and walking – can play an important part in low-income and mid-dle-income countries as a response to the growing demand for transport and accessibility. Despite the generally lower injury risks asso-ciated with public transport, more research on the effectiveness of public transport strategies in reducing the incidence of road traffi c injuries still needs to be carried out.
Minimizing exposure to high-risk scenariosRestricting access to different parts of the road networkPreventing pedestrians and cyclists from accessing motorways and preventing motor vehicles from entering pedestrian zones are two well-established measures for minimizing contact between high-speed traffi c and unprotected road users. Because vehicles are physically prevented from entering them, pedestrian zones are safer for travel on foot and also – where there is shared use – for bicycle travel. Motorways have the lowest crash rates, in terms of distance travelled, of the whole road network, by vir-tue of their sole use by motor vehicles, and their use of clear separation of traffi c and segregated junctions.
Giving priority in the road network to higher occupancy vehiclesGiving vehicles with many occupants priority in traffi c over those with few occupants is a means of reducing the overall distance travelled by private motorized transport – and hence of cutting down on exposure to risk. This strategy is adopted by many cities worldwide. For example, the high-capacity bus system in the city of Curitibá, Brazil, provides segregated bus lanes, priority at traffi c lights for buses, as well as safe and fast access for users (23).
Restrictions on speed and engine performance of motorized two-wheelersMany high-income countries have introduced regulations relating to speed and engine perform-ance for mopeds and motorcycles, with the aim of reducing rates of crashes and injury (24).
112 • WORLD REPORT ON ROAD TRAFFIC INJURY PREVENTION
Restricting the engine capacity for beginner motorcyclists has proved to be a successful interven-tion. In the United Kingdom in the early 1980s, for instance, the maximum engine size of a motorcycle that learners could ride was reduced from 250 cc to 125 cc; this was accompanied by a limitation on the maximum power output (to 9 kW). As a result, many inexperienced motorcyclists transferred to less powerful vehicles, leading to an estimated 25% reduction in casualties among young motorcyclists (25). A later study found a signifi cantly greater crash risk associated with larger motorcycles, despite the fact that these machines were ridden mostly by more experienced riders (25). Japan is one country that imposes limits, for safety reasons, on the engine size and perform-ance of large motorcycles used domestically, though similar controls do not apply to exports of new motorcycles from Japan to other countries (26). In the case of these exported motorcycles, outputs of 75–90 brake horse power (56–67 kW) – or even 130 brake horse power (97 kW) – are quite common now, with top speeds reaching almost 200 miles/h (322 km/h) (27).
Increasing the legal age for use of motorized two-wheelersIn Malaysia, out of a number of proposed measures to reduce motorcycle crashes, increasing the legal riding age from 16 to 18 years was found to have the greatest cost–benefi t. Preventing young riders from riding at night was also considered. Although this measure also produced a positive net benefi t, the magnitude of the saving was small, since most crashes occurred during daytime (28).
Graduated driver licensing systemsThe high risks faced by young drivers and motorized two-wheeler riders in their fi rst months of driving have already been discussed (see Chapter 3). For young car drivers, the two principal risks are night-time driving and transporting young passengers (29). In response, graduated driver licensing systems were fi rst introduced in New Zealand in 1987, and are now widely implemented in Canada, the United States and some other places. These schemes provide gradual access to a full driving licence for novice drivers and riders (30) (see Box 4.1).
BOX 4.1
Graduated driver licensing systemsBeginner drivers of all ages lack both driving skills and experience in recognizing potential dangers. For newly-licensed
teenage drivers, their immaturity and limited driving experience result in disproportionately high rates of crashes.
Graduated driver licensing systems address the high risks faced by new drivers by requiring an apprenticeship of planned
and supervised practice – the learner’s permit stage. This is then followed by a provisional licence that places temporary
restrictions on unsupervised driving (31). Commonly imposed restrictions include limits on night-time driving, limits on
the number of passengers, and a prohibition against driving after drinking any alcohol. These restrictions are lifted as
new drivers gain experience and teenage drivers mature, gaining a full licence (32). Although the specifi c requirements
for advancing through these three stages – the learner’s permit, the provisional licence and the full licence – vary
according to country, they provide a protective environment while new drivers become more experienced (33).
Graduated driver licensing schemes have consistently proved effective in reducing crash risks for new drivers.
Peer-reviewed evaluations of the effectiveness of such schemes in Canada, New Zealand and the United States have
reported reductions in crashes involving new drivers in the range of 9–43% (34–36). Why such reductions should exist
has not yet been defi nitively established. It is generally accepted, though, that the safety benefi ts of schemes result
both from decreases in the amount of driving by inexperienced drivers and from improvements in their driving skills
under conditions of low risk.
The elevated risk of a crash for beginner drivers is universal, and graduated driver licensing can effectively reduce
this risk. It can apply to all newly-licensed drivers, not just those who are young. Research has clearly demonstrated
that older beginner drivers experience higher crash rates than drivers of the same age with several years of
experience. For this reason, Canada, where many new drivers are not young, applies graduated driver licensing to
all beginners, regardless of their age. Even countries where the legal age for driving is higher than the average can
benefi t from the introduction of graduated driver licensing.

CHAPTER 4. INTERVENTIONS • 113
The reduction in the incidence of crashes resulting from the introduction of these systems varies from 4% to over 60%. This large range may in part be explained by methodological differences, differences in the restrictions used and the degree to which they are enforced (35). The major reductions would seem to arise from more supervised driving and from a high degree of compliance with restrictions (37). It is not as yet clear, though, which of the many restric-tions – including limits on the number of passengers carried, use of seat-belts, lower blood alcohol concen-tration (BAC) limits and night-time driving bans – is the most cost-effective (35). Graduated driver licens-ing schemes have generally been well accepted (29). The New Zealand scheme is made up of three stages, and all new drivers aged 15–24 years have to take part. The fi rst stage is a six-month super-vised learner driver permit, which is obtained by passing a written test, an oral theory test and an eyesight test. The restricted licence stage lasts for 18 months and is completed by passing a practical driving test. There are bans during both the fi rst two stages on night-time driving (from 22:00 to 05:00) and on carrying passengers under the age of 20 years (unless the driving is supervised), as well as a BAC limit of 0.03 g/dl. Violations of these con-ditions can result in the licence restrictions being extended by a further six months. An evaluation of the scheme found that it had led to an 8% reduc-tion in crashes involving serious injury, and that the restrictions, particularly the night-time driving ban, had made a signifi cant contribution (36). Another version of a graduated licensing sys-tem, introduced in Austria in 1993, resulted in the incidence of crashes being reduced by more than a third (22). There was a probation period of two years for novice drivers and a BAC limit of 0.01 g/dl. If, during this period, there were any offences involving excess alcohol or driving that led to injury or death, a two-year extended proba-tion was imposed, as well as obligatory attendance at a driver improvement programme.
Shaping the road network for road injury preventionRoad safety considerations are central to the planning,
design and operation of the road network. By adjusting the design of the road and road networks to accommodate human characteristics and to be more “forgiving” if an error is made, road safety engineering strategies can make a major contribu-tion to road injury prevention and mitigation (10).
Safety-awareness in planning road networksThe framework for the systemic management of road safety in high-income countries is increasingly defi ned by the following activities (10, 38–40):
— classifying the road network according to their primary road functions;
— setting appropriate speed limits according to those road functions;
— improving road layout and design to encour-age better use.
These approaches can, in principle, be adapted to the contexts of middle-income and low-income countries. Within these general principles, safety engineering and traffi c management should aim:
— to prevent road use that does not match the functions for which the road was designed;
— to manage the traffi c mix by separating dif-ferent kinds of road users, so as to eliminate confl icting movements of road users, except at low speeds;
— to prevent uncertainty among road users about appropriate road use.
A large body of knowledge exists to support the use of a safety-awareness approach to road planning and is available in the form of design standards and best practice guidelines and manuals. Examples include the requirements for the development of “sustainable safety” in road networks in the Nether-lands (41) and an earlier set of guidelines for achiev-ing safer roads in developing countries (10).
Classifying roads and setting speed limits by their functionMany roads have a range of functions, and are used by different types of vehicles and by pedestrians – with large differences in speed, mass of vehi-cle and degree of protection. In residential areas and on urban roads this often leads to confl icts

114 • WORLD REPORT ON ROAD TRAFFIC INJURY PREVENTION
BOX 4.2
Road types and appropriate speedsThe Dutch policy of sustainable safety divides roads into one of three types according to their function, and then sets
speed limits accordingly (41):
• Flow roads (or through-roads). For such roads, through-traffi c goes from the place of departure to the destination
without interruption. Speeds above 100–120 km/h are not permitted, and there is a complete separation of traffi c
streams.
• Distributor roads. These roads enable users to enter or leave an area. The needs of moving traffi c continue to be
predominant. Local distributor roads carry traffi c to and from large urban districts, villages and rural areas, and
have traffi c interchanges at limited sections. These roads give equal importance to motorized and non-motorized
local traffi c, but separate users wherever possible. Speeds on distributor roads should not exceed 50 km/h within
built-up areas or 80 km/h outside such areas. There should be separate paths for pedestrians and cyclists, dual
carriageways with separation of streams along the full length, speed controls at major crossings, and right of way.
• Residential access roads. These roads are typically used to reach a dwelling, shop or business. The needs of non-
motorized users are predominant. There is a constant access and interchange of traffi c and the vast majority of
roads are of this type. For residential access roads in towns and villages, speeds above 30 km/h are not permitted. In
rural areas, no speeds over 40 km/h are allowed at crossings and entries – otherwise 60 km/h may be acceptable.
Where a road performs a mixture of functions, the appropriate speed is normally the lowest of the speeds
appropriate to the individual functions.
between the mobility of motor vehicle users on the one hand and the safety of pedestrians and cyclists on the other. Most pedestrian crashes occur within one mile (1.6 km) of the victim’s home or place of business (15, 42). Classifying roads functionally – in the form of a “road hierarchy”, as it is known in highway engineering – is important for providing safer routes and safer designs. Such a classifi cation takes account of land use, location of crash sites, vehicle and pedestrian fl ows, and objectives such as speed control. The Dutch “sustainable safety” policy sets dif-ferent speed limits according to the road function (see Box 4.2), together with a range of operational requirements (41). A study found that, by adopt-ing these principles, a reduction of more than one third in the average number of injury crashes per million vehicle-kilometres – driven on all types of roads in the Netherlands – could be achieved (43). Research is needed so that these principles can be adopted more widely, and particularly to work out how to adapt and apply them in the specifi c contexts of low-income countries.
Incorporating safety features into road designA key objective of safety engineering is to make driv-ers naturally choose to comply with the speed limit. Through the use of self-explanatory road layouts, engineering can lead to safer road user behaviour, as well as correcting defects in road design that other-wise may lead to crashes. The following description of different types of roads illustrates the relationship between road function, road speed and road design.
Higher-speed roadsHigher-speed roads include motorways, expressways and multi-lane, divided highways with limited access. They are designed to allow for higher speeds by pro-viding large-radius horizontal and vertical curves, “forgiving” roadsides, entry and exit “grade-sepa-rated” junctions – where there is no contact between motorized and non-motorized traffi c – and median barriers to separate opposing directions of traffi c. Such roads have the lowest rates of road injury in terms of distance travelled because of these design features and the fact that non-motorized users are prohibited (39). In low-income countries, it is also necessary to separate motorized two-wheelers from car and truck traffi c travelling in the same direction.

CHAPTER 4. INTERVENTIONS • 115
Single-lane carriagewaysSingle-lane carriageways in rural areas include many different types of road. The numbers and rates of casu-alties are much higher than on motorways, because of the large differences in speed between the various types of user. Crashes on local rural roads arise most commonly from vehicles leaving the road through loss of control as a result of inappropriate speed (44). Apart from speed limits, a range of engineering measures is needed to encourage appropriate speed and make haz-ards easily perceptible. These measures include:
— provision for slow-moving traffi c and for vulnerable road users;
— lanes for overtaking, as well as lanes for vehicles waiting to turn across the path of oncoming traffi c;
— median barriers to prevent overtaking and to eliminate head-on crashes;
— better highlighting of hazards through road lighting at junctions and roundabouts;
— improved vertical alignment;— advisory speed limits at sharp bends;— regular speed-limit signs;
— rumble strips;— the systematic removal of roadside hazards – such
as trees, utility poles and other solid objects. Much best practice in this area has been identi-fi ed in high-income countries (45). A particular speed management problem is how to handle the transition from high-speed roads to lower-speed roads – for instance, when a vehicle leaves a motorway, or when it enters a winding stretch of narrow road after a long, straight stretch of road. The creation of transition zones on busy roads approaching towns and villages can reduce crashes and injuries for all types of road user. Design features that use a “gateway”, or threshold, can infl uence drivers progressively to reduce their speed, and signal the beginning of the speed limit for commercial and residential areas. In approaches to slower-speed zones, rumble strips, speed humps, visual warnings in the pavement, and roundabouts have all been found useful in slowing the speed of vehicles (45). In Ghana, the introduction of rumble strips reduced crashes by some 35% and deaths by 55% in certain locations (46) (see Box 4.3).
BOX 4.3
Speed bumps in Ghana: a low-cost road safety interventionRoad safety is a serious problem in Ghana, where fatality rates are some 30 to 40 times greater than those in
industrialized countries. The excessive vehicle speeds that prevail on the country’s inter-urban highways and on roads
in built-up areas have been shown to be a key contributory factor in serious traffi c crashes (46).
In recent years, speed bumps have been installed at some crash-prone locations on the highways, so as to lower the
speed of vehicles and improve the traffi c environment for other road users, including pedestrians and cyclists, in built-
up areas. These speed bumps produce discomfort when vehicles pass over them at higher speeds; with their vehicles
lifted off the ground and with the resulting noise, drivers are forced to reduce their speed. This in turn decreases the
kinetic energy of the vehicle that can cause injuries and deaths on impact, and gives drivers longer warning of possible
collisions, lessening the likelihood of road crashes.
The use of speed bumps, in the form of rumble strips and speed humps, has been found to be effective on Ghanaian
roads. For instance, rumble strips on the main Accra–Kumasi highway at the crash hot spot of Suhum Junction reduced
the number of traffi c crashes by around 35%. Fatalities fell by some 55% and serious injuries by 76%, between January
2000 and April 2001. This speed-reducing measure succeeded in reducing or even eliminating certain kinds of crashes
as well as improving the safety of pedestrians (46).
Speed control bumps and humps have now become increasingly common on Ghanaian roads, particularly in built-
up areas where excessive vehicle speeds threaten other road users. A wide range of materials – including vulcanized
rubber, hot thermoplastic materials, bituminous mixes, concrete and bricks – have been used in the construction of the
speed control areas.
Rumble strips are cheap and easy to install. They have been constructed at potentially dangerous places on the
Cape Coast–Takoradi highway, the Bunso–Koforidua highway and the Tema–Akosombo highway. Speed humps, on
the other hand, have been laid to slow down vehicles and improve the safety of pedestrians in the towns of Ejisu and
Besease on the Accra–Kumasi highway.

116 • WORLD REPORT ON ROAD TRAFFIC INJURY PREVENTION
Residential access roadsResidential access roads are often designed to achieve very low speeds. Speed limits, usually supported by physical self-enforcing measures to encourage compliance, are normally around 30 km/h, though lower limits are often prescribed.
Area-wide urban safety managementEngineering measures applied on an area-wide basis in towns and cities create safer conditions for pedestrians and cyclists, as well as avoiding the displacement of traffi c which could lead to crashes elsewhere. Research is urgently needed in develop-ing countries into area-wide urban safety manage-ment relating to motorized two-wheelers. The principal road safety engineering tech-niques for improving the safety of pedestrians and cyclists are the provision of safer routes – through segregation and separation – and area-wide speed reduction or traffi c-calming measures (22, 23). These are discussed below.
Safer routes for pedestrians and cyclists. The creation of networks of connected and convenient pedestrian and cyclist routes, together with the provision of public transport, can lead to greater safety for vulnerable road users (47). The routes will typically consist of footpaths or cycle paths separate from any carriageway, pedestrian-only areas with or without cyclists being admitted, footpaths or cycle tracks alongside carriageways, and carriageways or other surfaces shared with motor vehicles. Where pedestrian or cycle routes cross signifi cant fl ows of motor vehicle traffi c, the location and design of the crossing point needs special attention. Where routes are not separated from carriageways, or where space is shared with motor vehicles, the physical layout will need to manage speeds (15). Pedestrian footpaths and pavements are used more in high-income than in low-income coun-tries and tend to be in urban rather than rural areas. The risk of a crash on roads without pave-ments separating pedestrians from motorized traffi c is twice that on a road with a pavement (48). Pavements in poor condition or obstructed
by parked vehicles may force pedestrians to walk on the street, thus signifi cantly increasing crash risk. This danger is particularly great for people carrying heavy loads, pushing prams, or who have diffi culty in walking. Studies in low-income and middle-income countries have shown that even where pavements exist, they are often blocked – for instance, by street vendors’ stalls (18, 49). Providing pavements for pedestrians is a proven safety measure, which also helps the fl ow of motorized traffi c. Bicycle paths have also been shown to be effective in reducing crashes, particu-larly at junctions (22). Danish studies have found reductions of 35% in cyclist casualties on particular routes, following the construction of cycle tracks or lanes alongside urban roads (50).
Traffi c-calming measures. At speeds below 30 km/h pedestrians can coexist with motor vehi-cles in relative safety. Speed management and traf-fi c-calming include techniques such as discouraging traffi c from entering certain areas and installing physical speed-reducing measures, such as rounda-bouts, road narrowings, chicanes and road humps. These measures are often backed up by speed limits of 30 km/h, but they can be designed to achieve various levels of appropriate speed. In Europe, there has been much experimenta-tion with these measures and crash reductions of between 15% and 80% have been achieved (44, 51–54). In the town of Baden, Austria, about 75% of the road network is now part of a 30 km/h zone, or else a residential street with an even lower speed limit. Since integrated transport and a wide-ranging safety plan were introduced in 1988, the town has seen a 60% reduction in road casualties (55). Most of the principles incorporated into design guidelines for traffi c calming in high-income countries also apply to low-income countries, though in practice the guidelines will need to be modifi ed because of the much higher proportion of non-motorized traffi c (23). As Table 4.1, which summarizes the effects of measures undertaken in a British town, shows, area-wide speed and traffi c

CHAPTER 4. INTERVENTIONS • 117
management can be highly effective, particularly in residential areas, where benefi ts have been found to exceed costs by a factor of 9.7 (56). A systematic review of 16 controlled studies from high-income countries also showed that area-wide traffi c calming in urban areas could reduce road traffi c injuries. No similar studies from low-income or middle-income countries were found (57).
Safety auditsWhen new transport projects are proposed, area-wide safety impact assessments are needed to ensure the proposals do not have an adverse safety impact on the surrounding network. Road safety audits are then required to check that the pro-posed design and implementation are consistent with safety principles, and to examine whether further design changes are needed to prevent crashes (12). The safety audit procedure is usually carried out at various stages of a new project, including:
— the feasibility study of the project;— the draft design;— the detailed design;— before the project becomes operational;— a few months after the project is operational.
An essential element of the audit process is that it should be carried out separately by both an independent design team, and a team with experi-ence and expertise in road safety engineering and
crash investigation. Guidelines for safety audits have been devel-oped in many parts of the world, including Malaysia (58–60). Formal safety audit procedures have been shown to be effec-tive and cost-effective ways of improving road safety and reducing the long-term costs associated with a new road scheme (39). Mandatory safety audit procedures have existed in a number of countries including Australia, Denmark, New Zea-land and the United Kingdom
for several years (61). In New Zealand, it has been estimated that the procedures carry a cost–benefi t ratio of 1:20 (62). A Danish study assessed the value in cost–benefi t terms of 13 schemes and found fi rst year rates of return of well over 100% (63).
Crash-protective roadsidesCollisions between vehicles leaving the road and roadside objects including trees, poles and road signs, often of very high mass, are a major road safety problem worldwide. Research that built on work by the Organisation for Economic Co-opera-tion and Development in 1975 (64) suggests that existing strategies to tackle the problem of roadside objects would be strengthened by (65):
— designing roads without dangerous roadside objects;
— introducing a clear zone at the side of the road;
— designing roadside objects so that they are more “forgiving”;
— protecting roadside objects with barriers to absorb part of the impact energy;
— protecting vehicle occupants from the consequences of collisions with roadside objects, through better vehicle design.
Collapsible lighting columns and other devices that break away on impact were fi rst introduced in the United States in the 1970s and are now used widely throughout the world. These objects are
TABLE 4.1
Area-wide speed reduction – cost and benefi ts
Town centre Residential area
Number of road traffi c injuries prevented/year 53 145
Saving-crash costs (£, 25 years, 5%a) 33 350 000 91 260 000
Increased costs-travel time (£, 25 years, 5% a) 21 900 53 250 000
Loss of consumers’ surplus of travel b (£) 2 415 000 9 300 000
Total benefi ts (£) 9 035 000 28 710 000
Costs of implementing measures (£) 4 910 000 2 955 000
Cost–benefi t 1:1.84 1:9.72a 5% annual discount rate for discounting benefi ts to present values.b Loss of benefi ts to consumers.
Source: reproduced from reference 56, with minor editorial amendments, with the permission of the publisher.
118 • WORLD REPORT ON ROAD TRAFFIC INJURY PREVENTION
either mounted on shear bolts, or else are con-structed of a deformable, yielding material. Slip-base poles break away at the base when struck by a vehicle and include special provisions to ensure electrical safety. Early research conducted in the United States indicated that break-away columns could result in reductions in injuries of around 30% (66). Safety barriers are frequently used to separate traffi c or to prevent it from leaving the road. They are designed to defl ect or contain the striking vehi-cle while ensuring that the forces involved do not result in serious injury to occupants of the vehicle. If properly installed and in the appropriate places, safety barriers can be effective in reducing the incidence of crashes, their severity and their con-sequences (67). Crash research has highlighted the need for more effective linkages between vehicle protection standards and standards for safety bar-riers, which take into account the range of vehicles – from small cars to heavy trucks – that are likely to make use of them. Guard fences and rails are situated at the edge of the carriageway to defl ect or contain vehicles, or in the central reserve where their aim is to reduce crashes involving vehicles crossing into approach-ing traffi c. The fences and rails can be rigid (made of concrete), semi-rigid (made from steel beams or box beams) or fl exible (made from cable or wire). Cable barriers have been used cost-effec-tively in Denmark, Sweden, Switzerland and the United Kingdom (65). Central cable rails are being installed to an increasing degree in Sweden to pre-vent dangerous overtaking on single-carriageway roads. On two-lane roads with grade-separated crossings, the use of central cable rails has pro-duced estimated reductions of 45–50% in fatal and serious casualties (68).
Crash cushionsCrash cushions are very effective in reducing the consequences of a crash by cushioning the vehi-cle before it strikes rigid roadside hazards, such as bridge piers, barrier terminals, light posts and sign supports. Evaluations in the United States of crash cushion installations have found a reduc-
tion in fatal and serious injuries at crash sites of up to 75% (66). In Birmingham, England, install-ing crash cushions resulted in a 40% reduction in injury crashes, and a reduction (from 67% to 14%) in the number of fatal and serious crashes at the treated sites (69).
Remedial action at high-risk crash sitesThe systematic implementation of low-cost road and traffi c engineering measures is a highly cost-effective method of creating safer patterns of road use and correcting faults in the planning and design of the roads that have led to traffi c crashes. The use of road safety audits and safety impact assessments can prevent such faults from being introduced into new or modifi ed roads (12). Low-cost road and traffi c engineering measures consist of physical measures taken specifi cally to enhance the safety of the road system. Ideally, they are cheap, can be implemented quickly, and are highly cost-effective (see Table 4.2). Examples include:
— physical changes to roads to make them safer (e.g. the introduction of skid-resistant sur-facing);
— the installation of central refuges and islands;
— improved lighting, signs and markings;— changes in the operation of junctions, for
example, by installing small roundabouts, changing the signal control or improving signs and markings.
Such measures can be applied at:— high-risk sites, for instance, a particular
bend or junction;— along a section of route where the risk is
greater than average, though the measures are not necessarily concentrated at specifi c sites;
— over a whole neighbourhood. Experience has shown that for high benefi ts to be achieved relative to costs, a systematic and multidisciplinary approach to identify sites, to implement low-cost road and traffi c engineering measures, and to evaluate outcomes is required, as well as an effi cient organizational framework (71).

CHAPTER 4. INTERVENTIONS • 119
Providing visible, crash-protective, “smart” vehiclesImproving the visibility of vehiclesDaytime running lights for cars
The term, “daytime running lights” refers to the use of lights (whether multipurpose or specially designed) on the front of a vehicle while it is run-ning during daylight hours, so as to increase its vis-ibility. Some countries – including Austria, Canada, Hungary, the Nordic countries and some states in the United States – now require by law varying levels of use of daytime running lights (16). This may involve either drivers switching on their headlamps or the fi tting of switches or special lamps on vehicles. Two meta-analyses of the effects of daytime running lights on cars show that the measure con-tributes substantially to reducing road crashes. The fi rst study, which examined daytime crashes involv-ing more than one party, found a reduction in the number of crashes of around 13% with the use of daytime lights, and reduction of between 8% and 15% as a result of introducing mandatory laws on daytime use (16). The number of pedestrians and cyclists hit by cars was reduced by 15% and 10%, respectively. The second study found a reduction of slightly over 12% in daytime crashes involving more than one party, a 20% decrease in injured victims and a 25% reduction in deaths in such crashes (72). A study of data over four years from nine American
states concluded that, on average, cars fi tted with automatic daytime running lights were involved in 3.2% fewer multiple crashes than vehicles without (73). Following the introduction of daytime running lights and the enforcement of their use in Hungary, there has been a 13% reduction in the number of frontal crashes in daylight (74). A cost–benefi t analysis of providing automatic light switches on cars for daytime running lamps using standard low-beam headlights found that the benefi ts outweighed the costs by a factor of 4.4. The fi tting of daytime running lights with special lamps with economical bulbs increased the cost–benefi t to a factor of 6.4 (75). Motorized two-wheeler users have expressed concerns that daytime running lights on cars could reduce the visibility of motor-cyclists. While there is no empirical evidence to indicate this is the case, researchers have suggested that if such an effect did exist, it would be offset by the benefi t to motorcyclists of increased car visibil-ity (22, 72). In the two meta-analyses cited above, use of car daytime running lamps led to a reduction in pedestrian and cyclist crashes (16, 72).
High-mounted stop lamps in carsHigh-mounted stop lamps on cars have also been adopted as standard equipment in many countries. They have led to a reduction of between 15% and 50% in rear crashes and cost–benefi t ratios of 1:4.1 in Norway and 1:8.9 in the United States (16).
TABLE 4.2
Some examples of low-cost road safety measures in Norway
Road safety measure Mean cost (Norway Kroner)
Mean annual average daily traffi ca
Cost–benefi t ratio
Pedestrian bridge or underpass 5 990 000 8 765 1:2.5
Converting 3-leg junction to roundabout 5 790 000 9 094 1:1.6
Converting 4-leg junction to roundabout 4 160 000 10 432 1:2.2
Removal of roadside obstacles 310 000 20 133 1:19.3
Minor improvements (miscellaneous) 5 640 000 3 269 1:1.5
Guard rail along roadside 860 000 10 947 1:10.4
Median guard rail 1 880 000 42 753 1:10.3
Signing of hazardous curves 60 000 1 169 1:3.5
Road lighting 650 000 8 179 1:10.7
Upgrading marked pedestrian crossings 390 000 10 484 1:14.0
a The sum of all motor vehicles passing a point on the road in a single year, divided by 365; this value excludes pedestrians and cyclists.
Source: reproduced from reference 70, with minor editorial amendments, with the permission of the author.
120 • WORLD REPORT ON ROAD TRAFFIC INJURY PREVENTION
Daytime running lights for motorized two-wheelersThe use of daytime running lights by motorized two-wheelers has been shown to reduce visibility-related crashes in several countries by between 10% and 15%. In a study of 14 states in the United States with motorcycle headlight-use laws, a 13% reduc-tion in fatal daytime crashes was observed (76). In Singapore, a study conducted 14 months after the introduction of legislation requiring motorcyclists to switch on their headlamps found that fatal day-time crashes had reduced by 15% (77). In Malaysia, where legislation requiring daytime use was pre-ceded by a two-month information campaign, the number of visibility-related crashes fell by 29% (78). In Europe, motorcyclists who use daytime running lights have a crash rate that is about 10% lower than that of motorcyclists who do not (22). One estimate of the cost–benefi t ratio of using running lights in daytime is put at around 1:5.4 for mopeds and 1:7.2 for motorcycles (16).
Improving the visibility of non-motorized vehiclesThe main intervention for pedestrians to protect themselves is to wear clothing that increases their visibility, especially in poor daylight and in dark-ness. For cyclists, front, rear and wheel refl ectors, and bicycle lamps that are visible at specifi ed dis-tances, are often required in high-income coun-tries. The quality and use of lights can be improved by enabling the storage of separate light systems or by designing the lighting into the cycle frame (15). Safety researchers in low-income countries have suggested various means for improving the visibility of vulnerable road users. The use of retro-refl ective vests, common in high-income countries, may be problematic owing to their cost and the discomfort in wearing them in hot climates. A design for a brightly-coloured orange or yellow shopping bag that can quickly be transformed into a conspicuous vest has been proposed for two-wheeler users in low-income countries (79). Encouraging the use of colours such as orange and yellow for bicycles, for wheels, and for the rear ends of rickshaws and other non-motorized vehicles, has also been suggested (23).
Many countries require the fi tting of refl ectors on the front and rear of non-motorized vehicles. In low-income countries, though, rules could be extended to cover all animal carts, cycle trishaws and other forms of local transport that currently create road safety risks because of their poor vis-ibility at night. The use of refl ectors on the sides of vehicles may be helpful at junctions (23). However, while all these aids to visibility would appear to have great potential, their actual effectiveness in increasing the safety of pedestrians and cyclists remains largely unknown and requires additional study (80).
Crash-protective vehicle designWhile market forces can help advance in-car safety in individual car models, the aim of harmonizing legislative standards of vehicle design is to ensure a uniform and acceptable level of safety across a whole product line. Legislative standards are produced by differ-ent authorities, from the national to international level. On a global scale, these include the United Nations Economic Commission for Europe, and on a regional level, groupings such as the Euro-pean Union. Standardization at the regional and national levels, taking into account as it does local conditions, can often produce faster action than a similar process at the international level. High-income countries routinely set out their national priorities in reports to the International Technical Conferences on the Enhanced Safety of Vehicles. Priorities in some low-income and middle-income countries have also been identifi ed (23, 81–83). A study in the United Kingdom concluded that improved vehicle crash protection (also known as “secondary safety” or “passive safety”) for car occupants and pedestrians would have the greatest effect, out of all new policies under consideration, in reducing road casualties in Great Britain (see Table 4.3) (84). Comparable analyses in New Zealand esti-mated that improvements being made in the safety of the vehicle fl eet would reduce projected social costs in 2010 by just under 16% (85).

CHAPTER 4. INTERVENTIONS • 121
The concept of “crashworthiness” in vehicle design is now well understood and is incorporated into cur-rent car design in highly-motorized countries. If it were adopted globally, it would contribute substan-tially to increased road safety (82) (see Box 4.4).
Safer car fronts to protect pedestrians and cyclistsThe majority of fatally-injured pedestrians are hit by
the fronts of cars. Creating safer car fronts is thus a key means of improving pedestrian safety (26, 88, 89). Crash engineers have known for some time how crash-protection techniques can be used to reduce deaths and serious injuries to pedestrians struck by the fronts of cars (90–93). Since the late 1970s, studies have been conducted on how the shape, stiffness and speed of passenger cars infl uence the
TABLE 4.3
Estimated serious and fatal road casualty reduction effects of new policies, averaged over all types of roads, for different road users, United Kingdom (expressed a percentage reduction in the number of road casualties)
Policy Caroccupants
Pedestrians Cyclists Motorcyclists Others Allusers
New road safety engineering programme 6.0 13.7 4.3 6.0 6.0 7.7
Improved vehicle crash protection (passive safety) 10.0 15.0 — — — 8.6
Other vehicle safety improvements 5.4 2.0 3.2 8.0 3.0 4.6
Motorcycle and bicycle helmets — — 6.0 7.0 — 1.4
Improving safety of rural single carriageways 4.1 — — 4.2 4.1 3.4
Reducing crash involvement of novice drivers 2.8 1.3 1.0 0.8 0.4 1.9
Additional measures for pedestrians and cyclist protection — 6.0 4.0 — — 1.2
Additional measures for speed reduction 5.0 5.0 5.0 5.0 5.0 5.0
Additional measures for child protection — 6.9 0.6 — — 1.7
Reducing casualties in drink-drive accidents 1.9 0.4 0.2 0.8 0.5 1.2
Reducing crashes during high-mileage work driving 2.1 0.9 1.2 1.9 1.9 1.9
Additional measures for improved driver behaviour 1.0 1.0 1.0 1.0 1.0 1.0
Combined effect of all measures 33 42 24 30 19 35
Source: reproduced from reference 84, with minor editorial amendments, with the permission of the publisher.
BOX 4.4
Vehicle safety standardsVehicle engineering for improved safety can be achieved by modifying a vehicle to help the driver avoid a crash, or
in the event of a crash, protect both those inside and outside the car against injury.
Research indicates that vehicle crash protection is a most effective strategy for reducing death and serious injury
in road crashes. A review of the effectiveness of casualty reduction measures in the United Kingdom between 1980
and 1996 found that the greatest contribution to reducing casualties was secondary safety or crash protection
improvements to vehicles. These accounted for around 15% of the reduction, compared with 11% for drink-drive
measures and 6.5% for road safety engineering measures (84).
Another review, by the European Transport Safety Council, estimated that improved standards for crash
protection could reduce deaths and serious injuries on European roads by as much as 20% (86). Analysis has shown
that if all cars were designed to provide impact protection equivalent to that of the best cars in the same class, half
of all fatal and disabling injuries could be avoided (87).
During the 1990s, signifi cant steps towards improved protection of occupants of cars were made in the highly-
motorized countries. In the European Union, there were several directives on frontal and side impact protection, and
information on crash tests from the European New Car Assessment Programme (EuroNCAP) was widely disseminated.
Much of the research and development necessary for improvements in other safety areas for car occupants – such as
smart seat-belt reminders – has been completed and now requires legislation to bring it into force.
Globally, the predominant category of road casualties up to 2020 will continue to be vulnerable road users.
Protection for those outside the vehicle against impact is thus a priority in the fi eld of vehicle design.

122 • WORLD REPORT ON ROAD TRAFFIC INJURY PREVENTION
resulting injuries of pedestrians and pedal cyclists. While the fi tting of rigid, “aggressive” bull-bars has been much publicized as a cause for concern, research shows that it is, in fact, the ordinary car front that presents by far the greatest risk to pedes-trians and cyclists in a frontal impact (93–95). Performance requirements and test procedures have been devised by a consortium established by European governments – the European Enhanced Vehicle-safety Committee (EEVC). Between 1988 and 1994, an EEVC working group on pedestrian protection developed a complete series of test methods to evaluate the front of passenger cars with respect to pedestrian safety (92), and these test methods were further improved in 1998 (95). The tests assume an impact speed of 40 km/h and consist of the following:
— a bumper test to prevent serious knee-joint injuries and leg fractures;
— a bonnet leading-edge test to prevent femur and hip fractures in adults and head injuries in children;
— two tests involving the bonnet top to prevent life-threatening head injuries.
It has been estimated that take up of these tests could avoid 20% of deaths and serious injuries to pedestrians and cyclists in European Union coun-tries annually (87, 94, 96). These tests, with minor amendments have been used by the European New Car Assessment Programme since 1997, and more recently by the Australian New Car Assessment Programme. Of the many new cars tested to date, only one type of car has shown evidence of having reasonable protec-tion – about 80% of the protection demanded by the tests at an estimated additional manufacturing cost for new designs of €10 per car (97). Studies carried out by national road safety research organi-zations in Europe have shown that the benefi ts of adopting the four EEVC tests would outweigh the costs (98). Legislation in this area is expected shortly in several countries, but the contents of the legislation are the subject of continuing international discus-sions (87, 99). Experts believe that the adoption of the well-researched EEVC tests would save many
lives (82, 93, 100) – perhaps as many as 2000 lives annually in the European Union alone (87).
Safer bus and truck frontsExtending the crash-protective vehicle exterior concept to vans, pick-up trucks and other trucks, and buses is an urgent requirement for protecting vulnerable road users in low-income countries (82, 88, 101). Buses and trucks are involved in a greater proportion of crashes in low-income countries than they are in high-income countries (102). Prelimi-nary investigations have suggested that signifi cant reductions in injuries could be achieved if the geom-etry and design of truck fronts were changed (102). The critical geometric features that infl uence injury and that continue to require attention by truck designers have been set out (101). Given the growth of megacities such as Bangkok, Beijing, Mexico City, São Paulo, Shanghai and others, the protection of vulnerable road users from bus and truck fronts take on particular importance. Many such cities have unique vehicles, such as the tuk-tuk of Bangkok, the becak of Jakarta and the three-wheeled taxis of India. Such vehicles incorporate almost no concept of crash protection, for either pedestrians or occupants. They present a good opportunity, therefore, for technical knowledge to improve their safety to be transferred from western car designers (23).
Car occupant protectionThe essential aims in crash protection are:
— to maintain, through appropriate design, the integrity of the car’s passenger compart-ment;
— to provide protection against elements that could cause injury in the car’s interior;
— to ensure that vehicle occupants are appro-priately restrained;
— to reduce the probability of an occupant being ejected;
— to prevent injury to other occupants (in a frontal crash, unbelted rear-seat occupants can cause injury to belted occupants seated in front of them);
— to improve the compatibility between vehi-cles of different mass (e.g. between car and
CHAPTER 4. INTERVENTIONS • 123
sports utility vehicle, car and car, car and bus or truck, car and motorized two-wheeler or bicycle).
Car crash protection standards currently address areas such as structural design, and the design and fi tting of seat-belts, child restraints, air bags, anti-burst door latches, laminated glass windscreens, seats, and head restraints. Such standards offering a minimum, but high level of protection need to be adopted in all countries.
Frontal and side impact protection. The vast majority of car crashes in high-income countries are offset frontal crashes (where only one side of a vehicle’s front end hits the other vehicle or object). In the United States, for example, 79% of injuries from frontal crashes occur as a result of offset frontal crashes (81). A recent priority for safety engineers working on frontal impact pro-tection has been to improve the car structure so it can endure severe offset impacts with little or no intrusion of external objects. This allows space, in the event of a crash, for the seat-belts and air bags to slow down the occupants with the minimum risk of injury. In most high-income countries, there are legislative performance requirements for cars to undergo a full-width frontal barrier test or an off-set deformable barrier test. The former is acknowl-edged as an appropriate method for testing occu-pant restraint systems in frontal crashes. The latter, the offset deformable barrier test, is a more realistic simulation of what happens to a car’s structure in a typical injury-producing frontal crash. The use of both tests is therefore important to ensure crash protection for car occupants (83, 103). Both tests are appropriate for more types of vehicle than they are currently used for. Side impacts, while less frequent than frontal crashes, typically cause more severe injuries. In side impacts, it is diffi cult to prevent occupants on the side that is struck from coming into contact with the car’s interior. Attempts at greater protection thus rely on managing the problem of intrusion, and providing padding and side air bags. During the 1990s, legislative standards were introduced in
most high-income countries to offer better protec-tion in side impacts. Following the experiences and evaluation of these requirements for frontal and side impact protection in Europe, various improve-ments have since been identifi ed (83, 104). As mentioned earlier, advanced crash tests, car-ried out for the benefi t of consumer information by various New Car Assessment Programmes and by organizations such as the Insurance Institute for Highway Safety in the United States, play a vital role in promoting car design that provides good frontal and side impact protection.
Occupant restraints. The use of seat-belts con-tinues to be the most important form of occupant restraint. Measures to increase their use – by means of legislation, information, enforcement and smart audible seat-belt reminders – are central to improving the safety of car occupants. When used, seat-belts have been found to reduce the risk of serious and fatal injury by between 40% and 65%. The fi tting of anchorages and seat-belts are covered by various technical standards worldwide and in most countries these standards are mandatory for cars. However, there is anec-dotal evidence that a half or more of all vehicles in low-income countries may lack functioning seat-belts (17). Air bags are being increasingly provided in cars as an extra means of restraint, in addition to three-point seat-belts. They should be fi tted universally to increase the protection of occupants involved in crashes. While driver and front-seat passenger air bags do not offer protection in all types of impact and do not diminish the risk of ejection (105), when combined with seat-belt use, they have been found to reduce the risk of death in frontal crashes by 68% (106). Estimates of the general effectiveness of air bags in reducing deaths in all types of crashes range from 8% to 14% (106–108). Where passenger air bags are fi tted, however, clear instructions are needed to avoid fi tting rear-facing child restraints on the same seat. Also required are devices to auto-matically detect child restraints and out-of-posi-tion occupants, and in such cases to switch off the passenger air bag.
124 • WORLD REPORT ON ROAD TRAFFIC INJURY PREVENTION
Protection against roadside objects. Collisions between cars and trees or poles are characterized by the severity of the injuries produced. Current legislation only requires the use of crash tests with barriers representing car-to-car impacts. It may now be time to supplement these tests with front and side car-to-pole tests, as practised in some consumer testing programmes. Better coordination is required between the design of cars and that of safety barriers (65, 109).
Vehicle-to-vehicle compatibilityAchieving vehicle-to-vehicle compatibility in crashes depends upon the particular mix of motor vehicle. In the United States, for example, there is a greater need to reconcile sports utility vehicles and other light truck vehicles with passenger cars. The United States National Highway Traffi c Safety Administra-tion has made vehicle compatibility one of its leading priorities and has published its proposed initiatives in a recent report (110). In Europe, work focuses on trying to improve car-to-car compatibility for both front-to-front and front-to-side crashes and recommendations on this have been put forward (83). In low-income and middle-income countries, issues of vehicle-to-vehicle compatibility are related more to collisions between cars and trucks – both front-to-front impacts, as well as between the front of the car and the rear of the truck. The fi rst priority for these countries must be to improve the geometry and structure of trucks so as to better accommodate impacts from smaller vehicles – not only cars, but motorcycles and bicycles as well (82). The frontal structures of many new cars are capable of absorbing their own kinetic energy in crashes, so avoiding any signifi cant intrusion of the passenger compartment. However, there is cur-rently no legal control, by means of performance requirements, of the relative degrees of stiffness of the fronts of different models of car. Consequently, when cars of differing stiffness collide, the stiffer car crushes the weaker car (83).
Front, rear and side under-run guards on trucksThe provision of front and rear under-run protec-tion on trucks is a well-established means of pre-
venting “under-running” by cars (whereby cars go underneath trucks, because of a mismatch between the heights of car fronts and truck sides and fronts). Similarly, side protection prevents cyclists from being run over. It has been estimated that the provision of energy-absorbing front, rear and side under-run protection could reduce deaths by about 12% (111). It has also been suggested that the benefi ts would exceed the costs, even if the safety effect of these measures was as low as 5% (56).
Design of non-motorized vehiclesResearch has shown that ergonomic changes in the design of bicycles could lead to an improvement in bicycle safety (23, 112). Bicycles display large dif-ferences in component strength and the reliability of their brakes and lighting. About three quarters of crashes involving passengers carried on bicycles in the Netherlands are associated with feet being trapped in the wheel spokes, and 60% of bicycles have no protective system to prevent this (112).
“Intelligent” vehiclesNew technologies are creating new opportuni-ties for road safety as more intelligent systems are being developed for road vehicles. Vehicles are now starting to be equipped with technology that could improve road safety in terms of exposure, crash avoidance, injury reduction and automatic post-crash notifi cation of collision (113). The development of intelligent systems is prin-cipally technology-driven. This means that – in the case of many of the features being promoted – the implications for road safety, as well as for the behavioural response of users and for public acceptance, have to be examined. It is generally acknowledged that some devices may distract drivers or affect their behaviour, often in a man-ner not anticipated by the designers of the system (113, 114). For these and other reasons, it has been strongly suggested that the development and appli-cation of intelligent transport systems should not be left entirely to market forces (87, 113). Examples are presented below of some of the most promising “intelligent” vehicle safety applica-tions that are already “on the road” in some form.
CHAPTER 4. INTERVENTIONS • 125
“Smart”, audible seat-belt remindersAs discussed earlier, the fi tting and use of seat-belts constitute the most important form of occu-pant restraint. Measures to increase seat-belt use, through legislation, information and enforcement and smart audible seat-belt reminders are central to improving in-car safety. Seat-belt reminders are intelligent visual and audible devices that detect whether seat-belts are in use in various seating positions and give out increas-ingly urgent warning signals until the belts are used (83). They do not lock the ignition function. Mod-ern types of seat-belt reminders are different from the older versions that produced a chiming sound and a light for four to eight seconds, which proved ineffective in increasing seat-belt use (115). In Sweden, 35% of all new cars sold currently have seat-belt reminders (116). It is estimated in that country that reminders in all cars could lead to national levels of seat-belt use of around 97%, contributing to a reduction of some 20% in car occupant deaths (117). User trials and research in Sweden and the United States have shown that seat-belt reminders with audible warnings are an effective means of increasing seat-belt use. Preliminary research on the only system currently available in the United States found a 7% increase in seat-belt use among drivers of cars with seat-belt reminders, compared with drivers of unequipped vehicles (118). Further-more, a driver survey found that of the two thirds who activated the system, three quarters reported using their seat-belt, and nearly half of all respond-ents said their belt use had increased (119). A recent United States National Academy of Sci-ence report urged the car industry to ensure that every new light-duty vehicle should have, as stand-ard equipment, an enhanced seat-belt reminder system for front-seat occupants, with an audible warning and visual indicator that could not be eas-ily disconnected (120). An Australian analysis has estimated a cost–ben-efi t ratio of 1:5, for a simple device for drivers only (121). A cost–benefi t ratio of 1:6 was found when seat-belt reminders were introduced in new vehi-cles in European Union countries (75). Seat-belt
reminders provide a cheap and effi cient option for helping to enforce seat-belt use.
Speed adaptationAs stated elsewhere in this report, a variety of effective means exist to reduce vehicle speeds – including the setting of speed limits according to road function, better road design, and the enforce-ment of limits by the police, radar and speed cam-eras. Speed limitation devices in vehicles can assist this process, by controlling the maximum speed a vehicle can travel at; some devices are able to set variable limits (see below). Insurance statistics show that high-speed cars – those with powerful engines, high acceleration and high top speeds – are more frequently involved in crashes than cars with lower speed capacities (16). The increase in maximum speeds in the past 30 to 40 years has made it increasingly easy to drive at inappropriately fast speeds, thus counteracting the effects of measures aimed at improving the safety of cars. In 1993, the ten best-selling models of cars had top speeds that were double the highest national posted speed limits in Norway (16). Intelligent Speed Adaptation (ISA) is a system being developed that shows great promise in terms of its potential impact on the incidence of road casualties. With this system, the vehicle “knows” the permitted or recommended maximum speed for the road along which it is travelling. The standard system uses an in-vehicle digital road map onto which speed limits have been coded, combined with a satellite positioning system. The level at which the system intervenes to control the speed of the vehicle can be one of the following:
— advisory – the driver is informed of the speed limit and when it is being exceeded;
— voluntary – the system is linked to the vehicle controls but the driver can choose whether and when to override it;
— mandatory – no override of the system is possible.
The potential reduction in the number of fatal crashes for these different types of systems has been estimated to be in the range 18–25% for advisory systems, 19–32% for voluntary systems,

126 • WORLD REPORT ON ROAD TRAFFIC INJURY PREVENTION
and 37–59% for mandatory systems (122). Speed limit information can in theory be extended to incorporate lower speeds at certain locations in the network and – in the future – can vary according to current network conditions, such as weather con-ditions, traffi c density and the presence of traffi c incidents on the road. Experimental trials have been carried out or are under way in Australia, Denmark, the Neth-erlands, Sweden and the United Kingdom (113). By far the largest trial of a speed adaptation sys-tem – the three-year Intelligent Speed Adaptation project – was carried out in four municipalities in Sweden. Various types of ISA system were installed in around 5000 cars, buses and trucks. If the driver exceeded the speed limit, light and sound signals were activated. The trial was con-ducted primarily in built-up areas with speed limits of 50 km/h or 30 km/h, and the test driv-ers were both private car and commercial driv-ers. The Swedish National Road Administration reported a high level of driver acceptance in urban areas of the devices and suggested that they could reduce crash injuries by 20–30% in urban areas (109, 116).
Alcohol interlocksAlcohol ignition interlocks are automatic control systems that are designed to prevent drivers who are persistently over the legal alcohol limit from starting their cars if their BAC levels are over the legal driving limit. In principle, these devices can be fi tted in any car. As a deterrent, though, they can be fi tted in the cars of repeat drink-driving offenders, who have to blow into the device before the car will start. If the driver’s BAC is above a certain level, the car will not start. Such devices, when introduced in vehicles as part of a compre-hensive monitoring programme, led to reductions of between 40% and 95% in the rate of repeated offending (123). Around half of Canada’s provinces and territories have embarked on alcohol interlock programmes and in the United States, most states have passed enabling legislation for such devices. Some states in Australia have small experimental programmes
in progress, involving public transport and com-mercial road transport, and the European Union is conducting a feasibility study (124). In Sweden, alcohol interlocks are now installed in over 1500 vehicles and, since 2002, two major truck suppliers have been offering interlocks as standard equip-ment on the Swedish market (116). If limited to use in dealing with drivers who are persistently over the legal alcohol limit, alco-hol interlock devices might have only a numeri-cally small impact. However, their wider use in public and commercial transport in the future could extend the potential impact of this tool in dealing with the problem of drink-driving.
On-board electronic stability programmesWeather conditions can affect the control of vehicles and increase the risk of skidding and crashes due to loss of control on wet or icy roads. In such conditions an electronic stability programme – an on-board car safety system – can help the car to remain stable during critical manoeuvring. Such devices are now being introduced onto the market, but they are very expensive. A recent Swedish evaluation of the effects of this new technology – the fi rst of its kind – pro-duced promising results, especially for bad weather conditions, with reductions in injury crashes of 32% and 38% on ice and snow, respectively (125).
Setting and securing compliance with key road safety rulesGood enforcement is an integral part of road safety. Self-enforcing road safety engineering measures, as well as new and existing vehicle technologies that infl uence the behaviour of road users have already been discussed. This section examines the role of traffi c law enforcement by the police and the use of camera technology. A major review on traffi c law enforcement iden-tifi ed several important fi ndings (126):
• It is critical that the deterrent be meaningful for the traffi c law enforcement to be successful.
• Enforcement levels need to be high and maintained over a period of time, so as to ensure that the perceived risk of being caught remains high.
CHAPTER 4. INTERVENTIONS • 127
• Once offenders are caught, their penalties should be dealt with swiftly and effi ciently.
• Using selective enforcement strategies to tar-get particular risk behaviours and choosing specifi c locations both improve the effective-ness of enforcement.
• Of all the methods of enforcement, automated means – such as cameras – are the most cost-effective.
• Publicity supporting enforcement measures increases their effectiveness; used on its own, publicity has a negligible effect on road user behaviour.
A study in Canada found that the enforcement of traffi c rules reduced the frequency of fatal motor vehicle crashes in highly-motorized countries. At the same time, inadequate or inconsistent enforcement could contribute to thousands of deaths worldwide every year (127). It has been estimated that if all cur-rent cost-effective traffi c law enforcement strategies were rigorously applied by European Union coun-tries, then as many as 50% of deaths and serious injuries in these countries might be prevented (128).
Setting and enforcing speed limitsSetting road speed limits is closely associated with road function and road design, as already mentioned. Physical measures related to the road and the vehicle, as well as law enforcement by the police, all contribute to ensuring compliance with maximum posted speed limits and to the choice of an appropriate speed for the existing conditions.
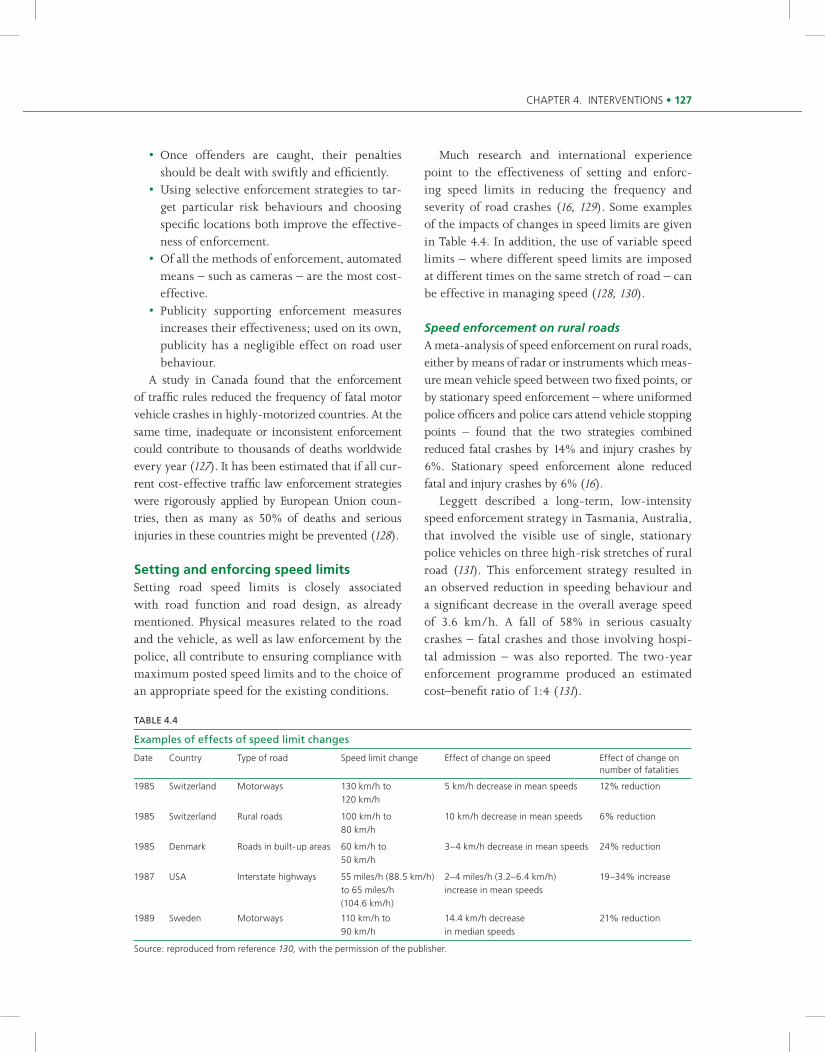
Much research and international experience point to the effectiveness of setting and enforc-ing speed limits in reducing the frequency and severity of road crashes (16, 129). Some examples of the impacts of changes in speed limits are given in Table 4.4. In addition, the use of variable speed limits – where different speed limits are imposed at different times on the same stretch of road – can be effective in managing speed (128, 130).
Speed enforcement on rural roadsA meta-analysis of speed enforcement on rural roads, either by means of radar or instruments which meas-ure mean vehicle speed between two fi xed points, or by stationary speed enforcement – where uniformed police offi cers and police cars attend vehicle stopping points – found that the two strategies combined reduced fatal crashes by 14% and injury crashes by 6%. Stationary speed enforcement alone reduced fatal and injury crashes by 6% (16). Leggett described a long-term, low-intensity speed enforcement strategy in Tasmania, Australia, that involved the visible use of single, stationary police vehicles on three high-risk stretches of rural road (131). This enforcement strategy resulted in an observed reduction in speeding behaviour and a signifi cant decrease in the overall average speed of 3.6 km/h. A fall of 58% in serious casualty crashes – fatal crashes and those involving hospi-tal admission – was also reported. The two-year enforcement programme produced an estimated cost–benefi t ratio of 1:4 (131).
TABLE 4.4
Examples of effects of speed limit changes
Date Country Type of road Speed limit change Effect of change on speed Effect of change on number of fatalities
1985 Switzerland Motorways 130 km/h to120 km/h
5 km/h decrease in mean speeds 12% reduction
1985 Switzerland Rural roads 100 km/h to80 km/h
10 km/h decrease in mean speeds 6% reduction
1985 Denmark Roads in built-up areas 60 km/h to50 km/h
3–4 km/h decrease in mean speeds 24% reduction
1987 USA Interstate highways 55 miles/h (88.5 km/h) to 65 miles/h (104.6 km/h)
2–4 miles/h (3.2–6.4 km/h)increase in mean speeds
19–34% increase
1989 Sweden Motorways 110 km/h to90 km/h
14.4 km/h decrease in median speeds
21% reduction
Source: reproduced from reference 130, with the permission of the publisher.

128 • WORLD REPORT ON ROAD TRAFFIC INJURY PREVENTION
Speed camerasAutomatic speed enforcement, such as by means of speed cameras, is now employed in many coun-tries. Experience from a range of high-income countries indicates that speed cameras that record photographic evidence of a speeding offence, that is admissible in a law court, are a highly effective means of speed enforcement (see Table 4.5). The well-publicized use of such equipment in places where speed limits are not generally obeyed and where the consequent risk of a crash is high has led to substantial reductions in crashes (113, 132, 134). The cost–benefi t ratios of speed cameras have been reported to range between 1:3 and 1:27 (135, 136). In several countries, including Finland, Norway and the United Kingdom, there has been a high social acceptance of speed cameras (113).
Speed limiters in heavy goods and public transport vehiclesSpeed can also be controlled by “vehicle speed limit-ers” or “speed governors”, which are devices that can be added to vehicles to limit the maximum speed of the vehicle. This device is already being used in many countries in heavy goods vehicles and coaches. It has been estimated that speed governors on heavy goods vehicles could contribute to a reduction of 2% in the total number of injury crashes (137).
In rural areas, speed limitation for buses, minibuses and trucks could be valuable (46). Given the high representation of such vehicles in injury crashes in low-income countries, universal availability of speed limitation on trucks and buses would be an important means of improving road safety.
Setting and enforcing alcohol impairment lawsDespite the progress made in many countries in curbing drink-driving, alcohol is still a signifi cant and widespread factor in road crashes. The scien-tifi c literature and national road safety programmes agree that a package of effective measures is neces-sary to reduce alcohol-related crashes and injuries.
Blood alcohol concentration limitsThe basic element of any package to reduce alcohol impairment among road users is establishing a legal BAC limit. In many countries, a breath alcohol limit is used, for purposes of legal prosecution. Mandatory BAC limits provide an objective and simple means by which alcohol impairment can be detected (138). In addition, the BAC level gives clear guidance to drivers about safe driving practice. Upper limits of 0.05 g/dl for the general driving population and 0.02 g/dl for young drivers and motorcycle riders are generally considered to be the best practice at this time.
TABLE 4.5
Estimated safety benefi ts of speed cameras
Country or area Benefi ts of crash reduction at a system level Benefi ts of crash reduction at individual crash sites
Australia 22% reduction in all crashes in New South Wales30% reduction in all crashes on urban arterial roads in Victoria34% reduction in fatal crashes in Queensland
New Zealand 11% reduction in crashes and 20% reduction in casualties during trials of hidden speed cameras
Republic of Korea 28% reduction in crashes and 60% reduction in deaths at high-risk sites
United Kingdom 35% reduction in road traffi c deaths and serious injuries and 56% reduction in pedestrians killed or seriously injured at camera site
Europe (various) 50% reduction in all crashes
Various countries (meta-analysis)
17% reduction in crashes resulting in injuries 28% reduction in all crashes in urban areas 4% reduction in all crashes in rural areas
Sources: references 16, 113, 132, 133.
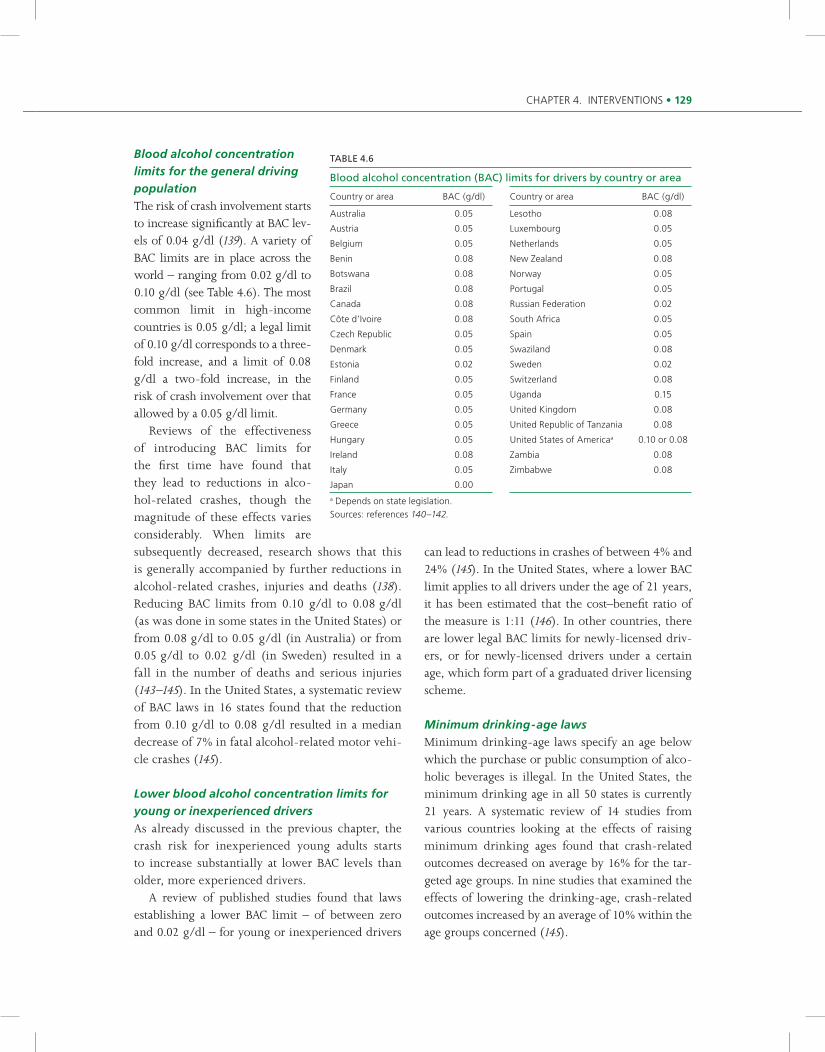
CHAPTER 4. INTERVENTIONS • 129
Blood alcohol concentration limits for the general driving populationThe risk of crash involvement starts to increase signifi cantly at BAC lev-els of 0.04 g/dl (139). A variety of BAC limits are in place across the world – ranging from 0.02 g/dl to 0.10 g/dl (see Table 4.6). The most common limit in high-income countries is 0.05 g/dl; a legal limit of 0.10 g/dl corresponds to a three-fold increase, and a limit of 0.08 g/dl a two-fold increase, in the risk of crash involvement over that allowed by a 0.05 g/dl limit. Reviews of the effectiveness of introducing BAC limits for the fi rst time have found that they lead to reductions in alco-hol-related crashes, though the magnitude of these effects varies considerably. When limits are subsequently decreased, research shows that this is generally accompanied by further reductions in alcohol-related crashes, injuries and deaths (138). Reducing BAC limits from 0.10 g/dl to 0.08 g/dl (as was done in some states in the United States) or from 0.08 g/dl to 0.05 g/dl (in Australia) or from 0.05 g/dl to 0.02 g/dl (in Sweden) resulted in a fall in the number of deaths and serious injuries (143–145). In the United States, a systematic review of BAC laws in 16 states found that the reduction from 0.10 g/dl to 0.08 g/dl resulted in a median decrease of 7% in fatal alcohol-related motor vehi-cle crashes (145).
Lower blood alcohol concentration limits for young or inexperienced driversAs already discussed in the previous chapter, the crash risk for inexperienced young adults starts to increase substantially at lower BAC levels than older, more experienced drivers. A review of published studies found that laws establishing a lower BAC limit – of between zero and 0.02 g/dl – for young or inexperienced drivers
can lead to reductions in crashes of between 4% and 24% (145). In the United States, where a lower BAC limit applies to all drivers under the age of 21 years, it has been estimated that the cost–benefi t ratio of the measure is 1:11 (146). In other countries, there are lower legal BAC limits for newly-licensed driv-ers, or for newly-licensed drivers under a certain age, which form part of a graduated driver licensing scheme.
Minimum drinking-age lawsMinimum drinking-age laws specify an age below which the purchase or public consumption of alco-holic beverages is illegal. In the United States, the minimum drinking age in all 50 states is currently 21 years. A systematic review of 14 studies from various countries looking at the effects of raising minimum drinking ages found that crash-related outcomes decreased on average by 16% for the tar-geted age groups. In nine studies that examined the effects of lowering the drinking-age, crash-related outcomes increased by an average of 10% within the age groups concerned (145).
TABLE 4.6
Blood alcohol concentration (BAC) limits for drivers by country or area
Country or area BAC (g/dl) Country or area BAC (g/dl)
Australia 0.05 Lesotho 0.08
Austria 0.05 Luxembourg 0.05
Belgium 0.05 Netherlands 0.05
Benin 0.08 New Zealand 0.08
Botswana 0.08 Norway 0.05
Brazil 0.08 Portugal 0.05
Canada 0.08 Russian Federation 0.02
Côte d’Ivoire 0.08 South Africa 0.05
Czech Republic 0.05 Spain 0.05
Denmark 0.05 Swaziland 0.08
Estonia 0.02 Sweden 0.02
Finland 0.05 Switzerland 0.08
France 0.05 Uganda 0.15
Germany 0.05 United Kingdom 0.08
Greece 0.05 United Republic of Tanzania 0.08
Hungary 0.05 United States of Americaa 0.10 or 0.08
Ireland 0.08 Zambia 0.08
Italy 0.05 Zimbabwe 0.08
Japan 0.00a Depends on state legislation.Sources: references 140–142.
130 • WORLD REPORT ON ROAD TRAFFIC INJURY PREVENTION
Deterring excess alcohol offendersFor most countries, the level of enforcement of drink-driving laws has a direct effect on the inci-dence of drinking and driving (147). Increasing drivers’ perception of the risk of being detected is the most effective means of deterring drinking and driving (148). “Evidential” breath-testing devices (devices that are considered accurate enough for the results to be used as evidence in law courts) are a means of substantially increasing breath-testing activity. Though used in most high-income coun-tries, they are not currently widespread elsewhere. This greatly limits the ability of many countries to respond effectively to the problem of drink-driving. The deterrent effect of breath-testing devices is to a large extent dependent on the legislation gov-erning their use (126). Police powers vary between countries, and include the following:
— stopping obviously impaired drivers;— stopping drivers at roadblocks or sobriety
checkpoints and testing only those suspected of alcohol impairment;
— stopping drivers at random and testing all who are stopped.
The following components have been identifi ed as being central to successful police enforcement operations to deter drinking drivers (128):
• A high proportion of people tested (at least one in ten drivers every year but, if possible, one in three drivers, as is the case in Finland). This can only be achieved through wide-scale application of ran-dom breath testing and evidential breath testing.
• Enforcement that is unpredictable in terms of time and place, deployed in such a manner so as to ensure wide coverage of the whole road network and to make it diffi cult for drivers to avoid the checkpoints.
• Highly visible police operations. For drinking drivers who are caught, remedial treatment can be offered as an alternative to traditional penalties, to reduce the likelihood of repeated offending.
Random breath testing and sobriety checkpointsRandom breath testing is carried out in several countries, including Australia, Colombia, France,
the Nordic countries, the Netherlands, New Zea-land and South Africa. The use of sustained and intensive random breath testing is a highly effective means of reducing injuries resulting from alcohol impairment. In Australia, for instance, since 1993 it has led to estimated reductions in alcohol-related deaths in New South Wales of 36% (with one in three drivers tested), in Tasmania of 42% (three in four tested) and in Victoria of 40% (one in two tested) (126). An international review of the effectiveness of random breath testing and sobriety checkpoints found that both reduced alcohol-related crashes by about 20% (149). The reductions appeared to be similar, irrespective of whether the checkpoints were used for short-term intensive campaigns or continuously over a period of several years. A Swiss study has shown that random breath testing is one of the most cost-effective safety measures that can be employed, with a cost–ben-efi t ratio estimated at 1:19 (150). In New South Wales, Australia, the estimated cost–benefi t ratio of random breath testing ranged from 1:1 to 1:56 (126, 151, 152). Similarly, economic analyses on the sobriety checkpoint programmes in the United States estimated benefi ts totalling between 6 and 23 times their original cost (153, 154).
Mass media campaignsIt is generally accepted that enforcement of alcohol impairment laws is more effective when accompa-nied by publicity aimed at:
— making people more alert to the risk of detection, arrest and its consequences;
— making drinking and driving less publicly acceptable;
— raising the acceptability of enforcement activities.
Public support for random breath testing, for instance, has remained high in New South Wales, Australia as a result of extensive public information concerning the measure. A recent systematic review demonstrated that mass media campaigns that are carefully planned and well executed, that reach a suffi ciently large audience, and that are implemented together with
CHAPTER 4. INTERVENTIONS • 131
other prevention activities – such as highly-visible enforcement – are effective in reducing alcohol-impaired driving and alcohol-related crashes (155). In New Zealand, a recent evaluation of the fi ve-year Supplementary Road Safety Package, which com-bines shock advertising with enforcement, found that this combination strategy saved between 285 and 516 lives over the fi ve-year period (156).
Penalties for excess alcohol offendersPrison sentences have been given for drink-driving offences in several countries, including Australia, Canada, Sweden and the United States. According to research, though, in the absence of effective enforce-ment such a penalty, in general, has been unsuccess-ful in deterring drinking drivers or reducing the rate of repeat offending (148, 157). If drivers perceive that the likelihood of their being detected and punished is low, then the effect of the penalty, even if severe, is likely to be small. All the same, research suggests that disqualifi cation from driving after failing a breath test or refusing to take a breath test may deter drink-ing drivers – probably because of the swiftness and certainty of the punishment (157).
Interventions for high-risk offenders High-risk offenders are usually defi ned as those with BAC levels in excess of 0.15 g/dl. In many industrialized countries, driver rehabilitation courses are available to offenders, though the components of such courses vary widely. Stud-ies that have followed participants subsequent to drink-driving rehabilitation courses have shown, where participants are motivated to address their problems, that the courses reduce the rate of reof-fending (158, 159).
Medicinal and recreational drugsLegal requirements for police powers to carry out drug testing vary. Powers to carry out a blood or urine test exist in many countries to determine whether a driver is unfi t to drive as a result of con-suming drugs. The relationship between the use of drugs and involvement in road crashes is still largely unclear. Considerable research, though, is currently being undertaken to gain greater under-
standing of this subject. Enforcement strategies that deter people from driving while under the infl u-ence of drugs still have to be developed. Research is also being carried out in this area, to fi nd effi cient and cost-effective screening devices to help enforce laws on drug use and driving.
Drivers’ hours of work in commercial and public transportThe previous chapter outlined the risks associated with cumulative fatigue as a result of lack of sleep, night driving and working shifts. Research indi-cates that fatigue is most prevalent among long-distance truck drivers (160) and that it is a factor in 20–30% of crashes in Europe and the United States involving commercial road vehicles (161, 162). A recent review of research on fatigue among commercial transport drivers in Australia found that between 10% and 50% of truck drivers drove while fatigued on a regular basis. The self-reported use of pills taken to stay awake in the long-distance road transport industry varies between 5% and 46% (163). The normal pattern of work of commercial drivers is infl uenced by strong economic and social forces. Arguments about safety are usually ignored in many places, for commercial reasons (161, 164–166). However, an estimated 60% of the overall costs of traffi c crashes involving commercial trucks in the United States are borne by society, rather than by the truck operators (167). Working time – which often determines the time since the last signifi cant period of sleep – is more critical to fatigue than actual driving time. Restrictions on driving hours that do not take into account when the driving occurs, forcing drivers to work according to shifting schedules, can result in greater sleep deprivation and make it diffi cult for the drivers’ circadian rhythms to adapt (161). Buses, coaches and commercial road transport are the only areas that are covered by specifi c leg-islation. It is increasingly recognized, though, that regulations on working and driving times need to be broadened. Drivers and operators, for instance, need training and information on fatigue and how to manage it. In Europe, in particular, laws on driv-
132 • WORLD REPORT ON ROAD TRAFFIC INJURY PREVENTION
ing and working hours and their enforcement, over the last 30 years, have not yet reached the levels demanded by safety research (161). Safety experts believe that the policies on driving and working hour limits should take greater account of the sci-entifi c evidence on fatigue and crash risk and, in particular, of the following:
• Daily and weekly rest. The risk of being involved in a crash doubles after 11 hours of work (168). Suffi cient time and proper facilities for meal breaks and daily rest and recuperation need to be provided. Where breaks cannot be taken at physiologically suitable times of the day, proper time must be given for full recu-peration on a weekly, or shorter, basis.
• Night work. The risk of fatigue-related crashes at night is 10 times greater than during the day (161). The number of permissible working hours during the period of low circadian activ-ity should be substantially less than the number permitted during the day.
• Working and driving time. There should be a coor-dinated approach to regulating driving and working time to ensure that permissible driv-ing times do not inevitably lead to unacceptably high working times that double crash risk.
Some new vehicle technologies – such as on-board driver monitoring systems – promise to help in the detection of fatigue and excessive working hours. Road design standards urgently need to take better account of current knowledge of the causes and characteristics of crashes due to fatigue and inattention, and more research is needed to set good standards of road design to help prevent such crashes (163). While such technological advances can certainly help, none of them is a substitute for a proper regime of regulated working hours and its rigorous enforcement.
Cameras at traffi c lightsCrashes at junctions are a leading source of road traffi c injury. In addition to improved junction layout and design and the replacement, where appropriate, of signal-controlled junctions by roundabouts, research has shown that cameras can also be cost-effective in reducing crashes at junctions with traffi c lights.
Cameras at traffi c lights take photographs of vehicles going through the lights when the signal is red. In Australia, the introduction of such cameras in the late 1980s led to a 7% reduction in all crashes and a 32% reduction in front-to-side impacts at sites with cameras (169). In the United States, it was found that following the introduction of cameras at sites in Oxnard, Cali-fornia, the number of injury crashes fell by 29% and the number of front-to-side impacts involving injury fell by 68%, with no increase in rear impacts (170). A meta-analysis of studies of the effectiveness of cameras at traffi c lights has shown that they are associated with a 12% reduction in the number of injury crashes (16). A cost–benefi t analysis of cameras at traffi c lights in the United Kingdom calculated that the return was nearly twice the investment after one year and 12 times the investment after fi ve years (171).
Setting and enforcing seat-belt and child restraint useSeat-beltsThe level of seat-belt use is infl uenced by:
— whether there is legislation mandating their use;
— the degree to which enforcement of the law, complemented by publicity campaigns, is carried out;
— incentives offered to encourage use. The time series shown in Figure is 4.1 is based on 30 years of experience in Finland with using seat-belts. It shows how legislation for compulsory use, without accompanying penalties, publicity or enforce-ment, has only a temporary effect on usage rates.
Mandatory seat-belt use lawsMandatory seat-belt use has been one of road injury prevention’s greatest success stories and has saved many lives. Occupant restraints fi rst began to be fi t-ted in cars in the late 1960s, and the fi rst law on their mandatory use was passed in Victoria, Australia, in 1971. By the end of that year, the annual number of car occupant deaths in Victoria had fallen by 18%, and by 1975 by 26% (173). Following the experience of Victoria, many countries also introduced seat-belt laws, which have led to many hundreds of thou-sands of lives saved worldwide.

CHAPTER 4. INTERVENTIONS • 133
Perc
enta
ge o
f dr
iver
s/fr
ont-
seat
pas
seng
ers
wea
ring
seat
-bel
ts
0
20
40
60
80
100
1966 1968 1970 1972 1974 1976 1978 1980 1982 1984 1986 1988 1990 1992 1994
Year
1.1.71Compulsory
installation ofseat-belts in
new cars1.9.83
Introduction of“on-the-spot”
fines
1.4.82Introduction offines for failure
to wear seat-belts
1992–1994Information and
enforcementcampaigns
1.7.75Compulsorywearing ofseat-belts
(>15 years)Non-urban areas
Urban areas
Source: reference 172.
FIGURE 4.1
Use of seat-belts by car drivers/front-seat passengers in urban and non-urban areas of Finland, 1966–1995
Seat-belts had been available for 20 years in Europe before their use was enforced by law, often with dramatic results. In the United Kingdom, for instance, front seat-belt usage rose from 37% before the introduction of the law to 95% a short period afterwards, with an accompanying fall of 35% in hospital admissions for road traffi c injuries (174, 175). The wide variation in seat-belt use in Euro-pean Union countries means that substantial further savings – estimated at around 7000 deaths annually – could be achieved if the usage rate was raised to the best that exists globally. In 1999, the best rates for seat-belt use recorded in high-income countries were in the 90–99% range for front-seat occupants, and in the 80–89% range for those in rear seats (128). Seat-belt use legislation in low-income coun-tries is still not universal, and will become increas-ingly important as levels of car traffi c rise. The cost–benefi t ratio of mandatory seat-belt use has been estimated at between 1:3 and 1:8 (16).
Enforcement and publicityResearch has shown that primary enforcement – where a driver is stopped solely for not wearing a seat-belt – is more effective than secondary enforcement – where a driver can only be stopped if another offence has been committed (176, 177). Primary enforcement
can increase seat-belt use, even where the level of use is already high (178). Many studies, at both national and local levels, have shown that enforcement increases seat-belt use if it meets certain conditions. The enforcement needs to be selective, highly visible and well pub-licized, conducted over a suffi ciently long period and repeated several times during a year (179–183). Selective Traffi c Enforcement Programmes and similar programmes have been introduced in France, in parts of the Netherlands and in several states of the United States. Generally, wearing rates have been found to be around 10–15% higher than the baseline level, a year after the activities were carried out (184). Studies have estimated that the cost–benefi t ratio of such seat-belt enforcement programmes is of the order of 1:3 or more (172). The Selective Traffi c Enforcement Programmes carried out in Canadian provinces have achieved improvements in seat-belt use, resulting in high rates of use. While the programmes differ across provinces in their details, their basic elements are broadly similar and include:
— an information briefi ng, educating police forces about the issue and its importance;
— following this campaign, a period of one to four weeks of intensive enforcement by

134 • WORLD REPORT ON ROAD TRAFFIC INJURY PREVENTION
the police, including fi nes, repeated several times a year;
— extensive public information and advertising;— support for the enforcement campaigns
in the media, and regular feedback in the media to public and police, on the progress recorded.
In the province of Saskatchewan, the programme has been repeated every year since 1988. In 1987, prior to the start of the programme seat-belt use of drivers was 72%, and that of front-seat passengers 67%. Figure 4.2 shows the incremental increases in seat-belt use – up to rates in excess of 90% – of driv-ers and front-seat passengers, from the introduction of the programme until 1994 (185, 186). The reasons why this type of programme has had such success include (186):
• The programme is seen as a safety, rather than as an enforcement measure, as a result of public information before the programme started.
• The perceived risk of being caught is increased, because of the wide media cover-age and police visibility.
• The provision of incentives (see below) strengthens the safety message and results in even higher police visibility.
• Feedback on the programme’s progress moti-vates both the public and police.
• The programme is greater than the sum of its separate elements, that is to say, its individual elements reinforce each other.
In the Republic of Korea, in the second half of 2000, the government set a target to increase seat-belt use from 23% to 80% by 2006. By August 2001, efforts to increase seat-belt use that included publicity, enforcement and a 100% increase in fi nes for offenders, led to a spectacular increase in usage from 23% to 98%, a rate that was sustained in 2002 (133). Six months after the introduction of legislation on seat-belt use in Thailand, a study in four cities found that the proportion of drivers wearing seat-belts had actually decreased. The reason for this is unclear, but it may have been related to problems with the con-sistent enforcement of the law (187).
Incentive programmesIncentives programmes have been devised to enhance police enforcement of seat-belt use in a number of countries. In these programmes, seat-belt use is monitored and seat-belt wearers are eligible for a reward. The rewards may range from a meal voucher or lottery ticket to sizeable prizes such as video recorders or free holidays (188). In general, such programmes appear very effective and have a high level of acceptance. A meta-analy-sis of 34 studies examined the effects of incentives on seat-belt use, and found the size of the effect to be related to a number of variables, such as the tar-get population, the initial baseline rate of seat-belt use and the prospect of immediate rewards (184).
Child restraintsThe high level of effectiveness of child restraints in reducing fatal and serious injuries was discussed in the previous chapter. Good protection requires that the type of restraint used is appropriate for the age and weight of the child. Several restraint types exist and are covered by international standards. These include (189):
• Rear-facing infant seats: for infants up to 10 kg, from birth to 6–9 months, or for infants up to 13 kg, from birth to 12–15 months.
1987 1988 1989 1990Pe
rcen
tage
of
driv
ers/
fron
t-se
at p
asse
nger
sw
earin
g se
at-b
elts
60
70
80
90
100
1991 1992 1993 1994
Year
Front-seat passengers
Drivers
FIGURE 4.2
Use of seat-belts by car drivers/front-seat passengers in Saskatchewan, Canada, 1987–1994
Source: reference 185.
CHAPTER 4. INTERVENTIONS • 135
• Forward-facing child seats: for children weighing 9–18 kg, from approximately 9 months to 4 years.
• Booster seats: for children weighing 15–25 kg, aged from about 4 to 6 years.
• Booster cushions: for children weighing 22–36 kg, aged from about 6 to 11 years.
Effective interventions for increasing child restraint use include (172, 190):
— laws mandating child restraints;— public information and enhanced enforce-
ment campaigns;— incentive programmes and education pro-
grammes to support enforcement;— child restraint loan schemes.
In North America, children under 12 years are encouraged to sit in the rear of the vehicle, whereas in Europe, rear-facing child seats are increasingly being used on the front passenger seat. As men-tioned in the previous chapter, while research has shown that rear-facing seats offer more protec-tion than forward-facing seats, there are risks attached to placing rear-facing seats on the front seat directly in front of the passenger air bag. There should be clear instructions to avoid fi tting rear-facing child restraints in this way. Devices exist that can automatically detect child restraints and occupants out of their normal position on the front seat, and switch off the passenger air bag. As regards child restraint usage in low-income countries, cost and availability are important factors.
Mandatory child restraint lawsA review of studies on the effects of mandatory child restraint laws in the United States concluded that such laws have led to an average reduction of 35% in fatal injuries, a 17% decrease in all injuries and a 13% increase in child restraint use (190, 191). While most cars in high-income countries are fi tted with adult restraint systems, child restraint use requires informed decisions on the part of par-ents or guardians regarding design, availability and correct fi tting. A further issue is the fact that age-related child seats can only be used for a limited period and the cost of replacing them could deter parents from doing so.
As mentioned earlier, the incorrect fi tting and use of child equipment is a signifi cant problem that decreases the potential safety benefi ts of these sys-tems. Standardized anchorage points in cars would help to resolve many of these problems. Proposals for an international requirement have been dis-cussed for many years, but not agreed as yet. In the absence of child seats, it is important that adults are made to understand that they should avoid carrying children on their laps. The forces in a crash are such that, whatever action adults may take, they are unlikely to save an unbelted child from injury (192).
Child restraint loan programmesChild restraint loan programmes are widely avail-able in high-income countries. For a small fee or without charge, parents can have the loan of an infant seat from the maternity ward where the child is born. A further benefi t of such schemes is their strong educational value and the opportunity they afford for precise advice to be given to the parents. The schemes have strongly affected usage rates of infant seats and also the use of appropriate child restraints throughout childhood (191, 193).
Setting and enforcing mandatory crash helmet useBicycle helmetsAs already mentioned, the use of bicycle helmets has been found to reduce the risk of head and brain injuries by between 63% and 88% (194–196). As with other safety equipment, measures to increase the use of bicycle helmets involve a variety of strategies. A range of bicycle helmet standards is used worldwide. While there continues to be debate about whether mandatory use is appropri-ate – refl ecting concerns that mandatory use could deter people from the otherwise healthy pursuit of cycling – the effectiveness of bicycle helmets for road safety is not at all in doubt (195) (see Box 4.5). In general, bicycle helmet use worldwide is low. A meta-analysis of studies has shown that the mandatory wearing of cycle helmets has reduced the number of head injuries among cyclists by around 25% (16). In 1990, following 10 years of
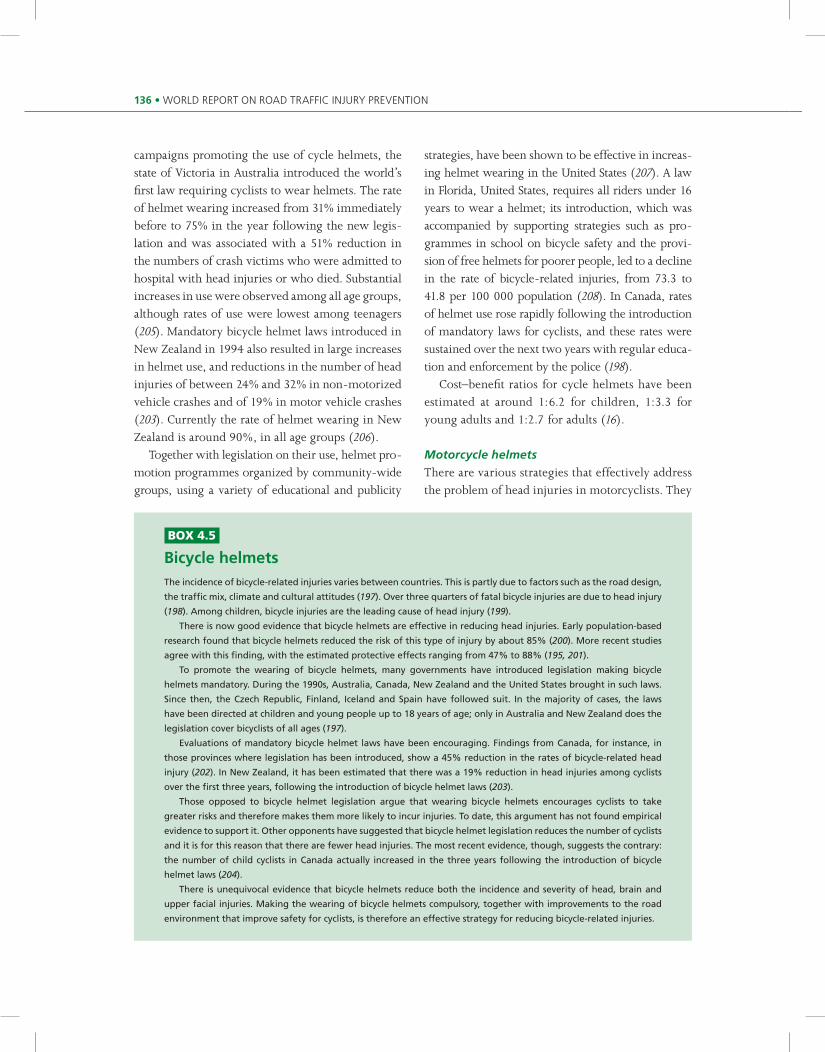
136 • WORLD REPORT ON ROAD TRAFFIC INJURY PREVENTION
campaigns promoting the use of cycle helmets, the state of Victoria in Australia introduced the world’s fi rst law requiring cyclists to wear helmets. The rate of helmet wearing increased from 31% immediately before to 75% in the year following the new legis-lation and was associated with a 51% reduction in the numbers of crash victims who were admitted to hospital with head injuries or who died. Substantial increases in use were observed among all age groups, although rates of use were lowest among teenagers (205). Mandatory bicycle helmet laws introduced in New Zealand in 1994 also resulted in large increases in helmet use, and reductions in the number of head injuries of between 24% and 32% in non-motorized vehicle crashes and of 19% in motor vehicle crashes (203). Currently the rate of helmet wearing in New Zealand is around 90%, in all age groups (206). Together with legislation on their use, helmet pro-motion programmes organized by community-wide groups, using a variety of educational and publicity
strategies, have been shown to be effective in increas-ing helmet wearing in the United States (207). A law in Florida, United States, requires all riders under 16 years to wear a helmet; its introduction, which was accompanied by supporting strategies such as pro-grammes in school on bicycle safety and the provi-sion of free helmets for poorer people, led to a decline in the rate of bicycle-related injuries, from 73.3 to 41.8 per 100 000 population (208). In Canada, rates of helmet use rose rapidly following the introduction of mandatory laws for cyclists, and these rates were sustained over the next two years with regular educa-tion and enforcement by the police (198). Cost–benefi t ratios for cycle helmets have been estimated at around 1:6.2 for children, 1:3.3 for young adults and 1:2.7 for adults (16).
Motorcycle helmetsThere are various strategies that effectively address the problem of head injuries in motorcyclists. They
BOX 4.5
Bicycle helmetsThe incidence of bicycle-related injuries varies between countries. This is partly due to factors such as the road design,
the traffi c mix, climate and cultural attitudes (197). Over three quarters of fatal bicycle injuries are due to head injury
(198). Among children, bicycle injuries are the leading cause of head injury (199).
There is now good evidence that bicycle helmets are effective in reducing head injuries. Early population-based
research found that bicycle helmets reduced the risk of this type of injury by about 85% (200). More recent studies
agree with this fi nding, with the estimated protective effects ranging from 47% to 88% (195, 201).
To promote the wearing of bicycle helmets, many governments have introduced legislation making bicycle
helmets mandatory. During the 1990s, Australia, Canada, New Zealand and the United States brought in such laws.
Since then, the Czech Republic, Finland, Iceland and Spain have followed suit. In the majority of cases, the laws
have been directed at children and young people up to 18 years of age; only in Australia and New Zealand does the
legislation cover bicyclists of all ages (197).
Evaluations of mandatory bicycle helmet laws have been encouraging. Findings from Canada, for instance, in
those provinces where legislation has been introduced, show a 45% reduction in the rates of bicycle-related head
injury (202). In New Zealand, it has been estimated that there was a 19% reduction in head injuries among cyclists
over the fi rst three years, following the introduction of bicycle helmet laws (203).
Those opposed to bicycle helmet legislation argue that wearing bicycle helmets encourages cyclists to take
greater risks and therefore makes them more likely to incur injuries. To date, this argument has not found empirical
evidence to support it. Other opponents have suggested that bicycle helmet legislation reduces the number of cyclists
and it is for this reason that there are fewer head injuries. The most recent evidence, though, suggests the contrary:
the number of child cyclists in Canada actually increased in the three years following the introduction of bicycle
helmet laws (204).
There is unequivocal evidence that bicycle helmets reduce both the incidence and severity of head, brain and
upper facial injuries. Making the wearing of bicycle helmets compulsory, together with improvements to the road
environment that improve safety for cyclists, is therefore an effective strategy for reducing bicycle-related injuries.

CHAPTER 4. INTERVENTIONS • 137
include the introduction of performance standards for motorcycle safety helmets, legislation making helmet wearing compulsory – with penalties for non-use – and targeted information and enforce-ment campaigns. In many parts of the world, helmet standards set out performance requirements for crash helmets. These standards are most effective when based on research fi ndings on crash injury. A recent European initiative has recently reviewed, and subsequently revised, existing helmet standards in the light of current knowledge and crash research (209). In low-income countries, it would be highly desirable for effective, comfortable and low-cost helmets to be developed and local manufactur-ing capacity increased. The Asia Injury Prevention Foundation, for instance, has developed a light-weight tropical helmet for use in Viet Nam and has drawn up standards for helmet performance. In Malaysia, the fi rst standard for motorcycle helmets for adults was drafted in 1969 and updated in 1996. The country is now developing helmets specially designed for children (210).
Mandatory laws on helmet wearing Increasing helmet wearing through the legislation requiring their use is important, especially in low-income countries where motorized two-wheeler use is high and current levels of helmet wearing low. It has been suggested that when a motorcycle is purchased, the acquisition of an approved helmet should be mandated, or at least encouraged, espe-cially in low-income countries (17). In Malaysia, where legislation on the use of helmets was introduced in 1973, it was estimated that the law led to a reduction of about 30% in motorcycle deaths (211). In Thailand, in the year following the enforcement of the law on wear-ing helmets, their use increased fi ve-fold, while motorcycle head injuries decreased by 41.4% and deaths by 20.8% (212). An evaluation of helmet use and traumatic brain injury, before and after the introduction of legislation, in the region of Romagna, Italy, found that helmet use increased from an average of less than 20% in 1999 to over 96% in 2001, and was
an effective measure for preventing traumatic brain injury at all ages (213). A meta-analysis of studies – mainly from the United States, where many laws on helmets were introduced in the period 1967–1970, around a half of which were repealed between 1976 and 1978 – found that the introduction of laws on compulsory helmet wearing reduced the number of injuries to moped riders and motorcyclists by 20–30% (16). Similarly, the analysis of the effects of repealing helmet wear-ing laws showed that withdrawing them led to an increase of around 30% in the numbers of fatal inju-ries, and an increase of 5–10% in injuries to moped riders and motorcyclists (16). A recent study on the repeal of laws in the United States found that observed helmet use in the states of Kentucky and Louisiana dropped from nearly full compliance, when the laws were still operative, to around 50%. After the repeal of the laws, motorcycle deaths increased by 50% in Kentucky and by 100% in Louisiana (214). Economic evaluations of mandatory helmet wearing laws, based largely on experience in the United States, found high cost–benefi t ratios, rang-ing from 1:1.3 to 1:16 (215).
The role of education, information and publicityPublic health sector campaigns in the fi eld of road injury prevention have encompassed a wide range of measures, but education has always featured as the mainstay of prevention (216). In the light of ongoing research and experience of the systems approach to road injury prevention, many profes-sionals in the fi eld have re-examined the role that education plays in prevention (26, 216, 217). It is clear that informing and educating road users can improve knowledge about the rules of the road and about such matters as purchasing safer vehicles and equipment. Basic skills on how to control vehicles can be taught. Education can help to bring about a climate of concern and develop sympathetic atti-tudes towards effective interventions. Consultation with road users and residents is essential in design-ing urban safety management schemes. As the previous section showed, when used in support of legislation and law enforcement, publicity

138 • WORLD REPORT ON ROAD TRAFFIC INJURY PREVENTION
and information can create shared social norms for
safety. However, when used in isolation, education,
information and publicity do not generally deliver
tangible and sustained reductions in deaths and
serious injuries (26, 190, 217). Historically, consider-
able emphasis has been placed on efforts to reduce
road user error through traffi c safety education
– for example, in pedestrian and cycle education
for school children, and in advanced and remedial
driver training schemes. Although such efforts can
be effective in changing behaviour (218), there is no
evidence that they have been effective in reducing
rates of road traffi c crashes (218, 219) (see Box 4.6).
Delivering post-crash careChain of help for patients injured in road crashesThe aim of post-impact care is to avoid prevent-
able death and disability, to limit the severity of the
injury and the suffering caused by it, and to ensure
the crash survivor’s best possible recovery and
reintegration into society. The way in which those
BOX 4.6
Educational approaches to pedestrian safetyEducating pedestrians on how to cope with the traffi c environment is considered an essential component of
strategies to reduce pedestrian injuries and has been recommended in all types of countries.
In order to reach the two groups of pedestrians that are particularly vulnerable – children and older people
– educational programmes use a variety of methods, frequently in combination. These approaches include talks,
printed materials, fi lms, multi-media kits, table-top models, mock-ups of intersections, songs and other forms of
music. Education is provided either directly to the target population or indirectly – through parents or teachers, for
instance – and in various settings, such as the home, the classroom or a real traffi c situation.
Most studies on the effectiveness of educational programmes report on surrogate outcomes, such as observed
or reported behaviour, attitudes and knowledge. From a public health perspective, though, the main outcomes
of interest are crashes, deaths, injuries and disabilities. The studies reporting these outcomes tend to have
methodological limitations which reduce their usefulness for comparative purposes. Limitations include the absence
of randomization for assigning subjects to intervention and control groups (220–223), the absence of detailed data
for control groups (221), or the lack of a control group (224).
A systematic review (218), including 15 randomized controlled trials that measured the effectiveness of
programmes of safety education for pedestrians, found:
• There was a lack of good evidence for adults, particularly in the case of elderly people.
• There was a lack of good evidence from low-income and middle-income countries.
• The quality of the studies was fairly poor, even in randomized controlled studies.
• The variety of intervention models and of methods of measuring outcomes made comparisons between studies
diffi cult.
• Only surrogate outcomes were reported.
• While a change in knowledge and attitudes in children was confi rmed, the size of the measured effect varied
considerably.
• A change in behaviour was found in children, but not in all studies, and the size of the effect was infl uenced by
the method of measuring, as well as by the context, such as whether a child was alone or with other children.
• The effect of education on the risk of a pedestrian incurring an injury remains uncertain.
Overall, the effect of safety education of pedestrians on behaviour varied considerably. Knowledge of pedestrian
safety in children can translate into changed attitudes and even into appropriate forms of behaviour, but there is
uncertainty about the extent to which the observed behavioural changes persist over time. There is no evidence that
observed behaviour is causally related to the risk of occurrence of pedestrian injury. If it is, though, there is no reliable
information about the size of the effect of pedestrian behaviour on the frequency of pedestrian injuries. Reliable
scientifi c information on the effectiveness of educational approaches to pedestrian safety in low-income and middle-
income countries is lacking. Also needing more research is the effectiveness of educational approaches in all countries
with elderly pedestrians.

CHAPTER 4. INTERVENTIONS • 139
injured in road crashes are dealt with following a crash crucially determines their chances and the quality of survival. A study in high-income countries found that about 50% of deaths from road traffi c crashes occurred within minutes, either at the scene or while in transit to hospital. For those patients taken to hospital, around 15% of deaths occurred within the fi rst four hours after the crash, but a much greater proportion, around 35%, occurred after four hours (225). In reality, therefore, there is not so much a “golden hour” in which interventions have to take place (226) as a chain of opportuni-ties for intervening across a longer timescale. This chain involves bystanders at the scene of the crash, emergency rescue, access to the emergency care system, and trauma care and rehabilitation.
Pre-hospital careAs already pointed out in the previous chapter, the vast majority of road traffi c deaths in low-income and middle-income countries occur in the pre-hospital phase (227). In Malaysia, for instance, 72% of motorcycle deaths occur during this phase (228). At least half of all trauma deaths in high-income countries are pre-hospital deaths (225, 227). A number of options exist for improving the quality of pre-hospital care. Even where these options are cheap, they are frequently not taken up to suffi cient extent (229).
Role of lay bystandersThose who are present or who arrive fi rst at the scene of a crash can play an important role in vari-ous ways, including:
— contacting the emergency services, or calling for other forms of help;
— helping to put out any fi re;— taking action to secure the scene (e.g. pre-
venting further crashes, preventing harm to rescuers and bystanders, controlling the crowd gathered at the scene);
— applying fi rst aid. Many deaths from airway obstruction or exter-nal haemorrhage could be avoided by lay bystand-ers trained in fi rst aid (230).
In low-income and some middle-income coun-tries, rescue by ambulance occurs in the minority of cases and assistance from a lay bystander is the main source of health care for the victims. In Ghana, for example, the majority of injured patients who reach hospital do so by means of some form of com-mercial vehicle (227, 231). It has been suggested that basic fi rst-aid training for commercial drivers might be helpful (227), though it has not been scientifi cally established whether such a measure would decrease pre-hospital mortality (229). A pilot project on pre-hospital care training was conducted in Cambodia and northern Iraq, in areas with a high density of landmines where people were frequently injured (232). The fi rst stage of the project involved giving 5000 lay people a basic two-day training course in fi rst aid. These people would be “fi rst responders” in landmine explo-sions. In the second stage, paramedics were given 450 hours of formal training. A rigorous evalua-tion was conducted of the effects of the project on landmine-related injuries in the two areas, using an injury surveillance system. Among those severely injured in the areas covered by the project, the mortality rate fell from 40% before the project to 9% afterwards. The project relied on training and some basic supplies and equipment, but did not provide vehicles, such as formal ambulances. Transportation continued to be provided by the existing system of public and private vehicles in each area. Similar pilot programmes have taken place, or are being conducted, involving training for lay “fi rst responders” or others who are not health care professionals but who might have occasion to come upon injured people on a regular basis. They include training for police in Uganda and for the lay public generally in India, though evaluations have not yet been published of these two programmes. Programmes providing fi rst-aid training to the lay public, either generally or to particular popu-lation groups – such as the police, commercial drivers or village health workers – should follow certain principles to help strengthen their impact. For instance, such programmes should:
— base the contents of their training on epide-
140 • WORLD REPORT ON ROAD TRAFFIC INJURY PREVENTION
miological patterns in the particular area in which they are to operate;
— standardize training internationally;— monitor the results;— plan periodic refresher courses, using results
of monitoring to modify the contents of the training.
Access to the emergency medical systemIn low-income countries, the development of the emergency medical system is limited by economic constraints and by the restricted availability of tele-communications. While some low-income coun-tries have started rudimentary ambulance services in urban areas, they are still the exception as far as most of sub-Saharan Africa and southern Asia is concerned (229). International reviews have urged caution in transferring emergency medical systems from high-income countries to low-income coun-tries, questioning whether such actions represent the best use of scarce resources. Another concern is the lack of conclusive evidence on the benefi ts of some Advanced Life Support measures commonly used in high-income areas, such as pre-hospital endotracheal intubation and intravenous fl uid resuscitation (233–235). Further research is clearly needed on the effectiveness and cost-effective-ness of such more advanced measures. Research is equally called for on the role of Basic Life Support training in low-income countries – particularly in rural areas, where there is no formal emergency medical system and it might take days to reach pro-fessional medical care (229). In high-income countries, access to the emer-gency medical system is almost always made by tele-phone, but the coverage and reliability of the telephone link varies between countries. The growth in the use of mobile telephones, even in low-income and middle-income countries, has radically improved emergency access to medical and other assistance. In many countries, there is a standard emergency telephone number that can be dialled for urgent assistance. Uniform codes for emergency assistance, for land telephones and mobile phones, should be set up in all regions of the world.
Emergency rescue servicesPolice and fi refi ghters often arrive at the crash scene before personnel from the emergency medi-cal service. Early intervention by fi refi ghters and rescuers is critical where people are trapped in a vehicle, particularly if it is on fi re or submerged under water. Firefi ghters and police need to be trained, therefore, in basic life support. There should be close cooperation between fi refi ghters and other groups of rescuers, as well as between fi refi ghters and health care providers (225). As mentioned earlier, there are risks associated with ambulance transport, both for those trans-ported by the ambulance as well as people in the street. Safety standards must therefore be established for transportation by ambulance – for instance, on the use of child restraints and adult seat-belts.
The hospital settingThere is growing understanding in high-income countries of the principal components of hospital trauma care and an awareness of what aspects require further research. Many improvements have taken place in trauma care over the last 30 years, largely as a result of new technology and improve-ments in organization (236). Clinical capabilities and staffi ng, equipment and supplies, and trauma care organization are all issues considered by medi-cal experts to be of great importance (225, 237).
Human resourcesTraining for teams managing trauma care is vital. It is generally acknowledged that the standard for such training in high-income countries is the Advanced Trauma Life Support course of the American College of Surgeons (225, 229, 238). The applicability of this course to low-income and middle-income coun-tries, though, has yet to be established. The problems faced by low-income countries in relation to human resources, equipment and the organization of services have already been discussed. Though little has been documented on effective ways to deal with these problems, there is some evidence of successful practice (229). In Trinidad and Tobago, for instance, the introduction of the Advanced Trauma Life Support course for

CHAPTER 4. INTERVENTIONS • 141
doctors and the Pre-Hospital Trauma Life Support course for paramedics, together with improved emergency equipment, led to improvements in trauma care and a decrease in trauma mortality, both in the fi eld and in hospital (239). South Africa (a middle-income country) also runs Advanced Trauma Life Support courses for doctors (240), though a cost–benefi t analysis of this training has not been performed. Several low-income coun-tries in Africa have adapted South Africa’s programme to their own circumstances, which generally include a lack of high-tech equipment and practical diffi culties in referring patients to higher levels of care (236). Apart from short in-service training, there also needs to be more formal, in-depth training. This includes improving the trauma-related training received by doctors, nurses and other profession-als, both in their basic education and in postgradu-ate training.
Physical resourcesMany hospitals in low-income and middle-income countries lack important trauma-related equip-ment, some of which is not expensive. In Ghana, for instance, as mentioned in the previ-ous chapter, a survey of 11 rural hospitals found that none had chest tubes and only four had emergency airway equipment. Such equipment is vital for treating life-threatening chest injuries and airway obstruction, major preventable causes of death in trauma patients. All of it is cheap and much is reusable. The survey suggested that a lack of organization and planning, rather than restricted resources, was to blame (241). Similar defi ciencies have been documented in other countries. In public hospitals in Kenya, shortages of oxygen, blood for transfusion, antiseptics, anaesthet-ics and intravenous fl uids have been recorded (242). Research is urgently needed on this problem. It is important, too, to draw on relevant experience from other fi elds. National blood transfusion centres, for example, with their management of blood for trans-fusions – which involves recruiting suitable donors and collecting blood, screening donated blood for transfusion-transmissible infections, and ensuring that a safe blood supply is constantly available at places throughout the country.
Organization of trauma careA prerequisite for high-quality trauma care in hos-pital emergency departments is the existence of a strategy for the planning, organization and provision of a national trauma system. There is considerable potential worldwide to upgrade arrangements for trauma care and improve training in trauma care at the primary health care level, in district hospitals and in tertiary care hospitals. International guidelines for this, based on research, need to be established. The Essential Trauma Care Project is a collabora-tive effort between the WHO and the International Society of Surgery that aims to improve the plan-ning and organization of trauma care worldwide (243). The project seeks to help individual counties, in developing their own trauma services, to:
— defi ne a core of essential injury treatment services;
— defi ne the human and physical resources necessary to assure such services in the best possible way, given particular economic and geographic contexts;
— develop administrative mechanisms to promote these and related resources on a national and international basis; such mechanisms will include specifi c training programmes, programmes to improve qual-ity and hospital inspections.
While the goals of the Essential Trauma Care Project extend beyond the fi eld of road safety, the success of the project can only be benefi cial for crash-related trauma care.
RehabilitationFor every person who dies in a road traffi c crash, many more are left with permanent disabilities. Rehabilitation services are an essential component of the comprehensive package of initial and post-hos-pital care of the injured. They help to minimize future functional disabilities and restore the injured person to an active life within society. The importance of early rehabilitation has been proved, though best practice in treatment programmes has yet to be identifi ed (225). Most countries need to increase the capacity of their health care systems to provide adequate rehabilitation to survivors of road traffi c crashes.

142 • WORLD REPORT ON ROAD TRAFFIC INJURY PREVENTION
High-quality treatment and interventions for rehabilitation during the period of hospitalization immediately following an injury are of utmost importance, in order to prevent life-threatening complications related to immobilization. However, despite the best management, many people will still become disabled as a consequence of road traffi c crashes. In low-income and middle-income countries, efforts should focus on capacity building and personnel training so as to improve the man-agement of survivors of road traffi c crashes in the acute phase, and thus prevent, as far as possible, the development of permanent disability. Medical rehabilitation services involve profes-sionals from a range of disciplines. These include specialists in physical medicine and rehabilitation, as well as in other medical or paramedical fi elds, such as orthopaedics, neurosurgery and general surgery, physical and occupational therapy, pros-thetics and orthotics, psychology, neuropsychol-ogy, speech pathology and nursing. In every case, the recovery of both the patient’s physical and mental health is paramount, as well as their abil-ity to become independent again and participate in daily life. Medical rehabilitation services also play a vital part in helping those living with disabilities to achieve independence and a good quality of life. Among other things, these services can provide mechanical aids that greatly assist affected indi-viduals to be reintegrated into, and participate in, ordinary daily activities, including their work. Such aids, delivered through outpatient departments or outreach services to the home, are often essential in preventing further deterioration. In many countries, once acute management has been accomplished and mechanical aids provided, community-based rehabilitation remains the only realistic means of reintegrating the individual into society.
ResearchMuch of the research on the effectiveness and cost–benefi ts of interventions takes place in high-income countries. The development of national research capacity is thus an urgent need in many other parts of the world (244, 245). Experience
from high-income countries shows the importance of having at least one – preferably independent – national organization receiving solid core fund-ing that deals with road safety research. Encouraging the development of professional expertise across a range of disciplines at national level, together with regional cooperation and exchange of information, have reaped much ben-efi t in industrialized countries. Developing these mechanisms should be a priority where they do not exist. Among the many research-related needs for road injury prevention, the following are some of the more pressing:
• Better collection and analysis of data, so as to enable more reliable estimates to be made of the global burden of road traffi c injuries, especially in low-income and middle-income countries. This includes mortality data, conforming to internationally-standardized defi nitions, and data on acute morbidity and long-term disability. There should also be more research to fi nd low-cost methods of obtaining these data.
• Further data on the economic and social impacts of road traffi c injuries, especially in low-income and middle-income countries. There is a considerable lack of economic analysis in the fi eld of road injury prevention in these countries. The cost of injuries is not known empirically, neither are the cost nor cost-effectiveness of interventions.
• Studies demonstrating the effectiveness of specifi c interventions for injuries in low-income and middle-income countries.
• Design standards and guidelines for intercity roads carrying mixed traffi c.
The following areas require particular research:— how best to assess the effectiveness of pack-
ages of road safety measures combining different actions, such as area-wide traffi c calming and urban design;
— the interaction between transport planning and urban and regional planning, and how these affect road safety;
— the design of roads and traffi c management, taking into account traffi c environments and
CHAPTER 4. INTERVENTIONS • 143
traffi c mixes encountered in low-income and middle-income countries;
— how successfully various types of preventive measures can be transferred between coun-tries with differing socioeconomic condi-tions and differing rates of motorization and traffi c mixes.
Research in low-income and middle-income countries needs to be carried out on a regional basis towards developing the following:
— light, well-ventilated motorcycle helmets;— safer bus and truck fronts;— standards for motorcycle crash protection;— the visibility and crash protection of indig-
enously-designed vehicles. Improvements in post-impact care at an afford-able cost are a priority area for the health sector. Equally important is research to better understand the mechanisms causing head injury and whiplash injury in road crashes, and treatments for these injuries. There is currently, for instance, no effec-tive pharmacological treatment for head injury. In all countries, further research is required into managing exposure to risk – the least-used injury prevention strategy. It is also essential to resolve the growing incompatibility in many places between smaller, lighter vehicles and larger, heavier ones.
ConclusionSubstantial research and development over the last 30 years have proved that a range of interventions exist to prevent road crashes and injury. The gap, though, between what is known to be effective and what is actually practised is often considerable. As with other areas of public health, road injury pre-vention requires effective management to put in place sustainable, evidence-based measures, over-coming obstacles to their implementation. Good transport and land-use policies offer a means of reducing the exposure to risk for road crash injury. Safety-conscious planning and design of the road network can minimize the risk of crashes and crash injury. Crash-protective features on a vehicle can save lives and reduce injuries for road users, both inside and outside the vehicle. Compliance with key road safety rules can be signifi -
cantly increased using a combination of legislation, enforcement of the laws, and information and edu-cation. The availability of good quality emergency care can save lives, and greatly reduce the severity and long-term consequences of road injuries. A large proportion of road traffi c injuries in low-income and middle-income countries occur among vulnerable road users. An important priority must therefore be to introduce a wide range of measures that give these road users greater protection. All the prevention strategies described in this report call for a wide mobilization of effort, at all levels, involving close collaboration across many disciplines and sec-tors, prominent among which is the health sector. Despite many attempts to fi nd and document examples of “good practice” in road safety in developing countries, such examples seem to be few. This chapter, therefore, remains slanted to a description of what has been successful in highly-motorized countries. This is not to say that the interventions presented in this chapter will not work in low-income or middle-income countries – indeed, many of them do. There needs, though, to be further testing of prevention strategies, to fi nd ways to adapt them to local conditions – and not merely to adopt and apply them unchanged.
References1. Bolen J et al. Overview of efforts to prevent motor
vehicle-related injury. In: Bolen J, Sleet DA, John-son V, eds. Prevention of motor vehicle-related injuries: a compendium of articles from the Morbidity and Mortality Weekly Report, 1985–1996. Atlanta, GA, Centers for Disease Control and Prevention, 1997.
2. Dora C, Phillips M, eds. Transport, environment and health. Copenhagen, World Health Organization Regional Offi ce for Europe, 2000 (European Series No. 89)(http://www.who.dk/document/e72015.pdf, accessed 17 November 2003).
3. Evans L. The new traffi c safety vision for the United States. American Journal of Public Health,2003, 93:1384–1386.
4. Koornstra M et al. Sunfl ower: a comparative study of the development of road safety in Sweden, the United King-dom and the Netherlands. Leidschendam, Institute for Road Safety Research, 2002.

144 • WORLD REPORT ON ROAD TRAFFIC INJURY PREVENTION
5. Rumar K. Transport safety visions, targets and strate-gies: beyond 2000. Brussels, European Transport Safety Council, 1999 (1st European Transport Safety Lecture) (http://www.etsc.be/eve.htm, accessed 30 October 2003).
6. Litman T. If health matters: integrating public health objectives in transportation planning. Victoria, BC, Victoria Transport Policy Institute, 2003 (http://www.vtpi.org/health.pdf, accessed 4 December 2003).
7. Rodriguez DY, Fernandez FJ, Velasquez HA. Road traffi c injuries in Colombia. Injury Control and Safety Promotion, 2003, 10:29–35.
8. TransMilenio. A high capacity/low cost bus rapid transit system developed for Bogotá, Colombia. Bogotá, Trans-Milenio SA, 2001.
9. Hummel T. Land use planning in safer transportation network planning. Leidschendam, Institute for Road Safety Research, 2001 (SWOV Report D-2001-12).
10. Ross A et al., eds. Towards safer roads in developing coun-tries. A guide for planners and engineers. Crowthorne, Transport Research Laboratory, 1991.
11. Aeron-Thomas A et al. A review of road safety management and practice. Final report. Crowthorne, Transport Research Laboratory and Babtie Ross Silcock, 2002 (TRL Report PR/INT216/2002).
12. Allsop R. Road safety audit and safety impact assessment.Brussels, European Transport Safety Council, 1997.
13. Wegman FCM et al. Road safety impact assess-ment. Leidschendam, Institute for Road Safety Research, 1994 (SWOV Report R-94-20).
14. Hummel T. Route management in safer transportation network planning. Leidschendam, Institute for Road Safety Research, 2001 (SWOV Report D-2001-11).
15. Allsop RE, ed. Safety of pedestrians and cyclists in urban areas. Brussels, European Transport Safety Council, 1999 (http://www.etsc.be/rep.htm, accessed 17 November 2003).
16. Elvik R, Vaa T. Handbook of road safety measures.Amsterdam, Elsevier, in press.
17. Forjuoh SN. Traffi c-related injury prevention interventions for low income countries. Injury Control and Safety Promotion, 2003, 10:109–118.
18. Hijar M, Vasquez-Vela E, Arreola-Rissa C. Pedestrian traffi c injuries in Mexico. Injury Con-trol and Safety Promotion, 2003, 10:37–43.
19. Mutto M, Kobusingye OC, Lett RR. The effect of an overpass on pedestrian injuries on a major highway in Kampala, Uganda. African Health Science, 2002, 2:89–93.
20. Litman T. Distance-based vehicle insurance: feasibility, costs and benefi ts. Comprehensive Technical Report. Victo-ria, BC, Victoria Transport Policy Institute, 2000 (http://www.vtpi.org/dbvi_com.pdf, accessed 5 December 2003).
21. Edlin AS. Per-mile premiums for auto insurance. Berke-ley, CA, Department of Economics, University of California, 2002 (Working Paper E02-318) (http://repositories.cdlib.org/iber/econ/E02-318, accessed 5 December 2003).
22. PROMISING. Promotion of mobility and safety of vulner-able road users. Leidschendam, Institute for Road Safety Research, 2001.
23. Mohan D, Tiwari G. Road safety in low-income countries: issues and concerns regarding tech-nology transfer from high-income countries. In: Refl ections on the transfer of traffi c safety knowledge to motorising nations. Melbourne, Global Traffi c Safety Trust, 1998:27–56.
24. Mayhew DR, Simpson HM. Motorcycle engine size and traffi c safety. Ottawa, Traffi c Injury Research Foundation of Canada, 1989.
25. Broughton J. The effect on motorcycling of the 1981 Transport Act. Crowthorne, Transport and Road Research Laboratory, 1987 (Research Report No. 106).
26. Trinca GW et al. Reducing traffi c injury: the global challenge. Melbourne, Royal Australasian College of Surgeons, 1988.
27. Motorcycling safety position paper. Birmingham, Royal Society for the Prevention of Accidents, 2001.
28. Norghani M et al. Use of exposure control methods to tackle motorcycle accidents in Malaysia. Serdang, Road Safety Research Centre, Universiti Putra Malay-sia, 1998 (Research Report 3/98).
29. Williams AF. An assessment of graduated licensing legislation. In: Proceedings of the 47th Association for the Advancement of Automotive Medicine (AAAM) conference, Lisbon, Portugal, 22–24 September 2003. Washington, DC, Association for the
CHAPTER 4. INTERVENTIONS • 145
Advancement of Automotive Medicine, 2003:533–535.
30. Waller P. The genesis of GDL. Journal of Safety Research, 2003, 34:17–23.
31. Williams AF, Ferguson SA. Rationale for grad-uated licensing and the risks it should address. Injury Prevention, 2002, 8:9–16.
32. Graduated driver licensing model law, approved October 24, 1996, by NCUTLO membership (revised 1999, 2000). National Committee on Uniform Traffi c Laws and Ordinances, 2000 (http://www.ncutlo.org/gradlaw2.html, accessed 11 December 2003).
33. Licensing systems for young drivers, as of December 2003. Insurance Institute for Highway Safety/Highway Loss Data Institute, 2003 (http://www.highwaysafety.org/safety_facts/state_laws/grad_license.htm, accessed 11 December 2003).
34. Shope JT, Molnar LJ. Graduated driver licens-ing in the United States: evaluation results from the early programs. Journal of Safety Research,2003, 34:63–69.
35. Simpson HM. The evolution and effectiveness of graduated licensing. Journal of Safety Research,2003, 34:25–34.
36. Begg D, Stephenson S. Graduated driver licens-ing: the New Zealand experience. Journal of Safety Research, 2003, 34:99–105.
37. Foss R, Goodwin A. Enhancing the effective-ness of graduated driver licensing legislation. Journal of Safety Research, 2003, 34:79–84.
38. Wegman F, Elsenaar P. Sustainable solutions to improve road safety in the Netherlands. Leidschen-dam, Institute for Road Safety Research, 1997 (SWOV Report D-097-8).
39. Ogden KW. Safer roads: a guide to road safety engineer-ing. Melbourne, Ashgate Publishing Ltd, 1996.
40. Cities on the move: a World Bank urban strategy review.Washington, DC, The World Bank, 2002.
41. Handboek: categorisering wegen op duurzaam veilige basis. Deel I (Voorlopige): functionele en operationele eisen [Handbook: categorizing roads on long-lasting safe basis. Part I (Provisional): functional and operational demands].Ede, Stichting centrum voor regelgeving en onderwoek in de grond-, water- en wegen-bouw en de verkeerstechniek, 1997 (CROW Report 116).
42. Zone guide for pedestrian safety shows how to make systematic improvements. Washington, DC, National Highway Traffi c Safety Administration, 1998 (Technol-ogy Transfer Series Number 181) (http://www.nhtsa.dot.gov/people/outreach/traftech/pub/tt181.html, accessed 5 December 2003).
43. Towards a sustainable safe traffi c system in the Nether-lands. Leidschendam, Institute for Road Safety Research, 1993.
44. Ville plus sûr, quartiers sans accidents: realisations; evaluations [Safer city, districts without accidents: achieve-ments; evaluations]. Lyon, Centre d’études sur les réseaux, les transports, l’urbanisme et les con-structions publiques, 1994.
45. Safety strategies for rural roads. Paris, Organisation for Economic Co-operation and Development, 1999 (http://www.oecd.org/dataoecd/59/2/2351720.pdf, accessed 17 December 2003).
46. Afukaar FK, Antwi P, Ofosu-Amah S. Pattern of road traffi c injuries in Ghana: implications for control. Injury Control and Safety Promotion,2003, 10:69–76.
47. Safety of vulnerable road users. Paris, Organisation for Economic Co-operation and Development, 1998 (DSTI/DOT/RTR/RS7(98)1/FINAL) (http://www.oecd.org/dataoecd/24/4/2103492.pdf, accessed 17 November 2003).
48. Ossenbruggen PJ, Pendharkar J, Ivan J. Road-way safety in rural and small urbanized areas. Accident Analysis and Prevention, 2001, 33:485–498.
49. Khan FM et al. Pedestrian environment and behavior in Karachi, Pakistan. Accident Analysis and Prevention, 1999, 31:335–339.
50. Herrstedt L. Planning and safety of bicycles in urban areas. In: Proceedings of the Traffi c Safety on Two Continents Conference, Lisbon, 22–24 September 1997. Linköping, Swedish National Road and Transport Research Institute, 1997:43–58.
51. Kjemtrup K, Herrstedt L. Speed management and traffi c calming in urban areas in Europe: a historical view. Accident Analysis and Prevention, 1992, 24:57–65.
52. Brilon W, Blanke H. Extensive traffi c calming: results of the accident analyses in six model towns. In: ITE 1993 Compendium of Technical Papers.Washington, DC, Institute of Transportation Engineers, 1993:119–123.
146 • WORLD REPORT ON ROAD TRAFFIC INJURY PREVENTION
53. Herrstedt L et al. An improved traffi c environment.Copenhagen, Danish Road Directorate, 1993 (Report No. 106).
54. Guidelines for urban safety management. London, Insti-tution of Highways and Transportation, 1990.
55. Lines CJ, Machata K. Changing streets, pro-tecting people: making roads safer for all. In: Proceedings of the Best in Europe Conference, Brussels, 12 September 2000. Brussels, European Transport Safety Council, 2000:37–47.
56. Elvik R. Cost-benefi t analysis of safety measures for vulnerable and inexperienced road users. Oslo, Institute of Transport Economics, 1999 (EU Project PROMISING, TØI Report 435/1999).
57. Bunn F et al. Traffi c calming for the preven-tion of road traffi c injuries: systematic review and meta-analysis. Injury Prevention, 2003, 9:200–204.
58. Guidelines for the safety audit of roads and road project in Malaysia. Kuala Lumpur, Roads Branch, Public Works Department, 1997.
59. Guidelines for road safety audit. London, Institution of Highways and Transportation, 1996.
60. Road safety audit, 2nd ed. Sydney, Austroads, 2002.61. Macaulay J, McInerney R. Evaluation of the proposed
actions emanating from road safety audits. Sydney, Austroads, 2002 (Austroads Publication No. AP-R209/02).
62. Accident countermeasures: literature review. Wellington, Transit New Zealand, 1992 (Research Report No. 10).
63. Schelling A. Road safety audit, the Danish experience. In: Proceedings of the Forum of European Road Safety Research Institutes (FERSI) International Conference on Road Safety in Europe and Strategic Highway Research Program, Prague, September 1995. Linköping, Swedish National Road and Transport Research Institute, 1995:1–8.
64. Roadside obstacles. Paris, Organisation for Eco-nomic Co-operation and Development, 1975.
65. Forgiving roadsides. Brussels, European Transport Safety Council, 1998 (http://www.etsc.be/bri_road5.pdf, accessed 10 December 2003).
66. Cirillo JA, Council FM. Highway safety: twenty years later. Transportation Research Record, 1986, 1068:90–95.
67. Ross HE et al. Recommended procedures for the safety performance evaluation of highway features. Wash-ington, DC, National Co-operative Highway Research Program, 1993 (Report No. 350).
68. Carlsson A, Brüde U. Utvärdering av mötesfri väg [Evaluation of roads designed to prevent head-on crashes].Linköping, Swedish National Road and Trans-port Research Institute, 2003 (VTI Report No. 45-2003)(http://www.vti.se/PDF/reports/N45-2003.pdf, accessed 10 December 2003).
69. Research on loss of control accidents on Warwickshire motorways and dual carriageways. Coventry, TMS Consultancy, 1994.
70. Elvik R, Rydningen U. Effektkatalog for trafi kk-sikkerhetstiltak. [A catalogue of estimates of effects of road safety measures]. Oslo, Institute of Transport Eco-nomics, 2002, (TØI Report 572/2002) (http://www.toi.no/toi_Data/Attachments/909/r572_02.pdf, accessed 17 December 2003).
71. Allsop RE, ed. Low cost road and traffi c engineering measures for casualty reduction. Brussels, European Transport Safety Council, 1996.
72. Koornstra M, Bijleveld F, Hagenzieker M. Thesafety effects of daytime running lights. Leidschen-dam, Institute for Road Safety Research, 1997 (SWOV Report R-97-36).
73. Farmer CM, Williams AF. Effect of daytime running lights on multiple vehicle daylight crashes in the United States. Accident Analysis and Prevention, 2002, 34:197–203.
74. Hollo P. Changes in the legislation on the use of daytime running lights by motor vehicles and their effect on road safety in Hungary. Accident Analysis and Prevention, 1998, 30:183–199.
75. Cost-effective EU transport safety measures. Brussels, European Transport and Safety Council, 2003 (http://www.etsc.be/costeff.pdf, accessed 10 December 2003).
76. Zador PL. Motorcycle headlight-use laws and fatal motorcycle crashes in the US, 1975–1983. American Journal of Public Health, 1985, 75:543–546.
77. Yuan W. The effectiveness of the “ride bright” legislation for motorcycles in Singapore. Acci-dent Analysis and Prevention, 2000, 32:559–563.
78. Radin Umar RS, Mackay MG, Hills BL. Model-ling of conspicuity-related motorcycle acci-

CHAPTER 4. INTERVENTIONS • 147
dents in Seremban and Shah Alam, Malaysia. Accident Analysis and Prevention, 1996, 28:325–332.
79. Mohan D, Patel R. Development and promo-tion of a safety shopping bag vest in developing countries. Applied Ergonomics, 1990, 21:346–347.
80. Kwan I, Mapstone J. Interventions for increas-ing pedestrian and cyclist visibility for the pre-vention of death and injuries. Cochrane Database of Systematic Reviews, 2002, (2):CD003438.
81. NHTSA vehicle safety rulemaking priorities and supporting research, 2003–2006. Washington, DC, National Highway Traffi c Safety Administration, 2003 (Docket No. NHTSA-2003-15505)(http://www.nhtsa.dot.gov/cars/rules/rulings/PriorityPlan/FinalVeh/Index.html, accessed 10 December 2003).
82. Mackay GM, Wodzin E. Global priorities for vehicle safety. In: International Conference on Vehicle Safety 2002: IMechE conference transactions. London, Institution of Mechanical Engineers, 2002:3–9.
83. Priorities for EU motor vehicle safety design. Brussels, European Transport Safety Council, Vehicle Safety Working Party, 2001.
84. Broughton J et al. The numerical context for set-ting national casualty reduction targets. Crowthorne, Transport Research Laboratory Ltd, 2000 (TRL Report No. 382).
85. Road safety strategy 2010. Wellington, National Road Safety Committee, Land Transport Safety Authority, 2000.
86. Reducing traffi c injuries through vehicle safety improve-ments: the role of car design. Brussels, European Transport Safety Council, 1993.
87. European Road Safety Action Programme. Halving the number of road accident victims in the European Union by 2010: a shared responsibility. Brussels, Com-mission of the European Communities, 2003 (Com(2003) 311 fi nal)(http://europa.eu.int/comm/transport/road/roadsafety/rsap/index_en.htm, accessed 17 November 2003).
88. O’Neill B, Mohan D. Reducing motor vehicle crash deaths and injuries in newly motoris-ing countries. British Medical Journal, 2002, 324:1142–1145.
89. Road safety committee inquiry into road safety for older road users. Melbourne, Parliament of Victoria, 2003 (Parliamentary Paper No, 41, Session 2003).
90. Pritz HB. Effects of hood and fender design on pedestrian head protection. Washington, DC, National Highway Traffi c Safety Administration, 1984 (NHTSA Report No. DOT HS-806-537).
91. Bly PH. Vehicle engineering to protect vulner-able road users. Journal of Traffi c Medicine, 1990, 18:244.
92. Proposals for methods to evaluate pedestrian protection for passenger cars. European Enhanced Vehicle-safety Committee, EEVC Working Group 10, 1994.
93. Crandall JR, Bhalla KS, Madely J. Designing road vehicles for pedestrian protection. British Medical Journal, 2002, 324:1145–1148.
94. Hobbs A. Safer car fronts for pedestrians and cyclists.Brussels, European Transport Safety Council, 2001 (http://www.etsc.be/pre_06feb01.pdf, accessed 9 December 2003).
95. Improved test methods to evaluate pedestrian protection afforded by passenger cars. European Enhanced Vehi-cle-safety Committee, EEVC Working Group 17, 1998 (http://www.eevc.org/publicdocs/WG17_Improved_test_methods_updated_sept_2002.pdf, accessed 4 December 2003).
96. Tomorrow’s roads: safer for everyone. London, Depart-ment of Environment, Transport and the Regions, 2000.
97. Lawrence GJL, Hardy BJ, Donaldson WMS. Costs and benefi ts of the Honda Civic’s pedestrian protection, and ben-efi ts of the EEVC and ACEA test proposals. Crowthorne, Transport Research Laboratory, 2002 (Unpub-lished Project Report PR SE/445/02).
98. Allsop R. Road safety: Britain in Europe. London, Parliamentary Advisory Council for Trans-port Safety, 2001 (http://www.pacts.org.uk/richardslecture.htm, accessed 30 October 2003).
99. Preliminary report on the development of a global technical regulation concerning pedestrian safety. United Nations Economic Commission for Europe, 2003 (Trans/WP.29/2003/99, 26 August 2003) (http://www.unece.org/trans/main/welcwp29.htm, accessed 22 December 2003).
100.Roberts I, Mohan D, Abbasi K. War on the roads. British Medical Journal, 2002, 324:1107–1108.
101. Chawla A et al. Safer truck front design for pedestrian impacts. Journal of Crash Prevention and Injury Control, 2000, 2:33–43.
148 • WORLD REPORT ON ROAD TRAFFIC INJURY PREVENTION
102. Kajzer J, Yang JK, Mohan D. Safer bus fronts for pedestrian impact protection in bus-pedes-trian accidents. In: Proceedings of the International Research Council on the Biomechanics of Impact (IRCOBI) Conference, Verona, Italy, 9–11 September 1992. Bron, International Research Council on the Biome-chanics of Impact, 1992:13–23.
103. What is frontal offset crash testing? Arlington, VA, Insurance Institute for Highway Safety/ Highway Loss Data Institute, 2003 (http://www.iihs.org/vehicle_ratings/ce/offset.htm, accessed 10 December 2003).
104.Edwards MJ et al. Review of the frontal and side impact directives. In: Vehicle Safety 2000, Institute of Mechanical Engineers Conference, London, 7–9 June 2000. London, Professional Engineering Publishing Limited, 2000.
105. Parkin S, Mackay GM, Frampton RJ. Effec-tiveness and limitations of current seat belts in Europe. Chronic Diseases in Canada, 1992, 14:38–46.
106.Cummings P et al. Association of driver air bags with driver fatality: a matched cohort study. British Medical Journal, 2002, 324:1119–1122.
107. Ferguson SA, Lund AK, Greene MA. Driver fatali-ties in 1985–94 airbag cars. Arlington, VA, Insur-ance Institute for Highway Safety/Highway Loss Data Institute, 1995.
108.Fifth/sixth report to Congress: effectiveness of occupant protection systems and their use. Washington, DC, National Highway Traffi c Safety Administra-tion, 2001 (DOT-HS-809-442) (http://www-nrd.nhtsa.dot.gov/pdf/nrd-30/NCSA/Rpts/2002/809-442.pdf, accessed 10 December 2003).
109. Collision and consequence. Borlänge, Swedish National Road Administration, 2003 (http://www.vv.se/for_lang/english/publications/C&C.pdf, accessed 10 December 2003).
110. Initiatives to address vehicle compatibility. Washington, DC, National Highway Traffi c Safety Adminis-tration, 2003 (http://www-nrd.nhtsa.dot.gov/departments/nrd-11/aggressivity/IPTVehicleCom-patibilityReport/, accessed 22 December 2003).
111. Knight I. A review of fatal accidents involving agricultural vehicles or other commercial vehicles not classifi ed as a goods vehi-
cle, 1993 to 1995. Crowthorne, Transport Research Laboratory, 2001 (TRL Report No. 498).
112. Schoon CC. Invloed kwaliteit fi ets op ongevallen [The infl uence of cycle quality on crashes]. Leidschendam, Institute for Road Safety Research, 1996 (SWOV Report R-96-32).
113. Road safety: impact of new technologies. Paris, Organi-sation for Economic Co-operation and Devel-opment, 2003.
114. Intelligent transportation systems and road safety. Brus-sels, European Transport Safety Council, Working Party of Road Transport Telemat-ics, 1999 (http://www.etsc.be/systems.pdf, accessed 10 December 2003).
115. Westefeld A, Phillips BM. Effectiveness of vari-ous safety belt warning systems. Washington, DC, National Highway Traffi c Safety Administra-tion, 1976 (DOT-HS-801-953).
116. Lie A, Tingvall C. Governmental status report, Swe-den. In: Proceedings of the 18th Experimental Safety of Vehicles Conference, Nagoya, Japan, 19–22 May 2003. Washington, DC, National Highway Traffi c Safety Administra-tion, 2003 (http://www-nrd.nhtsa.dot.gov/pdf/nrd-01/esv/esv18/CD/Files/18ESV-000571.pdf, accessed 10 December 2003).
117. Larsson J, Nilsson, G. Bältespåminnare: en lönsam trafi ksäkerhetsåtgärd? [Seat-belt reminders: benefi cial for society?]. Linköping, Swedish National Road and Transport Research Institute, 2000 (VTI Report 62-2000).
118. Williams AF, Wells JK, Farmer CM. Effective-ness of Ford’s belt reminder system in increas-ing seat belt use. Injury Prevention, 2002, 8:293–296.
119. Williams AF, Wells JK. Drivers’ assessment of Ford’s belt reminder system. Traffi c Injury Preven-tion, 2003, 4:358–362.
120. Buckling up technologies to increase seat belt use. Wash-ington, DC, Committee for the Safety Belt Technology Study, The National Academies, in press (Special Report 278).
121. Fildes B et al. Benefi ts of seat belt reminder systems.Canberra, Australian Transport Safety Bureau, 2003 (Report CR 211).
122. Carsten O, Fowkes M, Tate F. Implementing intelligent speed adaptation in the United Kingdom: recommendations

CHAPTER 4. INTERVENTIONS • 149
of the EVSC project. Leeds, Institute of Transport Studies, University of Leeds, 2001.
123. Marques PR et al. Support services provided during interlock usage and post-interlock repeat DUI: outcomes and processes. In: Lau-rell H, Schlyter F, eds. Proceedings of the 15th Inter-national Conference on Alcohol, Drugs and Traffi c Safety, Stockholm, 22–26 May 2000. Stockholm, Swedish National Road Administration, 2000 (http://www.vv.se/traf_sak/t2000/908.pdf, accessed 12 December 2003).
124. ICADTS working group on alcohol inter-locks. Alcohol ignition interlock devices. I: Position paper. Ottawa, International Council on Alco-hol, Drugs and Traffi c Safety, 2001 (http://www.icadts.org/reports/AlcoholInterlockReport.pdf, accessed 17 December 2003).
125. Tingvall C et al. The effectiveness of ESP (elec-tronic stability programme) in reducing real life accidents. In: Proceedings of the 18th Experimental Safety of Vehicles Conference, Nagoya, Japan, 19–22 May 2003. Washington, DC, National Highway Traffi c Safety Administration, 2003 (http://www-nrd.nhtsa.dot.gov/pdf/nrd-01/esv/esv18/CD/Files/18ESV-000261.pdf, accessed 12 December 2003).
126. Zaal D. Traffi c law enforcement: a review of the lit-erature. Melbourne, Monash University Accident Research Centre, 1994 (Report No. 53) (http://www.general.monash.edu.au/muarc/rptsum/muarc53.pdf, accessed 12 December 2003).
127. Redelmeier DA, Tibshirani RJ, Evans L. Traf-fi c-law enforcement and risk of death from motor-vehicle crashes: case-crossover study. Lancet, 2003, 361:2177–2182.
128. Police enforcement strategies to reduce traffi c casualties in Europe. Brussels, European Transport Safety Coun-cil, Working Party on Traffi c Regulation Enforce-ment, 1999 (http://www.etsc.be/strategies.pdf, accessed 12 December 2003).
129. Finch DJ et al. Speed, speed limits and accidents.Crowthorne, Transport Research Laboratory Ltd, 1994 (Project Report 58).
130. Reducing injuries from excess and inappropriate speed.Brussels, European Transport Safety Council, Working Party on Road Infrastructure, 1995.
131. Leggett LMW. The effect on accident occurrence of long-term, low-intensity police enforcement. In: Proceedings of the 14th Conference of the Australian Road Research Board, Canberra. Canberra, Australian Road Research Board, 1988, 14:92–104.
132. Keall MD, Povey LJ, Frith WJ. The relative effectiveness of a hidden versus a visible speed camera programme. Accident Analysis and Preven-tion, 2001, 33:277–284.
133. Yang BM, Kim J. Road traffi c accidents and policy interventions in Korea. Injury Control and Safety Promotion, 2003, 10:89–94.
134. Gains A et al. A cost recovery system for speed and red light cameras: two year pilot evaluation.London, Department for Transport, 2003 (http://www.dft.gov.uk/stellent/groups/dft_rdsafety/documents/page/dft_rdsafety_507639.pdf, accessed 12 December 2003) .
135. Mäkinen T, Oei HL. Automatic enforcement of speed and red light violations: applications, experiences and developments. Leidschendam, Institute for Road Safety Research, 1992 (Report R-92-58).
136. Brekke G. Automatisk trafi kkontroll: har spart Bergen for 40 personskadeulykker [Automatic traffi c control: 40 cases of bodily injury averted in Bergen]. In: Veg i Vest [Roads in Western Norway].Bergen, Norwegian National Road Authority, 1993, 3:6–7.
137. Elvik R, Mysen AB, Vaa T. Trafi kksikkerhetshåndbok,tredje utgave [Handbook of traffi c safety, 3rd ed]. Oslo, Institute of Transport Economics, 1997.
138. Mann RE et al. The effects of introducing or lowering legal per se blood alcohol limits for driving: an international review. Accident Analysis and Prevention, 2001, 33:569–583.
139. Compton RP et al. Crash risk of alcohol impaired driving. In: Mayhew DR, Dussault C, eds. Proceedings of the 16th International Conference on Alcohol, Drugs and Traf-fi c Safety, Montreal, 4–9 August 2002. Montreal, Société de l’assurance automobile du Québec, 2002:39–44 (http://www.saaq.gouv.qc.ca/t2002/actes/pdf/(06a).pdf, accessed 17 November 2003).
140. Stewart K et al. International comparisons of laws and alcohol crash rates: lessons learned. In: Laurell H, Schlyter F, eds. Proceedings of the 15th International Conference on Alcohol, Drugs and Traffi c Safety,

150 • WORLD REPORT ON ROAD TRAFFIC INJURY PREVENTION
Stockholm, 22–26 May 2000, Stockholm, Swedish National Road Administration, 2000 (http://www.vv.se/traf_sak/t2000/541.pdf, accessed 17 November 2003).
141. Davis A et al. Improving road safety by reducing impaired driving in LMICs: a scoping study. Crowthorne, Transport Research Laboratory, 2003 (Project Report 724/03).
142. Assum T. Road safety in Africa: appraisal of road safety initiatives in fi ve African countries. Washington, DC, The World Bank and United Nations Economic Commission for Africa, 1998 (Working Paper No. 33).
143. Howat P, Sleet DA, Smith DI. Alcohol and driv-ing: is the 0.05 blood alcohol concentration limit justifi ed? Drug and Alcohol Review, 1991, 10:151–166.
144.Jonah B et al. The effects of lowering legal blood alcohol limits for driving: a review. In: Laurell H, Schlyter F, eds. Proceedings of the 15th International Conference on Alcohol, Drugs and Traffi c Safety, Stockholm, 22–26 May 2000. Stockholm, Swedish National Road Administration, 2000 (http://www.vv.se/traf_sak/t2000/522.pdf, accessed 15 December 2003).
145. Shults RA et al. Reviews of evidence regarding interventions to reduce alcohol-impaired driving. American Journal of Preventive Medicine, 2001, 21:66–88.
146.Miller TR, Lestina DC, Spicer RS. Highway crash costs in the United States by driver age, blood alcohol level, victim age and restraint use. Acci-dent Analysis and Prevention, 1998, 30:137–150.
147. Sweedler BM. Strategies for dealing with the persistent drinking driver. In: Proceedings of the 13th International Conference on Alcohol, Drugs and Traf-fi c Safety, Adelaide, 13–18 August 1995. Adelaide, University of Adelaide, Road Accident Research Unit, 1995 (http://casr.adelaide.edu.au/T95/paper/s1p3.html, accessed 16 December 2003).
148. Homel RJ. Random breath testing in Australia: a complex deterrent. Australian Drug and Alcohol Review, 1988, 7:231–241.
149. Elder RW et al. Effectiveness of sobriety check-points for reducing alcohol-involved crashes. Traffi c Injury Prevention, 2002, 3:266–274.
150. Eckhardt A, Seitz E. Wirtschaftliche Bewertung von Sicherheitsmassnahmen [Economic elaboration of safety
measures]. Berne, Swiss Council for Accident Prevention, 1998 (Report No. 35).
151. Arthurson RM. Evaluation of random breath testing.Sydney, New South Wales Traffi c Authority, 1985 (Report RN 10/85).
152. Camkin HL, Webster KA. Cost-effectiveness and pri-ority ranking of road safety measures. Roseberry, New South Wales Traffi c Authority, 1988 (Report RN 1/88).
153. Stuster JW, Blowers PA. Experimental evaluation of sobriety checkpoint programs. Washington, DC, National Highway Traffi c Safety Administra-tion, 1995 (DOT HS-808-287).
154. Miller TR, Galbraith MS, Lawrence BA. Costs and benefi ts of a community sobriety check-point program. Journal of Studies on Alcohol, 1998, 59:462–468.
155. Elder RW et al. Effectiveness of mass media cam-paigns for reducing drinking and driving and alcohol-involved crashes: a systematic review. American Journal of Preventive Medicine, in press.
156. Guria J, Leung J. An evaluation of a supple-mentary road safety package. In: 25th Austral- asian Transport Research Forum, Canberra, 2–4 October 2002 (http://www.btre.gov.au/docs/atrf_02/papers/36GuriaLeung.doc, accessed 7 January 2004).
157. Ross HL. Punishment as a factor in preventing alcohol-related accidents. Addiction, 1993, 88:997–1002.
158. Reducing injuries from alcohol impairment. Brussels, European Transport Safety Council, 1995.
159. Wells-Parker E et al. Final results from a meta-analysis of remedial interventions with drink/drive offenders. Addiction, 1995, 90:907–926.
160. Maycock G. Driver sleepiness as a factor in cars and HGV accidents. Crowthorne, Transport Research Laboratory Ltd, 1995 (Report No. 169).
161. The role of driver fatigue in commercial road trans-port crashes. Brussels, European Transport Safety Council, 2001 (http://www.etsc.be/drivfatigue.pdf, accessed 15 December 2003).
162. Drowsy driving and automobile crashes: report and recom-mendations. Washington, DC, National Center on Sleep Disorder Research and National Highway Traffi c Safety Administration, Expert Panel

CHAPTER 4. INTERVENTIONS • 151
on Driver Fatigue and Sleepiness, 1996 (http://www.nhlbi.nih.gov/health/prof/sleep/drsy_drv.pdf, accessed 15 December 2003).
163. Hartley LR et al. Comprehensive review of fatigue research. Fremantle, Murdoch University, Insti-tute for Research in Safety and Transport, 1996 (http://www.psychology.murdoch.edu.au/irst/publ/Comprehensive_Review_of_Fatigue_Research.pdf, accessed 15 December 2003).
164. Mock C, Amegeshi J, Darteh K. Role of com-mercial drivers in motor vehicle related injuries in Ghana. Injury Prevention, 1999, 5:268–271.
165. Nantulya VM, Muli-Musiime F. Uncovering the social determinants of road traffi c acci-dents in Kenya. In: Evans T et al., eds. Challeng-ing inequities: from ethics to action. Oxford, Oxford University Press, 2001:211–225.
166. Nafukho FM, Khayesi M. Livelihood, condi-tions of work, regulation and road safety in the small-scale public transport sector: a case of the Matatu mode of transport in Kenya. In: Godard X, Fatonzoun I, eds. Urban mobility for all. Proceedings of the Tenth International CODATU Confer-ence, Lome, Togo, 12–15 November 2002. Lisse, AA Balkema Publishers, 2002:241–245.
167. Morris JR. External accident costs and freight transport effi ciency. In: Saccomanno F, Short-reed J, eds. Truck safety: perceptions and reality. Water-loo, Institute for Risk Research, 1996.
168. Hamelin P. Lorry drivers’ time habits in work and their involvement in traffi c accidents. Ergo-nomics, 1987, 30:1323–1333.
169. South DR et al. Evaluation of the red light camera programme and the owner onus legislation. Melbourne, Traffi c Authority, 1988.
170. Red light cameras yield big reductions in crashes and injuries. Status Report, 2001, 36:1–8.
171. Hooke A, Knox J, Portas D. Cost benefi t analysis of traffi c light and speed cameras. London, Home Offi ce, Police Research Group, 1996 (Police Research Series Paper 20).
172. Seat-belts and child restraints: increasing use and optimis-ing performance. Brussels, European Transport Safety Council, 1996.
173. Heiman L. Vehicle occupant protection in Australia. Can-berra, Australian Transport Safety Bureau, 1988.
174. Ashton SJ, Mackay GM, Camm S. Seat belt use in Britain under voluntary and mandatory con-ditions. In: Proceedings of the 27th Conference of the American Association for Automotive Medicine (AAAM).Chicago, IL, American Association for Auto-motive Medicine, 1983:65–75.
175. Rutherford W et al. The medical effects of seat belt legis-lation in the United Kingdom. London, Department of Health and Social Security, Offi ce of the Chief Scientist, 1985 (Research Report No. 13).
176. Rivara FP et al. Systematic reviews of strategies to prevent motor vehicle injuries. American Jour-nal of Preventive Medicine, 1999, 16:1–5.
177. Dinh-Zarr et al. Reviews of evidence regarding interventions to increase the use of safety belts. American Journal of Preventive Medicine, 2001, 21:48–65.
178. Shults R et al. Primary enforcement seat belt laws are effective even in the face of rising belt use rates. Accident Analysis and Prevention, in press.
179. Jonah BA, Dawson NE, Smith GA. Effects of a selective traffi c enforcement program on seat belt use. Journal of Applied Psychology, 1982, 67:89–96.
180. Jonah BA, Grant BA. Long-term effectiveness of selective traffi c enforcement programs for increasing seat belt use. Journal of Applied Psychol-ogy, 1985, 70:257–263.
181. Gundy C. The effectiveness of a combination of police enforcement and public information for improving seat belt use. In: Rothengatter JA, de Bruin RA, eds. Road user behaviour: theory and research. Assen, Van Gorcum, 1988.
182. Solomon MG, Ulmer RG, Preusser DF. Evaluation of click it or ticket model programs. Washington, DC, National Highway Traffi c Safety Administra-tion, 2002 (DOT HS-809-498).
183. Solomon MG, Chaudhary NK, Cosgrove LA. Evaluation of the May 2003 mobilization: programs to increase safety belt usage. Washington, DC, National Highway Traffi c Safety Administration, in press.
184. Hagenzieker M. Effects of incentives on safety belt use: a meta-analysis. Crash Analysis and Pre-vention, 1997, 29:759–777.
185. Koch D, Medgyesi M, Landry P. Saskatchewan’s occupant restraint program (1988–94): performance to date. Regina, Saskatchewan Government Insur-ance, 1995.

152 • WORLD REPORT ON ROAD TRAFFIC INJURY PREVENTION
186. Dussault C. Effectiveness of a selective traffi c enforcement program combined with incen-tives for seat belt use in Quebec. Health Education Research: Theory and Practice, 1990, 5:217–223.
187. Aekplakorn W et al. Compliance with the law on car seat-belt use in four cities of Thailand. Journal of the Medical Association of Thailand, 2000, 83:333–341.
188. Morrison DS, Petticrew M, Thomson H. What are the most effective ways of improving population health through transport interven-tions? Evidence from systematic reviews. Jour-nal of Epidemiology and Community Health, 2003, 57:327–333.
189. Carrying children safely. Birmingham, Royal Society for the Prevention of Accidents, 2002 (http://www.childcarseats.org.uk/factsheets/carrying_safely_factsheet.pdf, accessed 16 December 2003).
190. Zaza S et al. Reviews of evidence regarding interventions to increase use of child safety seats. American Journal of Preventive Medicine, 2001, 21:31–43.
191. Motor vehicle occupant injury: strategies for increasing use of child safety seats, increas-ing use of safety belts and reducing alcohol-impaired driving. A report on recommenda-tions of the task force on community preventive services. Mobility and Mortality Weekly Report, 2001, 50:7 (http://www.cdc.gov/mmwr/PDF/RR/RR5007.pdf, accessed 16 December 2003).
192. Mohan D, Schneider L. An evaluation of adult clasping strength for restraining lap held infants. Human Factors, 1979, 21:635–645.
193. Anund A et al. Child safety in care: literature review.Linköping, Swedish National Road and Transport Research Institute, 2003 (VTI Report 489A9)(http://www.vti.se/PDF/reports/R489A.pdf, accessed 7 December 2003).
194. Thompson DC, Rivara FP, Thompson RS. Effec-tiveness of bicycle helmets in preventing head injuries: a case-control study. Journal of the Ameri-can Medical Association, 1996, 276:1968–1973.
195. Thompson DC, Rivara FP, Thompson R. Hel-mets for preventing head and facial injuries in bicyclists. Cochrane Database of Systematic Reviews,2000, (2):CD001855.
196. Sosin DM, Sacks JJ, Webb KW. Pediatric head injuries and deaths from bicycling in the United States. Pediatrics, 1996, 98:868–870.
197. Towner E et al. Bicycle helmets – a review of their effectiveness: a critical review of the literature. London, Department of Transport, 2002 (Road Safety Research Report No. 30).
198. LeBlanc JC, Beattie TL, Culligan C. Effect of leg-islation on the use of bicycle helmets. Canadian Medical Association Journal, 2002, 166:592–595.
199. Coffman S. Bicycle injuries and safety helmets in children: review of research. Orthopaedic Nursing,2003, 22:9–15.
200.Thompson RS, Rivara FP, Thompson DC. A case-control study of the effectiveness of bicy-cle safety helmets. New England Journal of Medicine,1989, 320:1361–1367.
201. Attewell RG, Glase K, McFadden M. Bicycle helmet effi cacy: a meta analysis. Accident Analysis and Prevention, 2001, 33:345–352.
202.Macpherson AK et al. Impact of mandatory hel-met legislation on bicycle-related head injuries in children: a population-based study. Pediatrics,2002, 110:e60.
203.Scuffham P et al. Head injuries to bicyclists and the New Zealand bicycle helmet law. Acci-dent Analysis and Prevention, 2000, 32:565–573.
204.Macpherson AK, Macarthur C. Bicycle helmet legislation: evidence for effectiveness. Pediatric Research, 2002, 52:472.
205. Vulcan P, Cameron MH, Watson WC. Mandatory bicycle helmet use: experience in Victoria, Aus-tralia. World Journal of Surgery, 1992, 16:389–397.
206.Povey LJ, Frith WJ, Graham PG. Cycle helmet effectiveness in New Zealand. Accident Analysis and Prevention, 1999, 31:763–770.
207. Graitcer P, Kellerman A, Christoffel T. A review of educational and legislative strategies to promote bicycle helmets. Injury Prevention, 1995, 1:122–129.
208.Liller KD et al. Children’s bicycle helmet use and inju-ries in Hillsborough County, Florida, before and after helmet legislation. Injury Prevention, 2003, 9:177–179.
209. Motorcycle safety helmets. COST 327. Brussels, Commis-sion of the European Communities, 2001 (http://www.cordis.lu/cost-transport/src/cost-327.htm, accessed 17 November 2003).

CHAPTER 4. INTERVENTIONS • 153
210. Radin Umar RS. Helmet initiatives in Malaysia. In: Proceedings of the 2nd World Engineering Congress.Sarawak, Institution of Engineers, 2002:93–101.
211. Supramaniam V, Belle V, Sung J. Fatal motor-cycle accidents and helmet laws in Peninsular Malaysia. Accident Analysis and Prevention, 1984, 16:157–162.
212. Ichikawa M, Chadbunchachai W, Marui E. Effect of the helmet act for motorcyclists in Thailand. Accident Analysis and Prevention, 2003, 35:183–189.
213. Servadei F et al. Effects of Italy’s motorcycle helmet law on traumatic brain injuries. Injury Prevention, 2003, 9:257–260.
214. Ulmer RG, Preusser DF. Evaluation of the repeal of the motorcycle helmet laws in Kentucky and Louisiana.Washington, DC, National Highway Traffi c Safety Administration, 2003 (Report No. DOT HS-809-530).
215. Waters H, Hyder AA, Phillips T. Economic evaluation of interventions to reduce road traffi c injuries: a review of the literature with applications to low and middle income coun-tries. Asia Pacifi c Journal of Public Health, in press.
216. Johnston I. Traffi c safety education: panacea, prophylactic or placebo? World Journal of Surgery,1992, 16:374–376.
217. O’Neill B et al. The World Bank’s Global Road Safety and Partnership. Traffi c Injury Prevention,2002, 3:190–194.
218.Duperrex O, Bunn F, Roberts I. Safety educa-tion of pedestrians for injury prevention: a sys-tematic review of randomised controlled trials. British Medical Journal, 2002, 324:1129.
219. Ker K et al. Post-licence driver education for the prevention of road traffi c crashes. Cochrane Data-base of Systematic Reviews, 2003, (3):CD003734.
220. Dueker RL. Experimental fi eld test of proposed anti-dart-out training programs. Volume 1. Conduct and results. Valencia, PA, Applied Science Associates Inc, 1981.
221. Ytterstad B. The Harstad injury prevention study: hospital-based injury recording used for outcome evaluation of community-based prevention of bicyclist and pedestrian injury.
Scandinavian Journal of Primary Health Care, 1995, 13:141–149.
222.Schioldborg P. Children, traffi c and traffi c training: analysis of the Children’s Traffi c Club. The Voice of the Pedestrian, 1976, 6:12–19.
223.Bryan-Brown K. The effects of a children’s traffi c club. In: Road accidents: Great Britain 1994. The Casualty Report. London, Her Majesty’s Sta-tionery Offi ce, 1995:55–61.
224. Blomberg RD et al. Experimental fi eld test of pro-posed pedestrian safety messages. Volume I: Methods and materials development. Washington, DC, National Highway Traffi c Safety Administration, 1983 (DOT-HS-4-00952).
225.Reducing the severity of road injuries through post impact care. Brussels, European Transport Safety Coun-cil, Post Impact Care Working Party, 1999.
226.Lerner EB, Moscati RM. The golden hour: sci-entifi c fact or medical “urban legend”. Academic Emergency Medicine, 2001, 8:758–760.
227. Mock CN et al. Trauma mortality patterns in three nations at different economic levels: implications for global trauma system develop-ment. Journal of Trauma, 1998, 44:804–814.
228.Pang TY et al. Injury characteristics of Malaysian motorcyclists by Abbreviated Injury Scale (AIS). Kuala Serdang, Malaysia, Road Safety Research Cen-tre, Universiti Putra Malaysia, 2000 (Research Report RR2/2000).
229. Mock CN, Arreola-Risa C, Quansah R. Strengthening care for injured persons in less developed countries: a case study of Ghana and Mexico. Injury Control and Safety Promotion, 2003, 10:45–51.
230.Hussain IM, Redmond AD. Are pre-hospital deaths from accidental injury preventable? British Medical Journal, 1994, 308:1077–1080.
231. Forjouh S et al. Transport of the injured to hospitals in Ghana: the need to strengthen the practice of trauma care. Pre-hospital Immediate Care, 1999, 3:66–70.
232.Husum H et al. Rural pre-hospital trauma sys-tems improve trauma outcome in low-income countries: a prospective study from north Iraq and Cambodia. Journal of Trauma, 2003, 54:1188–1196.
154 • WORLD REPORT ON ROAD TRAFFIC INJURY PREVENTION
233.Hauswald M, Yeoh E. Designing a pre-hospital system for a developing country: estimated costs and benefi ts. American Journal of Emergency Medicine, 1997; 15:600–603.
234.Van Rooyen MJ, Thomas TL, Clem KJ. Interna-tional Emergency Medical Services: assessment of developing prehospital systems abroad. Jour-nal of Emergency Medical Services, 1999, 17:691–696.
235. Bunn F et al. Effectiveness of pre-hospital care: a report by the Cochrane Injuries Group for the World Health Organisation. London, The Cochrane Injuries Group, 2001.
236.Mock CN, Quansah RE, Addae-Mensah L. Kwame Nkrumah University of Science and Technology continuing medical education course in trauma management. Trauma Quarterly,1999, 14:345–348.
237. Resources for the optimal care of the injured patient, 1999.Chicago, IL, American College of Surgeons, Committee on Trauma, 1999.
238.Knight P, Trinca G. The development, phi-losophy and transfer of trauma care programs. In: Refl ections on the transfer of traffi c safety knowledge to motorising nations. Melbourne, Global Traffi c Safety Trust, 1998:75–78.
239. Ali J et al. Trauma outcome improves following the advanced trauma life support program in a developing country. Journal of Trauma, 1993, 34:898–899.
240.Goosen J et al. Trauma care systems in South Africa. Injury, 2003, 34:704–708.
241. Quansah R. Availability of emergency medical services along major highways. Ghana Medical Journal, 2001, 35:8–10.
242. Nantulya V, Reich M. The neglected epidemic: road traffi c injuries in developing countries. British Medical Journal, 2002, 324:1139–1141.
243. Mock C et al. Report on the consultation meeting to develop an essential trauma care programme. Geneva, World Health Organization, 2002 (WHO/NMH/VIP02.09).
244.Hyder AA. Health research investments: a challenge for national public health asso-ciations. Journal of the Pakistan Medical Association,2002, 52:276–277.
245. Hyder AA, Akhter T, Qayyum A. Capacity development for health research in Pakistan: the effect of doctoral training. Health Policy and Planning, 2003, 18:338–343.