
Micro Chapter 4 Supply and Demand: Applications and Extensions.
Upload
darrell-robertsCategory
view
236download
1
Chapter 4
Extensions of Demand and Supply Analysis
Copyright © 2008 Pearson Addison Wesley. All rights reserved. 4-2
Introduction
Water covers 71% of the Earth, but only 2.5% is fresh water.
People in many locales complain of “shortages” of safe drinking water.
In this chapter you will learn more about shortages.

Copyright © 2008 Pearson Addison Wesley. All rights reserved. 4-3
Learning Objectives
• Discuss the essential features of the price system
• Evaluate the effects of changes in demand and supply on the market price and equilibrium quantity
• Understand the rationing function of prices
Copyright © 2008 Pearson Addison Wesley. All rights reserved. 4-4
Learning Objectives (cont'd)
• Explain the effects of price ceilings
• Explain the effects of price floors
• Describe various types of government-imposed quantity restrictions on markets

Copyright © 2008 Pearson Addison Wesley. All rights reserved. 4-5
Chapter Outline
• The Price System and Markets
• Changes in Demand and Supply
• The Rationing Function of Prices
• The Policy of Government-Imposed Price Controls
Copyright © 2008 Pearson Addison Wesley. All rights reserved. 4-6
Chapter Outline (cont'd)
• The Policy of Controlling Rents
• Price Floors in Agriculture
• Price Floors in the Labor Market
• Quantity Restrictions

Copyright © 2008 Pearson Addison Wesley. All rights reserved. 4-7
Did You Know That...
• The inflation-adjusted value of the U.S. minimum wage peaked at about $8 in 1964?
• We can use supply and demand analysis to analyze effects of the minimum wage?
• The model of supply and demand can explain instances of a gap between quantity supplied and quantity demanded?
Copyright © 2008 Pearson Addison Wesley. All rights reserved. 4-8
The Price System and Markets
• Price System or Market System
An economic system in which relative prices are constantly changing to reflect changes in supply and demandPrices signal what is relatively scarce and
relatively abundant.
Prices provide information to individuals and businesses.
Copyright © 2008 Pearson Addison Wesley. All rights reserved. 4-9
The Price System and Markets (cont'd)
• Markets
Emphasize voluntary exchange
Determine the terms of exchange
Facilitate exchange

Copyright © 2008 Pearson Addison Wesley. All rights reserved. 4-10
The Price System and Markets (cont'd)
• Voluntary Exchange Acts of trading between individuals that
make both parties to the trade subjectively better off
• Terms of Exchange The prices we pay for the desired items

Copyright © 2008 Pearson Addison Wesley. All rights reserved. 4-11
The Price System and Markets (cont'd)
• Transaction Costs
The costs associated with exchange
ExamplesPrice shoppingDetermining qualityDetermining reliabilityService availabilityCost of contracting

Copyright © 2008 Pearson Addison Wesley. All rights reserved. 4-12
The Price System and Markets (cont'd)
• The role of middlemen
Middlemen (intermediaries) or brokers reduce transaction costs by providing information to buyers and sellers
ExamplesReal estate brokersStock brokersConsignment shopsCar dealerships

Copyright © 2008 Pearson Addison Wesley. All rights reserved. 4-13
Policy Example: Profiting by Lowering Transaction Costs of Junking Computers
• Transaction costs can be lowered by middlemen (intermediaries). Consumers and businesses can dispose of
old computer equipment.
• Intermediaries can refurbish old computers. Useable parts and computer upgrades can
be resold.
Copyright © 2008 Pearson Addison Wesley. All rights reserved. 4-14
Changes in Demand and Supply
• Changes in supply and demand create a disequilibrium.
• The market price and quantity adjust to a new equilibrium.

Copyright © 2008 Pearson Addison Wesley. All rights reserved. 4-15
Figure 4-1 Shifts in Demand and in Supply: Determinate Results, Panel (a)

Copyright © 2008 Pearson Addison Wesley. All rights reserved. 4-16
Figure 4-1 Shifts in Demand and in Supply: Determinate Results, Panel (b)
Copyright © 2008 Pearson Addison Wesley. All rights reserved. 4-17
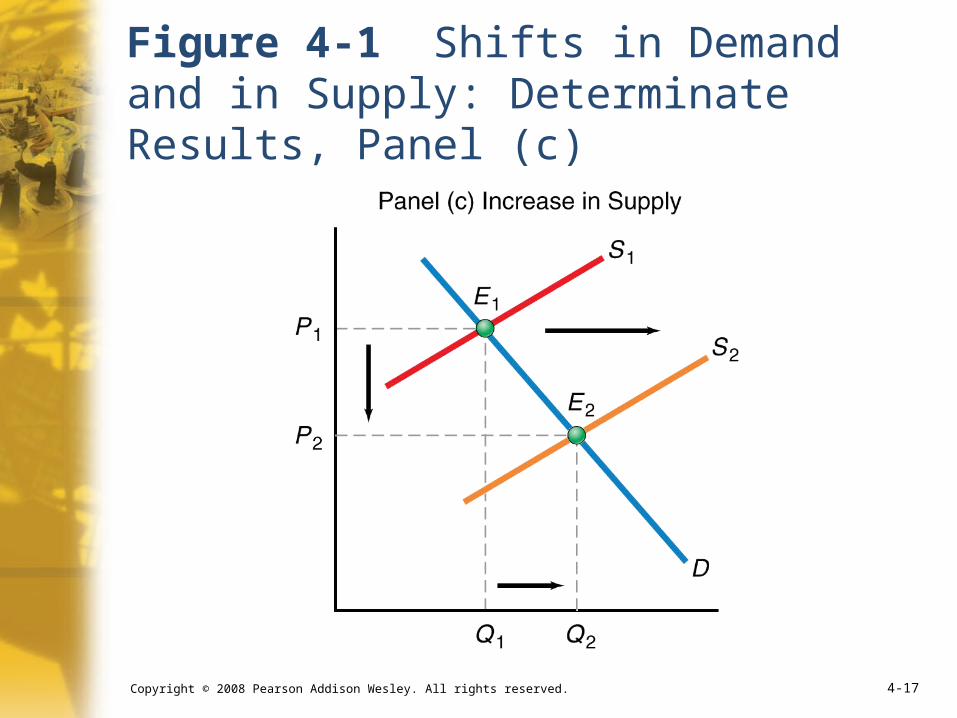
Figure 4-1 Shifts in Demand and in Supply: Determinate Results, Panel (c)
Copyright © 2008 Pearson Addison Wesley. All rights reserved. 4-18
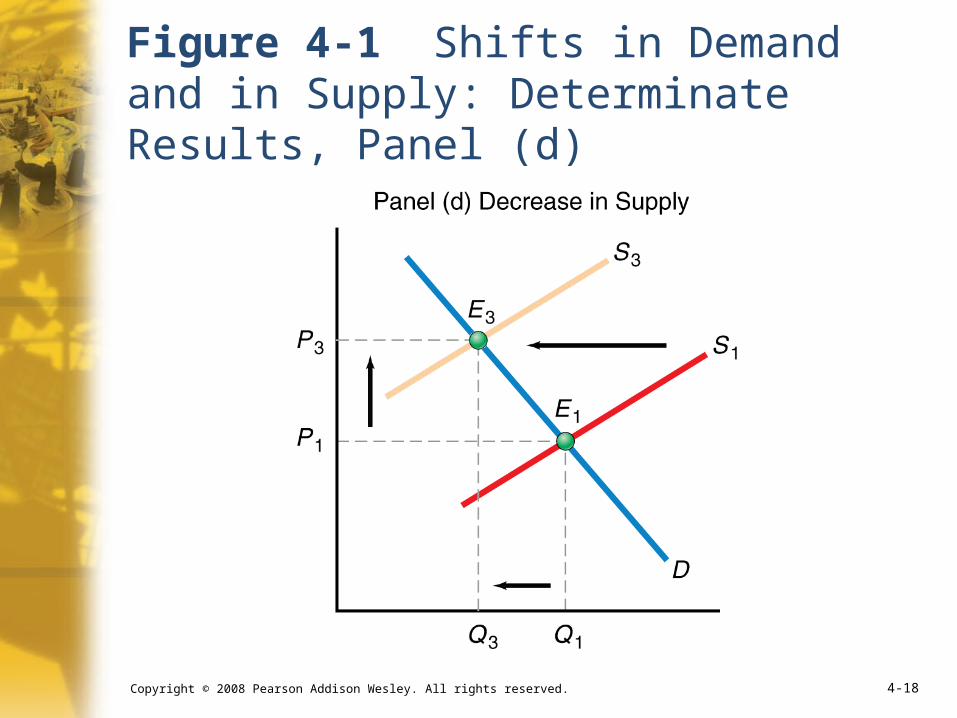
Figure 4-1 Shifts in Demand and in Supply: Determinate Results, Panel (d)
Copyright © 2008 Pearson Addison Wesley. All rights reserved. 4-19
Changes in Demand and Supply (cont'd)
• Summary
Increases in demand increase equilibrium price and quantity.
Decreases in demand decrease equilibrium price and quantity.

Copyright © 2008 Pearson Addison Wesley. All rights reserved. 4-20
Changes in Demand and Supply (cont'd)
• Summary
Increases in supply decrease equilibrium price and increase equilibrium quantity.
Decreases in supply increase equilibrium price and decrease equilibrium quantity.
Copyright © 2008 Pearson Addison Wesley. All rights reserved. 4-21
Changes in Demand and Supply (cont'd)
• When both demand and supply shift
Simultaneous changes in demand and supply put conflicting pressure on price or quantity.
The resulting effect depends upon how much each curve shifts.
Either equilibrium price or quantity will be indeterminate.

Copyright © 2008 Pearson Addison Wesley. All rights reserved. 4-22
Changes in Demand and Supply (cont'd)
• When both demand and supply increase Change in price is indeterminate
Quantity will increase
• When both demand and supply decrease Change in price is indeterminate
Quantity will decrease

Copyright © 2008 Pearson Addison Wesley. All rights reserved. 4-23
Changes in Demand and Supply (cont'd)
• When supply decreases and demand increases Price will increase
Change in quantity is indeterminate
• When supply increases and demand decreases Price will decrease
Change in quantity is indeterminate

Copyright © 2008 Pearson Addison Wesley. All rights reserved. 4-24
Example: Why Gasoline Prices Have Increased
• One factor—an increase in demand, shown by a rightward shift in the demand curve
• Another factor—a reduction in supply, shown by a leftward shift in the supply curve
• As a result, the market clearing price of gasoline increased.

Copyright © 2008 Pearson Addison Wesley. All rights reserved. 4-25
Figure 4-2 The Effects of a Simultaneous Decrease in Gasoline Supply and Increase in Gasoline Demand
Copyright © 2008 Pearson Addison Wesley. All rights reserved. 4-26
Price Flexibility and Adjustment Speed
• Prices quite flexible in unfettered markets can be less flexible in other market scenarios.
May experience indirect adjustments such as hidden payments, quality changes
May not reach equilibrium right away
Copyright © 2008 Pearson Addison Wesley. All rights reserved. 4-27
Price Flexibility and Adjustment Speed (cont'd)
• Adjustment speed
Market characteristics influence adjustment speed.
Markets may overshoot in the adjustment process.
Markets are subject to energy shocks, labor strikes, severe weather.

Copyright © 2008 Pearson Addison Wesley. All rights reserved. 4-28
The Rationing Function of Prices
• Synchronization of decisions of buyers and sellers that leads to equilibrium is called the rationing function of prices.

Copyright © 2008 Pearson Addison Wesley. All rights reserved. 4-29
The Rationing Function of Prices (cont'd)
• Methods of non-price rationing
Rationing by queues (waiting in line)
Rationing by random assignment, and/or coupons

Copyright © 2008 Pearson Addison Wesley. All rights reserved. 4-30
The Rationing Function of Prices (cont'd)
• The essential role of rationing (with scarcity rationing must occur)
We must choose the rationing mechanism: price or non-price.
Price rationing leads to most efficient use of available resources; all gains from mutually beneficial trade are captured.
Copyright © 2008 Pearson Addison Wesley. All rights reserved. 4-31
The Rationing Function of Prices (cont'd)
• Question If price rationing is the most efficient is it
the “best” way to ration?
• Answer Economists cannot say which system is
“best.” They can say rationing via the price system leads to the most efficient use of available resources.

Copyright © 2008 Pearson Addison Wesley. All rights reserved. 4-32
The Policy of Government-Imposed Price Controls
• Price Controls Government-mandated minimum or
maximum prices
• Price Ceiling A legal maximum price
• Price Floor A legal minimum price
Copyright © 2008 Pearson Addison Wesley. All rights reserved. 4-33
The Policy of Government-Imposed Price Controls (cont'd)
• Price ceiling and black markets
Price ceilings may prevent the equilibrium price from being achieved if it is above the ceiling price.
Copyright © 2008 Pearson Addison Wesley. All rights reserved. 4-34
The Policy of Government-Imposed Price Controls (cont'd)
• Non-Price Rationing Devices All methods used to ration scarce goods
that are price-controlled
• Black Market A market in which price-controlled goods
are sold at an illegally high price

Copyright © 2008 Pearson Addison Wesley. All rights reserved. 4-35
Figure 4-3 Black Markets
Copyright © 2008 Pearson Addison Wesley. All rights reserved. 4-36
Example: Preventing Price Gouging Promotes Black Markets in Florida
• Florida’s antigouging law penalizes a seller for selling an item for a high price during an emergency.
• After a hurricane, temporary shortages exist, causing prices to rise, but antigouging laws prevent price increases from occurring.
• When prices are fixed, producers have less incentive to deliver, and a parallel, or black, market develops.
• So who wins and who loses?

Copyright © 2008 Pearson Addison Wesley. All rights reserved. 4-37
The Policy of Controlling Rents
• The functions of rental prices
1. Promote the efficient maintenance and construction of housing
2. Allocate existing housing
3. Ration the use of housing
Copyright © 2008 Pearson Addison Wesley. All rights reserved. 4-38
The Policy of Controlling Rents (cont'd)
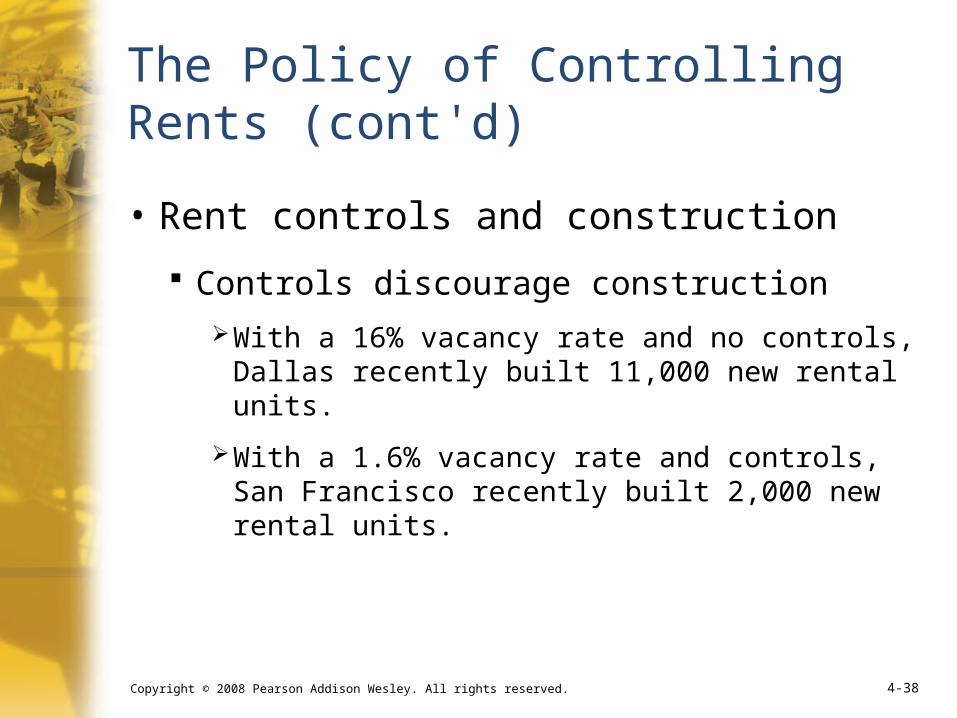
• Rent controls and construction
Controls discourage construction
With a 16% vacancy rate and no controls, Dallas recently built 11,000 new rental units.
With a 1.6% vacancy rate and controls, San Francisco recently built 2,000 new rental units.

Copyright © 2008 Pearson Addison Wesley. All rights reserved. 4-39
The Policy of Controlling Rents (cont'd)
• Effects on the existing supply of housing and current use of housing
Property owners cannot recover costsMaintenance, repairs, capital improvements
Rations the current use of housingReduces mobility, e.g., New York’s
“housing gridlock”
Copyright © 2008 Pearson Addison Wesley. All rights reserved. 4-40
The Policy of Controlling Rents (cont'd)
• Attempts to evade rent controls
Forcing tenants to leave
Tenants subletting apartments
Housing courts
Copyright © 2008 Pearson Addison Wesley. All rights reserved. 4-41
The Policy of Controlling Rents (cont'd)
• Who gains and who loses from rent controls?
LosersProperty owners
Low-income individuals
GainersUpper-income professionals

Copyright © 2008 Pearson Addison Wesley. All rights reserved. 4-42
Price Floors in Agriculture
• Support Price
The governmentally established price floor
Associated with agricultural products

Copyright © 2008 Pearson Addison Wesley. All rights reserved. 4-43
Figure 4-4 Agricultural Price Supports
Copyright © 2008 Pearson Addison Wesley. All rights reserved. 4-44
Price Floors in Agriculture (cont'd)
• Questions
How could the government keep the price from falling?
Who benefits from agricultural price supports?

Copyright © 2008 Pearson Addison Wesley. All rights reserved. 4-45
International Policy Example: The High Cost of European Sugar Subsidies
• Sugar is most efficiently extracted from sugar cane grown in warm, moist climates.
• Extracting sugar from beets is four times more costly.
• European taxpayers pay $1.5 billion per year to subsidize beet sugar production.
• Why do you suppose governments in developing countries complain?

Copyright © 2008 Pearson Addison Wesley. All rights reserved. 4-46
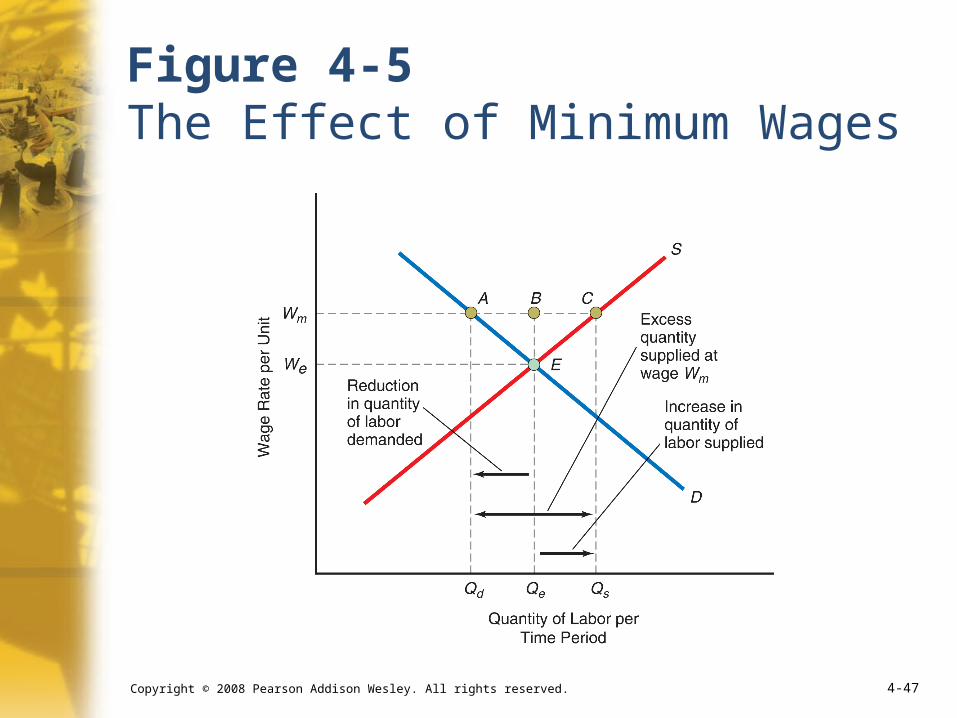
Price Floors in the Labor Market
• Minimum Wage
A wage floor, legislated by government, setting the lowest hourly wage rate that firms may legally pay their workers
Copyright © 2008 Pearson Addison Wesley. All rights reserved. 4-47
Figure 4-5 The Effect of Minimum Wages

Copyright © 2008 Pearson Addison Wesley. All rights reserved. 4-48
Quantity Restrictions
• Governments can impose quantity restrictions, most obvious—banning ownership or trading of a good
Human organs
Drugs
Hospital beds
Gold from 1933 to 1973
Copyright © 2008 Pearson Addison Wesley. All rights reserved. 4-49
Quantity Restrictions (cont'd)
• Government Prohibitions and Licensing Requirements Some commodities cannot be purchased
at all legally; others require a license
• Import Quota Supply restriction that prohibits the
importation of more than a specified quantity of a particular good

Copyright © 2008 Pearson Addison Wesley. All rights reserved. 4-50
Issues and Applications: Coping with a Growing Global Demand for Fresh Water
• Today, about 2.5 billion people have safe drinking water; nearly 4 billion do not, resulting in 2 million deaths annually.
• Price controls make a scarce resource, such as water, harder to obtain.
• What rationing method do you think can best ensure greater access to safe drinking water?

Copyright © 2008 Pearson Addison Wesley. All rights reserved. 4-51
Figure 4-6 How to Generate a Water Shortage

Copyright © 2008 Pearson Addison Wesley. All rights reserved. 4-52
Summary Discussion of Learning Objectives
• Essential features of the price system
A price system (market system) allows prices to respond to changes in supply and demand for different commodities.
The terms of exchange—prices—are communicated in markets that tend to minimize transactions costs.

Copyright © 2008 Pearson Addison Wesley. All rights reserved. 4-53
Summary Discussion of Learning Objectives (cont'd)
• How changes in demand and supply affect market price and equilibrium quantity
Increases in demand increase equilibrium price and quantity; decreases in demand decrease equilibrium price and quantity.
Increases in supply decrease market price and increase equilibrium quantity; decreases in supply increase market price and decrease equilibrium quantity.
Copyright © 2008 Pearson Addison Wesley. All rights reserved. 4-54
Summary Discussion of Learning Objectives (cont'd)
• How changes in demand and supply affect market price and equilibrium quantity
When both demand and supply shift at the same time, the result is indeterminate.
Copyright © 2008 Pearson Addison Wesley. All rights reserved. 4-55
Summary Discussion of Learning Objectives (cont'd)
• The rationing function of prices
In a market system, prices ration scarce goods and services.
Other ways of rationing include first come, first served; political power; physical force; random assignment; and coupons.

Copyright © 2008 Pearson Addison Wesley. All rights reserved. 4-56
Summary Discussion of Learning Objectives (cont'd)
• The effects of price ceilings
A price ceiling set below the market (equilibrium) price results in a shortage.
The resulting shortage can lead to non-price rationing devices and black markets.
Copyright © 2008 Pearson Addison Wesley. All rights reserved. 4-57
Summary Discussion of Learning Objectives (cont'd)
• The effects of price floors
If the price floor is set above the market price, a surplus results.
A price floor can take the form of a government-imposed price support or minimum wage.

Copyright © 2008 Pearson Addison Wesley. All rights reserved. 4-58
Summary Discussion of Learning Objectives (cont'd)
• Government-imposed restrictions on market quantities
Bans on sale or ownership
Licensing restrictions
Import quotas
End of Chapter 4
Extensions of Demandand Supply Analysis


