CHAPTER 4 DEVELOPMENT OF CIPP (POLICY, STRATEGY...
102
PECEM INDUSTRIAL AND PORT COMPLEX DEVELOPMENT PLAN FINAL REPORT IN THE FEDERATIVE REPUBLIC OF BRAZIL VOLUME I CHAPTER 4 DEVELOPMENT OF CIPP (POLICY, STRATEGY AND IMPLEMENTATION) 4.1 Current Situation 4.1.1 Project Area a. Land use Plan The CIPP is located at a location of about 60 km to the west of Fortaleza, the State Capital of Ceara. The total land area of CIPP is 33,500 ha. The land areas reserved for a steel mil and an oil refinery, which are the two key industries, are located in the centre of the CIPP. A zone to the east of the steel mil area is reserved for metal processing industries, while a zone to the south of the refinery area is reserved for petrochemical industries and, further down to the south, a zone is reserved for other manufacturing industries. Figure 4.1.1 shows the layout and land use plan of CIPP. b. Access Highways and railways Three is a highway network around the CIPP that consists of State Highways CE 085, CE 421 and CE 156 up to Federal Highway BR222, which connects the western Northeast Region and the North Region. The Federal Highway is also connected to other highways: BR-116 towards Southeast Region, BR -020 towards Central-west Region and BR-116/BR-304 towards eastern part of the Northeast Region. In addition to the state highway network serving Pecem area, a new coastal road between Fortaleza and northwesters cost of the state for the purpose of tourism: therefore, no cargo truck is allowed to pass this new road. A new 20 km-long access road from Br-222 to Pecem Port has also been opened. In parallel to BR-222, there is a railway of the Northeast Railway Company that is providing service between Fortaleza and other states in the Northeast Region. The 22 km-long railway access branch between the existing railway trunk line and Pecem Port has been completed (See Figure 4.1.2). c. Port facilities A full explanation of the existing situation of Pecem Port is given in Section 4.1.5. Since the Port, is the essential infrastructure of CIPP, major features are briefly stated hereunder.(see Figure 4.1.3): Berthing facilities • Pier No, 1; 350m long and 45 m wide platform used for the handling of bulk and general cargoes. • Pier No. 2; used for liquid bulk, especially petroleum • Breakwater: L-shaped 1,700-m long breakwater. • Bridge: 2,120 m long and two-way lane bridge connecting the two piers and the yard on land.. The bridge has lateral supports for belt conveyers for bulk cargoes and pipelines for the handling of petroleum products. • Yards: 380.000 m 2 • Warehouse: 6,250m 2 and owns a capacity of about 55,000m 3 . MAIN REPORT 4 - 1 CHAPTER 4
Transcript of CHAPTER 4 DEVELOPMENT OF CIPP (POLICY, STRATEGY...

PECEM INDUSTRIAL AND PORT COMPLEX DEVELOPMENT PLAN FINAL REPORT IN THE FEDERATIVE REPUBLIC OF BRAZIL VOLUME I
CHAPTER 4 DEVELOPMENT OF CIPP (POLICY, STRATEGY AND IMPLEMENTATION)
4.1 Current Situation
4.1.1 Project Area
a. Land use Plan
The CIPP is located at a location of about 60 km to the west of Fortaleza, the State Capital of Ceara. The total land area of CIPP is 33,500 ha. The land areas reserved for a steel mil and an oil refinery, which are the two key industries, are located in the centre of the CIPP. A zone to the east of the steel mil area is reserved for metal processing industries, while a zone to the south of the refinery area is reserved for petrochemical industries and, further down to the south, a zone is reserved for other manufacturing industries. Figure 4.1.1 shows the layout and land use plan of CIPP.
b. Access Highways and railways
Three is a highway network around the CIPP that consists of State Highways CE 085, CE 421 and CE 156 up to Federal Highway BR222, which connects the western Northeast Region and the North Region. The Federal Highway is also connected to other highways: BR-116 towards Southeast Region, BR -020 towards Central-west Region and BR-116/BR-304 towards eastern part of the Northeast Region.
In addition to the state highway network serving Pecem area, a new coastal road between Fortaleza and northwesters cost of the state for the purpose of tourism: therefore, no cargo truck is allowed to pass this new road. A new 20 km-long access road from Br-222 to Pecem Port has also been opened.
In parallel to BR-222, there is a railway of the Northeast Railway Company that is providing service between Fortaleza and other states in the Northeast Region. The 22 km-long railway access branch between the existing railway trunk line and Pecem Port has been completed (See Figure 4.1.2).
c. Port facilities
A full explanation of the existing situation of Pecem Port is given in Section 4.1.5. Since the Port, is the essential infrastructure of CIPP, major features are briefly stated hereunder.(see Figure 4.1.3):
Berthing facilities
• Pier No, 1; 350m long and 45 m wide platform used for the handling of bulk and general cargoes.
• Pier No. 2; used for liquid bulk, especially petroleum
• Breakwater: L-shaped 1,700-m long breakwater.
• Bridge: 2,120 m long and two-way lane bridge connecting the two piers and the yard on land.. The bridge has lateral supports for belt conveyers for bulk cargoes and pipelines for the handling of petroleum products.
• Yards: 380.000 m2
• Warehouse: 6,250m2 and owns a capacity of about 55,000m3.
MAIN REPORT 4 - 1 CHAPTER 4

PECEM INDUSTRIAL AND PORT COMPLEX DEVELOPMENT PLAN FINAL REPORT IN THE FEDERATIVE REPUBLIC OF BRAZIL VOLUME I
Petro-Cheminal Zone
Steel Industry
Urban Zone
Urban
Pecem Port Zone
Natural Preservation Zone
Oil Refinery Zone
Other
Source: SEINFLA modified by JICA Study Team
Figure 4.1.1 Layout and land use plan of Pecem Industrial and Port Complex (CIPP)
MAIN REPORT 4 - 2 CHAPTER 4

PECEM INDUSTRIAL AND PORT COMPLEX DEVELOPMENT PLAN FINAL REPORT IN THE FEDERATIVE REPUBLIC OF BRAZIL VOLUME I
Source: Ministry of Transport Web Sit, Edited by JICA Study Team Figure 4.1.2 Transport system around CIPP
Source: CEARAPORT
Figure 4.1.3 Facility Layout Pecem Port (Existing Situation)
The port has been operational since November, 2001. So far, without neither steel mil nor oil refinery has been established, the port has been handling general cargoes and container cargoes at Pier 1, which is designed for handling cargoes iron ore and steel products. The construction of a steel mil is scheduled to start in the later stage of 2004 and it will start operation sometime in 2007. Thus, the construction of additional pier is urgent.
MAIN REPORT 4 - 3 CHAPTER 4

PECEM INDUSTRIAL AND PORT COMPLEX DEVELOPMENT PLAN FINAL REPORT IN THE FEDERATIVE REPUBLIC OF BRAZIL VOLUME I
The Government od Ceara State has the expansion plans of Pecem Port. The plan consitts of two phases. Figure 4.1.4 (1) shows the Phase I expansion that include the development of a multi-purpose berth, which is called Pier No. 3. Phase II plan, shown in Figure 4.1.4 (2) is the further expansion of the breakwaters to shelter another pier named Pier No. 0, which accommodate LNG (Liquid Natural Gas) tankers.
Source: SEINFRA
Figure 4.1.4 (1) Existing Development Plan of Pecem Port (Phase I)
Source: SEINFRA
Figure 4.1.4 (2) Existing Development Plan of Pecem Port (Phase II)
MAIN REPORT 4 - 4 CHAPTER 4

PECEM INDUSTRIAL AND PORT COMPLEX DEVELOPMENT PLAN FINAL REPORT IN THE FEDERATIVE REPUBLIC OF BRAZIL VOLUME I
For the further development to meet traffic demands, an idea to expand Pecem port in three stages has been proposed:
Stage 1 Expansion to the west Stage 2 Expansion toward offshore Stage 3 Expansion to the east.
Existing Layout Stage 1
Stage 2 Stage 3
M
Source : SEINFRA
Figure 4.1.5 An idea of future expansion for long term development
AIN REPORT 4 - 5 CHAPTER 4

PECEM INDUSTRIAL AND PORT COMPLEX DEVELOPMENT PLAN FINAL REPORT IN THE FEDERATIVE REPUBLIC OF BRAZIL VOLUME I
4.1.2 Vision
The concept and the vision of the development of CIPP are briefly explained in the Report “THE PECEM INDUSTRIAL AND PORT COMPLEX, Ministry of Transport and the Government of State of Ceara, January, 1995”.
Ceara has been one of the poorest states in Brazil. The state government has been challenging all the possible efforts to promote the socioeconomic activities on the basis of the fundamental policy guideline: “the sustainable development of the state with the major goal to improve the quality of life of all ‘cearençe - people of Ceara) , economic growth with the improvement of the distribution of income, maximization of the creation of jobs.
With the awareness of the importance of the industrial sector in the process of the development and the recognition of the need for decentralization, the State Government of Ceara had taken concrete action to attract large scale investments to Ceara and its hinterland states.
The conceptual plan of the development of CIPP was elaborated as an integral part of the sustainable development policies. The main goal of the plan is to endow the State of Ceara with a true nucleus of development, from which the progress will be disseminated via the promotion of integrated industrial activities in inter-industrial terms. This will stimulates a greater regional interplay, which should considerably contribute to the reduction of unemployment level.
The Directive Plan for the CIPP was elaborated so as to meet the following basic premises:
• attention to the Plan for Sustainable Development 1995-1998;
• improvement of the quality of life of all “cearençe” in the region;
• maintenance of adequate conditions for the equilibrium of the ecosystem, and the preservation of the non-renewable natural resources;
• assure the quality of life for future populations through the zoning and rationalization of the use of the land;
• assurance of preservation of the areas for future expansion of the seaport zone;
• satisfactory functions as a collection, transformation and distribution center of goods and services, so as to become a long reaching logistic platform for the major world markets;
• spatial organization of the logistic platform so as to better respond to the need of its different users;
• optimization of the initial investments in infrastructure (highways, railways, electric power, natural gas, water, sanitary sewage);
• compatibility with the objectives and investments in the tourism development programs.
Significant efforts were made during the elaboration of the Director Plan for the dissemination and discussion among the people of the region, the press, opinion makers in Fortaleza and with the university community, especially within the Federal
MAIN REPORT 4 - 6 CHAPTER 4

PECEM INDUSTRIAL AND PORT COMPLEX DEVELOPMENT PLAN FINAL REPORT IN THE FEDERATIVE REPUBLIC OF BRAZIL VOLUME I
University of Ceara. Such interaction with the public was accomplished by means of talks, interviews, seminars and publications.
A representative landmark of the acceptance by the society was the approval of the RIMA-the Environmental Impact Report of the work of the Pecem Seaport at COEMA-the State Council for the Environment.
Since the introduction of the concept of the development of CIPP, substantial numbers of studies have been carried out. The Environmental Impact Studies are a comprehensive environmental impact assessment studies that were evaluated and approved by COEMA.
4.1.3 CIPP Development Plan The location of CIPP, the size of which is around 350,000 ha, similar to the size of the city of Fortaleza, is located on the coast of both Caucaia and Sao Goncalo de Amarante municipalities. Caucaia portion belongs to RMF. It could be regarded as an expansion of the metropolitan area, at the same time placing the industrial center outside of RMF in line with decentralization o industry in Ceara.
The vision indicates that several key large industrial plants are to be located, with a number of satellite companies to support or depend upon the nucleus. Industries originally envisioned were; a steel mill and metal-fabrication/mechanic industry, a refinery and petrochemical industry, tank yard, LNG re-gasification plant.
The development of the Industrial Complex will take place in three phases:
Phase I: Steel Plant (Installation of the cold-roll lamination); Metal-Mechanical Industries; Petroleum Refinery; Thermoelectric Plants of 530 MW.
Phase II: Ironworks (hot-roll lamination, refining oven and high oven); expansion of the Petroleum Refinery; Metal-Mechanical Industries, Chemicals Industries;
Phase III: Ironworks (high oven); expansion of the Re-gasification plant; Metal-Mechanical Industries; Chemicals Industries. Each phase of the Complex expansion will correspond to five years.
The steel plant in the first phase will start as DRI and steel slab plant, instead of originally planned cold roll. Also the original radius-nuclei concept may be adjusted to accommodate marshalling districts concept where small and medium companies locate in the same district to advantage the benefits of a common infrastructure. The concept is common in industrial estates with common infrastructures. FIEC is proposing to relocate an EPZ to CIPP to benefit from the new port infrastructure. It will fill the gap of time and space until anchor industry finally decides to locate in CIPP. Also it may help diversification of industry in CIPP. One important matter to be noted is that there is a state policy to decentralize industries in Ceara. There will be a risk of establishments which may have located in rural area of Ceara to come into CIPP to limit the possibility of meeting future needs of industries which must physically locate themselves in CIPP (such as transshipment, storage, repacking, etc.). The industries in this category may include; cleaning, sorting and packing of fresh fruits, contract packaging of mainly consumer products, processing of soya, corn etc., processing of bio-diesel and ethanol for export and domestic markets.
MAIN REPORT 4 - 7 CHAPTER 4

PECEM INDUSTRIAL AND PORT COMPLEX DEVELOPMENT PLAN FINAL REPORT IN THE FEDERATIVE REPUBLIC OF BRAZIL VOLUME I
Another point to be taken into consideration is that the CIPP development should not repeat the unwanted side-effects of unplanned urbanization near the industry area and subsequent social pollution and crimes. Also the measures to contain trespassers of CIPP at an early stage to enforce law and orders at all stages will be required to maintain sustainable growth of CIPP in a long range. For this purpose, suitable urban development plan within and outside of CIPP in the above viewpoint is required.
4.1.4 Examination of Type and Size Of Possible Industrial Development
(1) Steel Mill
Steel Mill project is promoted by USC (Usine Siderurgica Ceara), a joint venture of Dongkuk Steel of Korea (50 %), and Danieli (30%) of Italy, and CVRD (20%). Total investment amount is expected to be UA$754 million, about 35% from equity and the remainder from loans. Industrial gas, lime and refractory plats are expected to be in CIPP to service the steel project, with estimated US$60 million investments. It is expected to generate about 3,400 direct employments during plant construction, and 1,600 direct and indirect employments during operation.
As of May 2005, USC Phase 1 plan is to produce 1.5 million tons of Steel Slab. The main raw material is 2.5 million tons of Iron Ore Pellet, supplied by CVRD, to be processed through Direct Reduction process from Danieli, then the product iron goes through electric arc furnace, then through slab caster to produce 1.5 million tons per year of steel slab.
Currently, USC is planning to double the above capacity within a few years of the first phase.
(2) Oil Refinery Various studies have been done on possibilities of refinery in the Northeast region. A study by TP&E Associados S/C Ltda. dated 2003-05-12 estimates the deficits of petroleum products in the North and Northeast regions in 2010 will be as follows:
• Gasoline 29,300 b/d
• LPG 38,600
• Naphtha 99,000
• Diesel 122,000
• Kerosene 14,800
The study suggests a refinery be set up in CIPP with 200,000 b/d capacity, with the following product slate.
• Gasoline 14,200 b/d
• LPG 12,400
• Naphtha 27,500
• Diesel 117,700
• Kerosene 8,100
• Coke 3,000 t
MAIN REPORT 4 - 8 CHAPTER 4

PECEM INDUSTRIAL AND PORT COMPLEX DEVELOPMENT PLAN FINAL REPORT IN THE FEDERATIVE REPUBLIC OF BRAZIL VOLUME I
The refinery fills only a part of the deficits, and another refinery of similar size is bound to be needed in some location in the North-Northeast regions. As of June 2005, location of the new refinery is not decided yet. If it is located in CIPP, the cargo flow through Pecem port will have to start in 2009, and if it is located in other place in the Northeast, there still is a necessity of another refinery within reasonable time span. For the purpose of cargo forecast for Pecem port, optimistic case includes refinery cargo flow to start in 2009, and medium case presumes that the flow starts in 2019.
(3) Petrochemical Industry
World ethylene demand in 2003 was 97.3 million tons. In 2004, the world ethylene demand grew to 103.0 million tons, 5.5% over the previous year, especially in China, where the demand grew 7.6%. Based on the assumption that the world economy will grow steadily, the ethylene demand in 2009 will be 132.8 million tons with an average yearly growth rate of 5.3%. Growth rate differ by regions and countries. Asia will grow at 6.7%, North America by 4.1%, EU by 2.1%. Demand in Japan in 2009 will be 5.5 million tons, 0.1 million tons lower than 5.6 million tons in 2003 and 5.8 million tons in 2004, due to increase of import of ethylene derivatives and relocation of ethylene and derivatives users to outside Japan. As to propylene, the world demand in 2003 was 58.8 million tons, and the forecast for 2009 demand is 78.9 million tons.
Growth in North America will be that of the U.S.A., Mexico will grow at lower rate than the U.S.A. Central and South Americas are represented by Mexico and Brazil. Mexico’s Pemex is unable to satisfy petrochemical raw material user by lowering price, at the same time feeling pressure from its labor union against privatization of the petrochemical industry. For some time to come, any remarkable growth of petrochemical industry will not be realized in Mexico. Brazil has its strength in export experience in petrochemicals as it started ethylene from ethanol production and export petrochemicals.
70% of the U.S. ethylene is made from ethane-propane feedstock from natural gas. Natural gas price jumped from traditional $2-2.50/MMBTU to $18 in 2003. It settled later at $4-4.50/MMBTU, but at this level it may put the petrochemicals in U.S.A. uncompetitive in the international market, and may put the U.S.A. in net-importer position of petrochemicals and their downstream products. Brazil may benefit from the situation if the high cost of natural gas in the U.S.A. continues, because the raw material price may become comparatively lower than the U.S.A.
Except for the U.S.A. and oil producing countries, petrochemical building block (ethylene) is produced by thermal cracking of naphtha. Gas based ethylene cracker needs around 25% more in quantity of c2+ over ethylene as feedstock. Natural gas is usually composed of more than 80% methane, which is used as fuel or a feedstock of c1 chemicals such as methanol or N fertilizer. Brazil’s existing petrochemical centers are all based on naphtha, and located next to refineries to secure stable supply of major part of naphtha. Brazil’s petrochemical centers are as follows:
Year Location Ethylene Capacity Adjoining Refinery
#1 1972 Cubatao, SP 500,000 t/y Pres. Bernerdes/RPBC 170,000 b/d
#2 1978 Camacari, BA 1,280,000 t/y Landulpho Alves/RLAM 307,000 b/d
#3 1982 Copesul, RS 1,135,000 t/y Alberto Pasquallini/REFAP189,000 b/d
MAIN REPORT 4 - 9 CHAPTER 4

PECEM INDUSTRIAL AND PORT COMPLEX DEVELOPMENT PLAN FINAL REPORT IN THE FEDERATIVE REPUBLIC OF BRAZIL VOLUME I
If a naphtha cracker is located in CIPP, it should mean that a refinery should have been located in CIPP before naphtha cracker, unless there is a source of natural gas capable of supplying ample feedstock ethane to produce ethylene. In CIPP, even LNG re-gasification project materialized, the supply of enough ethane would be difficult if ethylene is based on ethane feedstock. In this exercise, petrochemical complex in CIPP is supposed to be based on naphtha from near by refinery, with additional supply from other refineries or import.
A one million tons ethylene plant may be, theoretically, more competitive in production cost and many petrochemical plants of the world have this capacity. The large scale plant, although competitive coastwise, may create another risk of accident of shutdown affecting larger scale of downstream plants. In the present exercise, a naphtha cracker of 500,000 tons per year of ethylene is therefore presumed. Also the downstream products are simplified as much as possible at the same time to realize competitive scale; 500,000 tons per year of LLDPE and 200,000 tons per year of Polypropylene. C4 and C5+ portion plus any excess C2, C3 are presumed to be sold outside. The timing of the start of operation is presumed to be 2016
(4) Supporting Infrastructure
Supporting Infrastructure of CIPP is well planned and being realized to accommodate incoming investment projects, except for federal road condition and railroad system. It is estimated that 56.1% of the pavements of federal roads are in critical condition (CNT 2005-05-19). As central target, Pecem Port, is being prepared. In view of the function of Port as a hub of various transportation systems, and of the fact that contribution of transportation on roads is the main player of inland transportation of Brazil, improvement of federal highway is urgently needed to further improve the performance of Pecem Port.
Another important transportation medium is the railway. In view of the huge quantity of agricultural products of the inland locations such as Cerrado area will necessitate the transportation via railroad to compete with other exporting country such as the U.S.A., where there is an advanced system of transportation by highways, railroads and waterways.
a. Gross and Treated Water, Sewerage and Domestic Solid Waste
Ceara is not really a dry country, with shortage of water resources. Its average annual precipitation of 700mm is on the same level of France. Ceara’s problem is the annual fluctuation and uneven distribution of rainfalls (dry and rainy seasons). It necessitates an ample storage of water and its distribution system to the users.
At present, the problem seems to have been overcome by the installation of Castanhao Dam and the Integrated Canal system, connecting the dam with users around Fortaleza metropolitan area and up to Pecem Industrial Area.
The CIPP Infrastructure study by Federal University of Ceara and CV Engineering dated 2000-07-09 states the untreated water requirements of the CIPP are: 139,275 m3/day in Phase 1, 273,350 m3/day in Phase 2, and 408,900 m3/day in Phase 3. The availability of water through the Integrated Canal is planned to be 22 m3/sec, whereas the requirement in Phase 3 is 4.73 m3/sec. The Castanhao dam is completed in 2003, and the Canal will be in operation in the latter part of 2005.
MAIN REPORT 4 - 10 CHAPTER 4

PECEM INDUSTRIAL AND PORT COMPLEX DEVELOPMENT PLAN FINAL REPORT IN THE FEDERATIVE REPUBLIC OF BRAZIL VOLUME I
Water price for large industrial users is R$4.53/m3. Industrial water is supplied by COGERH, and treated water and sewerage operated by CAGECE. For large industrial users, price will be decided by negotiations, based on required investment and its operation costs.
b. Electricity Distribution
Ceara’s electric power has been supplied by CHESF mainly from its hydroelectric power of San Francisco River. The power is transmitted by 500kV or 230kV high tension lines. Ceara started to diversify the source of electricity to thermal generation and windmill. In CIPP, there are two thermal electric generation plants, CGTF-Central Geradora Termoeletrica Fortaleza S/A (346.63MW) and MXP Termoceara Ltda. (220 MW), based on natural gas to be supplied by Petrobras/GASFOR.
Electricity generation and distribution activities were opened for private investment in 2003, and CGTF is one of the example of private investment of power generation. Distribution system is operated by Companhia de Eletricidade do Ceara-COELCE, which is also privatized. In 2004, COELCE distribution lines reached 80,359 km with 88 substations, with installed capacity of 1,942 MVA.
Power tariff at present consists of three schedules; Blue, Green and Conventional. Customers are free to choose a tariff best fit to their needs and economy. Tariffs are set in accordance with the voltage level, seasons (dry and humid), peak and off-peak hours etc. A customer and supplier can enter into special agreement regardless of the published tariff.
Typical industrial user cost range from R$0.15586 to 0.17651/kwh in Blue Tariff, R$ 0.17027-0.19119/kwh in Green Tariff and R$0.24232/kwh in Conventional Tariff. These figures, at R$2.45/US$ exchange rate, may correspond to 6 for industry, and 10 cents/kwh for households. The power cost seems lower than Japan, and higher than Canada and the U.S.A. Arabian Gulf countries offer lowest cost of around 1.5 cents/kwh
c. Communication and Telephone Systems
As the CIPP Infrastructure study by Federal University of Ceara and CV Engineering dated 2000-07-09 states, it is recommended to install a state-of-the-art communications network and cabling at the very beginning of Phase 1,so that the Pecem Port and the Industrial Complex will be linked to the World effortlessly.
Fixed telephone system is supported by the state government in partnership with TELEMAR, with the primary objective to implant 1,400 public pay telephones in rural areas. In 2001, both installed terminals and operating terminals in fixed telephones are over 300% compares with 1996.
d. Natural Gas Needs for CIPP
A 382 km gas pipeline, Gasfor 1, is transporting 2.4 million m3/day of natural gas from Guamare to Pecem. The second pipeline, Gasfor 2 is scheduled to operate in 2006 with 280km extension, is expected to expand the capacity to 12.0 million m3/day.
LNG Project was once negotiated with Trinidad & Tobago, and due to difference to the gas pricing, was shelved for the time being.
MAIN REPORT 4 - 11 CHAPTER 4

PECEM INDUSTRIAL AND PORT COMPLEX DEVELOPMENT PLAN FINAL REPORT IN THE FEDERATIVE REPUBLIC OF BRAZIL VOLUME I
Gas price is charged according to tariff. The current tariff was published by CEGAS on 2004-02-09. Cost to industrial users range from R$0.5235 to 0.5878/m3 in accordance with daily consumption grouping. These figures roughly correspond to U.S.$6.04-6.79/MMBTU at the exchange rate of R$2.45/US$. The figure may be higher than traditional (U.S.$2-2.5) and current (U.S.$4-4.5) U.S.A. price, but comparable to most of the Asian energy importing countries. In Arabian Gulf, Saudi Arabia was charging 50 cents (now 75 cents), and going price is around U.S.$1.50.
MAIN REPORT 4 - 12 CHAPTER 4

PECEM INDUSTRIAL AND PORT COMPLEX DEVELOPMENT PLAN FINAL REPORT IN THE FEDERATIVE REPUBLIC OF BRAZIL VOLUME I
4.2 Examination of the Basic Strategy for Industrial Development in Ceara State
4.1 Perspective of the Industrial Activities in Ceara State Hundreds of commodities are seen in the export and import cargoes of all kinds, i.e. general, dry bulk and liquid bulk cargoes, at Pecem and Mucuripe Ports. For the purpose of the analysis of the activities of the industries in the hinterland of these ports, the commodities were classified into three categories:
(1) Agricultural products, (2) Products of light industries, and (3) Products of other industries.
The commodities that fall on each of these categories are listed in Table 4.2.1.
Table 4.2.1 Category classification of commodities handled Category for Export c Export Coimmodity code Category for Import com Import Commodity code
Fresh Fruits 1 Rice 1Caju products (cashew nut, etc) 2 Wheat 2Sea food (shrimp, etc.) 3 Fruits 3Juice/Nectar/Pulp of fruits 4 Sea food (shrimp, etc.) 4Carnaúba products (wax, etc) 5 Caju Products (chestnut, etc.) 5Other Agricultural Products 6 Carnauba products (wax, etc.) 6
Pulp/nectar of fruits 7Other agricultural products 8
Textile-related industry products (fiber, threads, clothes, etc.) 7
Cotton9
Foodstuffs 8 Foodstuffs 10Shoes 9 etc.) 11Leather and its goods 10 Leather and its goods 12Wood 11 Wood 13Other Light Industrial Goods 12 Shoes 14
Other light industrial goods 15Stones/mineral 13 Chemical products 16Car/motocycles/buses parts 14 Parts, spare parts 17Metal (steel, iron,aluminum, etc.) 15 Industrial Machines 18Paper 16 Household appliances 19Petroleum Products 17 Metal (steel, iron, aluminum, etc.) 20Parts, spare parts 18 Petroleum products 21Industrial machines 19 Mineral, stones 22Household appliances 20 Paper 23Chemical products 21 Car/motocycles/buses parts 24Other Industrial products 22 Other industrial products 25
Industrial Products(Electrical, Chemical,
Metal, MineralIndustries, Petroleum,
etc.)
Light Industry,Products and its
Material
Agricultural Products Agricultural Products
Light Industry Productsand its Material
Industrial Products(Electrical, Chemical,
Metal, Mineral Industries,Petroleum, etc.)
Source: JICA Study Team
Export commodities are the products of the local industries of respective categories, while the import commodities are classified into two categories: those that are consumable goods for the people of the hinterland and those that are the materials and semi-products for industries to produce their export commodities. Most of the Agricultural Products and the Industrial Products comprising the import commodities consist of the goods for people’s use while the Light Industry Products consist of those materials and semi-products for the local light industries.
Figure 4.2.1 shows the total export volumes of the commodities of the three categories over the period from 1994 through 2004. The volumes include the international and domestic export volumes at both Pecem and Mucuripe Ports. Figure 4.2.2 shows the share of each category in the total export volume.
MAIN REPORT 4 - 13 CHAPTER 4

PECEM INDUSTRIAL AND PORT COMPLEX DEVELOPMENT PLAN FINAL REPORT IN THE FEDERATIVE REPUBLIC OF BRAZIL VOLUME I
It is observed in Figure 4.2.1 that, since the year 2001, the export volumes of each category have been growing at a much higher rate than in the past. The export volume of the Light Industry related commodities has taken a larger share since 2001.
Mucripe & Pecem Total Export General Cargoes
-
50.000
100.000
150.000
200.000
250.000
300.000
350.000
400.000
450.000
1994 1996 1998 2000 2002 2004Year
Sect
or S
hare
in E
xpor
tAgricultural products
Light Industry Products and itsMaterialIndustrial Products
Source: Mucuripe and Pecem Port (Edited by JICA Study Team)
Figure 4.2.1 Export volume of the three commodity categories (International and Domestic, Pecem and Mucuripe Ports)
Mucripe & Pecem Total Export General Cargoes
0%
20%
40%
60%
80%
100%
1994 1996 1998 2000 2002 2004
Year
Sec
tor S
hare
in E
xpor
t
Industrial ProductsLight Industry Products and its MaterialAgricultural products
Source: Mucuripe and Pecem Port (Edited by JICA Study Team)
Figure 4.2.2 Category share in the Export volume (International and Domestic, Pecem and Mucuripe `Ports)
Figure 4.2.3 shows the total Import volumes of the commodities over the same period. It shows a contrast with the export volumes, that import volumes of all three
MAIN REPORT 4 - 14 CHAPTER 4

PECEM INDUSTRIAL AND PORT COMPLEX DEVELOPMENT PLAN FINAL REPORT IN THE FEDERATIVE REPUBLIC OF BRAZIL VOLUME I
categories remain almost the same throughout the period. This is especially true for the Light Industry related products. While the light industries of the hinterland became more active in their export and the export volume takes the largest share, the import volume remains the same (also see Figure 4.2.4). This shows that the majority of the industries in Ceara State produce the export products out of raw materials locally available.
Mucripe & Pecem Total Import volume by category
-200.000400.000600.000800.000
1.000.0001.200.0001.400.0001.600.0001.800.0002.000.000
1994 1996 1998 2000 2002 2004Year
Sect
or S
hare
in E
xpor
t
Agricultural productsLight Industry Products and its MaterialIndustrial Products
Source: Mucuripe and Pecem Port (Edited by JICA Study Team)
Figure 4.2.3 Import volume of the three commodity categories (International and Domestic, Pecem and Mucuripe Ports)
Mucripe & Pecem Total Import General Cargoes
0%
20%
40%
60%
80%
100%
1994 1996 1998 2000 2002 2004
Year
Sect
or S
hare
in Im
port
Industrial ProductsLight Industry Products and its MaterialAgricultural products
Source: Mucuripe and Pecem Port (Edited by JICA Study Team)
Figure 4.2.4 Category share in the Import volume (International and Domestic, Pecem and Mucuripe Ports)
MAIN REPORT 4 - 15 CHAPTER 4

PECEM INDUSTRIAL AND PORT COMPLEX DEVELOPMENT PLAN FINAL REPORT IN THE FEDERATIVE REPUBLIC OF BRAZIL VOLUME I
The Agriculture and Light Industry import commodities tend to remain at the same amount. This implies that 1) the consumption of the people has not increased since the GDP per capita, which is a kind of index to denote the purchasing power of the people, has been almost the same over the past 10 years, 2) the agricultural production in the hinterland has increased, for instance, the volume of the production of corn in Ceara has exceeded that of consumption, 3) reduction of the petroleum import due to the supply of natural gas by pipeline.
The activities of the each sector shall be discussed in the following sections.
(1) Agricultural products
a Import
Cereals (Wheat, Rice and Corn)
The major commodities in this category are wheat and rice. Import volumes of corn used to be substantial, however, it reduced to a very little amount since 2002 (see Figure 4.2.5), when the corn production in Ceara State increased substantially (see Figure 4.2.6).
Import General Cargo (Agricultural Products)
-
200.000
400.000
600.000
800.000
1.000.000
1994 1996 1998 2000 2002 2004
Year
ton
Rice
Wheat
Other agriculturalproducts
Source: Mucuripe and Pecem Port (Edited by JICA Study Team)
Figure 4.2.5 Major import commodities of agricultural products
The wheat consumption in Brazil was about nine (9) million tons over the period from 1997 through 2003. The average consumption per capita is 52.2 kg (see Table 4.2.2).
With the assumption that people of Ceara also consume wheat by 52.2 kg per capita, the wheat import volume at Mucuripe Port is approximately double of the wheat consumption of Ceara Population (see Figure 4.2.7). Therefore, it seems that about a half of the import wheat at Mucuripe Port is transported to other states for consumption. The total population of Piaui, Gio Grande do Norte and Paraiba is approximately equal to the population of Ceara. Thus, wheat imported at Mucuripe is transported to these three states.
MAIN REPORT 4 - 16 CHAPTER 4

PECEM INDUSTRIAL AND PORT COMPLEX DEVELOPMENT PLAN FINAL REPORT IN THE FEDERATIVE REPUBLIC OF BRAZIL VOLUME I
Corn Production and Import of Ceara State
0
200
400
600
800
1.000
1996 1997 1998 1999 2000 2001 2002 2003
Year
1000
ton
Production
Import
Source: Mucuripe Port cargo statistics and Ceara in Numeros 2004 (Edited by JICA Study Team)
Figure 4.2.6 Production and Import of corn in Ceara
Table 4.2.2 Wheat consumption per capita Brazil Consumption
Year Population Consumption per Capita (kg)1000 1000 t (kg)
1997 163,471 7,476 45,71998 165,688 9,174 55,41999 167,910 8,915 53,12000 170,143 9,042 53,12001 169,080 9,287 54,92002 171,317 8,852 51,72003 173,553 8,980 51,7
Average 52,2 Source: Ministry of Agriculture web site (Edited by JICA Study Team)
Wheat import and Consumption
0
200.000
400.000
600.000
800.000
1.000.000
1994 1996 1998 2000 2002 2004
Year
ton
Mucripe Import
Consumption in Ceara
Source: Mucuripe Port cargo statistics and IBGE statistics (Edited by JICA Study Team)
Figure 4.2.7 Wheat import at Mucuripe Port and the consumption in Ceara
MAIN REPORT 4 - 17 CHAPTER 4

PECEM INDUSTRIAL AND PORT COMPLEX DEVELOPMENT PLAN FINAL REPORT IN THE FEDERATIVE REPUBLIC OF BRAZIL VOLUME I
The import and export volumes of rice of Brazil are very small. It seems that the domestic production and consumption of rice are balanced. The average annual consumption per capita is estimated to be 58 kg (See Table 4.2.3). However, except Maranhao, the rice production in the states of the Northeast Region is not sufficient to provide this amount to everyone of the state population. For the four states in the northeast Region, i.e. Piaui, Ceara, Rio Grande do Norte and Paraiba, the local rice production provides only 12,8 kg. In addition, the rice production in all the states in the Region remains unchanged or tends to decrease (see Figure 4.2.8 and 4.2.9).
Table 4.2.3 Rice production and per capita production Unit : kg Population Brasil Northeast 4 States Maramhao Piaui Ceara Rio Grand do
norte1996 161.247.046 45.411 20.968 5.331 2.727 6.958 2.6171997 163.470.521 45.993 21.263 5.411 2.756 7.076 2.6571998 165.687.517 46.576 21.557 5.491 2.785 7.195 2.6971999 167.909.738 47.158 21.852 5.571 2.814 7.313 2.7372000 170.143.121 47.741 22.146 5.651 2.843 7.431 2.7772001 172.382.797 48.320 22.439 5.731 2.872 7.548 2.8172002 174.622.472 48.899 22.731 5.810 2.901 7.666 2.857
Prod/Person1996 53,6 21,4 14,7 104,1 61,1 16,9 1,41997 51,1 21,5 12,9 103,3 50,6 16,9 0,61998 46,6 15,9 9,0 69,4 30,6 14,8 0,01999 69,7 25,3 16,7 116,0 81,7 17,7 0,22000 65,4 27,7 18,5 128,7 86,9 20,0 0,62001 59,1 20,2 9,9 108,8 56,8 6,8 1,92002 59,9 19,0 8,1 108,2 31,0 10,7 1,4
Average 57,9 21,6 12,8 105,5 57,0 14,8 0,9
Source: IBGE (Edited by JICA Study Team)
Rice Production
0
100.000
200.000
300.000
400.000
500.000
600.000
700.000
800.000
1996 1997 1998 1999 2000 2001 2002
Year
ton
Maranhão
Piauí
Ceará
Source: IBGE
Figure 4.2.8 Rice Production in Maranhão, Piaui and Ceara States
MAIN REPORT 4 - 18 CHAPTER 4

PECEM INDUSTRIAL AND PORT COMPLEX DEVELOPMENT PLAN FINAL REPORT IN THE FEDERATIVE REPUBLIC OF BRAZIL VOLUME I
0
20.000
40.000
60.000
80.000
100.000
120.000
1996 1997 1998 1999 2000 2001 2002Year
ton
Rio Grande do Norte ParaíbaPernambuco AlagoasSergipe Bahia
Source: IBGE
Figure 4.2.9 Production of Rice in other states in Northeast Region
b Export Agricultural products are the major export commodity. Figure 4.2.10 shows the export volume of agricultural products over the past 10 years. Cashew nuts have been the principal export products. In the recent years, the increase of banana export has been tremendous, Sea food, especially shrimps, and juice exports are also increasing.
The rapid increase of banana export is due to fruit plantation of foreign agro-industry, such as Del Monte. Ceara does not have enough water for agriculture because of the dry season it goes through. However, when the ongoing “San Francisco River Diversion Project is completed, 48,000 ha of farm land will be irrigated. Thus the agricultural production is expected to grow further.
Besides banana, the volumes of production of other kind of fruits are also increasing. Figure 4.2.11 shows the annual production of cashew, melon, mango and papaya in Ceara. These fruits are major export commodities, and it seems their production tends to keep growing.
Ceara Export Agricultural Products
0
20.000
40.000
60.000
80.000
100.000
120.000
140.000
160.000
180.000
200.000
1994 1996 1998 2000 2002 2004
Year
ton
Fresh fruits
Caju products (cashew nut, etc.)
Sea food (shrimp, etc.)
Juice/nectar/pulp of fruits
Carnauba products (wax, etc.)
Source: Mucuripe and Pecem Port (Edited by JICA Study Team)
Figure 4.2.10 Export volume of major agricultural commodities of Ceara
MAIN REPORT 4 - 19 CHAPTER 4

PECEM INDUSTRIAL AND PORT COMPLEX DEVELOPMENT PLAN FINAL REPORT IN THE FEDERATIVE REPUBLIC OF BRAZIL VOLUME I
Fruit Production
0
20.000
40.000
60.000
80.000
100.000
120.000
140.000
1996 1998 2000 2002
ton
Castanha de caju
Melao
Manga
Mamao
Source: Ceara em Números 2004
Figure 4.2.11 Production of potential export fruit
(2) Small and light industries
a Import The import volume of light industry related products is relatively small, because most of the local light industries produce their products from locally available raw materials. The textile industries used to import substantial amount of cotton feather, the import volume tends to decrease. This might result from the increase in the local cotton production, Ceara and Bahia States, structural change in textile factory in Ceara: from cotton to synthetic fibers, or competition in the export market (see Figure 4.2.12).
Import General Cargo (Light Industry Rrelated)
-
50.000
100.000
150.000
1994 1996 1998 2000 2002 2004
Year
ton
Cotton
Foodstuffs
Textile-related industry
Other light industrial goods
Source: Mucuripe and Pecem Port Statistics (Edited by JICA Study Team)
Figure 4.2.12 Import volume of Light Industry related commodities
b Export The export volumes of the Light Industry related products are shown in Figure 4.2.13. The increase of Salt export is tremendous. The export volumes of local products of
MAIN REPORT 4 - 20 CHAPTER 4

PECEM INDUSTRIAL AND PORT COMPLEX DEVELOPMENT PLAN FINAL REPORT IN THE FEDERATIVE REPUBLIC OF BRAZIL VOLUME I
light industries, such as leather and shoes, have been increasing since 2002, while that of textile decreased in 2004. Apart from the rapid increase in salt export, the total of other products (see the curve ‘Sub-total excluding Salt” in the Figure drawn with □) has increased more than two folds, while export volume of the textile industry related commodity shows a decrease in 2004.
Ceara Export Light Industry Products
0
50.000
100.000
150.000
200.000
250.000
300.000
1994 1996 1998 2000 2002 2004Year
ton
Textile-related industry Sub-total (Exclude Sal)ShoesLeather and its goodsSal
Source: Mucuripe and Pecem Port Statistics (Edited by JICA Study Team)
Figure 4.2.13 Export of light industry related products
(3) Other industry
The products other than the categories of agriculture and Light Industry are classified as other industry products. This category includes the liquid bulk, mainly petroleum products that take substantial part of the total volume of this category. As seen in Figure 4.2.14, the petroleum encompasses more than 80% of the total volume of the commodities of this category. However, it is observed that the import volumes of commodities other than petroleum have been growing, while the petroleum import tends to decline.
Thus, the trends of import and export petroleum products are reviewed below.
Import Cargo (Other Industry Products
-
500.000
1.000.000
1.500.000
2.000.000
1994 1996 1998 2000 2002 2004
Year
ton
Sub-total
Petroleum products
Total volumeexcluding petroleum
Source: Mucuripe Port , Edited by JICA Study Team
Figure 4.2.14 Import volumes of petroleum and other commodities
MAIN REPORT 4 - 21 CHAPTER 4

PECEM INDUSTRIAL AND PORT COMPLEX DEVELOPMENT PLAN FINAL REPORT IN THE FEDERATIVE REPUBLIC OF BRAZIL VOLUME I
a. Petroleum products
(a) Import of petroleum products
Since no storage facilities presently exist at Pecem Port, the petroleum for local consumption is unloaded at Mucuripe Port, while the former handles the transhipment from a ocean going tanker to smaller tanker for coastal service. Thus, the petroleum products consumed in Ceara and other stated nearby are unloaded only at Mucuripe Port.
As Figure 4.2.15 shows, the total import volume (including both international and domestic) has decreased from 1,700,000 tons in 1996 to 1,100,000 tons in 2004, while the export total has been the same volume over the period. This implies that the pipeline operation from Bahia has reduced the petroleum products at the port. It should be also noted that, due to the Federal Government Policy to achieve self supply of petroleum, import (international) has almost ceased (See Figure 4.2.16).
Petroleum unloading and loading at Mucripe Port
0
200.000
400.000
600.000
800.000
1.000.000
1.200.000
1.400.000
1.600.000
1.800.000
1994 1996 1998 2000 2002 2004Year
ton
Import Sub Total
Export Sub Total
Source: Mucuripe Port, Edited by JICA Study Team
Figure 4.2.15 Import and Export of Petroleum Products at Mucuripe Port (b) Re-export and transhipment of petroleum products
Mucuripe Port has been re-exporting petroleum product. The volume of re-export has dropped since 2002, when Pecem Port started its transhipment operation of petroleum products (See Figure 4.2.17). Thus, one of the functions of Mucuripe Por thus been taken over by Pecem Port.
MAIN REPORT 4 - 22 CHAPTER 4

PECEM INDUSTRIAL AND PORT COMPLEX DEVELOPMENT PLAN FINAL REPORT IN THE FEDERATIVE REPUBLIC OF BRAZIL VOLUME I
Import of Petroleum products
0
200.000
400.000
600.000
800.000
1.000.000
1.200.000
1994 1996 1998 2000 2002 2004Year
ton
International
Domestic
Source: Mucuripe Port, Edited by JICA Study Team
Figure 4.2.16 International and domestic import of Petroleum products at Mucuripe Port
Petrorleum loading
0
50.000
100.000
150.000
200.000
250.000
300.000
350.000
400.000
1994 1996 1998 2000 2002 2004
Year
Ton
Pecem Transshipment
Mucripe Export sub total
Source: Mucuripe and Pecem Ports (Edited by JICA Study Team)
Figure 4.2.17 Petroleum re-export at Mucuripe and transhipment at Pecem Port
b Commodities related to other industries (except petroleum)
(a) Import
The major commodities of this category are metal, chemical products and paper (see Figure 4.2.18).
The main item among metal is roll of steel plate, which is related to the local manufacturing industry that produces construction steel materials for local use. One of the companies of this type of manufacturing business has a plan to expand its factory even without the steel mill in CIPP. The import of chemical products, which are
MAIN REPORT 4 - 23 CHAPTER 4

PECEM INDUSTRIAL AND PORT COMPLEX DEVELOPMENT PLAN FINAL REPORT IN THE FEDERATIVE REPUBLIC OF BRAZIL VOLUME I
related to the textile business, has been steadily increasing since 1996. The import of paper, which is for newspaper and other publications tends to increase.
Import volumes of minor commodities are shown in Figure 4.2.19. Though the volumes have been small so far, the increases of “Parts and Spare parts” and “Car/Motorcycle/Bus spare parts”, which are indicated in Figure 4.2.19 with ○ and △, respectively, over the past few years are remarkable. The sum of import volume of other various commodities of this category has also been increasing for the past two years.
Import General Cargo (Other industry Products)
-
50.000
100.000
150.000
200.000
1994 1996 1998 2000 2002 2004
Year
ton
Chemical productsMetalPaperMineral, stones
Source: Mucuripe and Pecem Ports (Edited by JICA Study Team)
Figure 4.2.18 Major import commodities related other industry
Import General Cargo (Products related Other Industry)
-
5.000
10.000
15.000
20.000
25.000
1994 1996 1998 2000 2002 2004
Year
ton
Parts, spare partsIndustrial machinesHouseholds appliancesCar/motocycles/buses partsOther industrial products
Source: Mucuripe and Pecem Ports (Edited by JICA Study Team)
Figure 4.2.19 Minor import commodities of industry products
MAIN REPORT 4 - 24 CHAPTER 4

PECEM INDUSTRIAL AND PORT COMPLEX DEVELOPMENT PLAN FINAL REPORT IN THE FEDERATIVE REPUBLIC OF BRAZIL VOLUME I
(b) Export
The major export commodities of this category are “Stones/Minerals”, “Car/Motorcycle/Bus Spare parts”. The increase of export of “Stones/mineral”, which consists mainly of granite, is tremendous since 2000 (see Figure 4.2.20).
According to the interview with a company that produces granite blocks and plates, there are many granite and marble mining companies in Ceará and other states in Northeast Region. The main products are blocks, which have been transported in containers to those ports in Pernambuco and Bahia. China is the major country of destination. Those granite blocks are processed in China and then exported to Japan. It seems that the demand of granite in Japan tends to increase over the coming decades for its aging population. Ceara state has large resources of granite and other stones. Though the future of stone export is highly dependent on the marketing and sales efforts, the most necessary for granite business in Ceara is to introduce high technique cutting system, which makes the productivity about 10 times higher than the currently used system. The idea of the manager interviewed is to establish a granite processing factory near Pecem Port where the blocks brought by various mining companies are processed with high technique cutting system.
It is worthwhile to note that the increase in the export of “Parts and Spare Parts” and “Car/Motorcycle/Bus” spare parts in the export coincides with that in the import of the same commodities. This trend may be an indication of the fact that such new businesses have started to import semi-products from U.S., manufacture parts and spare parts of automobiles and other machines, and then export their products to the local and international markets.
Ceara Export Other Industry Products
0
10.000
20.000
30.000
40.000
50.000
60.000
70.000
80.000
1994 1996 1998 2000 2002 2004Year
ton
Stones/mineral
Car/motocycles/buses parts
Parts, spare parts
Source: Mucuripe and Pecem Port, editied by JICA Study Team
Figure 4.2.20 Minor export commodities of industry products
MAIN REPORT 4 - 25 CHAPTER 4

PECEM INDUSTRIAL AND PORT COMPLEX DEVELOPMENT PLAN FINAL REPORT IN THE FEDERATIVE REPUBLIC OF BRAZIL VOLUME I
(4) Anchor industries of CIPP (Steel Mill, Oil Refinery and Petrochemical) The CIPP Development Plan includes three anchor industries: Steel mill, Oil refinery and Petrochemical. According to the plans that are available to date, the specifications of these three anchor industries are as follows:
a Steel Mill The method employed to produce steel is the Direct Reduction Furnace. The plan will be implemented in two phases. When the whole plan is completed, the steel mill will be producing three million (3,000,000) tons of thick steel slabs per year. Most of the products are expected to be shipped to Korea for shipbuilding.
When the steel mill is fully operational, it will import five millions (5,000,000) of iron pellets from Madeira Port, San Luis. The plant will use natural gas, which will be supplied through the pipeline from Bahia State. The first phase is half of the scale and is intended to produce 1.5 million tons of thick slabs per year.
The First Phase is to start supposedly in August, 2005 and is expected to be completed in 2007.
b Oil refinery The consumption of diesel oil in Northeast Region has already exceeded the capacity of the existing oil refineries in the region, and substantial amount of diesel oil is transported from southern regions. Thus a new oil refinery is urgently needed.
The Ceara State government has been making efforts to invite Petrobras to set up its plant in CIPP, while Suape has been assessed to be another potential site for the plant. The negotiation is underway and Petrobras is expected to announce its decision sometime in 2005.
According to the plan, the capacity of the plant is to process 200,000 barrels of crude oil per day. The total production of petroleum products will be 7,552,850 tons: Gasoline; 546,700 tons, LPG; 409,200 tons, Naphtha; 1,058,750 tons, Diesel Oil; 5,178,800 tons, Kerosene; 356,400 tons, and Coke; 3,000 tons.
c Petrochemical
Since the construction of the oil refinery has net yet been confirmed, there is no fixed construction plan of the Petrochemical plant.
The following is the specifications seen in the plan:
The capacity of the naphtha processing is 1,500,000 tons. This amount exceeds the capacity of the Oil Refinery planned above by 450,000 tons. Thus, when the petrochemical plant is fully operated, the plant need to import 450,000 tons of naphtha.
The annual productions are estimated as follows:
LLDPE (Linear Low Density Polyethylene); 500,000 tons,
PP (Polypropylene); 200,000 tons,
C4+; 200,000 tons.
All these products are for export.
MAIN REPORT 4 - 26 CHAPTER 4

PECEM INDUSTRIAL AND PORT COMPLEX DEVELOPMENT PLAN FINAL REPORT IN THE FEDERATIVE REPUBLIC OF BRAZIL VOLUME I
4.2.2 Industrial Development Plan of CIPP
(1) Original Plan and current status
a Original Plan The concept of CIPP development plan is intended firstly to attract the anchor industries, i.e., steel mill, oil refinery and petrochemical. Then these anchor industries attract immediately related industries. This, in turn, attracts other industries inter-connected through productive chains. In addition to the industry complex within the CIPP, the logistic platform such as transportation system including warehouses will be developed for the effective transportation of goods between the port and hinterland outside of CIPP. With the establishment of an industrial complex that consists of various kinds and scales of industries, substantial amount of jobs will be created.
Source: Report, Pecem Industrial and Port Complex, 2002
Figure 4.2.21 Original development concept of CIPP
MAIN REPORT 4 - 27 CHAPTER 4

PECEM INDUSTRIAL AND PORT COMPLEX DEVELOPMENT PLAN FINAL REPORT IN THE FEDERATIVE REPUBLIC OF BRAZIL VOLUME I
Figure 4.2.21 is the schematic exhibit of the CIPP development concept.
This concept is highly dependent on the existence of the anchor industries. Without them, the whole development concept will corrupt. Therefore, the Ceara State government has been making great effort to attract the anchor industries, especially, steel mill and oil refinery. The port facilities for conventional cargoes such as iron ore and steel products and unloading and loading facilities as well as pipelines have been constructed by the state government. While the port facilities have been ready to provide services to the anchor industries since 2001, the establishment of these industries has been delayed. The steel mill, which is finally about to start the construction, will produce only thick plates for specific use overseas. The metallurgical industry, which has been growing presently, will not be benefited by the steel mill in CIPP and have to keep importing roles of steel and coils. Thus, the steel mill that will be operating in the time due is still apart from line of the original concept of CIPP development.
b Current Status The location of CIPP, the size of which is around 350,000 ha, similar to the size of the city of Fortaleza, is located 3 32´33”S 38 48´30”W on the coast of both Caucaia and Sao Goncalo de Amarante municipalities. (Since December 29, 1999, Sao Goncalo de Amarante became a part of FMR.
CIPP is a planned large scale industrial district where the state government purchased the land for future allocation of incoming factories. In other locations in Ceara, industrial aggregation was realized as a result of inflow of many factories, not by prior planning, although the state government made arrangements for the supply of infrastructure and utilities, but mainly due to incentives both from federal (SUDENE-FINOR) and state government (FDI).
.Another point to be taken into consideration is that the CIPP development should not repeat the unwanted side-effects of unplanned urbanization near the industry area and the subsequent social pollution and crimes. Also, the measures to contain trespassers of CIPP at an early stage and to enforce law and orders at all stages will be required to maintain sustainable growth of CIPP in a long range. For this purpose, a suitable urban development plan within and outside of CIPP in the above point of view is required.
As of August 2005, only four (4) companies are located in CIPP:
- Central Geradora Termeletrica Fortaleza S/A – CGTF
- MPX Termoceara Ltda.
- Wobben Wind Power Industria Comercia
- Jota Dois NE Ltda.
The first two are thermoelectric plants based on natural gas, and power plants are considered one of key industries for CIPP. MPX Termoceara Ltda. is inoperative at present due to the actual balance between supply and demand in electric energy. These plants were projected as stand-by sources of electric energy, in the event of shortage as occurred in 2001-2002 in Brazil. A Steel Mill is expected to start construction towards the end of 2005, while Refinery location is not yet decided
MAIN REPORT 4 - 28 CHAPTER 4

PECEM INDUSTRIAL AND PORT COMPLEX DEVELOPMENT PLAN FINAL REPORT IN THE FEDERATIVE REPUBLIC OF BRAZIL VOLUME I
between Pernambuco and Ceara. The delay of the Anchor industries to locate in CIPP resulted in a lack of subsequent medium-small industries catering to those Anchors.
a. Power plants
Power plants were planned to fill the gap between the demand of electricity and the supply by conventional hydro-electricity, which caused the black out of 2001.
There are two power plants based on natural gas in CIPP. One is a 346.63MW plant owned by COELCE, the other with 230MW capacity.
b. Steel mill
The steel plant in the first phase will start as DRI and steel slab plant, instead of originally planned cold roll plant.
Steel Mill project is promoted by USC (Usine Siderurgica Ceara), a joint venture of Dongkuk Steel of Korea (50 %), and Danieli of Italy (30%) and CVRD of Brazil (20%). The total investment amount is expected to be US$754 million, about 35% from equity and the remainder from loans. Industrial gas, lime and refractory plants are expected to be in CIPP to serve the steel project, with estimated US$60 million investments. It is expected to generate about 3,400 direct employments during the plant construction, and 1,600 direct and indirect employments during operation.
As of May 2005, USC Phase 1 plan is to produce 1.5 million tons of Steel Slab. The main raw material is 2.5 million tons of Iron Ore Pellet, supplied by CVRD, to be processed through Direct Reduction process of Danieli, then the product iron goes through electric arc furnace, then through slab caster to produce 1.5 million tons per year of steel slab.
Currently, USC is planning to double the above capacity within a few years of the first phase.
c. Refinery
Various studies have been done on possibilities of refinery in the Northeast region. A study by TP&E Associados S/C Ltda. dated 2003-05-12 estimates the deficits of petroleum products in the North and Northeast regions in 2010 will be as follows:
Gasoline 29,300 b/d LPG 38,600 Naphtha 99,000 Diesel 122,000 Kerosene 14,800
The study suggests a refinery be set up in CIPP with 200,000 b/d capacity, with the following product slate.
Gasoline 14,200 b/d LPG 12,400 Naphtha 27,500 Diesel 117,700 Kerosene 8,100 Coke 3,000 t
MAIN REPORT 4 - 29 CHAPTER 4

PECEM INDUSTRIAL AND PORT COMPLEX DEVELOPMENT PLAN FINAL REPORT IN THE FEDERATIVE REPUBLIC OF BRAZIL VOLUME I
The refinery fills only a part of the deficits in Northeast, and another refinery of similar size is bound to be needed in some location in the North-Northeast regions. As of June 2005, the location of the new refinery is not decided yet. If it is located within CIPP, the cargo flow through Pecem port will have to start in 2009, and if it is located in another place in the Northeast, there still is a necessity of another refinery within a reasonable time span. For the purpose of cargo forecast for Pecem port, optimistic case includes refinery cargo flow to start in 2009, and medium case presumes that the flow starts in 2019.
d. Petrochemical Complex
World ethylene demand in 2003 was 97.3 million tons. In 2004, the world ethylene demand grew to 103.0 million tons, 5.5% over the previous year, especially in China, the demand grew 7.6%. Based on the assumption that the world economy will grow steadily, the ethylene demand in 2009 will be 132.8 million tons with an average yearly growth rate of 5.3%. Growth rates differ by regions and countries. Asia will grow at 6.7%, North America by 4.1%, EU by 2.1%. The demand in Japan in 2009 will be 5.5 million tons, 0.1 million tons lower than 5.6 million tons in 2003 and 5.8 million tons in 2004, due to the increase of import of ethylene derivatives and the relocation of ethylene and derivatives users outside Japan. As to propylene, the world demand in 2003 was 58.8 million tons, and the forecast for 2009 demand is 78.9 million tons.
Growth in North America will be that of the U.S.A., Mexico will grow at a lower rate than the U.S.A. Central and South Americas are represented by Mexico and Brazil. Mexico’s Pemex is unable to satisfy petrochemical raw material users by lowering price, at the same time feeling pressure from its labor union against privatization of the petrochemical industry. For some time to come, any remarkable growth of petrochemical industry will not be realized in Mexico. Brazil has its strength in export experience in petrochemicals as it started ethylene from ethanol production and export petrochemicals.
Seventy per cent (70%) of the U.S. ethylene is made from ethane-propane feedstock from natural gas. Natural gas price jumped from traditional $2-2.50/MMBTU to $18 in 2003. It settled later at $4-4.50/MMBTU, but at this level it may put the petrochemicals in U.S.A. uncompetitive in the international market, and may put the U.S.A. in net-importer position of petrochemicals and their downstream products. Brazil may benefit from the situation if the high cost of natural gas in the U.S.A. continues, because the raw material price may become comparatively lower than that of the U.S.A.
Except for the U.S.A. and oil producing countries, petrochemical building block (ethylene) is produced by thermal cracking of naphtha. A gas based ethylene cracker needs around 25% more in quantity of c2+ over ethylene as feedstock. Natural gas is usually composed of more than 80% methane, which is used as fuel or a feedstock of c1 chemicals such as methanol or N fertilizer. Brazil’s existing petrochemical centers are all based on naphtha, and located next to refineries to secure stable supply of the major part of naphtha. Brazil’s petrochemical centers are as follows:
MAIN REPORT 4 - 30 CHAPTER 4

PECEM INDUSTRIAL AND PORT COMPLEX DEVELOPMENT PLAN FINAL REPORT IN THE FEDERATIVE REPUBLIC OF BRAZIL VOLUME I
Year Location Ethylene Capacity Adjoining Refinery
#1 1972 Cubatao, SP 500,000 t/y Pres. Bernerdes/RPBC 170,000 b/d
#2 1978 Camacari, BA 1,280,000 t/y Landulpho Alves/RLAM 307,000 b/d
#3 1982 Copesul, RS 1,135,000 t/y Alberto Pasquallini/REFAP 189,000 b/d
If a naphtha cracker is located in CIPP, it should mean that a refinery should have been located in CIPP before the naphtha cracker, unless there is a source of natural gas capable of supplying ample feedstock ethane to produce ethylene. In CIPP, even LNG re-gasification project materialized, the supply of enough ethane would be difficult if ethylene is based on ethane feedstock. In this exercise, petrochemical complex in CIPP is supposed to be based on naphtha from a refinery nearby , with additional supply from other refineries or import.
A one million ton ethylene plant may be, theoretically, more competitive in production cost and many petrochemical plants of the world have this capacity. The large scale plant, although competitive costwise, may create another risk of shutdown accident affecting larger scale of downstream plants. In the present exercise, a naphtha cracker of 500,000 tons per year of ethylene is therefore presumed. Also the downstream products are simplified as much as possible at the same time to realize competitive scale; 500,000 tons per year of LLDPE and 200,000 tons per year of Polypropylene. C4 and C5+ portion plus any excess C2, C3 are presumed to be sold outside. The start of operation is presumed to be 2016.
(2) Alternative plan for CIPP Development In line with the state government policy of decentralization and job creation on the rural municipalities, industrial estates have been established in remote municipalities outside of Fortaleza, the State Capital (see Figure 4.2.22). This might be one of the reasons why most of the light industries established so far tended to produce their products out of locally available materials. Thus, the state government introduced a concept of developing an industrial complex of anchor industries.
The present number of establishments in CIPP shows that the Anchor companies are not yet located in CIPP. There is no Steel Mill or Refinery yet, against the original plan. They may come in the long run. Steel Mill project is at the final stage of negotiation. Refinery, whether the first one in the Northeast region comes to CIPP is not yet certain, but the possibility of subsequent refineries to be located in CIPP is high, in view of the demand growth of petroleum products in the Northeast.
The original CIPP plan is based on ‘Anchor Industry’ or ‘Radius-Nuclei’ model, where one or more anchor industry is connected with the outside of the industrial district. They generate an extensive medium to small company network that is dependent on the anchor companies. The configuration is similar to ‘Hub and Spoke’ in various model including that of transportation network.
In this paradigm, Anchor Industry is to be located first, followed by satellite companies, not vice versa. Up to September 2005, Steel Company is planning to locate in CIPP, when some of the remaining agreements are finalized. Other ‘Anchor Industries’ originally expected, such as Refinery and Petrochemical Complex, are not
MAIN REPORT 4 - 31 CHAPTER 4

PECEM INDUSTRIAL AND PORT COMPLEX DEVELOPMENT PLAN FINAL REPORT IN THE FEDERATIVE REPUBLIC OF BRAZIL VOLUME I
certain yet. Two Power Plants were built, and one is not in operation. Next refinery location is not yet decided. Petrochemical Complex may not be established without refinery unless it is based on ethane-propane-plus portion of natural gas in a region rich in such natural resources. Over the past few years, while the establishment of anchor industries delayed, those traditional light industries as well as the agro-industries have expanded the export of their products and it can be said that the efforts of the state government has been bearing the fruits. In addition, the leap in the export coincides with the opening of Pecem Port, the deep draft port that can accommodate ocean-going container carriers. Due to the direct calls of container ships plying in the sea routes between Europe/East coast of U.S. and South America and due to the lower port charges at the Port, the export industries must have been benefited by the transport cost reduction.
On the other hand, as observed in Section 4.2.1 (3), the export of stones, parts and spare parts and car parts has also been increasing. Car parts and spare parts import also tends to increase. This situation may indicate that such a new business has been growing importing intermediate and semi-products and re-exporting the finished products to the foreign or domestic automobile makers. This type of value-adding manufacturing industries will be advantageous if the factories of these industries are located in the neighbourhood of the port, for the transportation cost between the port and their factories.
Ceara State and adjacent states are rich in granite and marble, and therefore, many stone-mining companies are producing stone blocks, because they lack modern cutting machines to produce tiles our of the blocks. Since the introduction of high tech-cutting machine requires large amount of investment, which is too much for individual companies, they tend to export stones in blocks. Thus, by establishing a stone cutting center in CIPP area, they will be able to export more value-added products in response to the clients in a timely manner.
The original concept of CIPP development was to attract and promote relating industries to the anchor industries. It is not only the anchor industries that accompany relating industries. Light industries also are interrelated to each other. While the state policy of decentralization created jobs in rural municipalities, it discouraged the establishment of logistic businesses because the industrial estates are apart from each other. This might have led the local society of industries to think of the concept of “Marshalling District” in the CIPP area.
“Marshalling District” is the area where small and medium size companies locate themselves to take advantage of the benefits of a common infrastructure. This type is popular among various industrial estates all over the world. This model does not have the precondition of Anchor industries to locate first. With Pecem Port in the adjacent area, CIPP will have a prime value, to be jealously held by the government of Ceara. The criteria for locating in CIPP would be whether the establishment could be located outside without losing its competitive edge. The establishments to be initially located in CIPP should be in logistics field, with the possibility of enhancing the geographical advantage of Pecem port, thus increasing serviceability to companies both within and outside of CIPP.
MAIN REPORT 4 - 32 CHAPTER 4

PECEM INDUSTRIAL AND PORT COMPLEX DEVELOPMENT PLAN FINAL REPORT IN THE FEDERATIVE REPUBLIC OF BRAZIL VOLUME I
Other Industry
Sobral
Juazeiro
MaracaLight Industry
Light Industry
Agropolos
Agropolos
Agropolos
CIPP
Source: Ceara State Government, edited by JICA Study Team Figure 4.2.22 Location of industrial estates and agro-poles in Ceara
Another category would be an exporting industry based on imported raw materials. Proximity to the port is necessary for this type of operation, and establishment of EPZ may strengthen the operation. There is a study and proposal for reviving EPZ scheme in CIPP by SDE, dated June 2004. EPZ, if realized, would be located within or close to the multimodal logistic yard in CIPP. Existence of EPZ will give additional flexibility and attraction for establishments considering factory location in Ceara.
Establishments locating in CIPP based on Marshalling yard concept may also be located near multimodal logistic yard. It should be noted that the existence of Pecem
MAIN REPORT 4 - 33 CHAPTER 4

PECEM INDUSTRIAL AND PORT COMPLEX DEVELOPMENT PLAN FINAL REPORT IN THE FEDERATIVE REPUBLIC OF BRAZIL VOLUME I
port is in itself an attractiveness for municipalities in Ceara and neighbouring states, and those locations outside CIPP will also benefiting as shown in the increase of export through Pecem port.
It is recommended to adhere to the original Anchor industry paradigm, at the same time introduce Marshalling District paradigm and EPZ concept to CIPP for more flexible and early realization of industrial development, not only in CIPP but also in municipalities in Ceara and neighbouring states.
Figure 4.2.23 is a schematic drawing of the new concept of CIPP development.
Source: JICA Study Team
Figure 4.2.23 Alternative develop concept of CIPP
Marshalling District
At CIPP Area
Any size of Industries
and Agro-industry
MAIN REPORT 4 - 34 CHAPTER 4

PECEM INDUSTRIAL AND PORT COMPLEX DEVELOPMENT PLAN FINAL REPORT IN THE FEDERATIVE REPUBLIC OF BRAZIL VOLUME I
(3) Infrastructure enhancement plan
a Gross and Treated Water, Sewerage and Domestic Solid Waste Ceara is not really a dry country, with shortage of water resources. Its average annual precipitation of 700mm is on the same level of France. Ceara’s problem is the annual fluctuation and uneven distribution of the rainfalls (dry and rainy seasons). It necessitates an ample storage of water and its distribution system to the users.
At present, the problem seems to have been overcome by the installation of Castanhao Dam and the Integrated Canal system, connecting the dam with users around Fortaleza metropolitan area and up to Pecem Industrial Area.
The CIPP Infrastructure study by Federal University of Ceara and CV Engineering dated on July 9, 2000 states the untreated water requirements of the CIPP are: 139,275 m3/day in Phase 1, 273,350 m3/day in Phase 2, and 408,900 m3/day in Phase 3. The availability of water through the Integrated Canal is planned to be 22 m3/sec, whereas the requirement in Phase 3 is 4.73 m3/sec. The Castanhao dam was completed in 2003, and the Canal will be in operation in the latter part of 2005.
Water price for large industrial users is R$4.53/m3. Industrial water is supplied by COGERH, and treated water and sewerage operated by CAGECE. For large industrial users, price will be decided by negotiations, based on required investment and its operation costs.
b Electricity Generation and Distribution Ceara’s electric power has been supplied by CHESF mainly from its hydroelectric power of San Francisco River. The power is transmitted by 500kV or 230kV high tension lines. Ceara started to diversify the source of electricity to thermal generation and windmill. In CIPP, there are two thermal electric generation plants, CGTF-Central Geradora Termoeletrica Fortaleza S/A (346.63MW) and MPX Termoceara Ltda. (220 MW, operation suspended), based on natural gas to be supplied by Petrobras/GASFOR.
Electricity generation and distribution activities were opened for private investment in 2003, and CGTF is one of the examples of private investment of power generation. Distribution system is operated by Companhia de Eletricidade do Ceara-COELCE, which is also privatized. In 2004, COELCE distribution lines reached 80,359 km with 88 substations, with an installed capacity of 1,942 MVA.
Power tariffs at present consists of three schedules; Blue, Green and Conventional. Customers are free to choose the tariff best fit to their needs and economy. Tariffs are set in accordance with the voltage level, seasons (dry and humid), peak and off-peak hours etc. A customer and supplier can enter into special agreement regardless of the published tariff.
Typical industrial user cost range from R$0.15586 to 0.17651/kwh in Blue Tariff, R$ 0.17027-0.19119/kwh in Green Tariff and R$0.24232/kwh in Conventional Tariff. These figures, at R$2.45/US$ exchange rate, may correspond to 6 for industry, and 10 cents/kwh for households. The power cost seems lower than Japan, and higher than Canada and the U.S.A. Arabian Gulf countries offer a lowest cost of around 1.5 cents/kwh
MAIN REPORT 4 - 35 CHAPTER 4

PECEM INDUSTRIAL AND PORT COMPLEX DEVELOPMENT PLAN FINAL REPORT IN THE FEDERATIVE REPUBLIC OF BRAZIL VOLUME I
(4) Communication and Telephone Systems As the CIPP Infrastructure study by Federal University of Ceara and CV Engineering dated 2000-07-09 states, it is recommended to install a state-of-the-art communications network and cabling at the very beginning of Phase 1,so that Pecem Port and the Industrial Complex are linked to the World effortlessly.
Fixed telephone system is supported by the state government in partnership with TELEMAR, with for primary objective to implant 1,400 public payphones in rural areas. In 2001, both installed terminals and operating terminals in fixed telephones are over 300% compared with 1996.
(5) Natural Gas Needs for CIPP A 382 km gas pipeline, Gasfor 1, is transporting 2.4 million m3/day of natural gas from Guamare to Pecem. The second pipeline, Gasfor 2 is scheduled to operate in 2006 with 280km of extension, and is expected to expand the capacity to 12.0 million m3/day.
LNG Project was once negotiated with Trinidad & Tobago, and due to the difference of gas pricing, it was shelved for the time being.
Gas price is charged according to tariffs. The current tariff was published by CEGAS on 2004-02-09. The price offered to industrial users ranges from R$0.5235 to 0.5878/m3 in accordance with daily consumption grouping. These figures roughly correspond to U.S.$6.04-6.79/MMBTU at the exchange rate of R$2.45/US$. The figure may be higher than traditional (U.S.$2-2.5) and current (U.S.$4-4.5) U.S.A. price, but comparable to most of the Asian energy importing countries. In Arabian Gulf, Saudi Arabia was charging 50 cents (now 75 cents), and the going price is around U.S.$1.50.
(6) Current status of Land use in CIPP As discussed above, only four (4) companies are operating in CIPP, one of which; MPX Termoceara Ltda. is in stand-by condition. No Anchor company expected in the original vision is located in CIPP yet, except for two power plants. Steel Mill is expected to start construction within 2005, and the Refinery did not decide the location (Pernambuco or Pecem) yet. Since there was a delay in the establishment of anchor companies in CIPP, the inflow of other companies was not realized yet.
Since the current CIPP land use plan already includes large areas for other industries apart from those zones allocated to anchor industries and related industries, the change in the CIPP development concept will not require a drastic revision of the land use plan. The Marshalling Districts and EPZ are the concepts how to develop the zones for other industries.
4.2.3 Examination of the basic strategy and program for industrial development The original radius-nuclei concept for CIPP may be adjusted to accommodate marshaling districts concept where small and medium companies locate in the same district to advantage the benefits of a common infrastructure. The concept is common in industrial estates with common infrastructures. SDE is proposing to relocate the EPZ from Maracanau to CIPP to benefit from the new port infrastructure. It will fill the gap of time and space until an anchor industry finally decides to locate in CIPP.
MAIN REPORT 4 - 36 CHAPTER 4

PECEM INDUSTRIAL AND PORT COMPLEX DEVELOPMENT PLAN FINAL REPORT IN THE FEDERATIVE REPUBLIC OF BRAZIL VOLUME I
Also it may help diversification of industry in CIPP. One important matter to be noted is that there is a state policy to decentralize industries in Ceara. There will be a risk of establishments which may have located in rural area of Ceara to come into CIPP to limit the possibility of meeting future needs of industries which must physically locate themselves in CIPP (such as transshipment, storage, repacking, etc.). The industries in this category may include; cleaning, sorting and packing of fresh fruits, contract packaging of mainly consumer products, processing of soy, corn etc., processing of bio-diesel and ethanol for export and domestic markets.
(1) Small and light industry As observed in the analysis of cargo movements of Pecem and Mucuripe in 2.1.2, there is a significant increase of the export of light and other industries’ products through Pecem. This shows that the existence of Pecem port gave incentive and competitiveness for export through Pecem port for light and other industries, agro industry not only from Ceara but also from neighbouring states.
Productive Chains
Ceará Research and Strategy Institute - IPECE will provide every year the State Industrial Development Board – CEDIN with the list of productive chains (and respective missing links), which are considered of strategic importance for the development of the State of Ceará, with the objective of supporting the decisions taken by that Board. In other words, missing link here represents indispensable components needed by important industries of Ceara, and their production in Ceara may mean ‘import substitution’ as observed in industrialization in developing regions and countries. The initial list of such chains and their respective missing links is shown below:
a Leather-footwear chain: • Tannery for leather finish; • Leather cut and sewing); • Notions (threads, labels, elastic, laces, Velcro); • Metallic components (buckles, straps); • Simostec plates. • Reinforced nylon for straps; • Primer; • S.B.R. (resin); • Calcium carbonate (Caulim); • Plastic components, heels (PU); • Shoelaces; • Special linings, bidim and synthetic leather; • Adhesive and embroidered labels; • Specialized tools (Matrixes, moulds and models) • Inner soles; • Low-density polyethylene; • High-density polyethylene (Resin); • Recovered PVC; • Polyester tape (Polypropylene).
b Furniture chain
• Abrasives;
MAIN REPORT 4 - 37 CHAPTER 4

PECEM INDUSTRIAL AND PORT COMPLEX DEVELOPMENT PLAN FINAL REPORT IN THE FEDERATIVE REPUBLIC OF BRAZIL VOLUME I
• Synthetic straw; • Paints and varnishes; • Upholstering foam; • Hospital furniture; • Metallic components; • Fabrics for upholstered furniture; • Wooden panels (plywood, particleboards and MDF).
c Ready-made cloth chain: • Threads, buttons and elastic; • Metallic and plastic accessories; • Plastic packing; • Cutting machines; • Specialized sewing machines; • Labels; • Washing and dyeing; • Bobbins, needles and tweezers; • Chemical components (Pigments, bleaching products).
d Textile chain
• Natural, artificial and synthetic fibers (e.g. Lycra thread Elastane); • Non-woven fibers;
• Fine plain fabrics; • Elastic fabrics (Lycra) • Washing and dyeing; • Equipment spare parts; • Pipes and belts; • Cloth pressers and electronic plates.
e Metal-mechanics chain:
• Ironworks; • Casting and forging; • Matrixes for cutting/stamping works; • Moulds for plastic injection; • White line; • Auto parts; • Specialized sewing machines; • Cutting equipment; • Containers • Component and intermediate products for automotive industry.
f Agro-industry chain
• Irrigation equipment; • Vacuum glass, polyethylene and PET packing; • Irrigation facilities; • Hydrothermal treatment facilities; • Vegetation houses (seedlings, roses, protected planting, fruit drying, and
dehydration); • Organic defensives;
MAIN REPORT 4 - 38 CHAPTER 4

PECEM INDUSTRIAL AND PORT COMPLEX DEVELOPMENT PLAN FINAL REPORT IN THE FEDERATIVE REPUBLIC OF BRAZIL VOLUME I
• Tractors and implements (sprinklers, mechanical planters, mechanical harrows, etc.)
• Seeds and seedlings; • Cold and acclimatization chambers (fruits and vegetables); • Equipment for food industry (concentration, bottling, and extraction equipment,
ovens, stainless steel); • Inputs for food manufacturing, such as additives (dyes, conservers, thickeners).
(2) Core industries
Productive chains shown in the Economic Development Policy of Ceara will be in themselves core industries of Ceara. Some of Chemical Downstream Industry may be added; Fertilizers, Agrochemicals, Pharmaceuticals etc., which may not necessarily be located close to a petrochemical complex. Machinery, especially assembly machinery such as electrical, electronic, automobile and motorcycle could be feasible in Ceara in the future. This category could be another Anchor in CIPP.
It may take a long time for Anchor industries to arrive in CIPP. It is important to stick to the original concept until the right time when the Anchor decides to come, at the same time to expand the paradigm to include the Marshalling yard concept so that industrial development is accelerated.
(3) Basic strategy The CIPP development is an integral part of the state government development programs. The ultimate goal of the CIPP development is to create jobs. To this end, the original CIPP development concept need to be updated to include additional functions to the establishment the Industrial complex with the anchor industries as the core.
While the government continues to make efforts to establish the anchor industries in accordance with the original development concept, it is very urgent to elaborate an alternative CIPP development plan. The Alternative Plan should include the establishment of a logistic platform to support the traditional small and light industries that have been established in Ceara State and that have been expanding the export of their products. There are various ways to help and support their activities. The first step is to provide a warehouse function for the light industries located in remote municipalities, in order to ship their products in timely manners. Such warehouse functions can be expanded to include further value-adding businesses such as packaging and finishing work, and assembling of local and imported materials and semi-products. “Marshalling District” is a general concept of the logistic platform.
The incentives to attract industries should be strengthened to maintain the competitiveness of the state against adjacent state. It is very important to implement the incentives in a timely manner.
Incidentally, the incentives currently given by the state government are as follows:
There are several incentives currently available for new investments in Ceara as explained in the Investor’s Guide and a pamphlet titled General Information, both by SDE:
• Exemption of ICMS
MAIN REPORT 4 - 39 CHAPTER 4

PECEM INDUSTRIAL AND PORT COMPLEX DEVELOPMENT PLAN FINAL REPORT IN THE FEDERATIVE REPUBLIC OF BRAZIL VOLUME I
Exemption of destination state ICMS for domestic equipment Deferment of ICMS on imported equipment Deferment of ICMS for 1 year on imported raw material
• Exemption of Income Tax
• Exemption of Municipality Tax
• BNDES and BNB loans
• Investment of part of income tax-FINOR System
• Credit line on working capital based on ICMS due –PROVIN and import of finished goods for resale
• Other exemptions such as tax on maritime freight and tax related to import exchange operation, both applicable up to 2010
Total picture of the incentive system is difficult to grasp for a foreigner or a third party. However, the Investor´s Guide issued by SDE, available in English, provides examples and further insight to the matter.
It is also recommended that a unified (single window) organization be established and given authority to plan, execute, market, manage and do all necessary matters for attracting investment in Ceara. Necessary time required to get approval of obtaining incentives is said to be 2 years, which should be shortened to 6 months or less in view of competition with other candidates for investment attraction.
Current development policy as mentioned below is to be adhered to, with action and speed oriented single executing organization outside of the Government to avoid bureaucracy. Most of ASEAN countries have a similar system such as BOI of Thailand.
Economic Development Policy of the government of Ceara, issued by SDE highlights following aspects for industrial development.
- Interior-bound trend of the industrial sector
- Promotion of industrial competitiveness
- Support to the implantation of micro, small and medium industrial companies
- Consolidation of Pecem Industrial and Port Complex
- Promotion of science and technology as a strategic component for the industrial development
- Promotion of the innovating and venturing industrial view
- Industrial Development Support and Incentive Policy
The system of incentives is defined in the Economic Development Policy as a mechanism to optimize the available resources with selectivity for adjusting the system to economic and sector-based guidelines. Projects to be attracted are to be significant for:
- Generation of direct and indirect jobs
- Development of micro, small and medium companies, and creation of first-job opportunities
- Use of local raw material
MAIN REPORT 4 - 40 CHAPTER 4

PECEM INDUSTRIAL AND PORT COMPLEX DEVELOPMENT PLAN FINAL REPORT IN THE FEDERATIVE REPUBLIC OF BRAZIL VOLUME I
- Production of high socioeconomic impact
- Regional development decentralization and interior-bound trend
- Supply chain strengthening and consolidation
- Heavy industry, technology-based industry, biotechnology and information technology industries
- Transfer of technology to Ceara companies
Based on the above mentioned policy, Industrial Development Fund grants incentive in the form of loan, in accordance with the benefit calculated through points system. Transformation industries eligible to the above benefits include
• Structuring industries, including capital goods industry, such as ironworks, alternative power, refineries, machines, equipment and respective parts and components
• Manufacturing industries, especially those strengthening the local productive chains, such as leather-footwear chain, ready-made cloth chain, furniture chain, textile chain, electro-electronics chain, metal-mechanics chain
• High-technology industry or technology-based industry, such as information technology, pharmaco-chemistry, biotechnology, genetic engineering, renewable energy, essential oils, physio-therapeutics
• Recycling industry
MAIN REPORT 4 - 41 CHAPTER 4

PECEM INDUSTRIAL AND PORT COMPLEX DEVELOPMENT PLAN FINAL REPORT IN THE FEDERATIVE REPUBLIC OF BRAZIL VOLUME I
4.3 Examination of Basic Strategy for Port Development
4.3.1 Growth potential of Pecem Port and its advantage on the competing ports Since its opening in 2001, Pecem Port has been serving not only Cear State, but also adjacent states in the Northeast Region. The analyses of port statistics of both Mucuripe and Pecem Ports showed such facts that, while some commodities have shifted from Mucuripe Port to Pecem Port, many commodities handled at Pecem Port are new commodities that were not seen among the major commodities at Mucuripe Port before 2001. In addition, as discussed in Chapter 2, the export volume of almost all the commodities including agricultural, light industries and other industry related products, exhibit a big leap since 2002.
These facts imply that opening of Pecem Port, Ceara’s deep draft port, have had a great impact on the economy of the hinterland: not only Ceara State but also adjacent states. In fact, in the interviews, some companies revealed their investment plans to expand their business. Above all, the Northeast railway company and the major shipping lines plying their fleet to South America count Pecem Port as one of the key elements in their operation plan.
Even without proper facilities for container cargo handling, the economy of the hinterland requires the port to be the logistic port. All the facts proved that Pecem Port has a great potential as the gateway port of the region. The port has also a potential to expand its hinterland to the whole Northeast Region and further beyond the Region. Except for the immediate hinterland, i.e., Ceara State and adjacent States, the port shares the hinterland with other major ports in ther Northeast Region: Itaqui (Sao Luis, Maranhao), Suape (Recife, Pernambuco) and Salvador (Salvador, Bahia). When the railway upgrading project is completed, these four ports will formulate a port system where the four ports complement each other to serve the inland areas of the Region
Pecem Port has not been legislatively designated as an “Organized Port” that handle any kind of cargoes of the third party, but as a “Terminal Port” that handle cargoes related to specific companies, . This allowed the port to be exempted from the requirement that is imposed on “Organized Ports”, i.e., the port workers should be members of a Union. The status of Terminal Port has been an advantage for Pecem Port over the other three ports; it has been one of the factors that made it possible for Pecem Port to set its tariff on container handling at a competitive level.
On the basis of the current operation schedule of ocean going container liners, Pecem or Suape Ports are called by these liners as the last leg before they make a voyage to Europe and the North Coast of U.S. This type of liner operation is very advantageous for the exporters. At present, the total frequency of service made by various international shipping lines is the same for both Pecem and Suape Ports.
It is, thus, assessed that Pecem Port has no geographical disadvantage over Suape Port. The container terminal of the latter is now operated by ICTSI, a Philippine-based world famous terminal operator, and has started to offer more competitive tariffs.
Summing up the factors, Pecem Port has no substantial advantage to Suape Port, though it has an advantage over Salvador Port in the draft of piers and over Itaqui Port in the availability of the international container liner service. Therefore, it is concluded
MAIN REPORT 4 - 42 CHAPTER 4

PECEM INDUSTRIAL AND PORT COMPLEX DEVELOPMENT PLAN FINAL REPORT IN THE FEDERATIVE REPUBLIC OF BRAZIL VOLUME I
that it the improvement of container terminal is very urgent for Pecem Port to keep attracting users.
4.3.2 Inland transport network connecting to Pecem Port
(1) Improvement of the Road Network of the Hinterland of Pecém Port As to the container cargo passing through Pecém Port, about 65% of the total exports departed from Ceará State and about 80% of the total imports had Ceará for destination.
Since almost all the container cargo is transported by truck, road conditions in the state influence use of Pecém Port. Conversely speaking, to advance the maintenance and improvement of the highway network increases accessibility of Pecém Port and the container volume handled in Pecém Port. As a result, developing the highway network of Pecém’s hinterland can lead to enhance a competitive strength of Pecém Port.
In this section, the current situation of the highway network in the hinterland is evaluated and a development strategy regarding the infrastructure of federal highway was examined on the basis of the evaluation.
a. Highway Network in Ceara Statae
In the State of Ceará, the highway network is composed of ten federal highway routes which function is main transportation route in Ceará. Three federal highways are extended from Fortaleza in the shape of radiation and make the frame of transportation in Ceará. One of those is BR-020 which is classified “Radial Highway” and makes toward Brasília (Federal Capital), running through the center of the state. Another one is BR-116 which is classified “Longitudinal Highway” and passes through Pernambuco and Bahia, running through the east side of Ceará State. The other is BR-222 which is classified “Transversal Highway“and passes through Piauí and Maranhão alongside the coast of the northeast region, getting across the west side of Ceará State.
Figure 4.3.1 shows the highway network in Ceará drawn as pattern diagrams. In addition, Table 4.3.1 clarifies the current situation of the federal highway in Ceará. DNIT (National Department of Transport Infrastructure) investigated the condition of federal highway and announced it. From this table, it can be seen that the extension of only about 30% of the whole highway is in good condition and the rest extension remains at a lower level.
The Highway BR-020 is one of the roads which make the structure of transportation in Ceará as above-mentioned, but the condition of the highway is the worst. In the road section of approximately 70% of the whole extension, drivers are required to drive with the greatest care. Although BR-116 is kept in good condition as compared with BR-020, the better part of the whole remains in bad condition. BR-222 is in the worst level as well as BR-020 and the extension of good situation does not come to only 10% of the whole.
In addition, it can be seen in Figure 4.3.1 that the sections within 100km from Fortaleza are not necessarily maintained in good condition.
MAIN REPORT 4 - 43 CHAPTER 4

PECEM INDUSTRIAL AND PORT COMPLEX DEVELOPMENT PLAN FINAL REPORT IN THE FEDERATIVE REPUBLIC OF BRAZIL VOLUME I
Figure 4.3.1 Road condition of federal highways in the State of Ceará
Fortaleza
Triânguio
Boqueirão do Cesário
BR-304
Peixe Gordo
CE123
CE040
Jaguaribe
CE040
CE253
BR-116
CE266
BR-116
Pereiro
Milagres
Icó
BR-116
BR-116
BR-226
CE153
Jati
CE153
Iguatu
BR-226 BR-122
BR-226
Quixadá CE266
BR-122
Quixleô
CE060
Várzea Alegre
CE166
CE386
BR-230
CE386
CE292 CE386
BR-230
BR-122
BR-122
CE286
Lavras da Margabeira
Solonópole
CE163
Seuador Porpeu
Tauá CE363
CE176
BR-404
BR-404
CE265
CE266Boa Viagem
Madalena
Cruz do Banabuiú
CE266
CE365
BR-020
PacajúsCanindí
CE257
BR-020
BR-020
CE187,329,183/ BR403
Sobral
Carire CE253
BR-404
BR-226 BR-226
BR-404
Novo Oriente
Crateús
Ipaporanga
CE178/BR403
BR403
BR-222
Umirim
Tiauguá
Camocim
CE085/BR402
Araoaú
CE187 BR-222
BR-403
BR402
Messejana
PecémCE065
CCE422 E421
CE423
Bad ConditionGood
Poor Under contemplation
Legend
14
2
3 5
8
7
9
6
10
MAIN REPORT 4 - 44 CHAPTER 4

PECEM INDUSTRIAL AND PORT COMPLEX DEVELOPMENT PLAN FINAL REPORT IN THE FEDERATIVE REPUBLIC OF BRAZIL VOLUME I
Table 4.3.1 Road Condition of Federal Highway in Ceará
(Unit:km)
Normal Bad Poor No information411,2 127,9 0,0 283,3 0,0
31,1% 0,0% 68,9% 0,0%546,7 235,2 58,3 141,5 111,3
43,0% 10,7% 25,9% 20,4%445,0 53,5 169,2 53,5 168,8
12,0% 38,0% 12,0% 37,9%348,8 34,4 176,8 137,6 0,0
9,9% 50,7% 39,4% 0,0%261,6 137,3 0,0 124,3 0,0
52,5% 0,0% 47,5% 0,0%116,0 0,0 54,1 61,9 0,0
0,0% 46,6% 53,4% 0,0%102,5 60,9 41,6 0,0 0,0
59,4% 40,6% 0,0% 0,0%125,6 125,6 0,0 0,0 0,0
100,0% 0,0% 0,0% 0,0%149,0 0,0 0,0 0,0 149,0
0,0% 0,0% 0,0% 100,0%30,0 30,0 0,0 0,0 0,0
100,0% 0,0% 0,0% 0,0%2536,4 804,8 500,0 802,1 429,1
31,7% 19,7% 31,6% 16,9%Source: DNIT
Road Condition
BR-020
BR-116
BR-122
Highway No. Extension
BR-222
BR-226
BR-270
BR-304
BR-402
BR-403
BR-404
Total
b. Problems on the Highway Network as Transportation Infrastructure To analyze the highway situation as compared with the container cargo movement in the hinterland can clarify some problems about the highway as transportation infrastructure to Pecém Port.
As to the container cargo in the hinterland (see Table 3.2.2), the east coast area (CE9) accounts for 28 % of the total cargo, followed by Fortaleza (CE3). For outside of Ceará State, Rio Grande do Norte accounts for 11.44%, followed by Bahia (5.47 %) and Pernambuco(5.44%)
From this container cargo movement, it can be understood that BR-116 within the zones of CE3 and CE9 is used for transportation of container cargo. While the better part of the extension at these zones is in bad condition, the road condition of BR-116 could disturb a smooth transportation.
When it is considered that the container volumes from or to Rio Grande do Norte, Bahia and Pernambuco are large, the driving conditions of BR-116 and BR-020 leading to these states could have a negative effect on transportation through these routes.
c. Development Strategy of the Transportation Network in the Hinterland As shown Table 4.3-3, PPA includes some projects of maintenance and improvement with regard to the federal highways in Ceará State.
MAIN REPORT 4 - 45 CHAPTER 4

PECEM INDUSTRIAL AND PORT COMPLEX DEVELOPMENT PLAN FINAL REPORT IN THE FEDERATIVE REPUBLIC OF BRAZIL VOLUME I
Table 4.3.2 Origins and Destination of Foreign Container Cargo via Pecém Port in 2004 (Unit: t)
Agricultural andFishery Products
LightIndustryProducts
IndustrialProducts Others
CE1 424 0 11 10 445 0,10%CE2 1.045 0 4.081 99 5.225 1,15%CE3 51.850 22.550 31.328 7.393 113.121 24,91%CE4 1.495 2.546 31 33 4.105 0,90%CE5 984 6.491 667 266 8.408 1,85%CE6 0 0 0 0 0 0,CE7 124 937 19.188 24 20.273 4,46%CE8 111 15 28 0 154 0,03%CE9 106.428 10.624 8.574 495 126.121 27,77%CE10 293 956 303 14 1.566 0,34%Total 162.754 73.118 64.749 8.335 308.956 68,03%
127 919 11.501 722 13.269 2,92%5.554 1.065 5.844 65 12.528 2,76%
28.733 18.382 2.796 2.059 51.970 11,44%2.726 6.025 182 281 9.214 2,03%
22.867 660 759 426 24.712 5,44%0 45 22 0 67 0,01%
94 0 0 2 96 0,02%24.678 65 30 45 24.818 5,47%2.965 30.805 3.709 552 38.031 8,37%
250.498 102.085 89.054 12.486 454.123 100,00%Soruce: Original data was provided by Ceara Port and Processed by JICA Study TeamGrand TotalOthersBahia
State
SergipeAlagoas
Total
Ceara
ParaibaPernambuco
MaranhaoPiauiRio Grande do Norte
00%
As to BR-116, if the project is carried out completely, about 60 % of the road extension under bad condition is expected to be improved. In consideration of the importance of BR-116, however, it is required that the whole extension of BR-116 within Ceará be improved immediately. On the other hand, as to BR-020 and BR-222, the improvement will hardly progress within the period of PPA.
Now, there are a lot of container cargoes related to manufacturing products in the urban area of Fortaleza and its neighbouring area as compared with other areas. In the future, a much bigger increase in container demand is expected, from or to the urban area of Fortaleza and its neighbouring area. In addition, it is thought that transportation quality, such as reducing vibration in-transit, comes to be important after this. For this reason, as to BR-020 and BR-222, it is required that maintenance and improvement of the road be done in a phased manner from the section close to Fortaleza.
Table 4.3.3 Highway Projects in Ceará
ExcutingLength(km)
Budget(R$*1,000)
Northeast Corrid 3.893 2.595 14.168.000 BR-020,101,106,222,226, etc.
Ceara 858 451 346.360BR-020 97 4 3.300BR-116 307 252 229.200BR-122 45 6 1.000BR-222 97 4 3.300BR-226 136 22 6.500BR-304 210 120 60.000others 76 76 75.300
Source: PPA
PPA 2004-2007PlannnigLength(km)
Notes
MAIN REPORT 4 - 46 CHAPTER 4

PECEM INDUSTRIAL AND PORT COMPLEX DEVELOPMENT PLAN FINAL REPORT IN THE FEDERATIVE REPUBLIC OF BRAZIL VOLUME I
(2) Railway improvement The railways in the Northeast Region, operated by three railway companies, are serving between the major cities, mainly along the coast: Maceio, Recife, Joao Pessoa, Fortaleza, Teresina and Sao Luis. There is practically no service to the inland area in the Region, which have a great potential of agricultural production (see Figure 4.3.2).
Source: Ministry of Transport web site
Figure 4.3.2 Existing Railway network in the Northeast Region
Since these railways were privatized, the railway companies have been elaborated their investment plans. The outlines of these railway projects with a broad gauge (1.6m) are as follows (see Figure 4.3.3):
• Route: Porto Franco – Balsas (New line construction of approximately 190 km long
• Route: Eliseu Martins –– Salgueiro - Missao Velha - Pecem Port (New line construction from Eliseu Martins to Missao Velha and Improvement from a narrow gauge (1m) to a broad gauge (1.6m) from Missao Velha to Pecem Port of approximately 1,040 km long in a total)
• Route: Eliseu Martins –– Salgueiro - Suape Port (New line construction of approximately 1,010 km long, the line from Eliseu Martins to Sai Gueiro is common with the above project)
• Route: Barreiras –– Ilheus Port (New line construction of approximately 800 km long)
MAIN REPORT 4 - 47 CHAPTER 4

PECEM INDUSTRIAL AND PORT COMPLEX DEVELOPMENT PLAN FINAL REPORT IN THE FEDERATIVE REPUBLIC OF BRAZIL VOLUME I
Source: Northeast Railway Company (CFN) presentation material
Figure 4.3.3 Railway development projects
4.3.3 Possibility of Shipment of Cerrado Products through Pecem Port
(1) Outlines of Production and Export of Grains in Brazil In the Second National Development Plan formulated in 1974, the following three policies in terms of agriculture were published:
• Expansion of agricultural frontier in the Cerrado region
• Promotion of the increase in grain production
• Promotion of the mechanization and increase in the inputs of fertilizer and agricultural chemical
In line with the above policies, the full-scale agricultural exploitation in the Cerrado region started in 1975. From the year 1975 to 2004, soybean yield increased from 9.9 million to 49.2 million tons, indicating five times as much as that in the starting year. In the same period, soybean cultivated land increased from 5.8 million to 21.5 million ha. In the last five years from 2000 to 2004, its yield increased by 50% with an annual increase rate of 10.6%. In addition, in the same period, corn yield increased from 16.3
MAIN REPORT 4 - 48 CHAPTER 4

PECEM INDUSTRIAL AND PORT COMPLEX DEVELOPMENT PLAN FINAL REPORT IN THE FEDERATIVE REPUBLIC OF BRAZIL VOLUME I
Unit: '000 t
Grains Bran Export Total 1993 22,591 4,185 9,414 13,599 60.2% 746 3.3%1994 24,932 5,398 10,644 16,041 64.3% 1,533 6.1%1995 25,683 3,493 11,600 15,093 58.8% 1,764 6.9%1996 23,167 3,647 11,262 14,909 64.4% 1,332 5.8%1997 26,393 8,340 10,013 18,353 69.5% 1,126 4.3%1998 31,307 9,275 10,447 19,722 63.0% 1,360 4.3%1999 30,987 8,917 10,431 19,348 62.4% 1,552 5.0%2000 32,821 11,517 9,389 20,906 63.7% 1,073 3.3%2001 37,907 15,676 11,271 26,946 71.1% 1,652 4.4%2002 42,125 15,970 12,517 28,487 67.6% 1,934 4.6%2003 51,919 19,890 13,602 33,493 64.5% 2,486 4.8%2004 49,222 19,248 14,486 33,734 68.5% 2,517 5.1%
Source: Productions: IBGE, Exports: FAO
Year Export Total
Soya Bean OilPercentageof Exports
ExportSoya Beans (Grains and Brans)
ProductionTotal
Percentageof Exports
million to 41.9 million tons, and corn cultivated land increased from 10.8 million to 12.4 million. In contrast, in the same period, wheat yield decreased (see Table 4.3.4).
Table 4.3.4 Historical Trend of Production and Export in Brazil (1993 - 2003)
Thus, soybean production has widely contributed to the expansion of grain production in Brazil due to the exploitation of the Cerrado region. Around two thirds of soybean yield is exported and soybeans presently ranks first in both volume and value in export of agricultural products in Brazil, whereas corn produced in Brazil is mostly consumed locally, rather than being exported. In addition, Brazil is the second largest exporter of soybeans in the world market following the USA. On the other hand, the largest importer of soybeans in the world market is China, followed by Japan. Thailand, Indonesia and South Korea are also prominent importers. Asia is the major region in terms of soybean import in the world market. In the world market of soybeans, trade volume showed a sharp increase in the recent years caused by import of soybeans by China; China imported 20.7 million tons of soybeans in 2003, indicating 4.8 times as much as that in 1999. Other Asian countries also showed increases in soybeans import in the same period.
(2) Agricultural Frontier in the Cerrado of the Northeast Region Agricultural frontier in the Cerrado region is estimated around 66 million ha in total in Brazil (EMBRAPA: Brazilian Agricultural Research Corporation). It is said that around 15.4 million ha could be practically exploited considering reservation areas that is stipulated to be at least 30% of individual farmland. The area of 15.4 million ha is divided into two areas. One extends from the south of Para in the north region to the west of Mato Grosso and the north of Goias in the centre-west region. The other extends from the south of Maranhao and Piaui to the east of Tocantins and the west of Bahia in the northeast region (see Figure 4.3.6).
The latter area in the northeast region shown in Figure 4.3.6 is already the hinterland of Itaqui Port and Ilheus Port in terms of soybean export, with throughputs of 1.7 million tons and 0.9 million tons in 2004, respectively. On the assumption of the completion of the railway projects mentioned in Section 4.3.2, the Cerrado region is considered to be the potential hinterland of Pecem Port and Suape Port in terms of soybean export.
MAIN REPORT 4 - 49 CHAPTER 4

PECEM INDUSTRIAL AND PORT COMPLEX DEVELOPMENT PLAN FINAL REPORT IN THE FEDERATIVE REPUBLIC OF BRAZIL VOLUME I
In 2004, soybean yields in the above Cerrado region showed a sharp increase, indicating 44.8% up to the preceding year. The soybean plantations in the region are sustained by sufficient rainfalls with average precipitations of over 900 mm per annum, computer-controlled high-technology in terms of fertilizer provision, etc., and highly mechanized operations, and achieved the highest productivity of 2.8 tons per ha in 2004 whereas the average was 2.3 tons in the entire Brazil. An increase in the productivity in recent years in the northeast region was remarkable, indicating 37% up in 2004 to the preceding year. The productivity of this year (2005) is said to be further high with an average 60 bags per ha (3.6ton per ha) and the maximum 80 bags per ha (4.8 tons per ha) (see Table 4.3.5).
MAIN REPORT 4 - 50 CHAPTER 4

PECEM INDUSTRIAL AND PORT COMPLEX DEVELOPMENT PLAN FINAL REPORT IN THE FEDERATIVE REPUBLIC OF BRAZIL VOLUME I
Tab
le 4
.3.5
Soyb
eans
and
Cor
n Pr
oduc
tions
by
Reg
ion
in B
razi
l fro
m 2
002
to 2
004
MAIN REPORT 4 - 51 CHAPTER 4

PECEM INDUSTRIAL AND PORT COMPLEX DEVELOPMENT PLAN FINAL REPORT IN THE FEDERATIVE REPUBLIC OF BRAZIL VOLUME I
(3) Potential Export Capacity of Soybeans Produced in the Northeast Region On the assumption of a productivity of 3.6 tons per ha, the potential soybean production is estimated as 28 million tons per annum in the above-mentioned Cerrado area in the northeast region on the long-term basis. On the assumption of export ratio of 65% to the total production, export potential capacity of soybeans produced in the northeast region is estimated to be 18 million tons per annum.
(4) Historical Trend and Future Prospects of the Production and Export in the World In the last two decades from 1985 to 2004, soybean production in the world increased 2.9 times due to the increases both in population (1.3 times) and per capita consumption (2.1 times) (see Table 5.3.3). The world population is said to reach 9.1 billion in 2050 from 6.4 billion in 2004 (cited from U.S. Census Bureau, International Data Base) .The world population in 2022 is estimated as 7.6 billion by interpolating.
By using a linear regression method correlating with the historical world population, the total soybean production in the world in 2022 is estimated as 302 million tons (correlation coefficient r2 = 0.95) with an increase by 85 million tons from 217 million tons in 2004. On the assumption that the current percentage of approximately 30% in soybean grain export to the total production and the current percentage of approximately 75%s in soybean bran export to soybean grain export will be kept towards the future, respectively, an increment of soybean export comprising grains and bran is estimated around 49 million tons in 2022 from the present level in 2004 as summarized below.
Year Population Production (Soybeans) Export (Soybean Grains)
2004: 6.4 billion 217 million tons 62 million tons
2022: 7.6 billion 302 million tons 91 million tons
Increment 85 million tons 29 million tons (Soybean Grains)
22 million tons (Soybean Bran)
Total Export 51 million tons (Soybeans)
As mentioned previously, Brazil is the second largest exporter in the world and is increasing its share year by year. On the other hand, the share of northeast region in soybean production recently showed a sharp increase, whereas the production in the traditional production area in the south region decreased its share drastically.
Thus, Cerrado region in the northeast region with the potential capacity of soybean export of 18 million tons per annum mentioned in Section 5.3.3 is highly expected to be cultivated by 2022 to meet the demand in the world market.
MAIN REPORT 4 - 52 CHAPTER 4

PECEM INDUSTRIAL AND PORT COMPLEX DEVELOPMENT PLAN FINAL REPORT IN THE FEDERATIVE REPUBLIC OF BRAZIL VOLUME I
Table 4.3.6 Historical Trend of Soybean Production and Export in the World
Production Soybean Percentage Population Per capita
(1000ton) Grain Export of Soybean (million) consumption
(1000ton) Grain Export
(A) (B) (B)/(A) (kg/capita)
1985 75,605 22,333 29.5% 4,850 15.3
1986 75,932 23,925 31.5% 4,933 16.5
1987 103,385 30,115 29.1% 5,018 20.1
1988 95,862 23,557 24.6% 5,104 19.2
1989 107,202 27,375 25.5% 5,189 20.1
1990 104,288 25,403 24.4% 5,276 19.8
1991 107,320 28,083 26.2% 5,360 20.4
1992 117,400 29,503 25.1% 5,444 21.3
1993 117,792 27,780 23.6% 5,525 21.9
1994 137,716 31,844 23.1% 5,605 23.6
1995 125,033 31,628 25.3% 5,686 23.2
1996 132,349 36,757 27.8% 5,765 23.3
1997 158,191 39,684 25.1% 5,845 24.9
1998 160,045 38,007 23.7% 5,924 26.9
1999 160,669 45,461 28.3% 6,002 26.6
2000 175,884 53,758 30.6% 6,079 28.3
2001 185,095 53,496 28.9% 6,154 30.0
2002 197,039 61,571 31.2% 6,229 30.6
2003 188,547 55,302 29.3% 6,303 30.2
2004 216,878 62,244 28.7% 6,376 31.8
ources: USDA: PS&D View May 2005; USBC: International Data Base, July 2003
Note: Soybean Gran Export is not indicated in the above tablre.
Year
S
(5) Transport Cost Analysis A transport cost analysis was made to estimate transport cost from agricultural land in Cerrado to the principal ports in the northeast region, viz. Itaqui, Pecem, Suape and Ilheus. The resulting figures are shown in Table 4.3.7. There no decisive difference between the four ports in transport costs compared with recent FOB price varying from 220 to 280 US$.. If the broad gauge railway construction/improvement projects are materialized, the difference will be narrowed compared with the case where soybeans are transported solely by trucks. Thus, one fourth of soybean exports of 18 million tons in 2022 is allocated to Pecem Port, with the resulting amount of 4.5 million tons per annum, as well as Suape Port. In Itaqui Port and Ilheus Port, in addition to each 4.5 million tons per annum in the same year, the anticipated exports from another Cerrado region extending from the north region to the centre-west region as mentioned in Section 4.3.3 are allocated, with the resulting totalled amount of 13.2 million and 12.4 million tons per annum, respectively.
• Pecem Port: 4.5 million tons per annum
• (Itaqui Port: 13.2 million tons per annum)
• (Suape Port: 4.5 million tons per annum)
• (Ilheus Port: 12.4 million tons per annum)
MAIN REPORT 4 - 53 CHAPTER 4

PECEM INDUSTRIAL AND PORT COMPLEX DEVELOPMENT PLAN FINAL REPORT IN THE FEDERATIVE REPUBLIC OF BRAZIL VOLUME I
Table 4.3.7 Transport Costs of Grains from Cerrado to the Principal Ports US$/ton
Road Railway Total Road Railway Total (A) kmItaqui 200 840 1,040 8.0 6.9 15.0 30.6Pecem 200 1,040 1,240 8.0 13.1 21.2 155 35.7Suape 200 1,010 1,210 8.0 14.2 22.2 182 39.2Ilheus 200 800 1,000 8.0 11.1 19.1 103 31.2
Source: Estimated by JICA Study Team
Note (3): (A) indicates equivalent distances to balance cost difference between the destinations of Itaqui andother ports
Note (2): The new railway lines construction costs or improvement costs are considered in the abovetransport costs.
Note (1): It was assumed that the center of Cerrado is located at the equal distance from the three newrailway lines stations adjacent to the Cerrado.
Distance from Center of Cerrado Road onlyDestination Railway + Road
4.3.4 Position of Pecem Port in the international and domestic shipping routes
(1) International Alliance and Container Vessel Size As globalization progresses, mergers are increasingly seen in major industries throughout the world as companies strive for international competitiveness. In particular, the international alliances are becoming increasingly common in the shipping business which has relatively low profit margins.
The international alliances are facing fierce competition as the world container market can be rightly described as an oligopoly. The alliances seek economies of scale to reduce the transport cost. The container industry has therefore witnessed a seemingly never-ending increase in the size of vessels in recent years.
Figure 4.3.4 shows the load capacity (TEU) by each container vessel size in the world. Although the container ships exceeding 4,000 TEUs represented about one-third of the total in 2000, the same type accounts for about one-half of the total as of 2005, and the proportion of large vessels is increasing. Furthermore, the super-large vessels exceeding 8000TEUs have appeared.
MAIN REPORT 4 - 54 CHAPTER 4

PECEM INDUSTRIAL AND PORT COMPLEX DEVELOPMENT PLAN FINAL REPORT IN THE FEDERATIVE REPUBLIC OF BRAZIL VOLUME I
Figure 4.3.4 Container Vessel Size
As a result of progressing enlargement of container vessel size, each trade route tends to use the adequate vessel size showing the highest cost performance under the environment of the traffic demand of the route. The Ocean Shipping Consultant has published its forecasts of vessel sizes by trunk route in the future (see Table 4.3.8)
Table 4.3.8 Forecast vessel sizes in World container trades to 2015
(TEU)1998 2000 2005 2010 2015
Transpacific Typical Vessel 4,500-5,000 4,500-5,000 5,500-6,500 6,500 7,500 Largest Vessel 6,250 6,700 8,100 8,500 10,000Far East-Europe Typical Vessel 4,500-5,000 4,500-5,500 5,500-6,500 8,000 8,500 Largest Vessel 7,500 7,500 8,100 12,500 12,500Transatlantic Typical Vessel 3,500 3,500 4,000 5,000 6,500 Largest Vessel 4,500 4,500 4,800 6,500 8,500North-South Typical Vessel 2,500 2,500 3,000 3,000 3,500 Largest Vessel 3,000 3,000 3,500 3,500 4,000Source:"Marketing of container terminals", Ocean Shipping Consultants
(2) Imbalance of Boxes and Transshipment Since, the import and export cargo volumes handled at a port are not the same, imbalances of container boxes occur in all the container trunk lines in the world. In this era of international alliances and the enlargement of container vessel, the shipping business try to minimize the imbalance in their trunk service routes and tend to take full advantage of their onboard space for service. For this reason, each shipping company is endeavouring to cancel the imbalance by effectively utilizing transhipment services and carrying out duty-cycle operation of the onboard space.
MAIN REPORT 4 - 55 CHAPTER 4

PECEM INDUSTRIAL AND PORT COMPLEX DEVELOPMENT PLAN FINAL REPORT IN THE FEDERATIVE REPUBLIC OF BRAZIL VOLUME I
As a result, the combination of mother ship to feeder boat transhipment is widely introduced in today’s container transport. In major world ports, well-developed feeder network and transhipment capabilities are prerequisites to remain competitive, and the terminals which offers efficient transhipment have the advantage.
(3) Potentiality of Transhipment at Pecém Port
a Transshipment at Brazilian Ports It isn’t expected that main ports in Brazil will develop as international transhipment ports like Singapore, which is located on the East/West trunk line and is acting as the transhipment for neighboring countries, but it is expected that they will develop as regional hub ports serving the substantial feeder network within the region namely on the side of South America in the North/South America trunk line and the Europe/South America trunk line. It can be said that the role of the main ports in Brazil will be similar to those of Rotterdam, Hamburg or Antwerp in the Europe. Incidentally, the rate of transhipment of these European ports (the ratio of transhipment cargo to the total volume) is between 30 - 40% at present.
The conditions required for a regional hub port are shown as follows;
- High accessibility to trunk shipping line - Existence of facilities which have the capability to accept a super-large size container vessel -Well-developed feeder network within the region -Efficient cargo handling between mother vessel and feeder vessel
b Competition in Brazil (a). Suape
Together with the industrial development in its neighboring area, the volume of container handling is increasing rapidly in accordance with the progress of regional development in the Northeast Region. The port is strengthening its function as a commercial (logistic) port.
The container terminal in the port, which is operated by a private sector, has two berths with a water depth of 15.5m and a length of 660m, and can accommodate Post-Panamax size container vessels. Moreover, the port has a further expansion plan to construct two additional container berths.
For this reason, the Port of Suape has the potential to become a regional hub port in northeast Brazil.
(b). Salvador
The port of Salvador is located in the State of Bahia, which is the center of the economy of the northeast region of Brazil, and handles the largest volume of container cargo in the region.
Although the container terminal, which is operated by private sector, has two berths, it has a draft restrictions for large vessels due to the berth depth of 12m.
MAIN REPORT 4 - 56 CHAPTER 4

PECEM INDUSTRIAL AND PORT COMPLEX DEVELOPMENT PLAN FINAL REPORT IN THE FEDERATIVE REPUBLIC OF BRAZIL VOLUME I
(c). Santos
The port of Santos is located in the State of Sao Paulo, which is the center of the economy and industry of the whole Brazil, and handles the largest volume of container cargo in South America. In 2003, the number of foreign containers reached approximately 1,300,000 TEUs, this is comparative to 38% of grand total of container volume in Brazil.
In the Port of Santos, although four private companies are operating container terminals, only two terminals are fully-equipped container terminals. Since the water depth of the berths is 13.5m at the maximum and the depth of the access channel is restricted to 13m, the port cannot accommodate super-large size container vessels.
(d). Rio de Janeiro
The Port of Rio de Janeiro is located in Rio de Janeiro City which is the 2nd largest city in Brazil.
Although there are two container terminals operated by private sector, draft restrictions on large vessels may emerge in the future due to the berth depth of 12m.
(e). Sepetiba
The port of Sepetiba was developed to support the aluminum-related industrial base. Since the port is located between major cities Sao Paulo and Rio de Janeiro and has a water depth exceeding 15m, Sepetiba has great potential as a commercial port.
The container terminal operated by a private sector has a berth with the water depth of 14.5m and the length of 810m and can accept the 5th generation container vessel which has a capacity of over 4,500TEUs.
(f). Rio Grande
The Port of Rio Grande, which has the hinterland of southern Brazil and Mercosur, is the gateway port in the South region and handles the second largest volume of foreign container in Brazil.
Although the container terminal that is operated by private sector has two berths, restrictions on large vessels may emerge in the future due to the berth depth of 12m.
(g). Paranagua
The Port of Paranagua located in the State of Parana has southern Brazil for its hinterland.
The full-container terminal that is operated by a private sector has two berths with a water depth of 12m. Since the port has a future expansion plan and an access channel with water depth exceeding 14m, the port will be able to accommodate large-size container vessels in the future. Table 4.3.9 and 4.3.10 show the current features of the major container ports in Brazil.
MAIN REPORT 4 - 57 CHAPTER 4

PECEM INDUSTRIAL AND PORT COMPLEX DEVELOPMENT PLAN FINAL REPORT IN THE FEDERATIVE REPUBLIC OF BRAZIL VOLUME I
(ha)
(TE
U)
Nor
thM
ANAU
S-A
MPu
blic
41.
020
BELÉ
M-P
APu
blic
1.44
73-
9N
orth
east
PEC
ÉM-C
EFO
RTA
LEZA
-CE
Publ
ic5
1.05
410
REC
IFE-
PE
--
Teco
n Su
ape
266
015
,528
17.0
4540
0,00
0TEU
/Yea
rAd
d. T
wo
berth
s80
0,00
0TEU
/Yea
rPu
blic
132
015
Teco
n Sa
lvad
or2
454
127
250,
000T
EU/Y
ear
250,
000T
EU/Y
ear
Publ
ic23
88
Sout
heas
t3,
840,
000T
EU/Y
ear
TER
M. T
UBA
RÃO
-ES
124
012
60,0
00TE
U/Y
ear
60,0
00TE
U/Y
ear
VITÓ
RIA
-ES
Term
inal
de
Vila
Vel
ha1
225
12,5
114.
800
122
512
,530
0,00
0TEU
/Yea
rM
ultit
erm
inai
s C
onta
iner
Ter
min
al2
533
11,5
1816
.000
400,
000T
EU/Y
ear
400,
000T
EU/Y
ear
Term
inal
1-R
IO2
545
11,5
145.
500
400,
000T
EU/Y
ear
400,
000T
EU/Y
ear
SEPE
TIB
A-R
JTe
con
Term
inal
381
014
,540
15.0
001,
000,
000T
EU/Y
ear
1,00
0,00
0TEU
/Yea
rTE
RM
. CU
BA
TÃO
-SP
134
220
0,00
0TEU
/Yea
r20
0,00
0TEU
/Yea
rTe
con
Term
inal
376
012
,848
11.0
00Ad
d. O
ne b
erth
800,
000T
EU/Y
ear
Teco
ndi C
onta
iner
Ter
min
al5
14,2
100,
000T
EU/Y
ear
Term
inal
37
51.
100
10-1
3.5
1612
.000
480,
000T
EU/Y
ear
Dre
ged
to 1
3.5m
480,
000T
EU/Y
ear
Publ
ic3
1310
0,00
0TEU
Sout
h2,
050,
000T
EU/Y
ear
TCP
Term
inal
265
512
2923
.250
360,
000T
EU/Y
ear
Add.
One
ber
th60
0,00
0TEU
/Yea
rPu
blic
9,5
S. F
. DO
SU
L-SC
Publ
ic1
175
1080
242
59,
1130
0,00
0TEU
/Yea
rIT
AJA
Í-SC
Publ
ic4
740
10N
ew T
erm
inal
(150
,000
TEU
/Yea
r)55
0,00
0TEU
/Yea
rTe
con
Rio
Gra
nde
260
012
,567
15.0
0040
0,00
0TEU
/Yea
rPu
blic
1.89
08,
820
0,00
0TEU
/Yea
r
Source:Annual report of ANTAQ, Web site of the port authorities
Por
tFu
ture
Pla
n
SA
LVA
DO
R-B
A
Futu
re C
apac
ity(e
stim
ate)
Stor
age
Area
Leng
th(m
)D
epth
(m)
Con
tain
er T
erm
inal
Ope
rato
rB
erth
Pre
sent
Cap
acity
SA
NTO
S-S
P
PA
RAN
AGU
Á-P
R
RIO
GR
AN
DE-
RS
SU
AP
E-P
E
RIO
DE
JAN
EIR
O-R
J
Mul
tipur
pose
Leng
th(m
)D
epth
(m)
Ber
th
/Yea
r
Tab
le 4
.3.9
Con
tain
er T
erm
inal
Fac
ilitie
s of B
razi
lian
Port
MAIN REPORT 4 - 58 CHAPTER 4

PECEM INDUSTRIAL AND PORT COMPLEX DEVELOPMENT PLAN FINAL REPORT IN THE FEDERATIVE REPUBLIC OF BRAZIL VOLUME I
(Uni
t:'00
0TE
U)
Tota
lFo
reig
nD
omes
ticTo
tal
Fore
ign
Dom
estic
Tota
lFo
reig
nD
omes
ticTo
tal
102
3594
129
1991
109
NA
NA
NA
4852
053
460
46N
AN
AN
A20
13
42
13
NA
NA
N17
188
9718
567
9215
9N
AN
AN
A30
030
670
67N
AN
AN
853
3339
7236
4177
NA
NA
N31
24
621
3657
NA
NA
NA
7639
7010
921
4061
5385
138
107
7263
135
109
6016
9N
AN
A17
514
35
94
37
NA
NA
N28
018
018
136
025
718
143
8N
AN
AN
A25
280
289
09
NA
NA
N93
105
2412
810
025
125
NA
NA
NA
252
233
3827
227
748
325
NA
NA
NA
174
1620
1512
27N
AN
AN
120
3615
614
827
175
NA
NA
N01
41,
013
561,
069
1,28
897
1,38
51,
771
111
1,88
20
00
00
NA
NA
N40
21,
503
170
1,67
31,
837
210
2,04
6N
AN
AN
A28
213
876
214
218
021
8N
AN
AN
A17
677
9817
514
710
725
4N
AN
A30
524
431
915
335
419
2344
2N
AN
A56
434
634
990
438
435
8852
3N
AN
AN
A2
20
1515
NA
NA
N04
888
328
11,
164
1,21
923
31,
452
NA
NA
NA
901
2,79
372
93,
522
3,43
171
54,
145
2002
2003
2004
Fore
ign
Dom
estic
Tota
lFo
reig
nD
omes
ticTo
tal
Fore
ign
Dom
estic
Nort
hM
ANAU
S-AM
2326
490
00
4359
BELÉ
M-P
A47
047
482
4948
0O
ther
Por
ts1
1819
118
191
19A
7144
114
4919
6892
79No
rthe
ast
PECÉ
M-C
E0
00
00
00
00
AFO
RTAL
EZA-
CE40
1252
00
035
1A
RECI
FE-P
E8
1827
522
276
25SU
APE-
PE30
939
3627
6340
36SA
LVAD
OR-
BA50
2979
6036
9560
47O
ther
Por
ts4
811
57
125
9A
132
7620
810
592
197
144
136
Sout
heas
tTE
RM. T
UBAR
ÃO-E
S28
028
00
025
0A
VITÓ
RIA-
ES74
1387
00
076
17RI
O D
E JA
NEIR
O-R
J18
222
204
00
021
438
SEPE
TIBA
-RJ
00
00
00
314
ATE
RM. C
UBAT
ÃO-S
P0
00
00
00
00
ASA
NTO
S-SP
733
4277
575
843
801
955
591,
Oth
er P
orts
10
10
00
00
00
A1,
017
771,
094
758
4380
11,
273
129
1,So
uth
PARA
NAGU
Á-PR
149
4619
519
558
253
211
71S.
F. D
O S
UL-S
C13
318
151
9870
168
111
65IT
AJAÍ
-SC
125
1113
60
00
233
11RI
O G
RAND
E-RS
213
4926
20
00
269
78O
ther
Por
ts4
15
00
00
00
0A
624
125
749
293
128
421
823
225
1,1,
844
322
2,16
51,
205
282
1,48
72,
333
568
2,S
ourc
e: A
nnua
l rep
ort o
f AN
TAQ
, Web
site
of t
he p
ort a
utho
ritie
s
1999
2000
2001
TOTA
L
SUB-
TOTA
L
SUB-
TOTA
L
SUB-
TOTA
L
SUB-
TOTA
LRegi
on a
nd P
ort
T
able
4.3
.10
Con
tain
er T
hrou
ghpu
ts a
t Pri
ncip
al B
razi
lian
Port
s
MAIN REPORT 4 - 59 CHAPTER 4

PECEM INDUSTRIAL AND PORT COMPLEX DEVELOPMENT PLAN FINAL REPORT IN THE FEDERATIVE REPUBLIC OF BRAZIL VOLUME I
(4) Container Shipping Lines in the Northeast of Brazil Table 4.3.11-4.3.14 show the latest lines of container shipping service with regard to Brazil. According to these tables, there are 12 services between Brazil and Europe, 10 services between Brazil and North America (including the Caribbean Sea) and 4 services between Brazil and Asia (including Africa). Moreover, 4 services are offered in Brazil including Mercosur.
To take the case of the last port call in Brazil in each shipping service, the ports of the northeast region (Pecém, Suape and Salvador) are chosen as the last port in 6 services with regard to Brazil/Europe services and in 5 services with regard to Brazil/North America services. The reason why the ports of the northeast region are utilized as last port is that both Pecém and Suape have the container terminals with deep-water quay wall in addition to their geographical conditions. These ports can serve the container vessels which increase their draft by collecting cargo from the ports of the south region.
And, according to the service frequency in northeast Brazil with regard to container liner service, there are 7 weekly callings in 12 services of Brazil/Europe and 5 weekly callings in 10 services of Brazil/North America. Except for the Brazil/Asia service, more than the half the services has called the ports of the northeast region. Also regarding the cabotage, 3 callings are served in the whole 4 services. Although the ports of the northeast region handle about 9% of all container cargoes in Brazil, the service frequencies at the ports in Northeast Region are relatively high if compared with the ports in the world that handle the same level of container cargo volumes.
For the shipping companies, both Pecém and Suape are in an attractive position in terms of geographical location and facilities. As the cargo volume of the northern part increases in the future, it is expected that these ports will play the role of hub port not only in the northeast region but also in the whole of Brazil including Mercosur.
MAIN REPORT 4 - 60 CHAPTER 4

PECEM INDUSTRIAL AND PORT COMPLEX DEVELOPMENT PLAN FINAL REPORT IN THE FEDERATIVE REPUBLIC OF BRAZIL VOLUME I
Serv
ice
Ope
rato
rRo
und
Voy
age
(day
s)
Freq
uenc
y(d
ays)
Ves
sel
Capa
city
(TEU
)
Ports in Europe
Belem
Pecem
Fortaleza
Suape
Salvador
Vitoria
Rio de Janeiro
Sepetiba
Santos
Paranagua
Sao Francisco de Sul
Itajai
Rio Grande
Buenos Aires
Montevideo
1Lo
op A
Ham
burg
Sud
/Alia
nça
/CM
A C
GM
427
612
,798
*1,
54
22
Loop
BHa
mbu
rg S
ud/A
lianç
a /
CMA
CG
M35
75
12,4
20*
1,5
44
23
3Lo
op A
Mae
rsk
Seal
and/
Safm
arin
e42
76
25,8
00*
61,
54
23
4Lo
op B
Mae
rsk
Seal
and/
Safm
arin
e35
75
8,61
0*
14
32
5M
ain
loop
VSA
435
75
12,6
70*
62
1,5
34
6Ba
ck-u
p lo
opV
SA4
427
610
,158
*1
4
3
32
7La
mba
daP&
O N
edllo
yd42
7(2
,182
)*
76
1,5
43
28
Loop
AM
editt
eran
ean
Ship
ping
Co
427
616
,656
*2,
54
31,
69
Loop
BM
editt
eran
ean
Ship
ping
Co
423-
412
23,7
96*
12,
76
54
310
Grim
aldi
Lin
es54
96
4,39
8*
12,
83,
76
45
11Ne
w S
irius
ser
vice
427
613
,602
*9
1,9
2,8
37
64
512
New
Sea
gul S
ervi
ce42
76
11,4
96*
1110
1,9
2,8
37
45
6So
urce
: Con
tain
eris
atio
n In
tern
atio
nal
Num
bers
on
the
list i
ndic
ate
callin
g or
der.
Tab
le 4
.3.1
1 C
onta
iner
Lin
er S
ervi
ce –
Sou
th A
mer
ica/
Eur
ope
MAIN REPORT 4 - 61 CHAPTER 4

PECEM INDUSTRIAL AND PORT COMPLEX DEVELOPMENT PLAN FINAL REPORT IN THE FEDERATIVE REPUBLIC OF BRAZIL VOLUME I
Serv
ice
Ope
rato
rRo
und
Voy
age
(day
s)
Freq
uenc
y(d
ays)
Ves
sel
Capa
city
(TEU
)
Ports in NA&CA
Pecem
Fortaleza
Suape
Salvador
Rio de Janeiro
Sepetiba
Santos
Paranagua
Sao Francisco de Sul
Itajai
Rio Grande
Buenos Aires
Montevideo
1Lo
op A
Ham
burg
Sud
/Mae
rsk
Seel
and/
Alia
nça/
P&O
Ned
lloyd
/Lyk
es/T
MM
427
622
,434
*6
65
1,4
32
2Lo
op B
Ham
burg
Sud
/Mae
rsk
Seel
and/
Alia
nça/
P&O
Ned
lloyd
/Lyk
es/T
MM
427
614
,694
*1
62,
53
43
CSA
V/L
ibra
/Mon
tem
ar/
CMA
CG
M42
7(2
,339
)*
65
1,5
23
44
Zim
/Han
jin/K
Lin
e/M
OL
459
58,
300
*1,
77
2,6
54
35
Loop
AM
edite
rran
ean
Ship
ping
Co
427
616
,098
*1,
54
32
6Lo
op B
Med
iterr
anea
n Sh
ippi
ng C
o40
85
9,89
0*
44
32
17
Loop
ALy
kes/
Libr
a/TM
M42
76
19,1
28*
1,7
2,6
54
38
Loop
BLy
kes/
Libr
a/TM
M42
14(1
,728
)*
21
9Ha
mbu
rg S
ud/A
lianç
a/
P&O
Ned
lloyd
427
69,
864
*2
1
10Co
sta
Cont
aine
r Lin
es50
8-9
68,
124
*1
24
3
Sour
ce: C
onta
iner
isat
ion
Inte
rnat
iona
l
Tab
le 4
.3.1
2 C
onta
iner
Lin
er S
ervi
ce –
Sou
th A
mer
ica/
Nor
th A
mer
ica
& C
entr
al A
mer
ica
MAIN REPORT 4 - 62 CHAPTER 4

PECEM INDUSTRIAL AND PORT COMPLEX DEVELOPMENT PLAN FINAL REPORT IN THE FEDERATIVE REPUBLIC OF BRAZIL VOLUME I
Tab
le 4
.3.1
4 C
onta
iner
Lin
er S
ervi
ce –
Cab
otag
e
Serv
ice
Ope
rato
rRo
und
Voy
age
(day
s)
Freq
uenc
y(d
ays)
Ves
sel
Capa
city
(TEU
)
Manaus
Vile de Conde
Pecem
Fortaleza
Suape
Salvador
Vitoria
Rio de Janeiro
Sepetiba
Santos
Paranagua
Sao Francisco del sol
Itajai
Rio Grande
Montevideo
1Sl
ing
1A
lianç
a35
75
8,48
17
6,8
59
4,10
3,11
21
2Sl
ing
2A
lianç
a28
142
2,68
26
54,
73,
82
13
Mer
cosu
l Lin
e-O
cean
ica
AG
W/P
&O N
edllo
yd35
143
3,24
01
2,11
3,10
4,9
85
67
4Na
vega
cao
Val
e do
Rio
Doc
e SA
141
666
76
54
32
1So
urce
: Con
tain
eris
atio
n In
tern
atio
nal
Serv
ice
Ope
rato
rR
ound
Voy
age
(day
s)
Freq
uenc
y(d
ays)
Ves
sel
Cap
acity
(TEU
)
Ports in Asia/Africa
Pecem
Suape
Salvador
Rio de Janeiro
Sepetiba
Santos
Paranagua
Sao Francisco de Sul
Itaiai
Rio Grande
Buenos Aires
Montevideo
1Ev
ergr
een/
Cos
co70
710
28,5
40*
31
22
Ham
burg
Sud
/NY
K/A
lianc
a77
711
27,7
97*
1.8
2.7
65
43
3C
SA V
/CM
A C
GM
A S
AX
707
1019
,890
*2
13
45
4P&
O N
edllo
yd/M
ol77
711
34,2
54*
81.
76
54
23
Sour
ce: C
onta
iner
izat
ion
Inte
rnat
iona
lTab
le 4
.3.1
3 C
onta
iner
Lin
er S
ervi
ce –
Sou
th A
mer
ica/
Asi
a &
Afr
ica
MAIN REPORT 4 - 63 CHAPTER 4

PECEM INDUSTRIAL AND PORT COMPLEX DEVELOPMENT PLAN FINAL REPORT IN THE FEDERATIVE REPUBLIC OF BRAZIL VOLUME I
4.3.5 Identification of potential hinterland and the role of Pecem Port in the region
(1) Identification of the Current and Potential Hinterland and Foreland of Pecem Port When estimating future demand of cargo passing through the Port, it is essential to identify its hinterland and foreland. In the first step, the current hinterland and foreland were revealed, and in the second step, a potential hinterland and foreland were supposed as mentioned below.
a Current Hinterland and Foreland The current hinterland and foreland of Pecem Port were revealed from cargo movement records from origins to destinations via the Port in 2004
1) Container Cargoes
Export In 2004, container cargoes of 356,600 tons in total were exported from Pecem Port. Agricultural and fishery products accounted for 66.4% followed by light industry products (17.8%) and other industrial products (14.9%) (see Table 4.3.15). As to agricultural and fishery products, fresh fruits accounted for 47.3% of the total exports, followed by cashew nuts (9.4%) and sea food (5.6%). As to light industrial products, textile related industry products accounted for 6.4% of the total exports followed by foodstuff (4.0% ) and shoes (3.1%). As to the remaining industry products, stones accounted for 7.2% of the total exports followed by car parts (1.3%) (see Table 4.3.15).
The above-mentioned container cargoes were exported throughout the world (foreland). West and North Europe accounted for 51.4% of the total exports in terms of volume (tons), followed by North America (32.0%), East Asia (5.3%), Carribean countries (3.6%) and South America (3.5%). As to West and North Europe, agricultural and fishery products accounted for 87.1%, followed by light industrial products (8.7%). As to North America, agricultural and fishery products accounted for 58.4%, followed by light industrial products (23.6%) (see Table 4.3.16).
On the other hand, the above-mentioned container cargoes were brought into Pecem Port from its hinterland extending from Ceara to the other northeast region and beyond the region. To identify more clearly container cargo origins within the Ceara state clearer, the state was divided into 10 sub-regions (see Figure 4.3.5). Ceara accounted for 64.5% of the total exports in terms of volume (tons), followed by Rio Grande do Norte (13.0%), Bahia (7.0%), Pernambuco (6.7%), Paraiba (2.4%), Piaui (2.4%) and Maranhao ((1.9%). Thus, almost all the exports originated from the northeast region accounting for 98% . Within the Ceara state, the east coast region (CE9) accounted for 32.6% of the total exports, followed by Fortaleza (CE3) and the central region (CE’) (see Table 4.3.17).
MAIN REPORT 4 - 64 CHAPTER 4

PECEM INDUSTRIAL AND PORT COMPLEX DEVELOPMENT PLAN FINAL REPORT IN THE FEDERATIVE REPUBLIC OF BRAZIL VOLUME I
Tab
le 4
.3,1
5 P
erce
ntag
e of
Exp
orte
d C
onta
iner
Car
go b
y C
argo
Item
via
Pec
em P
ort i
n 20
04
MAIN REPORT 4 - 65 CHAPTER 4

PECEM INDUSTRIAL AND PORT COMPLEX DEVELOPMENT PLAN FINAL REPORT IN THE FEDERATIVE REPUBLIC OF BRAZIL VOLUME I
Tab
le 4
.3.1
6 P
erce
ntag
e of
Exp
orte
d C
onta
iner
Car
go b
y D
estin
atio
n A
rea
and
Car
go It
em v
ia P
ecem
Por
t in
2004
MAIN REPORT 4 - 66 CHAPTER 4

PECEM INDUSTRIAL AND PORT COMPLEX DEVELOPMENT PLAN FINAL REPORT IN THE FEDERATIVE REPUBLIC OF BRAZIL VOLUME I
10
9
8
7
6
5
4
32
1
Figure 4.3.5 Hinterland Area Code in Ceara State
MAIN REPORT 4 - 67 CHAPTER 4

PECEM INDUSTRIAL AND PORT COMPLEX DEVELOPMENT PLAN FINAL REPORT IN THE FEDERATIVE REPUBLIC OF BRAZIL VOLUME I
Table 4.3.17 Origins of Exported Container Cargo by Cargo Category via Pecem Port in 2004
Agricultural andFishery Products
Light IndustryProducts
IndustrialProducts (Car,Electrical,Chemical, Metal,Mineral , etc..)
Others
424 424100.00% 100.00%
1,045 3,522 25 4,59222.75% 76.71% 0.53% 100.00%39,069 19,028 16,602 1,616 76,314
51.19% 24.93% 21.75% 2.12% 100.00%1,495 1,890 6 15 3,406
43.90% 55.48% 0.18% 0.45% 100.00%984 6,442 43 26 7,495
13.14% 85.95% 0.57% 0.34% 100.00%124 916 19,188 20,229
0.61% 4.53% 94.86% 100.00%111 15 28 154
72.25% 9.75% 18.00% 100.00%106,428 9,510 135 116,07392.12% 8.23% 0.12% 100.47%
956 285 9 1,24976.51% 22.78% 0.71% 100.00%
149,680 38,756 39,808 1,690 229,93565.10% 16.86% 17.31% 0.74% 100.00%
5,554 973 2,016 16 8,56064.89% 11.37% 23.55% 0.19% 100.00%22,867 561 523 74 24,026
95.18% 2.34% 2.18% 0.31% 100.00%2,682 5,715 17 272 8,685
32.78% 65.80% 0.20% 3.13% 101.90%28,575 15,184 1,958 977 46,693
61.20% 32.52% 4.19% 2.09% 100.00%127 597 6,092 46 6,862
1.85% 8.70% 88.78% 0.67% 100.00%19 170 188
9.86% 90.14% 100.00%24,678 65 15 14 24,772
99.62% 0.26% 0.06% 0.06% 100.00%94 94
100.00% 100.00%503 184 281 341 1,309
38.40% 14.07% 21.46% 26.07% 100.00%1,084 1,084
100.00% 100.00%160 2 162
98.68% 1.32% 100.00%546 546
100.00% 100.00%1,727 1,137 772 49 3,685
46.86% 30.87% 20.94% 1.32% 100.00%236,664 63,345 53,112 3,478 356,60066.37% 17.76% 14.89% 0.98% 100.00%
Source: Original data was provided by Ceara Port and processed by JICA Study Team
CE 3
State
CE 1
CE 2
Ceara
CE 9
CE 10
32.55%
0.35%
CE 7
CE 8 0.04%
CE 4
CE 5
0.96%
2.10%
5.67%
Pará
Goiás
Bahia
Alagoas
6.95%
0.03%
Tocantins
Maranhão 1.92%
Minas Gerais
0.05%
Paraíba
Rio Grande do Norte
2.44%
13.09%
0.37%
0.30%
0.05%
Total
0.12%
1.29%
21.40%
Total 64.48%
2.40%
6.74%Pernambuco
Piauí
0.15%
1.03%
Grand Total 100.00%
Others
Espírito Santo
MAIN REPORT 4 - 68 CHAPTER 4

PECEM INDUSTRIAL AND PORT COMPLEX DEVELOPMENT PLAN FINAL REPORT IN THE FEDERATIVE REPUBLIC OF BRAZIL VOLUME I
Import
In 2004, container cargoes of 97,523 tons in total were imported from Pecem Port. Light industry products and their materials accounted for 39.7% followed by other industrial products (36.9%) and agricultural products (14.2%) (see Tables 5.2.4). As to light industry products and their materials, cotton accounted for31.4% of the total imports, followed by foodstuff (4.4%) and textile related industry products (2.9%). As to other industrial products, chemical products accounted for 21.2% of the total imports followed by spare parts (4.2% ) and industrial machines (3.2%). As to agricultural products, rice accounted for 11.0% of the total imports followed by wheat (3.2%) (see Table 4.3.18).
The above-mentioned container cargoes were imported throughout the world (foreland). North America accounted for 29.5% of the total exports in terms of the volume (tons), followed by West and North Europe (18.7%), South America excluding Brazil (16.6%), Brazil (14.1%) and East Asia (13.9%). As to North America, light industrial products and their materials accounted for 84.6%, followed by other industriy products and (12.6%). As to Western and Northern Europe, other industrial products accounted for 62.7%, followed by light industry products and their materials (13.6%) (see Table 4.3.19).
On the other hand, the above-mentioned container cargoes were brought out from Pecem Port to its hinterland extending from Ceara to the neighbouring states. Ceara accounted for 81.0% of the total imports in terms of volume (tons), followed by Maranhao (6.6%), Rio Grande do Norte (5.4%), and Piaui (4.1%). Thus, almost all the imports were destined to the northeast region accounting for 98% as well as exports. Within the Ceara state, Fortaleza (CE3) accounted for 68.0% of the total imports, followed by the east coast region (CE9) (10.3%) (see Table 4.3.20).
MAIN REPORT 4 - 69 CHAPTER 4

PECEM INDUSTRIAL AND PORT COMPLEX DEVELOPMENT PLAN FINAL REPORT IN THE FEDERATIVE REPUBLIC OF BRAZIL VOLUME I
Tab
le 4
.3.1
8
Perc
enta
ge o
f Im
port
ed C
onta
iner
Car
go b
y C
argo
Item
via
Pec
em P
ort i
n 20
04
MAIN REPORT 4 - 70 CHAPTER 4

PECEM INDUSTRIAL AND PORT COMPLEX DEVELOPMENT PLAN FINAL REPORT IN THE FEDERATIVE REPUBLIC OF BRAZIL VOLUME I
Tab
le 4
.3.1
9 P
erce
ntag
e of
Impo
rted
Con
tain
er C
argo
by
Des
tinat
ion
Are
a an
d C
argo
Item
via
Pec
em P
ort i
n 20
04
MAIN REPORT 4 - 71 CHAPTER 4

PECEM INDUSTRIAL AND PORT COMPLEX DEVELOPMENT PLAN FINAL REPORT IN THE FEDERATIVE REPUBLIC OF BRAZIL VOLUME I
Table 4.3.20 Destinations of Imported Container Cargo by Cargo Category via Pecem Port in 2004
AgriculturalProducts
Light IndustryProducts and its
Materials
Industrial Products(Electrical,
Chemical, Metal,Mineral Industries,
Petroleum, etc.)
Others
11 10 2252.03% 47.97% 100.00%
559 74 63488.25% 11.75% 100.00%
12,781 32,522 15,266 5,777 66,34619.26% 49.02% 23.01% 8.71% 100.00%
656 25 18 70093.75% 3.61% 2.64% 100.00%
49 624 240 9135.34% 68.34% 26.32% 100.00%
21 24 4545.71% 54.29% 100.00%
1,114 8,437 495 10,04611.09% 83.98% 4.92% 100.00%
293 18 5 31692.72% 5.69% 1.58% 100.00%13,074 34,362 24,941 6,645 79,021
16.54% 43.48% 31.56% 8.41% 100.00%92 3,828 49 3,970
2.32% 96.43% 1.25% 100.00%99 236 352 687
14.44% 34.33% 51.23% 100.00%44 310 165 9 529
8.33% 58.71% 31.25% 1.70% 100.00%158 3,198 838 1,082 5,276
3.00% 60.62% 15.88% 20.50% 100.00%322 5,409 676 6,407
5.03% 84.42% 10.55% 100.00%15 31 46
32.47% 67.53% 100.00%45 22 67
66.83% 33.17% 100.00%2 2
100.00% 100.00%22 36 28 86
25.63% 42.21% 32.15% 100.00%536 311 451 135 1,432
37.41% 21.70% 31.48% 9.41% 100.00%13,834 38,740 35,942 9,008 97,523
14.19% 39.72% 36.85% 9.24% 100.00%Source: Original data was provided by Ceara Port and processed by JICA Study Team
Grand Total 100.00%
Sergipe
Others 1.47%
Pará 0.09%
Alagoas
0.07%
0.00%
Paraíba 0.54%
0.05%Bahia
Rio Grande do Norte 5.41%
Maranhão 6.57%
Piauí 4.07%
Pernambuco 0.70%
10.30%
CE 10 0.32%
Total 81.03%
CE 7 0.05%
Ceara
CE 1 0.02%
CE 2 0.65%
CE 3 68.03%
CE 9
CE 4 0.72%
CE 5
Unit tones
State Total
0.94%
MAIN REPORT 4- 72 CHAPTER 4

PECEM INDUSTRIAL AND PORT COMPLEX DEVELOPMENT PLAN FINAL REPORT IN THE FEDERATIVE REPUBLIC OF BRAZIL VOLUME I
2) Break-bulk Cargoes
Export In 2004, Break-bulk cargoes of 65,654 tons in total were exported from Pecem. Most of the cargoes were Iron billets accounting for 90.7% of the total. Central America accounted for 62.2%, followed by Africa (10.2%), North America (9.9%) and West Europe (9.6%) in terms of destinations (foreland). The origins of those cargoes (hinterland) were Fortaleza Metropolitan Area (CE2 and CE3, see Figure 4.3.6)
Import
In 2004, Break-bulk cargoes of 121,605 tons in total were imported through Pecem. Almost all the cargoes were steel products. Origins of those cargoes (foreland) were Russia, Ukraine, Argentine and the south of Brazil. The destination of those cargoes (hinterland) is a factory of Aco Cearense (Ceara Steel) 35km from Pecem. The steel products mostly comprising rolls of thin plates and coils of thin bars are processed by shearing, bending and welding, and then are distributed to the north, northeast, centre-west regions. In addition, Minas Geires in the southeast region is also included its market. The processed steel products are transported by truck.
(c) Liquid-bulk Cargoes In 2004, a total of 295,417 tons of diesel oil was unloaded and transferred to smaller coastal tankers at Pecem Port (from Berth No.4 to Berth No.3). Origins of those cargoes (foreland) were Netherlands, India and Saudi Arabia.
b Potential Hinterland The major determining factors of a port hinterland are as follows:
• Land transport network composed of railway and road linked to a port,
• Location of principal neighbouring ports and their capacities.
• Distribution of exporters and importers and aspects of their economic activities,
When considering the potential hinterland of Pecem Port on the long-term basis, it was assumed that the three railway projects to construct new lines or improve the existing lines will be completed before the target year of 2022 of this study. The outlines of these railway projects with a broad gauge (1.6m) are as follows (see Figure 4.3.6):
• Route: Porto Franco – Balsas (New line construction of approximately 190 km long
• Route: Eliseu Martins –– Salgueiro - Missao Velha - Pecem Port (New line construction from Eliseu Martins to Missao Velha and Improvement from a narrow gauge (1m) to a broad gauge (1.6m) from Missao Velha to Pecem Port of approximately 1,040 km long in a total)
• Route: Eliseu Martins –– Salgueiro - Suape Port (New line construction of approximately 1,010 km long, the line from Eliseu Martins to Sai Gueiro is common with the above project “b”)
• Route: Barreiras –– Ilheus Port (New line construction of approximately 800 km long)
MAIN REPORT 4- 73 CHAPTER 4

PECEM INDUSTRIAL AND PORT COMPLEX DEVELOPMENT PLAN FINAL REPORT IN THE FEDERATIVE REPUBLIC OF BRAZIL VOLUME I
As mentioned in (1), a of this Section, the current hinterland of Pecem Port is considered to be mostly the whole Northeast Region, and if the new railway line construction/improvement between Eliseu Martins and Pecem Port is materialized, Pecem Port influence will be strengthened within the northeast region, especially in the south of Piaui, the west of Pernambuco and the north of Bahia in addition to the current influential areas of Rio Grande do Norte, the west of Paraiba and the north of Piaui.
Within the northeast region that is the current and potential hinterland of Pecem Port, the following ports are considered to be the principal ports:
• Itaqui Port (the maximum water depth of 19m)
• Madeira Port (the maximum water depth of 23m)
• Pecem Port (the maximum water depth of 16.5m)
• Suape Port (the maximum water depth of 15.5m)
• Ilheus Port (the maximum water depth of 10m)
All the above ports have already been connected or will be connected to the broad gauge railway lines, and have deep-water berths of over 15m enabling to receive Panamax-type or Cape-size vessels. A deepening of the water depth at Ilheus Port is expected in the future. After the completion of the new land transport network with the broad gauge railway lines, those ports will be functioning as gateways of the Northeast Region to the overseas trade partners in cooperation with each other so as to contribute to regional economies.
In addition to the current exports through Pecem Port such as fresh fruits, cashew nuts, shrimps, and textile related products generated mainly from Ceara and its border states, agricultural products harvested in Cerrado (wooded plateau) are considered to be the prominent potential cargoes to be exported through Pecem Port. Cement and/or clinker are also considered to be a potential cargo via Pecem Port. The possibility of shipment of Cerrado products is mentioned in the next section.
MAIN REPORT 4- 74 CHAPTER 4

PECEM INDUSTRIAL AND PORT COMPLEX DEVELOPMENT PLAN FINAL REPORT IN THE FEDERATIVE REPUBLIC OF BRAZIL VOLUME I
Legend: Broad Gauge Existing Railway New Broad Gauge Railway Construction Broad Gauge Improvement
Potential Farmland in Cerrado
Suape Port
Ilheus Port
Itaqui PortPecem Port
Barreiras
Eliseu Martins
Balsas
Figure 4.3.6 Railway Construction/Improvement Projects in the Northeast Region
MAIN REPORT 4- 75 CHAPTER 4

PECEM INDUSTRIAL AND PORT COMPLEX DEVELOPMENT PLAN FINAL REPORT IN THE FEDERATIVE REPUBLIC OF BRAZIL VOLUME I
(2) Summary of the potential hinterland of Pecem Port As discussed above, in 2004, 36% of export cargoes that were handled at Pecem Port were originated outside of Ceara, while 26% of the import cargoes were delivered to other states in Northeast Region.(see Figure 4.3.7). The major export commodities originated from Rio Grande do Norte, Bahia and Pernambuco are the agricultural products, while the import commodities destined to Maranhao Rio Grande do Norte and Piaui are industrial products.
Source: JICA Study Team
Origin of Export Commodities outside Ceara State
Bahia20%
Pernambuco
19%
Paraíba7%
Piauí7%
Maranhão5%
Others6%
Rio Grandedo Norte
36%
36% of Total Export
Destination of Import Commodity outsideCeara State
Maranhão26%
Rio Grandedo Norte
18%Piauí16%
Others40%
26% of Total Import
Origin of Export Commodities outside Ceara State
Bahia20%
Pernambuco
19%
Paraíba7%
Piauí7%
Maranhão5%
Others6%
Rio Grandedo Norte
36%
36% of Total Export
Destination of Import Commodity outsideCeara State
Maranhão26%
Rio Grandedo Norte
18%Piauí16%
Others40%
26% of Total Import
Figure 4.3.7 Origin and destination of export and in port cargoes
In addition to the commodities currently seen at the ports, it is most probable that Soy beans produced in Piaui State and fruit produced in the northwest part of Bahia State will be potential cargoes. When the CFN railway completes their improvement and the new railway construction is completed, Pecem Port will be attracting more cargoes to and from the whole Northeast Region.
Therefore, the hinterland of Pecem Port consists of the following:
a. Whole Ceara State and adjacent states.
These states are the immediate hinterland. Primarily Pecem is the gateway of them and substantial amount of cargoes are originated and destined to this hinterland.
b. Whole Northeast Region
The product of the states in the Northeast Region, especially in the inland area rich in agricultural products will be shipped through the port system in the Region: Itaqui, Pecem, Suape and Salvador (See Figure 4.3.8).
MAIN REPORT 4- 76 CHAPTER 4

PECEM INDUSTRIAL AND PORT COMPLEX DEVELOPMENT PLAN FINAL REPORT IN THE FEDERATIVE REPUBLIC OF BRAZIL VOLUME I
Pecem
Source: JICA Study Team
Figure 4.3.8 Port system in Northeast Region
4.3.6 Port development concept
(1) Objective of the development of Pecem Port To pursue the state government’s ultimate end, the concept of CIPP development should be updated. The principal objective of Pecem Port was to attract anchor industries. However, , through the operation of the port over the past four years, it was proved that the local agricultural and light industries have long wanted a deep draft port where they can directly ship their export products, and the port really has had a great impact on them to promote their production and export.
The agricultural and light industries have been the target that the State Government has been tried to attract by providing various incentives. It is said that now the state government efforts are bearing fruits. Since the agricultural and light industries are the most important sector for the economy of the state. Even the current status of the port facilities in CIPP, which was not designed to provide services for the existing industries, has brought great benefit to the latter.
In order to take the advantage of the geographical advantage of Ceara, i.e. proximity to the world major market, the port should attract more shipping lines so that the frequency of ship-calls on Pecem Port increases. This, in turn, provides a grate advantage to the local industries to ship their products in timely manner in response to the request of their clients. In order to attract container shipping lines, the port must collect large amount of containers.
Port
Itaqui Port
Suape Port
Salvador Port
MAIN REPORT 4- 77 CHAPTER 4

PECEM INDUSTRIAL AND PORT COMPLEX DEVELOPMENT PLAN FINAL REPORT IN THE FEDERATIVE REPUBLIC OF BRAZIL VOLUME I
The products of local light industries are high-prices commodities and the volume is rather small. Therefore, the container cargo volumes generated by the local light industries tend to be rather small. Therefore, the export of agricultural products, which are bulky commodities, should be promoted simultaneously.
To attract the cargoes from other state in the Northeast Region is another possible way to collect container cargoes. To this end, the interfacing with railways and highways is important elements in the development plan should be well taken into account. Though the principal objective of the development plan of CFN are to transport soy beans from Piaui and fruits from northeast of Bahia to Suape and Pecem Port, the industries located in Ceara State are also benefited by the railway service. Thus, the Pecem Port development should be implemented in concert with the railway project.
In the light of the situation described above, the objectives of the Development of Pecem Port are summarized as follows; (Progress report 5.1)
The objectives of the development of Pecem Port have been recognized to meet the future functional and quantitative demand to the Port so as to serve the economic activities in the hinterland of the Port extending currently or potentially from Ceara State to the neighbouring states in the Northeast Region of Brazil. The development of Pecem Port and its ripple effect on the surrounding region is expected to trigger the economic stimulation in Ceara State, and consequently to narrow regional disparity in terms of inter- and intra- states as well as personal income inequality. In this regard, the following concrete roles that are expected to the Port are recognized:
• To serve coastal industries including the iron and steel manufacture, a refinery and petrochemical plants to be set up or to be attracted within the CIPP industrial zone after this that will import raw materials or intermediate products and will export finished products through the Port,
• To serve agro-industries in the hinterland of Pecem Port exporting their products currently mainly of fresh fruits, sea food and cashew nuts through the Port,
• To serve manufacturing industries in the hinterland of Pecem Port importing raw materials or intermediate products and exporting finished products currently mainly iron and steel products, and light industry products such as textile, foot wares through the Port.
• To serve residents in the hinterland of Pecem Port importing consumer goods through the Port.
• To function as a logistics centre placed at a node of inter-modal transport connecting sea and land through storing, processing and distributing various products such as petroleum products and steel products
• To function as a gateway towards overseas in the northeast region extending from Maranhao to Bahia and including the Cerrado region together with other principal deep-sea ports, viz. the ports of Itaqui and Suape linked by the land transport network composed of roads and railways.
• To function as a local hub port for container transhipment
MAIN REPORT 4- 78 CHAPTER 4

PECEM INDUSTRIAL AND PORT COMPLEX DEVELOPMENT PLAN FINAL REPORT IN THE FEDERATIVE REPUBLIC OF BRAZIL VOLUME I
(2) Functional Allotment between the Ports of Pecem and Mucuripe The relationship between the ports of Pecem and Mucuripe in Ceara seems to resemble that between the ports of Suape and Recife in Pernambuco though Suape Port has a longer history over 25 years since its start of operations.
Mucuripe Port is a typical city port, and hence it has the disadvantages of the chronic road congestion around the port and constrains on further port area expansion. In addition, the water depth of the port is at most 10 m, clearly too shallow to receive modern vessels getting larger and larger in their drafts. If deepened, considerable sedimentation seems to inevitably occur due to its configuration of infrastructures including breakwaters, whereas Pecem Port is free from those disadvantages.
Mucuripe Port, however advantages of adjacent to the densely-populated Fortaleza Metropolitan Are as a large consumption area. In this regard Mucuripe Port is expected to serve the area through receiving the consumer goods including rice from the south region transported by cabotage (coastal shipping), and then distribute them in and around the Metropolitan area as it is currently functioning. Wheat is considered to be suitable cargo. Mucuripe Port and Pecem Port were compared in transport costs between Argentine and Ceara, and it was judged current transport through Mucuripe Port is more economical than Pecem Port in wheat transport. Saving from the use of larger grain carriers is estimated a few US$ per ton and it can not compensated the increase of truck freight from Pecem Port and Fortaleza and required investment for facilities at Pecem Port.
However, (Interim Report 3.5, P3-19, from the third paragraph) the analysis of the cargo statistics of Mcuripe and Pecem Port indicates the role sharing between the two ports. In general, the former handles domestic cargoes, while latter mainly handles international cargoes. Because unloading and storage facilities of grain are already exist at Mucuripe Port, it is likely that grain will be handled at Mucuripe Port.
Summing up above discussion, the study team proposes that the following concept should be employed in the long-term development plan of Pecem Port.
a. Pecem port should be developed for as a logistic port as well as a industrial port.
To this end,
1) The capacity of port should be upgraded as required to meet the cargo volume generated by anchor industries in CIPP
2) The following port facilities should be constructed: a fully equipped container terminal, Grain terminal, fruit storage facilities for the promotion of agricultural and light industries.
The development concept of Pecem Port discussed above is schematically exhibited in Figure 4.3.9
b. Mucuripe Port should also be promoted as a domestic port and its grain terminal should be maintained.
((Progress Report 5.10, last paragraph) In addition, Mucuripe Port is expected to accommodate passenger boats cruising sightseeing spots. To this end, it is advisable to shift petroleum tank farms from Mucuripe to Pecem to keep flammable dangerous goods distance from urban residents, especially gasoline
MAIN REPORT 4- 79 CHAPTER 4

PECEM INDUSTRIAL AND PORT COMPLEX DEVELOPMENT PLAN FINAL REPORT IN THE FEDERATIVE REPUBLIC OF BRAZIL VOLUME I
Job Creation
Promotion of existing and new industry sectors: Agriculture, Light Industry,
Attraction of Oil Refinery, Petrochemical, Related industry
Stone mining, assembling
Provide efficient and low cost access to the World Markets
CIPP Development in line with updated concept
Source: JICA Study Team
Figure 4.3.9 Port development concept
Frequent and direct service by ocean going container liners
To ensure the container cargo volume
Upgrading Railway service across Ceara State
Assistance to CFN Railway Project
Upgrading of container Terminal facilities and handling service
Grain terminal and Fruit storage facilities at the ports of Ceara
Attraction of container transhipments
Break bulk facilities
MAIN REPORT 4- 80 CHAPTER 4

PECEM INDUSTRIAL AND PORT COMPLEX DEVELOPMENT PLAN FINAL REPORT IN THE FEDERATIVE REPUBLIC OF BRAZIL VOLUME I
CHAPTER 5 CARGO FORECAST
5.1 Socio Economic Frame Work in 2022 As reviewed in Chapter 2, the export of the agricultural and industrial products of Ceara has been growing tremendously over the past few years, while the import volume remains the same level. Ceara state is not only the state where the export is growing. As reviewed in the Progress Report of this study, the top 20 commodities of Brazilian export have been increasing remarkably. The world market, especially the market of agricultural products keeps on growing with the economic growth of China and Eastern Europe countries. It is, therefore, very likely that the growing trend of Ceara’s export will continue over the coming years.
Over the past decade, Ceara State has experienced a slack period of economic growth. Though the GDP has increased at a rate of 2.1%, which is slightly above the growth rate of population (1.6%). Under such economic environment, the purchase power of Ceara people remained the same. During the same period, the agricultural production has increased. This is especially true for the corn production, which has exceeded the consumption and the import of corn practically ceased in 2002. The completion of Natural Gas pipeline also contributed to the decrease in petroleum import of Ceara. The growth in the industrial activities did not contribute to the increase in import, because of the nature of the local industries that produce their products out of locally available materials. As for the effects of these factors, the import volume has remained at the same level.
Ceara State Government has drawn the economic development plan in PPA 2004-2007 with the GDP forecast of the state at 3.6%, while the Federal government set the national GDP growth rate at 5.0%. With the consideration of the very active export business in Ceara, the forecast of the state seems to be too conservative.
Thus, the following three GDP growth scenarios are employed from 2005 through 2020:
(1) 3.6% (Forecast by Ceara State Government),
(2) 5.0% (Forecast of Federal Government),
(3) 5.0% up to 2012 and 3.6% from 2013 through 2022.
The last scenario is based on such a guess of the study team that the current trend of growth in export will continue in the coming years and the brisk activities of industries since 2002 will give an effect on the State GDP over the period between 2005 through 2012.
The reason to employ higher GDP growth rate is not only due to the current export growth trend. The current active production and export of both agricultural and industry sectors took place in 2002 when Pecem Port started operating over-Panamax size container carriers. The availability of the direct export route must have given substantial impacts on the sectors. In fact, the investment has been made on the agribusiness - plantation by Del Monte, for instance- and some light industries such as metal-work business as well as railway companies. Over the coming years, the steel mill will start operation and the Sao Francisco Diversion Project will be completed and Ceara will have more irrigated farmland.
MAIN REPORT 5 - 1 CHAPTER 5

PECEM INDUSTRIAL AND PORT COMPLEX DEVELOPMENT PLAN FINAL REPORT IN THE FEDERATIVE REPUBLIC OF BRAZIL VOLUME I
The cargo forecast shall be done on the basis of these three GDP growth scenarios.
5.2 Cargo Forecast Methodology The cargoes are classified into three categories by origin:
(1) Cargoes generated within CIPP
So far, there is no industrial activities in CIPP, thus the cargoes generated by the industries shall be estimated on the basis of their operation planed by the industries and the import and export cargoes forecasted on the basis of the operational plans of the industries that have been published.
(2) Cargoes generated in Ceara State (outside of CIPP)
Cargoes generated within Ceara State and adjacent states, which presently imported and exported at either Mucuripe or Pecem Ports. The cargoes of this category include the agricultural and industrial productions, raw materials and semi-products of the industries and various consumables for the household and business offices. Those cargoes generated by industries that will be established in the future are also included.
Basically, the correlation between the export/import volumes and GDP of Ceara State will be examined. The future cargo volumes shall be forecasted on the basis of the regression analysis. The major export commodities that are closely related to a specific industry and the increase (or decrease) in recent years are remarkable. Therefore, the simple regression analysis is judged to be inappropriate, because it is unlikely that such a big leap result from simple expansion of the business activities of the existing industries. It seems to be realistic to recognize that, since 2001, some structural changes happened in Ceara’s economy: new investment in commercial agro-industry and expansion of production lines in the traditional industries in some sub-sectors.
Thus, the export cargo volume shall start with identifying the commodities produced by those industry sub-sectors that increased export. Then the cargo volume generated by these growing sub-sectors shall be forecasted on the basis of available information and data such as those attained through company interviews, expansion of farmland, and other available information, while the other commodities shall be forecasted by regression analyses on the basis of the trend observed in the past ten years.
(3) Specific cargoes generated in other States in the future
Products that are expected to be produced or brought in the adjacent states of Ceara in large volumes and to be handled at the Ports in Ceara State fall in this category. Soy beans from Piaui, fruits from Bahia and fertilizers for Soy and Fruit farms are the potential cargoes of this category. The cargo volume forecast shall be done commodity by commodity.
MAIN REPORT 5 - 2 CHAPTER 5

PECEM INDUSTRIAL AND PORT COMPLEX DEVELOPMENT PLAN FINAL REPORT IN THE FEDERATIVE REPUBLIC OF BRAZIL VOLUME I
5.3 Cargo Forecast
5.3.1 Cargoes generated within CIPP The import and export plan of the anchor industries are as follows (please refer to Section 4.2.1 (4)):
(1) Steel Mill (USC, Ceara Steel Factory) The first phase intends to import 2,500,000 tons of iron pellets from Madeira Port, Sao Luis, Maranhao State and produce 1,500,000 of thick slabs. The second phase plans to double the production. Thus the cargoes generated by the steel mill are estimated as follows:
Import; Iron Pellet (Dry Bulk); 2012: 2,500,000 tons, 2022; 5,000,000 tons
Export; Thick Slabs (Break Bulk; 2012; 1,500,000 tons, 2022; 2,500,000 tons
(2) Oil Refinery It seems most likely that the establishment of the oil refinery in CIPP will be further delayed. The study team assumes that first oil refinery will be constructed in Suape and that the second oil refinery in Northeast Region is established in CIPP in later years.
The import and export cargoes generated by the oil refinery are as follows:
Import; Crude Oil (Liquid Bulk); 2022; 8,800,000 tons
Export; None
All the products will be consumed in the local markets.
Gasoline; 546,777 tons, LPG; 409,200 tons, Naphtha; 1,058,750 tons (Consumed by the Petrochemical industry in CIPP), Diesel Oil 5,178,800 tons, Kerosene; 356,400;tons, Coke; 3,000 tons, Total; 7,552,850 tons
(3) Petrochemical It is assumed that by 2022, the Petrochemical industry is also in operation.
Import: 2022; Naphtha 450,000 tons (in addition to the import volume, 1,500,000 tons of Naphtha will be provided by the Oil Refinery in CIPP)
Export: 2022
LLDPE(Linear Low Density Polyethylene) 500,000 tons, PP (Polypropylene) 200,000 tons, C4+(Crude Gasoline) 200,000 tons.
LLDPE and PP are container cargoes, while C4+ is liquid bulk cargo.
MAIN REPORT 5 - 3 CHAPTER 5

PECEM INDUSTRIAL AND PORT COMPLEX DEVELOPMENT PLAN FINAL REPORT IN THE FEDERATIVE REPUBLIC OF BRAZIL VOLUME I
5.3.2 Cargoes generated in Ceara State (outside of CIPP)
(1) Import (foreign and domestic) Wheat and rice are the principal import commodities at Ceara ports as well as petroleum products. The import volumes of these commodities are closely related to the consumption of the people of the hinterland. Thus, it is rational to forecast in a straight forward manner.
a. Wheat (Foreign dry bulk)
One of the major import commodities is wheat. As mentioned in Section 4.2.1 (1), the average wheat consumption per capita in Brazil is 52.2 kg per year. The per capita consumption has not changed over the period from 1997 through 2003 as shown in Figure 5.3.1. With the assumption that the average annual consumption per capita holds true in the states of Northeast Region, the import volume at Mucuripe Port has been the amount that corresponds to the total wheat consumption of Ceara, Piaui, Paraiba and Rio Grande do Norte.
Per Capita consumption of Wheat vs GDP per Capita
0
10
20
30
40
50
60
70
4.450 4.500 4.550 4.600 4.650
GDP/Capita (US$ 1n 1995 Price)
Con
sum
ptio
n of
Whe
at/C
apita
(Kg)
Source: IBGE population and wheat import/export and
production data, edited by JICA Study Team Figure 5.3.1 Wheat consumption per capita in Brazil
With the consideration of the increase in the import of rice at Mucuripe Port, which is also judged to be consumed in Ceara and its three adjacent states, the per capita wheat consumption will remain the same in the future. Thus, the wheat import volume is forecasted by multiplying the population estimates of the four states by the per capita consumption, i.e. 52.2 kg (see Table 5.3.1).
In the calculation, with the consideration of the fact that the wheat import volume at Mucuripe port in 2003 and 2004 are smaller than the amount of the whole population of the four state times 52.2 kg, the volume transported from Ceara to the other three states is estimated to be 10% lower than the products of per capita consumption and the population.
The import volumes of wheat in 2012 and 2022 are estimated to be 993,000 tons and 1,099,000 tons, respectively. The wheat will be imported from Argentine, which is the principal origin country of exporting wheat to Brazil.
MAIN REPORT 5 - 4 CHAPTER 5

PECEM INDUSTRIAL AND PORT COMPLEX DEVELOPMENT PLAN FINAL REPORT IN THE FEDERATIVE REPUBLIC OF BRAZIL VOLUME I
Table 5.3.1 Wheat import estimate PopulationYear 1980 1991 2000 2004 2010 2012 2020 2022
1 Maramhao 3.996 4.930 5.651 5.969 6.447 6.597 7.140 7.357
2 Piaui 2.139 2.582 2.843 2.959 3.132 3.186 3.384 3.463
3 Ceara 5.288 6.367 7.431 7.884 8.604 8.823 9.624 9.944
4 Rio &rand do norte 1.899 2.416 2.777 2.936 3.175 3.250 3.522 3.631
5 Paraiba 2.770 3.201 3.444 3.552 3.713 3.763 3.947 4.021
6 Pemambuco 6.142 7.128 7.918 8.268 8.792 8.956 9.553 9.792
7 Alagoas 1.983 2.514 2.823 2.959 3.164 3.227 3.460 3.553
8 Sergipe 1.140 1.492 1.784 1.913 2.107 2.167 2.387 2.475
9 Bahia 9.455 11.868 13.070 13.600 14.395 14.643 15.548 15.910Total in Nordeste 34.814 42.498 47.742 50.040 53.528 54.613 58.565 60.146
2+4+5 total 6.808 8.199 9.064 9.446 10.020 10.199 10.853 11.1150,9 6.127 7.379 8.158 8.502 9.018 9.179 9.768 10.003
Consumption per pe.52,2 721.687 972.173 992.948 1.068.899 1.099.280
Source: IBGE (Population) , edited by JICA Study Team b. Rice (Domestic, container cargo)
Another major import commodity is rice. As mentioned in Section 2.1.1, the average consumption of Rice of Brazil is 63.6 kg (see Table 5.3.2). If it is assumed that the per capita rice consumption of 63.6 kg holds true in the North-eastern states, the supply and demand balance is computed as shown in Table 5.3.3.
Table 5.3.2 Calculation of average per capita consumption of Rice in Brazil Kg
Export Import Production Consumption Population Consu/Cap(1) (2) (3) (4) [=(2)+(3)-(1)] (5) (4)/(5)
1996 21.860 868.018 8.652.328 9.498.486 161.247 58,91997 9.159 858.668 8.351.665 9.201.175 163.471 56,31998 6.613 1.513.220 7.716.090 9.222.697 165.688 55,71999 47.667 1.207.417 11.709.694 12.869.444 167.910 76,62000 26.406 729.549 11.134.588 11.837.731 170.143 69,62001 22.128 776.285 10.184.185 10.938.342 172.383 63,52002 29.955 639.324 10.457.093 11.066.463 174.622 63,42003 19.435 1.293.760 10.198.945 11.473.270 176.862 64,9
Average Consumption/Capita 63,6
Unit: ton
Source: IBGE, Ministry of Agriculture Web Site, Edited by JICA Study Team
Table 5.3.3 Supply-demand balance of rice in North eastern states
Region/StatesProduction ofRice in 2002(ton)
Population Consumption(ton) Surplus/Deficit
Brasil 10.457.093 174.622 11.473.270 -1.016.177Northeast 928.830 48.899 1711451 -782.6214 States + Maranhao 813.465 22.731 795585 17.880Maramhao 628.672 5.810 203357 425.315Piaui 89.917 2.901 101528 -11.611Ceara 82.153 7.666 268296 -186.143Rio &rand do norte 4.056 2.857 99981 -95.925Paraiba 8.667 3.498 122423 -113.756Pemambuco 17.865 8.093 283248 -265.383Alagoas 20.200 2.891 101192 -80.992Sergipe 37.757 1.849 64701 -26.944Bahia 39.543 13.335 466725 -427.182
Source: JICA Study Team
MAIN REPORT 5 - 5 CHAPTER 5

PECEM INDUSTRIAL AND PORT COMPLEX DEVELOPMENT PLAN FINAL REPORT IN THE FEDERATIVE REPUBLIC OF BRAZIL VOLUME I
It is assumed that people of Maranhao which has the surplus of rice production consume as much rice as the average of 60 kg per capita of Brazil, and that half of the surplus amount is consumed in the four North eastern states: Piaui, Ceara, Rio Grande do Norte and Paraiba, while the other half is consumed in the North Region.
As the trend in the rice production in the North eastern state has remained the same or tended to decrease over the past seven years (refer to Figure 2.1.8, Section 2.1.1), it is also assumed that the productions in these states remain at the same level in the coming years.
In addition, the rice consumption in the four states will increase from 28.3 kg to 31.5 in 2012 and 35 kg in 2022: Figure 4.2.5 (Chapter 4.2.1) shows that the rice import has been steadily increasing, it is realistic to assume that the consumption of rice in the North eastern states will increase further over the coming years.
The import volume of rice is estimated as the shortfalls, i.e. the difference between the volumes of consumption and production. As shown in Table 5.3.4, the rice import volumes are estimated to be 274,000 tons in 2012 and 412,000 tons in 2022.
Table 5.3.4 Forecast of Rice import Item Unit 2002 2004 2012 2022
Prod. In 4 States ton 184.793 184.793 184.793 184.793Maranao ton 140.030 140.030 140.030 140.030Import ton 153.746 176.356 273.660 412.242Consumption ton 478.569 501.179 598.483 737.065Population of 4 states 1000 184.793 17.347 19.022 21.059Consumption/Capita kg 28,3 28,9 31,5 35
Growth Rate over 20 ye 1,07% Source: JICA Study Team
Rice is imported from the South and Southeast Regions of Brazil via domestic shipping.
c. Other import commodities (container and break bulk cargoes) The correlation between the total volumes import general cargoes (bulk cargoes and liquid cargoes are excluded) and Ceara’s GDP (R$ in 2004 price) is good (r2= 0.89) as shown in Figure 5.3.2. The relationship is well approximated by Eq. (5.1).
Y = 66.22X – 1053.3 ………………………………………………….(5.1)
where Y denotes the total volume of import general cargoes (1,000 ton), while X denotes the GDP of Ceara State (R$ Billion) .
With Eq. (5.1) the import volumes of general cargoes are estimated. The results are shown in Figure 5.3.3. The estimates of the total general cargoes volumes in 2012 and 2022 are shown in Table 5.3.5. Since the import of rice has been estimated above and the import of steel rolls is estimated on the basis of the operation plan of the metal work company as described below, the volumes of the rest of the import general cargoes are estimated as indicated at the bottom line of Table 5.3.5. : the volumes of other dry bulk cargoes will be 1,007,000 tons in 2012 and 1,892,000 tons in 2022 for the growth scenario (3).
MAIN REPORT 5 - 6 CHAPTER 5

PECEM INDUSTRIAL AND PORT COMPLEX DEVELOPMENT PLAN FINAL REPORT IN THE FEDERATIVE REPUBLIC OF BRAZIL VOLUME I
Correlation beteen Import General Cargoes (Pecem & Mucuripe) andCeara GDP
y = 66,22x - 1053,3R2 = 0,8876
0
100
200
300
400
500
600
700
20 21 22 23 24 25 26
Ceara GDP (R$ Billion 2004 Price)
Impo
rt G
ener
al C
argo
(100
0 to
n)
Source: IPECE (Ceara GDP) and Mucuripe and Pecem Port (Cargo Volumes), edited by JICA Study Team
Figure 5.3.2 Correlation between Import general cargoes and GDP of Ceara
Imprt General Cargo Forecast
0
500
1.000
1.500
2.000
2.500
3.000
3.500
1994 1999 2004 2009 2014 2019
Year
Gen
eral
Car
go (1
000
ton)
Actual
(1) 3.6%
(2) 5%
(3) 3.6-5,0%
Source: JICA Study Team
Figure 5.3.3 Import dry cargo forecast (Excluding dry bulk cargoes)
Table 5.3.5 Estimates of import general cargoes Unit 1,000 ton
2004 2012 2022 2004 2012 2022 2004 2012 2022Total General Cargo 593 1.177 2.126 593 1.428 2.988 593 1.428 2.484Rice 154 274 412 154 274 412 154 274 412Rolls of steel 123 147 180 123 147 180 123 147 180Other General Cargoes 316 756 1.534 316 1.007 2.396 316 1.007 1.892
(1) 3.6% (2) 5% (3) 3.6-5,0%
Source: JICA Study Team
In order to examine the forecast volumes estimated above, the import general cargoes are estimated by another approach.
MAIN REPORT 5 - 7 CHAPTER 5

PECEM INDUSTRIAL AND PORT COMPLEX DEVELOPMENT PLAN FINAL REPORT IN THE FEDERATIVE REPUBLIC OF BRAZIL VOLUME I
In general, such a tendency is observed throughout the world that the higher the GDP grows, the more the people purchase and consume goods. Apart from the GDP per capita, there is a variety of factors that increase or decrease per capita import dry cargo volumes. It is reported that is a universal relationship between the dry cargo import volume per capita and GDP per capita of a country (On Project Evaluation in Port Planning in Development Countries, Y. Nishida and K. Kobune, 1998, PIANC). The report classified a total of 85 countries into three categories on the basis of the characteristics of the countries that affect the volume of import dry cargoes such as the geographical condition (whether the country is located within a continent or on an island), the economic structure (whether the country has industries that import raw materials and semi-products for their production), the cereal self supply rate, and the volume of transhipment and transit. The report showed the relationships between per capita dry cargo volumes and GDP for the three categories: Countries where the per capita import volumes are 1) intermediate, 2) large and 3) small.
Brazil was classified in the report as a county of small import volume, because it is rich in cereal production, has few tranship and transit cargoes and majority of the industry produce their products out of locally available materials. The relation seen among 19 countries of Category 3) is shown in Figure 5.3.4. Incidentally, the relation ship among the 44 countries of Category 1) is shown Figure 5.3.5.
Category 3
y = 0,1011x0,7131
R2 = 0,9334
0,01
0,10
1,00
10,00
0,01 0,10 1,00 10,00 100,00
Per Capita GDP($1,000 1989 price)
Per C
apita
Dry
Car
go Im
port
(ton)
Source: Y. Nishida and K. Kobune, 1998, PIANC
Figure 5.3.4 Correlation between Per capita Dry Cargo import volume and GDP
(Category 3) Countries with small import volumes)
MAIN REPORT 5 - 8 CHAPTER 5

PECEM INDUSTRIAL AND PORT COMPLEX DEVELOPMENT PLAN FINAL REPORT IN THE FEDERATIVE REPUBLIC OF BRAZIL VOLUME I
Category 1)
y = 0,2595x0,8049
R2 = 0,9508
0,01
0,10
1,00
10,00
0,01 0,10 1,00 10,00 100,00
Per Capita GDP($1,000 1989 price)
Per C
apita
Dry
Car
go Im
port
(ton)
Source: Y. Nishida and K. Kobune, 1998, PIANC
Figure 5.3.5 Correlation between Per capita Dry Cargo import volume and GDP (Category 1) Countries with intermediate import volumes)
The hinterland of Mucuripe and Pecem Ports has the same characteristics as the whole Brazil: there is land accessed to and from Ceara to other states, majority of the industries produces their products out of locally available materials and agricultural production is substantial. Thus, the relationship among the countries of Category 3 can be applied to estimate the per capita import dry cargoes.
The relationship for the countries of Category 3 is expressed by Eq. (5.2).
Y = AXB…………………………………………………………..(5.2)
where A=0.1011, B=0.7131.
The coefficient B denotes the average rate of increase of per capita dry cargoes in accordance with the increase in per capita GDP among 25 countries, while A the denotes the average of the import volume level among the countries having the same per capita GDP.
For the forecast, therefore, the value of the coefficient B of 0.7131 is employed, while the coefficient A is given the value 0.15 so that the equation best fit the cargo data in the past.
The result of the estimation is exhibited in Figure 5.3.6. It should be noted that Figure 5.3.6 includes Dry bulk cargoes, while Figure 5.3.2 excludes it. In the same manner, the dry cargo volume other than wheat, rice and roll of steel, which are estimated separately, is estimated to be 464,000 tons in 2012 and 801,000 tons in 2022 for the GDP growth scenario (3).
The total container cargo volume is the sum of the volumes of rice and other cargoes. The import container cargo volume is divided into international and domestic containers at the shares of 70% and 30%, respectively, which is the share of the international and domestic general cargos observed in the recent years (see Figure
MAIN REPORT 5 - 9 CHAPTER 5

PECEM INDUSTRIAL AND PORT COMPLEX DEVELOPMENT PLAN FINAL REPORT IN THE FEDERATIVE REPUBLIC OF BRAZIL VOLUME I
5.3.7).
Dry Cargo Forecast
0
500.000
1.000.000
1.500.000
2.000.000
2.500.000
3.000.000
1994 1999 2004 2009 2014 2019Year
Dry
Car
go to
nRealized3,50%5%5% - 3,5%
Source: JICA Study Team
Figure 5.3.6 Import dry cargo forecast
Table 5.3.6 Result of import dry cargoes Unit : 1000 ton
Ceara Dry Cargo Import 3,61% 3,61% 5,0% 5,0% 5,0% 3,61%
2004 2012 2022 2004 2012 2022 2004 2012 2022Total Dry Cargo 1.434 1.740 2.310 1.434 1.878 2.740 1.434 1.878 2.492Wheat 722 993 1.099 722 993 1.099 722 993 1099Rice 154 274 412 154 274 412 154 274 412Roll of steel 123 147 180 123 147 180 123 147 180Other 435 326 618 435 464 1.049 435 464 801International 412 326 618 412 464 1.023 412 464 801Domestic 177 274 412 177 274 438 177 274 412
Ceara State Federal Study Team
Source: JICA Study Team
General Cargo (Excluding Rice)
0%
10%
20%
30%
40%
50%
60%
70%
80%
90%
100%
1994 1996 1998 2000 2002 2004
Year
ton
General(Longo Cruso)
General(Cabotage)
Source: Mucuripe and Pecem Port, edited by JICA Study Team
Figure 5.3.7 Share between the international and domestic general cargoes The study team assessed that the estimates shown in Table 5.3.6 seem to be more
MAIN REPORT 5 - 10 CHAPTER 5

PECEM INDUSTRIAL AND PORT COMPLEX DEVELOPMENT PLAN FINAL REPORT IN THE FEDERATIVE REPUBLIC OF BRAZIL VOLUME I
realistic. Therefore, the estimates shall be employed in the master plan.
d. Import of Steel Roll (Break bulk) The major commodities among the break bulk cargoes is steel rolls, which have been imported in the shape of break bulk by a metal work company. According to the interview with the company, it has the plan to expand its import volume up to 180,000 tons per year. Since the time schedule of the realization of its plan is not given, the study team assumed that the volume of 180,000 tons will be achieved in the years following 2012. The import volume of steel rolls in the year 2012 is estimated as the average of the volume imported in 2004.
(2) Export As mentioned in Chapter 2, the export volume of the general cargoes has been increasing over the recent years. However, the GDP of Ceara showed a gradual increase (see Figure 5.3.8).
Ceara State GDP (R$ Mi ll ion 2004 Price)
0
5.000
10.000
15.000
20.000
25.000
30.000
1995 1997 1999 2001 2003Year
GD
P C
eara
Sta
te
Source: IPECE
Figure 5.3.8 GDP of Ceara
Thus, it seems to be inappropriate to analyse the regression over the full period from 1994 through 2004. Therefore, the forecast of the export commodities were performed in the following manner:
1) All the commodities were classified into three categories; agriculture, light industry and other industry.
2) Among the commodities in a category, the principal commodity that shows a big leap since 2002 was identified.
3) The total volume except the principal commodity was calculated.
4) The regression analysis was made by category between the total cargoes except the principal commodity and the GDP of Ceara over the period from 1994 through 2001.
MAIN REPORT 5 - 11 CHAPTER 5

PECEM INDUSTRIAL AND PORT COMPLEX DEVELOPMENT PLAN FINAL REPORT IN THE FEDERATIVE REPUBLIC OF BRAZIL VOLUME I
5) The growth rate of the export volume (except the principal commodity) for the year 2005 and subsequent one or two years were assumed to reduce gradually until the rate falls to the same growth rate exhibited by the regression equation.
6) The cargo volumes in the later years were estimated as the sum of the amount of leap over the few years since 2002 and the amount given by the regression equation.
7) The volumes of the principal commodity was estimated separately by direct forward on the basis of other information available
8) The cargo volumes was estimated as the sum of the amount obtained at steps 6) and 7)
a. Agriculture related products
Fruit and fish (especially shrimps) are the major commodities in this category and showed a big leap. The regression analysis was performed for the total volume excluding fruit and fish. As observed in Figure 5.3.9, the correlation of the volume excluding fruit and fish with GDP is not good, very low. Therefore, the correlation with the volume excluding fruit only with Ceara’s GDP was employed for the estimate
Agriculture (Exclude Fruit) vs GDP
y = 7,5736x - 102336R2 = 0,5192
y = 3,9854x - 26826R2 = 0,2054
30.000
40.000
50.000
60.000
70.000
80.000
90.000
19.000 21.000 23.000 25.000 27.000
GDP R$ Billion
GC
(Agr
icul
tura
l Pro
duct
) ton
Exc. Fruit
Ex. Fluit & Fish
Source: JICA Study Team
Figure 5.3.9 Correlation of the volumes excluding fruit only and fruit and fish with Ceara GDP
The result of the forecast is shown in Figure 5.3.10.
MAIN REPORT 5 - 12 CHAPTER 5

PECEM INDUSTRIAL AND PORT COMPLEX DEVELOPMENT PLAN FINAL REPORT IN THE FEDERATIVE REPUBLIC OF BRAZIL VOLUME I
Agriculture (Exclude Fruit)
-
50.000
100.000
150.000
200.000
250.000
300.000
350.000
400.000
450.000
1994 1999 2004 2009 2014 2019
Ceara GDP R$ Billion
Agr
icul
ture
Pro
duct
Exp
ort (
Exc
lude
Fru
it)
3,61%
5,00%
5%-3,61%
Exc. Fruit
Source: JICA Study Team
Figure 5.3.10 Forecast of Agriculture related cargos (excluding Fruit)
The export volume of fruit was estimated as follows:
When the on-going Sao Francisco River Diversion Project is completed, a total farmland of 80,000 ha will be irrigated in Ceara and Rio Grande do Norte. What kind of fruit or cereals will be planted is unknown at present. However, it is most likely that, in the new irrigated farm land, the most profitable kind of fruit will be planted for export.
The productivity varies by kind of fruits as Table 5.3.7 shows. Banana, Melon a, mango and Papaya are presently the major export fruits. The productivity of these kind of fruits are 10 ton/ha or larger.
Table 5.3.7 Productivity in Ceara State Fruit Productivity
ton/haPapaya 46,22Pineapple 32,35Melon 24,43Passion Fruit 19,08Orange 9,92Lemon 9,64Mango 9,09Banana 8,23Cashew nut 0,32
Source: Ceara em Numeros. 2004, edited by JICA Study Team
Thus, it was assumed that the production in the newly irrigated farm land will increase the production by 5 tons per ha. With this assumption, the fruit export will have increased by 400,000 tons in the year 2022. The additional export volume from
MAIN REPORT 5 - 13 CHAPTER 5

PECEM INDUSTRIAL AND PORT COMPLEX DEVELOPMENT PLAN FINAL REPORT IN THE FEDERATIVE REPUBLIC OF BRAZIL VOLUME I
the new irrigated farm land in 2012 is estimated to be 2/3 of that expected in 2022, i.e., 267,000 tons.
The export of fish (shrimps) has been growing remarkably. However, the shrimps exported are not cultivated but natural ones. Thus, it is likely that the export of shrimps will be controlled from the view point of the conservation of marine natural resources. Thus, it was assumed that the export volume of fish will maintain the same amount as of 2004, i.e., 73,000 tons.
Fruit and fish will be transported in reefer containers, while other agricultural products will be transported in dry containers.
b. Light industry related commodities
The principal export commodity among the light industry related products is salt. The share of salt in the export volume has exceeded 50% since 2000, and its market is limited to the North Region while other commodities are exported to whole Brazil and foreign markets. Thus, it seems to be reasonable to forecast Salt separately from other commodities.
The correlation between the total export volume of this category except salt and GDP over the period from 1994 through 2002 is exhibited in Figure 5.3.11. Though the correlation is not high enough, the regression equation given in Figure 5.3.11 was employed in the forecast. The result of the forecast is shown in Figure 5.3.12.
Light Industry (Exclude Sal) vs GDP
y = 4,7494x - 61897R2 = 0,2654
-
20.000
40.000
60.000
80.000
19.000 20.000 21.000 22.000 23.000 24.000 25.000 26.000GDP R$ Billion
GC
(Lig
ht In
dust
ru P
rodu
ct) t
on
Source: Mucuripe port and IPECE, edited by the JICA Study Team
Figure 5.3.11 Correlation between total export volume of Light Industry related commodities
MAIN REPORT 5 - 14 CHAPTER 5

PECEM INDUSTRIAL AND PORT COMPLEX DEVELOPMENT PLAN FINAL REPORT IN THE FEDERATIVE REPUBLIC OF BRAZIL VOLUME I
Light Industry (Exclude Salt)
-
50.000
100.000
150.000
200.000
250.000
300.000
350.000
1994 1999 2004 2009 2014 2019
Ceara GDP R$ Billion
Exp
ort v
olum
e of
Lig
ht in
dust
ry re
late
dP
rodu
ct (E
xclu
deS
alt)
3,61%
5,00%
5%-3,61%
Sub-total Except Salt
Source: JICA Study Team
Figure 5.3.12 Forecast of the export of light industry related products
Salt Export
Since the market of salt is limited to the North Region, it is unlikely to increase further at a high growth rate. In addition, the increase rate in 2004 is lower than that in 2003. Thus, it was assumed that the export volume of salt would be 319,000 tons in 2012 and 1.5 times in 2022 as large as the amount exported in 2004.
c. Other industry related products
Petroleum products have been the principal commodity of this category. Since petroleum products are transported by tankers, the export volume should be estimated separately from general cargoes. Thus, the regression analysis was made on the total export volume excluding petroleum products.
The correlation between the export volume, excluding petroleum products and Ceara’sa GDP over the period from 1994 through 2002 is shown in Figure 5.3.13. The correlation is good. The result of forecast is shown in Figure 5.3.14.
MAIN REPORT 5 - 15 CHAPTER 5

PECEM INDUSTRIAL AND PORT COMPLEX DEVELOPMENT PLAN FINAL REPORT IN THE FEDERATIVE REPUBLIC OF BRAZIL VOLUME I
Export of Other Industry related Products (Exclude Petroleum) vs GDP
y = 4,2901x - 73797R2 = 0,7104
-
20.000
40.000
60.000
19.000 20.000 21.000 22.000 23.000 24.000 25.000
Ceara GDP R$ Billion
Exp
ort v
olum
e to
n
Source: IPEC、Pecem and Mucuripe Port, edited by JICA Study Team
Figure 5.3.13 Correlation between the export volume of Other industry related products excluding Petroleum products and Ceara GDP
Summing up the export dry cargo generated in Ceara State, the total export dry cargoes (all the commodities are container cargoes) is computed as shown in Table 5.3.8. For the growth scenario assumed by the study Team, the total export cargoes in 2012 and 2022 are estimated to be 1,421, 000 tons and 1,966,000 tons, respectively.
The amount of export cargoes is divided into international and domestic cargoes by employing the ratio of international and domestic cargoes observed in the recent years. Figure 5.3.15 shows the trend of the ratio.
Export of Other Industry related products(Exclude Petroleum Product)
-
50.000
100.000
150.000
200.000
250.000
300.000
350.000
1994 1999 2004 2009 2014 2019Ceara GDP R$ Billion
Exp
ort v
olum
e ( t
)
3,61%
5,00%
5%-3,61%
Excl Petroleum Products
Source: JICA Study Team
Figure 5.3.14 Forecast of the export of other industry related products
MAIN REPORT 5 - 16 CHAPTER 5

PECEM INDUSTRIAL AND PORT COMPLEX DEVELOPMENT PLAN FINAL REPORT IN THE FEDERATIVE REPUBLIC OF BRAZIL VOLUME I
Table 5.3.8 Summary of the forecast volume of export dry cargoes Unit: 1000 ton
Item 3,61% 3,61% 0,0% 5,0% 5,0% 0,0% 5,0% 3,61%2004 2012 2022 2004 2012 2022 2004 2012 2022
Total Dry Cargo Volume 822 1.358 1.876 822 1.421 2.092 822 1.421 1.966
Agricultural Product 74 209 318 74 238 416 74 238 359(Exclude Fruit & Fish)
Fresh Fruit 182 382 582 182 382 582 182 382 582Fish 73 73 73 73 73 73 73 73 73
Light Industry 59 171 239 59 189 301 59 189 265 (Exclude Food Salt)
Salt 266 319 399 266 319 399 266 319 399Other Industry 169 204 266 169 221 322 169 221 289 (Exclude Petroleum)Dry Container (Excule Steel) 567 903 1.221 567 966 1.437 567 966 1.311Reefer Container 255 455 655 255 455 655 255 455 655
Export Container Total 822 1.358 1.876 822 1.421 2.092 822 1.421 1.966 (Pecem + Mucuripe)Pecem Porrt (Intnational 559 924 1.276 559 966 1.423 559 966 1.337 Dry Container + Reefer)
International Dry Container 304 469 621 304 511 768 304 511 682Reefer Container 255 455 655 255 455 655 255 455 655
Mucuripe 263 435 600 263 455 670 263 455 629 (Domestic incl. Sal)
(Domestic 32%)
Ceara State GDP Growth Est. Federal Gov. GDP Growth Est. Study Team estimate
Source: JICA Study Team
Export (Genersal Cargoes)
0%
20%
40%
60%
80%
100%
1994 1995 1996 1997 1998 1999 2000 2001 2002 2003 2004
Year
ton
EXPORT CABOTAGE(M)
EXPORT LONG COURSE (P)
EXPORT LONG COURSE (M)
Source : Mucuripe and Pecem Port, Edited by JICA Study Team
Figure 5.3.15 Share of International and domestic export cargoes
d. Other cargoes
Some companies have concrete plans to start exporting their products in the future that have been supplies in the local market only or plans to expand the export volume of their products. The following are their operational plans:
Cement
A cement company in Ceara has a plan to expand its annual production from current 600,000 tons to 1.0 million tons. When their production reaches, they will be exporting 300,000 tons of cement overseas. This plan implies that additional
MAIN REPORT 5 - 17 CHAPTER 5

PECEM INDUSTRIAL AND PORT COMPLEX DEVELOPMENT PLAN FINAL REPORT IN THE FEDERATIVE REPUBLIC OF BRAZIL VOLUME I
120,000 tons of coke will be imported as dry bulk cargoes: 0.2 tons of coke is needed to produce 1 ton of cement. Their cement will be exported in sacks.
Thus, it is assumed that the plan will be realized sometime between 2012 and 2022. The additional cargoes added to the above estimated export dry cargoes.
Import of coke (Dry Bulk): 2012; 120,000 tons, 2022; 200,000 tons.
Export of Cement (Container): 2012; 150,000 tons, 2022; 300,000 tons
Iron and Steel
An ironwork company that is processing steel products mainly for construction materials has a plan to expand their production up to 90,000 tons from 60,000 tons at present. To this end, the company will also increase import of intermediate steel products. Since, in 2004, the company imported 121,000 tons of intermediate steel products to export 60,000 tons of billet, their import and export volumes are assumed as follows:
Import: Intermediate steel products,
2012; 150,000 tons, 2022 180,000 tons
Export: Billet
2012: 75,000 tons, 2022; 90,000 tons
5.3.3 Potential cargoes generated in other State in the future
(1) Soy beans in Piaui State The export potential capacity of soybeans produced in the Northeast Region is estimated to be 18 million tons per annum (Please refer to Section 5.3.3 of the Progress Report of this Study). It is also highly expected to be cultivated by 2022 to meet the demand in the world market.
On the basis of the analysis including the transport cost, the study team has concluded that one fourth of soybean exports of 18 million tons in 2022 should be allocated to Pecem Port, with the resulting amount of 4.5 million tons per annum, as well as Suape Port. In Itaqui Port and Ilheus Port, in addition to each 4.5 million tons per annum in the same year, the anticipated exports from another Cerrado region extending from the north region to the centre-west region as mentioned in Section 4.3.3 (2) are allocated, with the resulting totaled amount of 13,2 million and 12,4 million ton per year, respectively.
(2) Fresh fruit in Bahia State The northwest part of Bahia State is rich in fresh fruit production. The fresh fruit production there has been growing. As seen in Figure 5.3.16, the geographical location of this area is next to Piaui State and there is quite a distance from Salvador Port in Bahia. Taking into consideration the railway service, which is expected to operate sometime around 2010, it is likely the fruit produced in this area will be exported via Pecem as well as Suape Port.
The volume of fresh fruit brought from this area to Pecem Port for export was assumed to be 300,000 tons; this volume is comparative to 10% of the total export
MAIN REPORT 5 - 18 CHAPTER 5

PECEM INDUSTRIAL AND PORT COMPLEX DEVELOPMENT PLAN FINAL REPORT IN THE FEDERATIVE REPUBLIC OF BRAZIL VOLUME I
containers (International) of Bahia, which is estimated in the following section (see Table 5.3.9).
Pecem
Source: Bahia Stahe Web Site, Edited by JICA Study Team
Figure 5.3.16 Fruit production zone of Bahia State
5.3.4 Transhipment container cargoes at Pecem
As mentioned in the previous section, the Port of Pecém has a high possibility of collecting transhipment cargo from the whole of Brazil by feeder service in addition to the cargo from its hinterland.
Demand forecast of transhipment containers at Pecém is conducted by the following procedures;
a. The container throughput of each region in Brazil has been estimated. In this study, the growth rate of container throughput in Brazil is assumed to be 8.0 % per annum to 2012 and a further 4.0 % per annum to 2022 on the basis of several reports of major maritime consultants.
“Annual Review of Global Container Terminal Operators -2004”
MAIN REPORT 5 - 19 CHAPTER 5

PECEM INDUSTRIAL AND PORT COMPLEX DEVELOPMENT PLAN FINAL REPORT IN THE FEDERATIVE REPUBLIC OF BRAZIL VOLUME I
Drewry Shipping Consultants forecasts that container throughput in South America will grow by an average of 10.4 % per annum between 2003 and 2009.
“World Containerport Outlook to 2015”
Ocean Shipping Consultants forecasts that container throughput in South America will grow by an average of 6.8-9.3 % per annum between 2003 and 2015.
“Performance of Container Terminal 2004”
ABRATEC (Brasil Public Use Container Terminal Association) forecasts that container throughput in Brazil will grow by an average of 13.8 per annum between 2004 and 2010 to 7 mill TEU.
The result of the above-mentioned procedure is shown in Table 5.3.9.
b. Basically, all foreign container cargo of the north region shall be transported by feeder service and be gathered up to Pecém Port. It is considered that the ratio of cargo transported through Pecém Port will increase year after year. In this case, the ratio is assumed to be 50 % in 2012 and 70 % in 2022.
c. Since Salvador Port cannot accept large size container vessels due to the water depth of the container berth, once the volume of container cargo generated in the State of Bahia exceeds the capacity of Salvador Port, the excess container volume shall be handled at Pecém or Suape, where large vessels can dock. In this case, the share of Pecém Port in the handling of the excess container volume is assumed to be 30%, with the consideration of the fact that more frequent shipping service is available at Suape Port than at Pecém Port. In addition, it is also reported on the web site of ANTAQ that the container terminal of Salvador Port has a handling capacity of 250,000 TEUs per annum.
However, it seems to be more realistic to assume that those containers overflowed from Salvador port that have been estimated above (see Table 5.3.9), will be brought to either Suape or Pecem overland. Thus, the potential transhipment containers were taken into the cargo forecast as local containers.
MAIN REPORT 5 - 20 CHAPTER 5

PECEM INDUSTRIAL AND PORT COMPLEX DEVELOPMENT PLAN FINAL REPORT IN THE FEDERATIVE REPUBLIC OF BRAZIL VOLUME I
Table 5.3.9 Demand forecast of transhipment containers at Pecém (Unit:'000TEU)
Foreign Domestic Total Foreign Domestic Total Foreign Domestic TotalNorth MANAUS-AM 19 91 109 38 182 218 56 269 323
BELÉM-PA 46 0 46 92 0 92 136 0 136Other Ports 2 1 3 4 2 6 6 3
67 92 159 1349
184 318 198 272 470Northeast PECÉM-CE 67 0 67 134 0 134 198 0 198
FORTALEZA-CE 36 41 77 72 82 154 107 121 228RECIFE-PE 21 36 57 42 72 114 62 107 169SUAPE-PE 21 40 61 42 80 122 62 118 180SALVADOR-BA 109 60 169 218 120 338 323 178 500Other Ports 4 3 7 8 6 14 12 9 2
257 181 438 514 362 876 760 536 1.296Southeast TERM. TUBARÃO-ES 9 0 9 18 0 18 27 0 27
VITÓRIA-ES 100 25 125 200 50 250 296 74 370RIO DE JANEIRO-RJ 277 48 325 554 96 650 820 142 962SEPETIBA-RJ 15 12 27 30 24 54 44 36 80TERM. CUBATÃO-SP 148 27 175 296 54 350 438 80 518SANTOS-SP 1.288 97 1.385 2.575 194 2.769 3.811 287 4.098Other Ports 0 0 0 0 0 0 0 0 0
1.837 210 2.046 3.672 420 4.090 5.436 621 6.054South PARANAGUÁ-PR 218 0 218 436 0 436 645 0 645
S. F. DO SUL-SC 147 107 254 294 214 508 435 317 752ITAJAÍ-SC 419 23 442 838 46 884 1.240 68 1.308RIO GRANDE-RS 435 88 523 870 176 1.045 1.287 260 1.548Other Ports 0 15 15 0 30 30 0 44 4
1.219 233 1.452 2.437 466 2.903 3.607 689 4.2963.431 715 4.145 6.757 1.431 8.186 10.001 2.119 12.117
Source: Annual report of ANTAQ, Estimated by JICA Study Team
2003 2012(rate=8%) 2022(rate=4%)
SUB-TOTAL
Region and Port
SUB-TOTAL
SUB-TOTAL
SUB-TOTALTOTAL
1
4
With the assumption that, in 2012, 50% of international containers generated in NorthRegion should be transhipped at Pecem, while, in 2022, the transhipment rate reached to 70 %.
The transhipment container volumes are calculated as follows:
2012: 134 x 0.5 x 2= 134, 2022 , 198 x 0.7x2=277
MAIN REPORT 5 - 21 CHAPTER 5
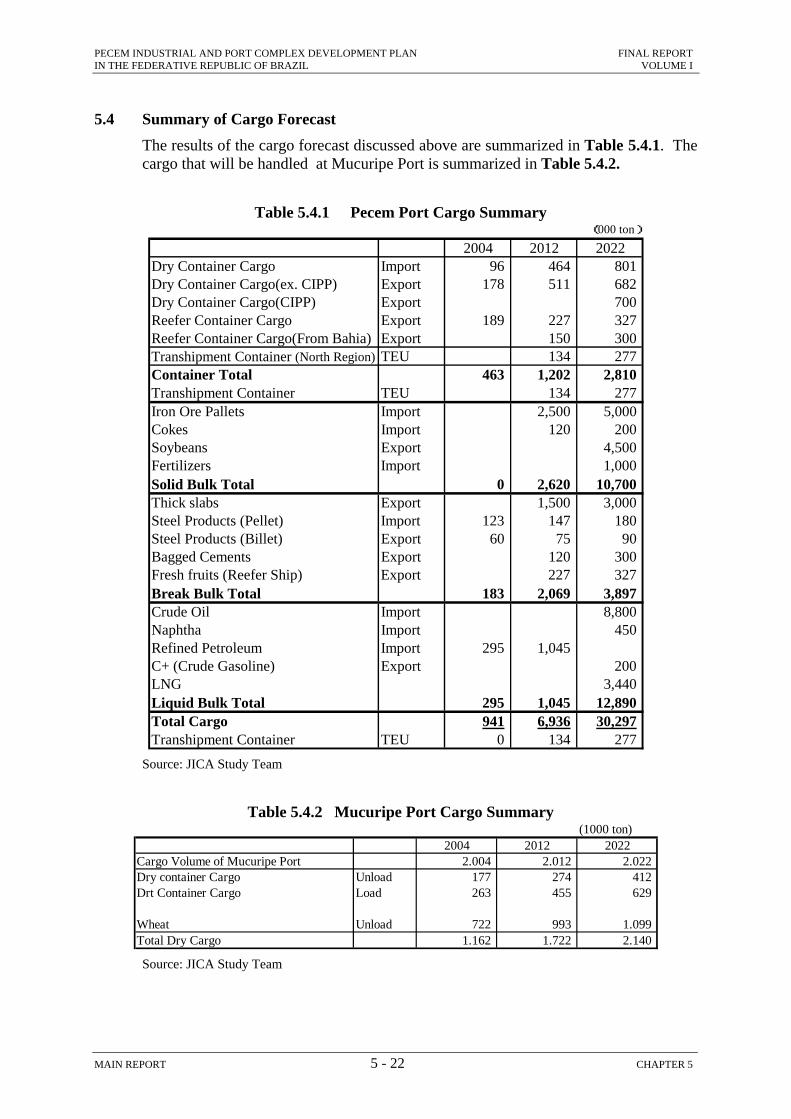
PECEM INDUSTRIAL AND PORT COMPLEX DEVELOPMENT PLAN FINAL REPORT IN THE FEDERATIVE REPUBLIC OF BRAZIL VOLUME I
5.4 Summary of Cargo Forecast The results of the cargo forecast discussed above are summarized in Table 5.4.1. The cargo that will be handled at Mucuripe Port is summarized in Table 5.4.2.
Table 5.4.1 Pecem Port Cargo Summary
2004 2012 2022Dry Container Cargo Import 96 464 801Dry Container Cargo(ex. CIPP) Export 178 511 682Dry Container Cargo(CIPP) Export 700Reefer Container Cargo Export 189 227 327Reefer Container Cargo(From Bahia) Export 150 300Transhipment Container (North Region) TEU 134 277Container Total 463 1,202 2,810Transhipment Container TEU 134 277Iron Ore Pallets Import 2,500 5,000Cokes Import 120 200Soybeans Export 4,500Fertilizers Import 1,000Solid Bulk Total 0 2,620 10,700Thick slabs Export 1,500 3,000Steel Products (Pellet) Import 123 147 180Steel Products (Billet) Export 60 75 90Bagged Cements Export 120 300Fresh fruits (Reefer Ship) Export 227 327Break Bulk Total 183 2,069 3,897Crude Oil Import 8,800Naphtha Import 450Refined Petroleum Import 295 1,045C+ (Crude Gasoline) Export 200LNG 3,440Liquid Bulk Total 295 1,045 12,890Total Cargo 941 6,936 30,297Transhipment Container TEU 0 134 277
('000 ton)
Source: JICA Study Team
Table 5.4.2 Mucuripe Port Cargo Summary (1000 ton)
2004 2012 2022Cargo Volume of Mucuripe Port 2.004 2.012 2.022Dry container Cargo Unload 177 274 412Drt Container Cargo Load 263 455 629
Wheat Unload 722 993 1.099Total Dry Cargo 1.162 1.722 2.140
Source: JICA Study Team
MAIN REPORT 5 - 22 CHAPTER 5