Chapter 4 - Demand - Mr. Tyler's Lessons | A Place · PDF fileSubstitution Effect •occurs...
63
Chapter 4 - Demand Maybach Exelero
Transcript of Chapter 4 - Demand - Mr. Tyler's Lessons | A Place · PDF fileSubstitution Effect •occurs...

Chapter 4 - Demand
Maybach Exelero

Section 1 –
Understanding Demand

Demand
The desire to own something and the
ability to pay for it.

Law of Demand
consumers buy more of a good
when its price decreases and less
when its price increases.

Substitution Effect
• occurs when consumers react to an
increase in a good’s price by consuming
less of that good and more of other goods.

The Income Effect
• The change in consumption
resulting from a change in income
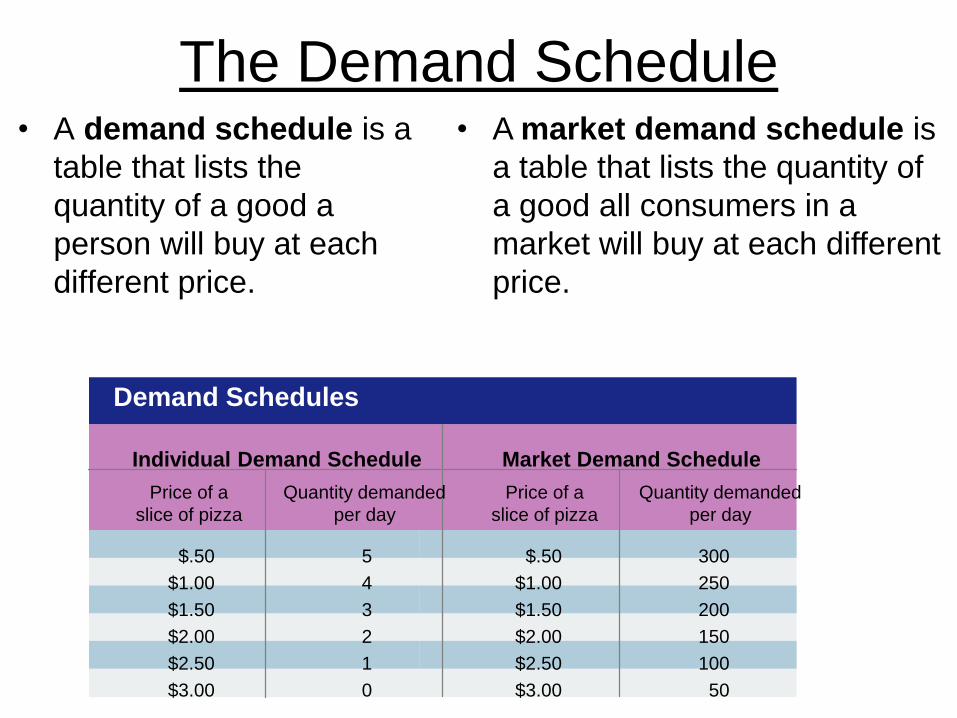
• A demand schedule is a
table that lists the
quantity of a good a
person will buy at each
different price.
The Demand Schedule • A market demand schedule is
a table that lists the quantity of
a good all consumers in a
market will buy at each different
price.
Demand Schedules
Individual Demand Schedule
Price of a
slice of pizza
Quantity demanded
per day
Market Demand Schedule
Price of a
slice of pizza
Quantity demanded
per day
$.50
$1.00
$1.50
$2.00
$2.50
$3.00
5
4
3
2
1
0
$.50
$1.00
$1.50
$2.00
$2.50
$3.00
300
250
200
150
100
50

Demand Curve
• a graphical representation of a demand schedule.
• When reading a demand curve, assume all outside factors, such as income, are held constant.
Market Demand Curve
3.00
2.50
2.00
1.50
1.00
.50
0
0 50 100 150 200 250 300 350
Slices of pizza per day
Pri
ce
pe
r s
lic
e (
in d
oll
ars
)
Demand

Section 2 –
Shifts of the Demand Curve
Shifts in Demand • Ceteris paribus
• A demand curve is accurate only as long as the
ceteris paribus assumption is true.
• When the ceteris paribus assumption is
dropped, movement no longer occurs along the
demand curve the entire demand curve shifts.

What Causes a Shift in
Demand?

1. Income • Changes in consumers incomes affect
demand.

• normal good - a good that consumers demand
more of when their incomes increase.

• Inferior good - a good that consumers demand
less of when their income increases.

2. Consumer Expectations
• Whether or not
we expect a good
to increase or
decrease in price
in the future
greatly affects
our demand for
that good today.

Bicycle Example

Bicycle Example Scenario #1
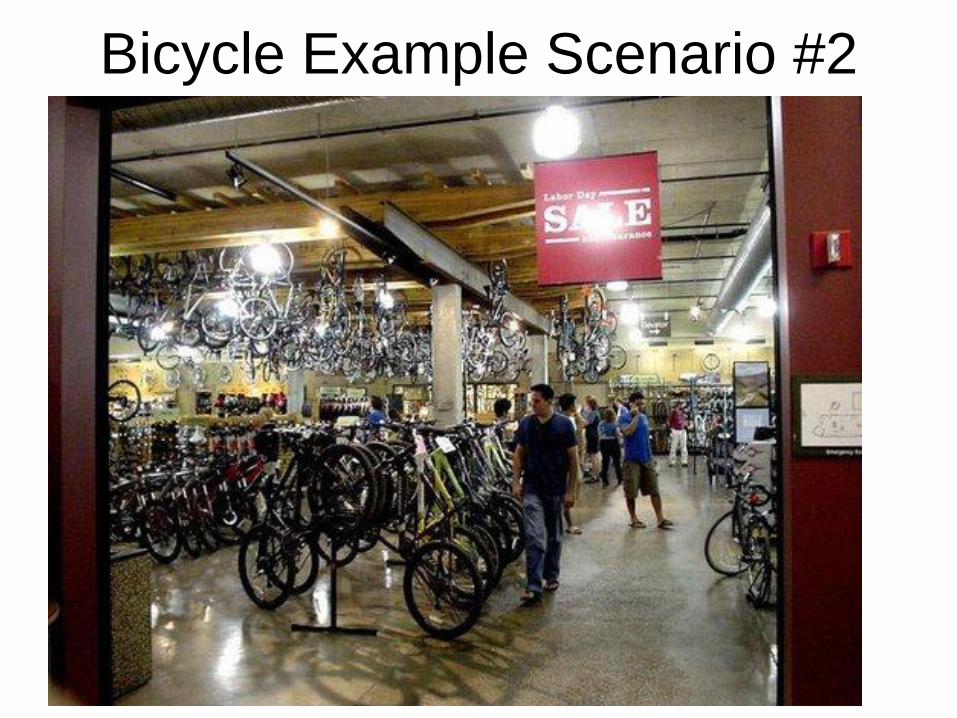
Bicycle Example Scenario #2
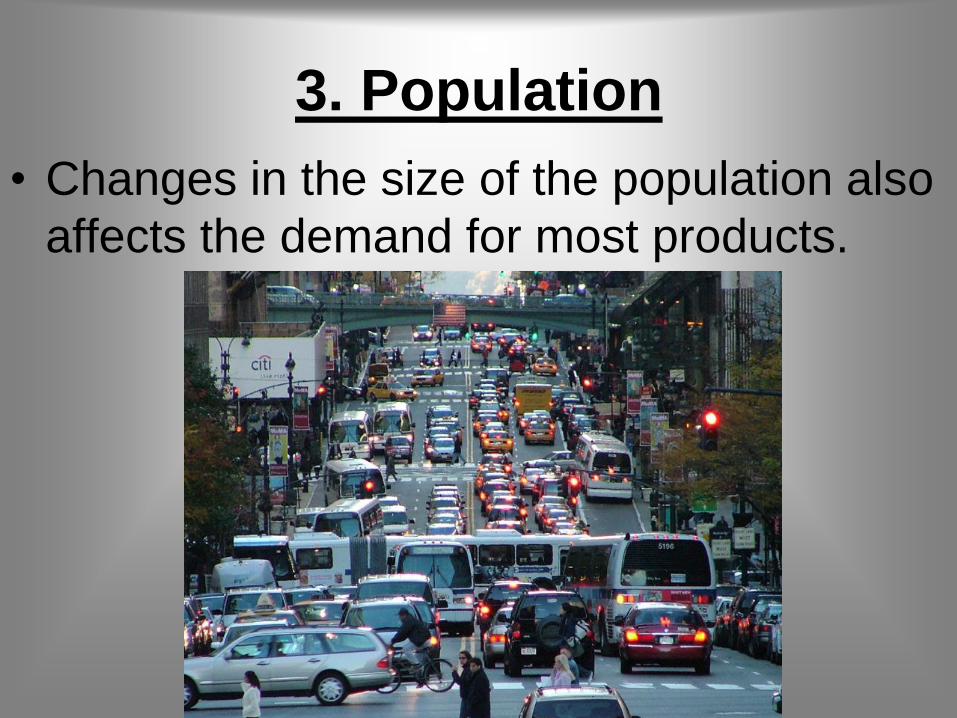
3. Population
• Changes in the size of the population also
affects the demand for most products.

4. Consumer Tastes and
Advertising
• Why do fads begin? Is
it because of
advertising,
campaigns, social
trends, television
shows, combination of
all of it?
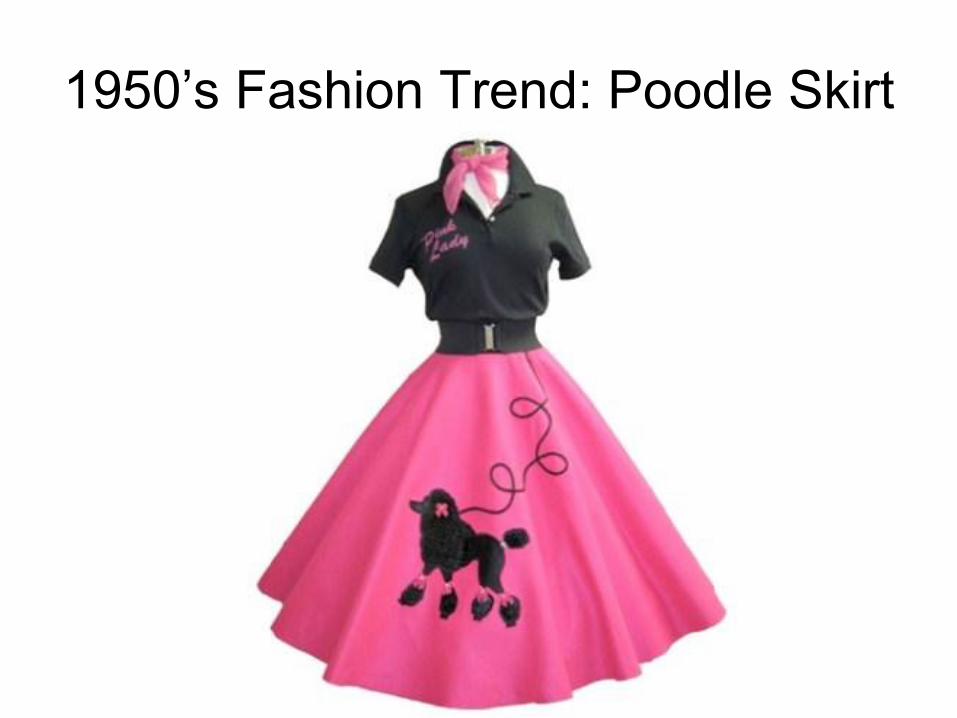
1950’s Fashion Trend: Poodle Skirt

1950’s Fashion
Trend:
Cat's Eye
glasses

Other Fashion Trends: 1950’s
• Peter pan collared shirts
• Saddle Shoes
• Hawaiian shirts
• Letterman jackets
• White Tshirts
• Blue Jeans (deep cuffs)
• Beatniks (all black)
• Circle skirts
Beatnik

1960’s Fashion Trends: Tie-dye
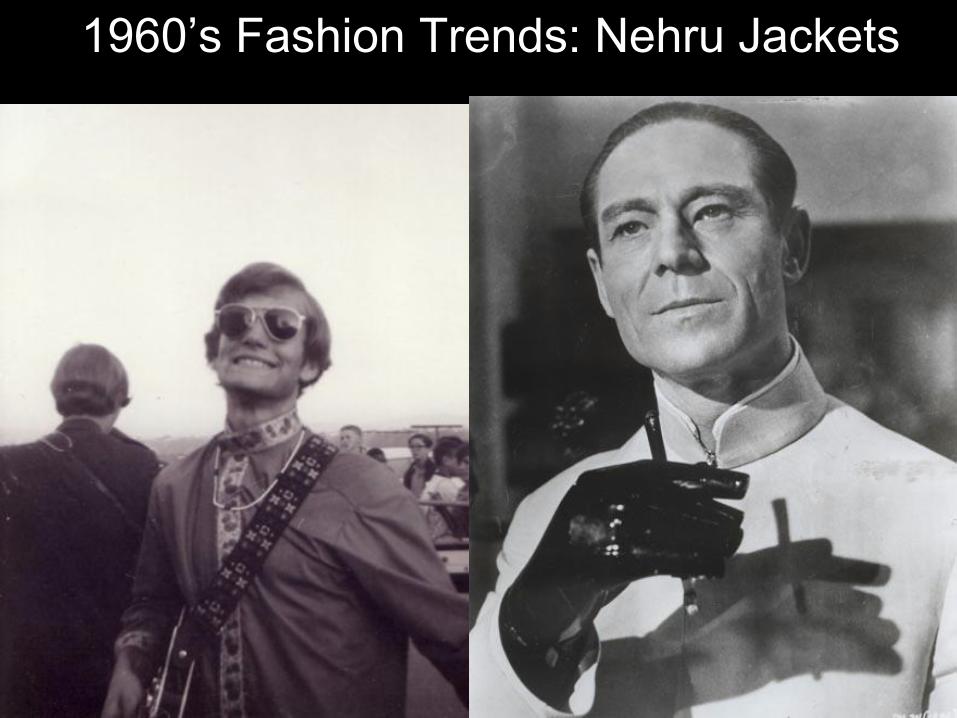
1960’s Fashion Trends: Nehru Jackets

Other Fashion Trends: 1960’s
• Miniskirts
• Go-go boots
• Pill box hats
• Hotpants
• Shift dress
• 3/4 length sleeves

1970’s Fashion Trends: Earth Shoes

1970’s
Fashion
Trends:
Bell-bottoms
Other Fashion Trends: 1970’s • Track suits
• Mood rings
• Earth shoes
• Platform shoes
• Leisure suits
• Disco/glam rock
• Printed nylon or polyester
shirts
• Corduroy

1980’s Fashion
Trend:
Polo shirts

1980’s Fashion
Trend:
Acid-wash jeans

Other Fashion Trends: 1980’s
• Designer jeans
• Flashdance: leg-
warmers, ripped
sweatshirts
• Big shoulder pads
• Punk
• Parachute pants

1990’s Trend: Grunge music

1990’s Fashion Trend:
Power bead bracelets

90’s Fad : Furby
Other Trends: 1990’s
• Long, straight hair
parted down the
middle
• Pashminas (type of
scarves )
• Tattoos
• Minimalistic designs
• Baggy jeans

Trends of the 2000’s:
Flare Jeans

Trends of the 2000’s: Geocaching

Trends of the 2000’s:
Razor Scooters

Other General Trends: 2000’s • High School Musical
• YouTube
• Mini skirts with leggings
• Skinny jeans
• Ipods
• American Idol
• Emo Music & Style
• Craigslist
• World of Warcraft
• Heelys
• Silly Bands
• XBOX
• Fantasy Leagues
• Robotic Pets
• Hannah Montana
• TV/ DVD screens in cars
• Hybrid cars
• Oversized sunglasses
• Using online slang in speech
• Crocs
• Gameboy Advance
• PS2 – PS3
• Colored Jeans
• Soulja Boy
• DeGrassi
• Family Guy
• That 70s Show
• The Chappell Show
• Internet Dating

• Changes in tastes and preferences cannot be
explained by changes in income or population

The demand curve for one good can be
affected by a change in the demand for
another good.
Prices of Related Goods
• Complements are
two goods that are
bought and used
together. Example:
skis and ski boots
• Substitutes are
goods used in place
of one another.
Example: skis and
snowboards

Chapter 4 – Section 3
Calculating Elasticity of Demand

Elasticity of Demand
a measure of how consumers
react to a change in price.

Elasticity
• Describes demand for a good that is
very sensitive to changes in price is
elastic.

Examples of Elastic Goods:

Examples of Elastic Goods:

Examples of Elastic Goods:

Examples of Elastic Goods:
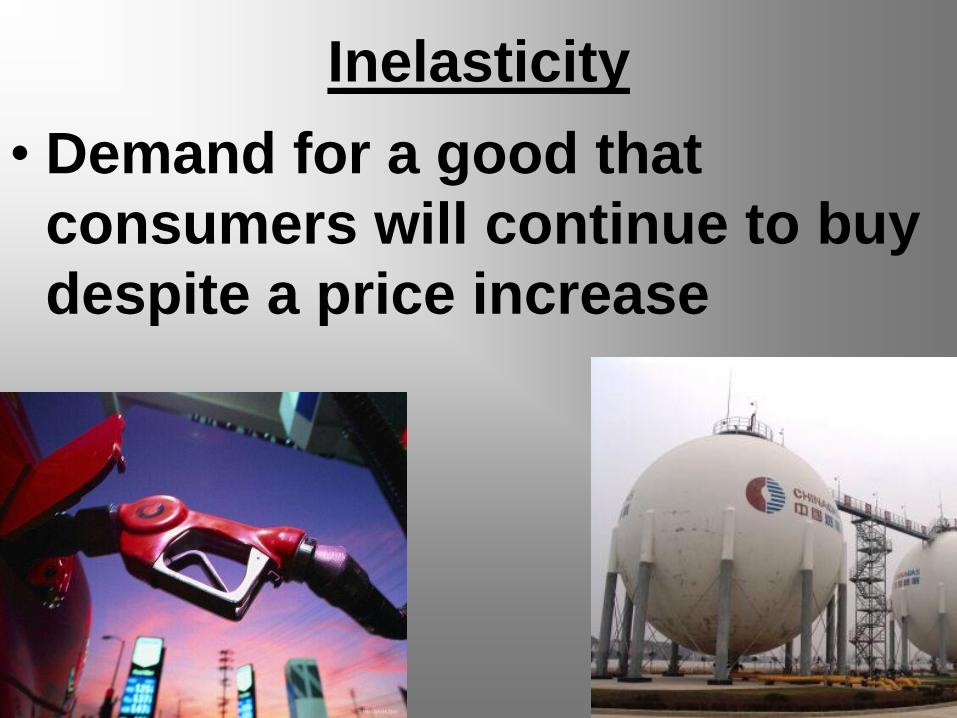
Inelasticity
• Demand for a good that
consumers will continue to buy
despite a price increase

Examples of Inelastic Goods

Examples of Inelastic Goods

Examples of Inelastic Goods

Elasticity of Demand
Calculating Elasticity
Elasticity is determined using the following formula:
Elasticity = Percentage change in quantity demanded
Percentage change in price
Percentage change = Original number – New number
Original number x 100
To find the percentage change in quantity demanded or price, use the following formula:
subtract the new number from the original number, and divide the result by the original
number. Ignore any negative signs, and multiply by 100 to convert this number to a
percentage:

Elastic Demand
If demand is elastic, a small change in price
leads to a relatively large change in the quantity
demanded. Follow this demand curve from left
to right.
Pri
ce
Quantity
$7
$6
$5
$4
$3
$2
$1
Elastic Demand
0 5 10 15 20 25 30
Demand
The price decreases from $4 to $3, a decrease
of 25 percent.
$4 – $3
$4
x 100 = 25
The quantity demanded increases from 10
to 20. This is an increase of 100 percent.
10 – 20
10
x 100 = 100
Elasticity of demand is equal to 4.0.
Elasticity is greater than 1, so demand is
elastic. In this example, a small decrease
in price caused a large increase in the
quantity demanded.
100%
25%
= 4.0

Pri
ce
Quantity
$7
$6
$5
$4
$3
$2
$1
Inelastic Demand
0 5 10 15 20 25 30
Demand
If demand is inelastic, consumers are not very
responsive to changes in price. A decrease in
price will lead to only a small change in quantity
demanded, or perhaps no change at all. Follow
this demand curve from left to right as the price
decreases sharply from $6 to $2.
Inelastic Demand
The price decreases from $6 to $2, a decrease
of about 67 percent.
$6 – $2
$6
x 100 = 67
The quantity demanded increases from 10
to 15, an increase of 50 percent.
10 – 15
10
x 100 = 50
Elasticity of demand is about 0.75. The
elasticity is less than 1, so demand for this
good is inelastic. The increase in quantity
demanded is small compared to the
decrease in price.
50%
67%
= 0.75
Unitary Elasticity: • the percentage change in quantity demanded is
exactly equal to the percentage change in the
price.

Factors Affecting Elasticity:
1. Availability of Substitutes

Factors Affecting Elasticity:
2. Relative Importance
(how much of your budget you spend on the
good.)

Factors Affecting Elasticity:
3. Necessities versus Luxuries

Factors Affecting Elasticity:
4. Change over Time
(people can eventually find substitutes.)
•The elasticity of demand determines how
a change in prices will affect a firm’s total
revenue or income.
Elasticity and Revenue
• A company’s total revenue is the total
amount of money the company receives
from selling its goods or services.

CH 4 Review Questions 1. Give an example of how a consumer’s expectation that price will go
down in the future can affect his or her desire to buy something today.
Does this always have the same effect on present buying patterns?
2. How does the budget percentage that a person spends on a certain
good affect the elasticity of demand for that good? Give a specific
example.
3. How can a change in population cause a change in the type of
clothing that is in demand?
4. What is the difference between a change in quantity demanded and a
shift in the demand curve?
5. Give an example of a good or service that may change in elasticity
over time rather than immediately, and discuss why this happens.
6. What role can advertising play in a shift in demand? Give a specific
example.