CHAPTER 4 CONCEPTUAL AND STOCHASTIC MODELING RESULTS...
52
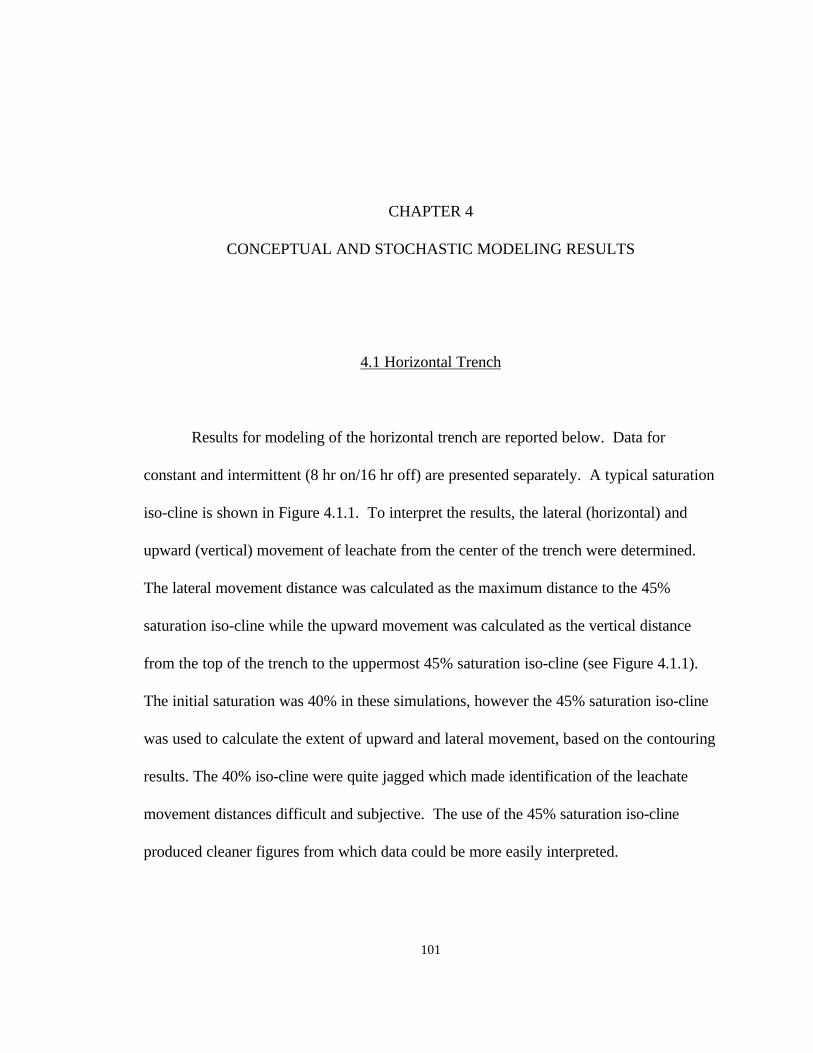
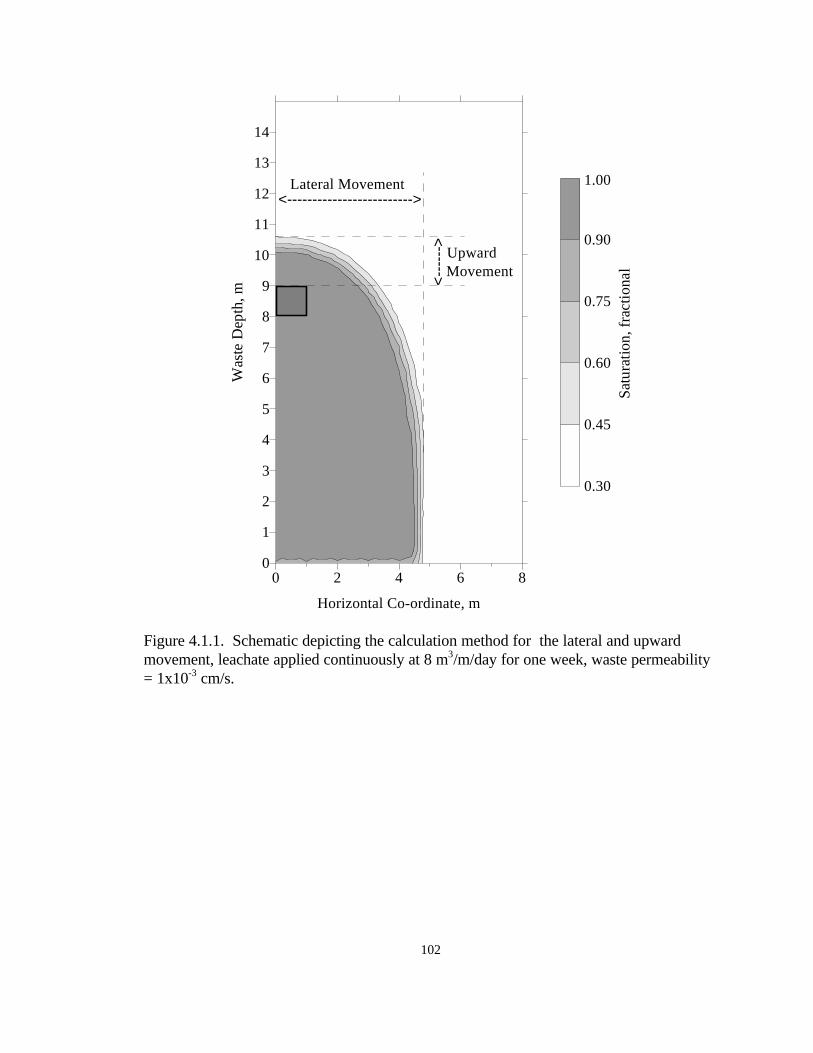
101 CHAPTER 4 CONCEPTUAL AND STOCHASTIC MODELING RESULTS 4.1 Horizontal Trench Results for modeling of the horizontal trench are reported below. Data for constant and intermittent (8 hr on/16 hr off) are presented separately. A typical saturation iso-cline is shown in Figure 4.1.1. To interpret the results, the lateral (horizontal) and upward (vertical) movement of leachate from the center of the trench were determined. The lateral movement distance was calculated as the maximum distance to the 45% saturation iso-cline while the upward movement was calculated as the vertical distance from the top of the trench to the uppermost 45% saturation iso-cline (see Figure 4.1.1). The initial saturation was 40% in these simulations, however the 45% saturation iso-cline was used to calculate the extent of upward and lateral movement, based on the contouring results. The 40% iso-cline were quite jagged which made identification of the leachate movement distances difficult and subjective. The use of the 45% saturation iso-cline produced cleaner figures from which data could be more easily interpreted.
Transcript of CHAPTER 4 CONCEPTUAL AND STOCHASTIC MODELING RESULTS...
101
CHAPTER 4
CONCEPTUAL AND STOCHASTIC MODELING RESULTS
4.1 Horizontal Trench
Results for modeling of the horizontal trench are reported below. Data for
constant and intermittent (8 hr on/16 hr off) are presented separately. A typical saturation
iso-cline is shown in Figure 4.1.1. To interpret the results, the lateral (horizontal) and
upward (vertical) movement of leachate from the center of the trench were determined.
The lateral movement distance was calculated as the maximum distance to the 45%
saturation iso-cline while the upward movement was calculated as the vertical distance
from the top of the trench to the uppermost 45% saturation iso-cline (see Figure 4.1.1).
The initial saturation was 40% in these simulations, however the 45% saturation iso-cline
was used to calculate the extent of upward and lateral movement, based on the contouring
results. The 40% iso-cline were quite jagged which made identification of the leachate
movement distances difficult and subjective. The use of the 45% saturation iso-cline
produced cleaner figures from which data could be more easily interpreted.
102
0 2 4 6 8
Horizontal Co-ordinate, m
0
1
2
3
4
5
6
7
8
9
10
11
12
13
14
Was
te D
epth
, m
0.30
0.45
0.60
0.75
0.90
Lateral Movement
<---
---> Upward
Movement
<------------------------->1.00
Sat
urat
ion,
fra
ctio
nal
Figure 4.1.1. Schematic depicting the calculation method for the lateral and upwardmovement, leachate applied continuously at 8 m3/m/day for one week, waste permeability= 1x10⁻³ cm/s.
103
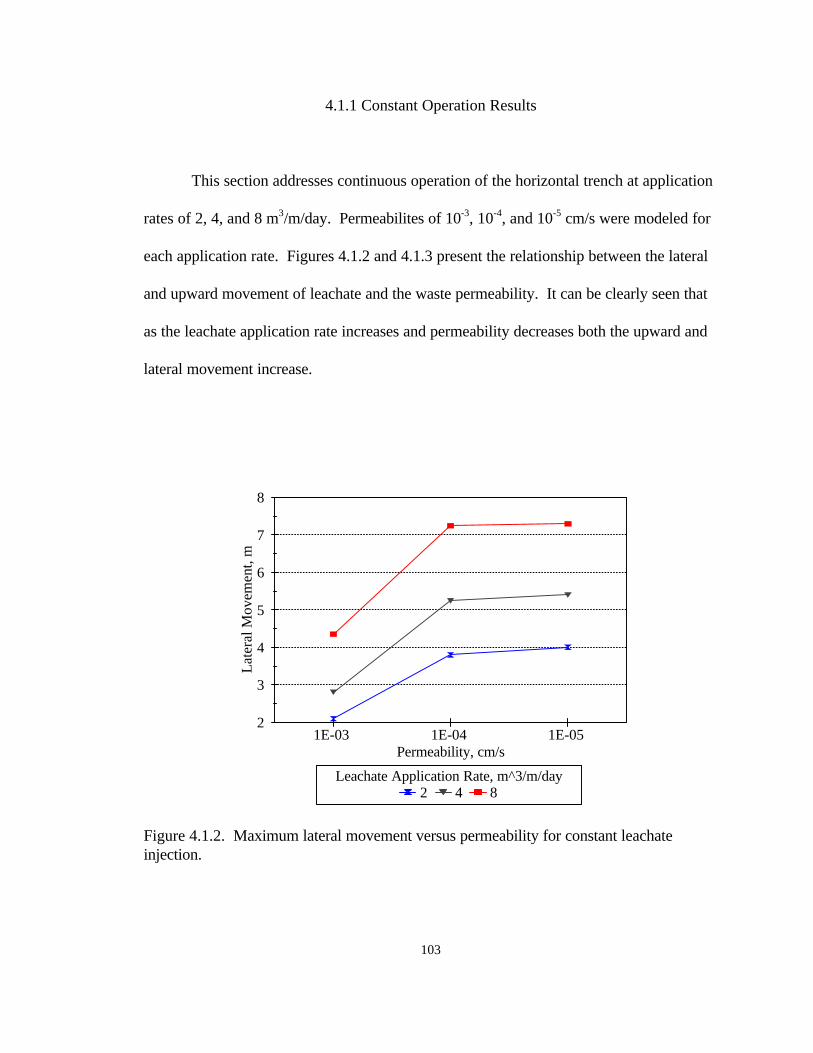
4.1.1 Constant Operation Results
This section addresses continuous operation of the horizontal trench at application
rates of 2, 4, and 8 m3/m/day. Permeabilites of 10-3, 10-4, and 10-5 cm/s were modeled for
each application rate. Figures 4.1.2 and 4.1.3 present the relationship between the lateral
and upward movement of leachate and the waste permeability. It can be clearly seen that
as the leachate application rate increases and permeability decreases both the upward and
lateral movement increase.
2
3
4
5
6
7
8
Lat
eral
Mov
emen
t, m
1E-03 1E-04 1E-05 Permeability, cm/s
2 4 8 Leachate Application Rate, m^3/m/day
Figure 4.1.2. Maximum lateral movement versus permeability for constant leachateinjection.
104
0
1
2
3
4
5
6
Ver
tical
Mov
emen
t, m
1E-03 1E-04 1E-05 Permeability, cm/s
2 4 8 Leachate Application Rate, m^3/m/day
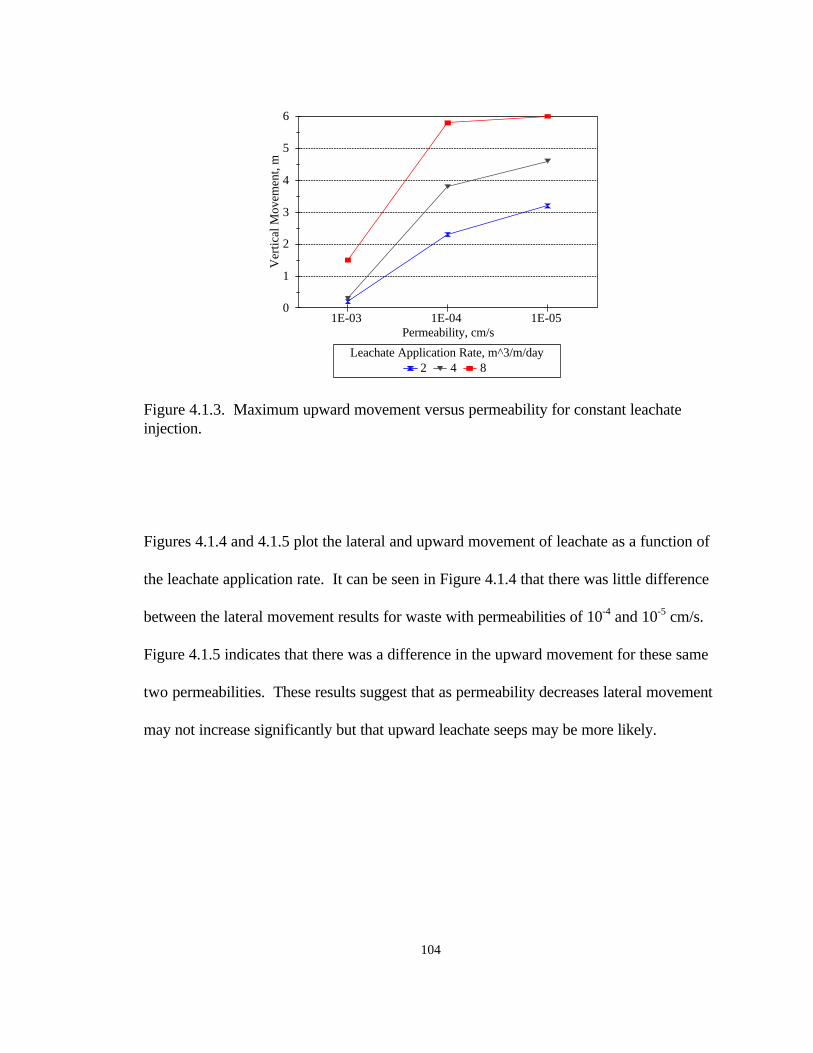
Figure 4.1.3. Maximum upward movement versus permeability for constant leachateinjection.
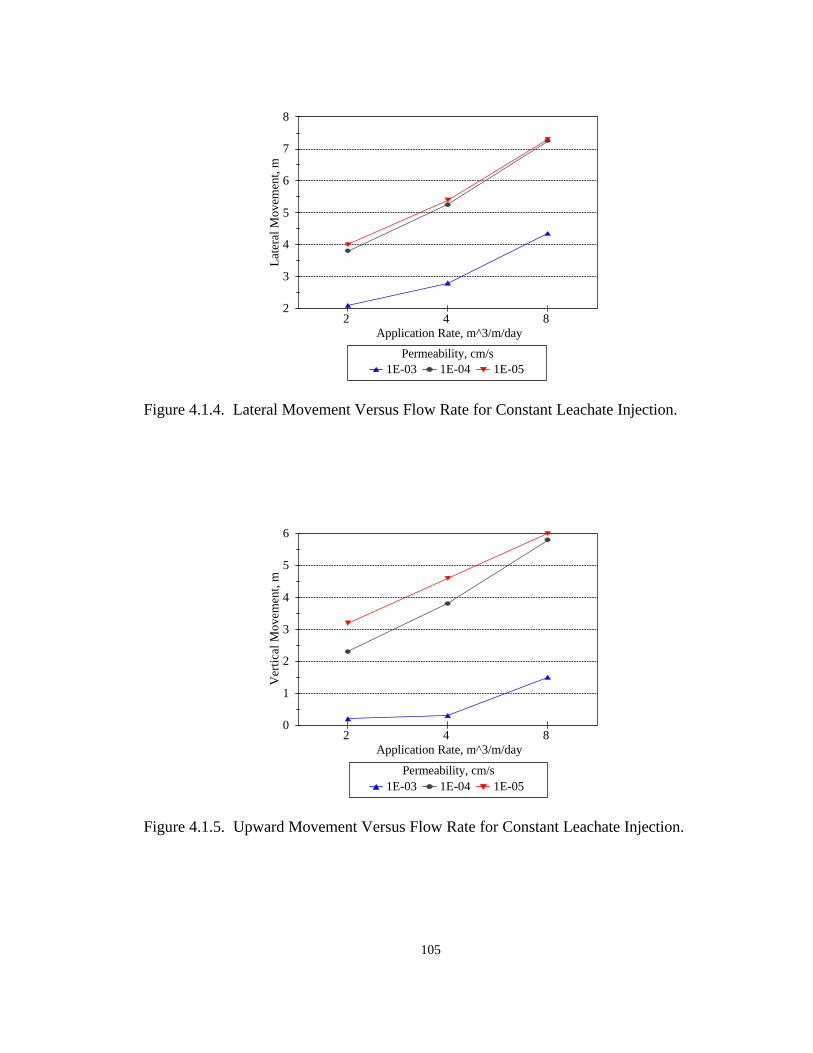
Figures 4.1.4 and 4.1.5 plot the lateral and upward movement of leachate as a function of
the leachate application rate. It can be seen in Figure 4.1.4 that there was little difference
between the lateral movement results for waste with permeabilities of 10-4 and 10-5 cm/s.
Figure 4.1.5 indicates that there was a difference in the upward movement for these same
two permeabilities. These results suggest that as permeability decreases lateral movement
may not increase significantly but that upward leachate seeps may be more likely.
105
2
3
4
5
6
7
8
Lat
eral
Mov
emen
t, m
2 4 8 Application Rate, m^3/m/day
1E-03 1E-04 1E-05 Permeability, cm/s
Figure 4.1.4. Lateral Movement Versus Flow Rate for Constant Leachate Injection.
0
1
2
3
4
5
6
Ver
tical
Mov
emen
t, m
2 4 8 Application Rate, m^3/m/day
1E-03 1E-04 1E-05 Permeability, cm/s
Figure 4.1.5. Upward Movement Versus Flow Rate for Constant Leachate Injection.
106
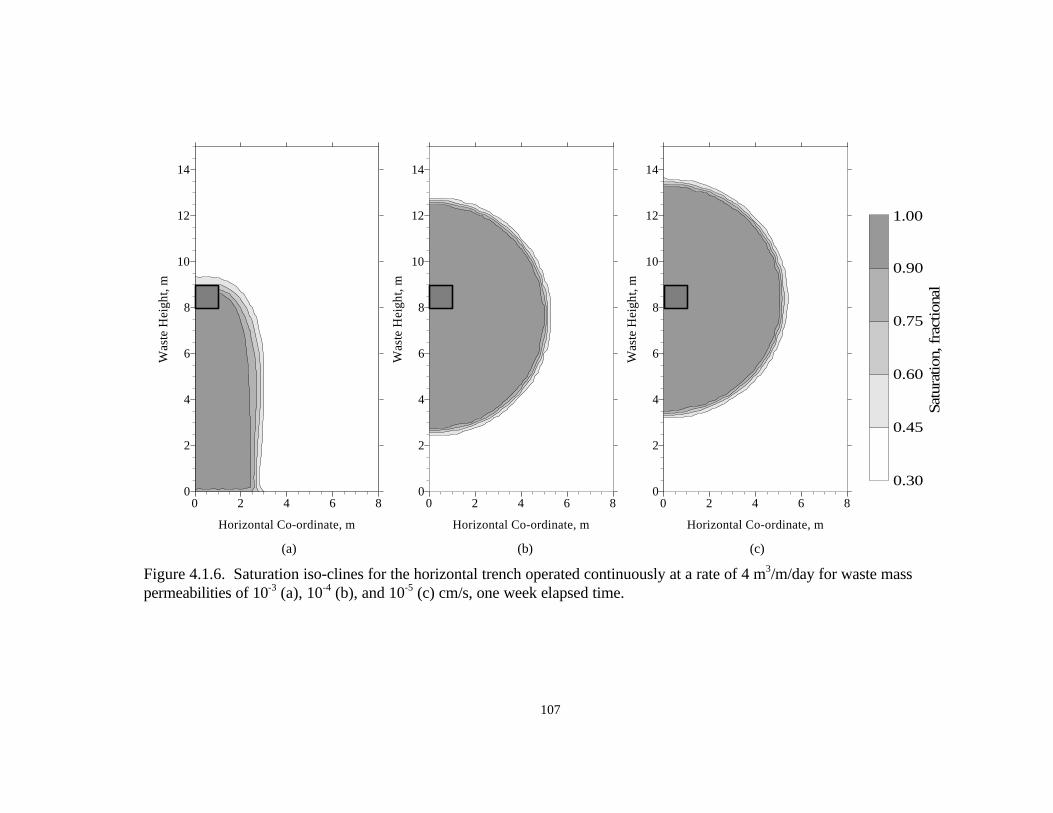
Figure 4.1.6 depicts the saturation iso-clines generated for constant leachate
application at a rate of 4 m3/m/day, to waste masses with permeabilities of 10-3, 10-4, and
10-5 cm/s. This figure clearly illustrates the upward and outward propagation of a
saturated zone for the 10-4 and 10-5 cm/s waste masses, Figures 4.1.6b and c respectively..
There is very little difference between Figures 4.1.6b and c except for a slightly greater
downward movement of leachate in Figure 4.1.6b. Saturated conditions also developed in
the 10-3 cm/s waste mass simulation but the saturated zone did not propagate above the
recirculation trench.
107
0 2 4 6 8
Horizontal Co-ordinate, m
0
2
4
6
8
10
12
14W
aste
Hei
ght,
m
0 2 4 6 8
Horizontal Co-ordinate, m
0
2
4
6
8
10
12
14
Was
te H
eigh
t, m
0 2 4 6 8
Horizontal Co-ordinate, m
0
2
4
6
8
10
12
14
Was
te H
eigh
t, m
0.30
0.45
0.60
0.75
0.90
1.00
Satu
ratio
n, f
ract
iona
l
(a) (b) (c)
Figure 4.1.6. Saturation iso-clines for the horizontal trench operated continuously at a rate of 4 m3/m/day for waste masspermeabilities of 10-3 (a), 10-4 (b), and 10-5 (c) cm/s, one week elapsed time.
108
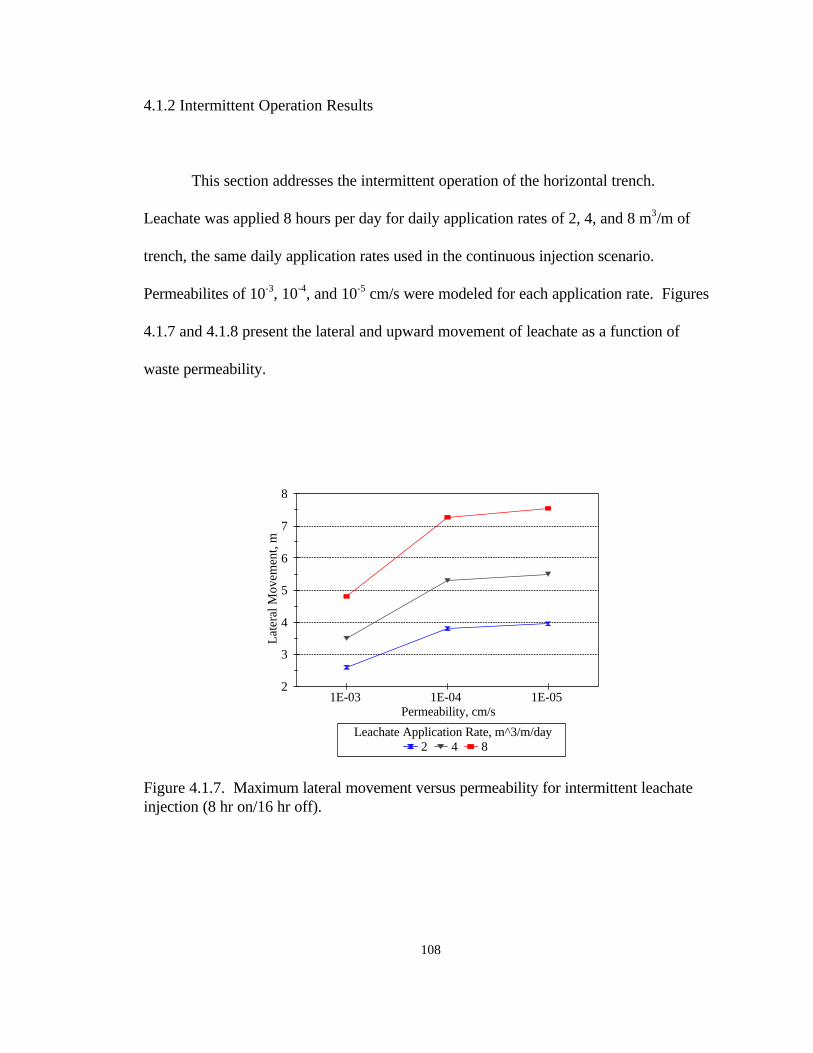
4.1.2 Intermittent Operation Results
This section addresses the intermittent operation of the horizontal trench.
Leachate was applied 8 hours per day for daily application rates of 2, 4, and 8 m3/m of
trench, the same daily application rates used in the continuous injection scenario.
Permeabilites of 10-3, 10-4, and 10-5 cm/s were modeled for each application rate. Figures
4.1.7 and 4.1.8 present the lateral and upward movement of leachate as a function of
waste permeability.
2
3
4
5
6
7
8
Lat
eral
Mov
emen
t, m
1E-03 1E-04 1E-05 Permeability, cm/s
2 4 8 Leachate Application Rate, m^3/m/day
Figure 4.1.7. Maximum lateral movement versus permeability for intermittent leachateinjection (8 hr on/16 hr off).
109
0
1
2
3
4
5
6
Ver
tical
Mov
emen
t, m
1E-03 1E-04 1E-05 Permeability, cm/s
2 4 8 Leachate Application Rate, m^3/m/day
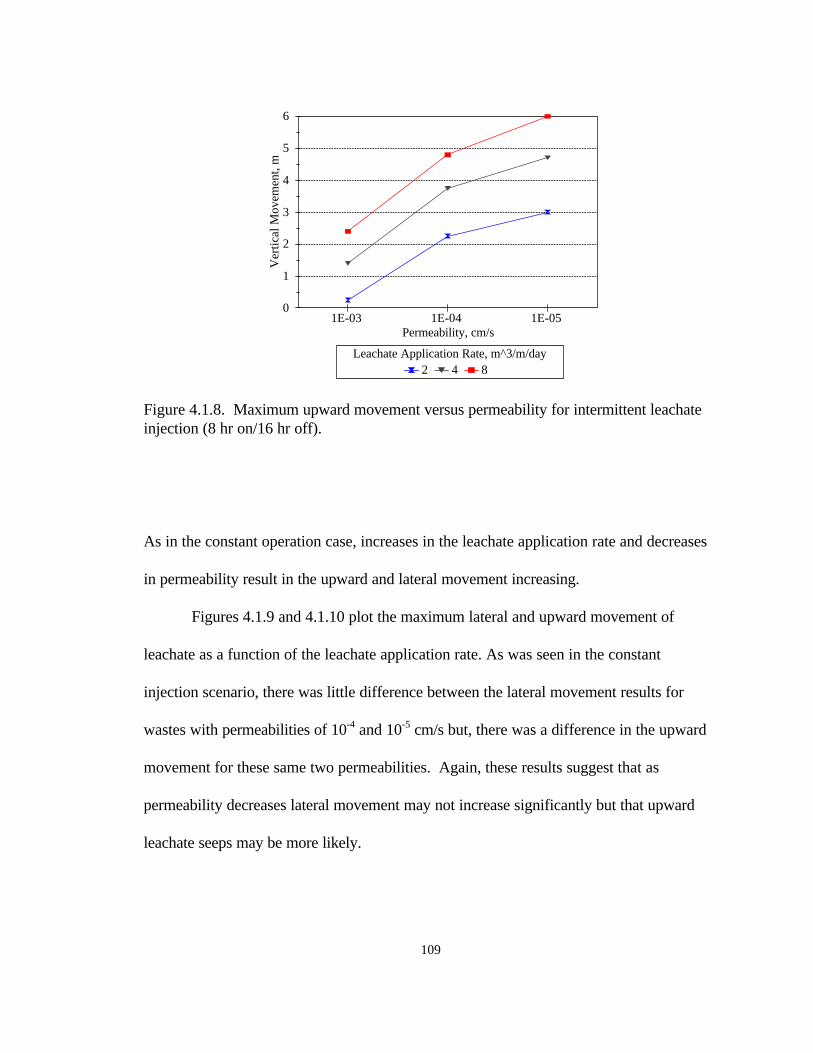
Figure 4.1.8. Maximum upward movement versus permeability for intermittent leachateinjection (8 hr on/16 hr off).
As in the constant operation case, increases in the leachate application rate and decreases
in permeability result in the upward and lateral movement increasing.
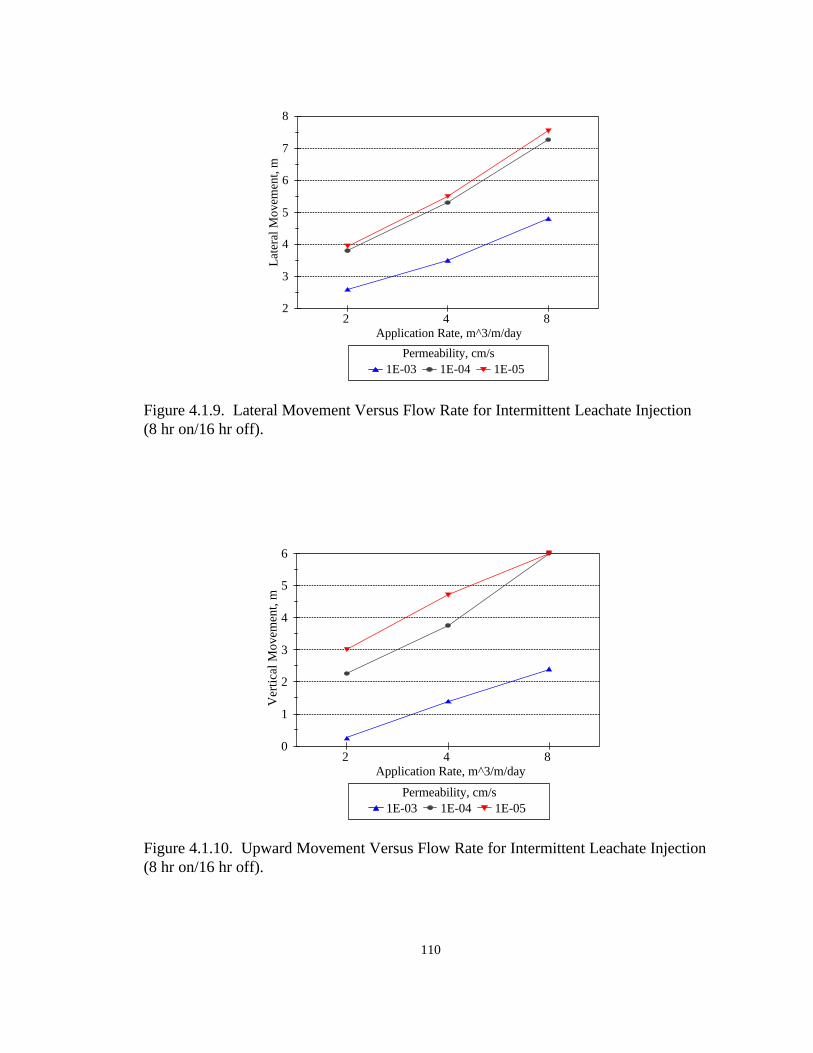
Figures 4.1.9 and 4.1.10 plot the maximum lateral and upward movement of
leachate as a function of the leachate application rate. As was seen in the constant
injection scenario, there was little difference between the lateral movement results for
wastes with permeabilities of 10-4 and 10-5 cm/s but, there was a difference in the upward
movement for these same two permeabilities. Again, these results suggest that as
permeability decreases lateral movement may not increase significantly but that upward
leachate seeps may be more likely.
110
2
3
4
5
6
7
8
Lat
eral
Mov
emen
t, m
2 4 8 Application Rate, m^3/m/day
1E-03 1E-04 1E-05 Permeability, cm/s
Figure 4.1.9. Lateral Movement Versus Flow Rate for Intermittent Leachate Injection(8 hr on/16 hr off).
0
1
2
3
4
5
6
Ver
tical
Mov
emen
t, m
2 4 8 Application Rate, m^3/m/day
1E-03 1E-04 1E-05 Permeability, cm/s
Figure 4.1.10. Upward Movement Versus Flow Rate for Intermittent Leachate Injection(8 hr on/16 hr off).
111
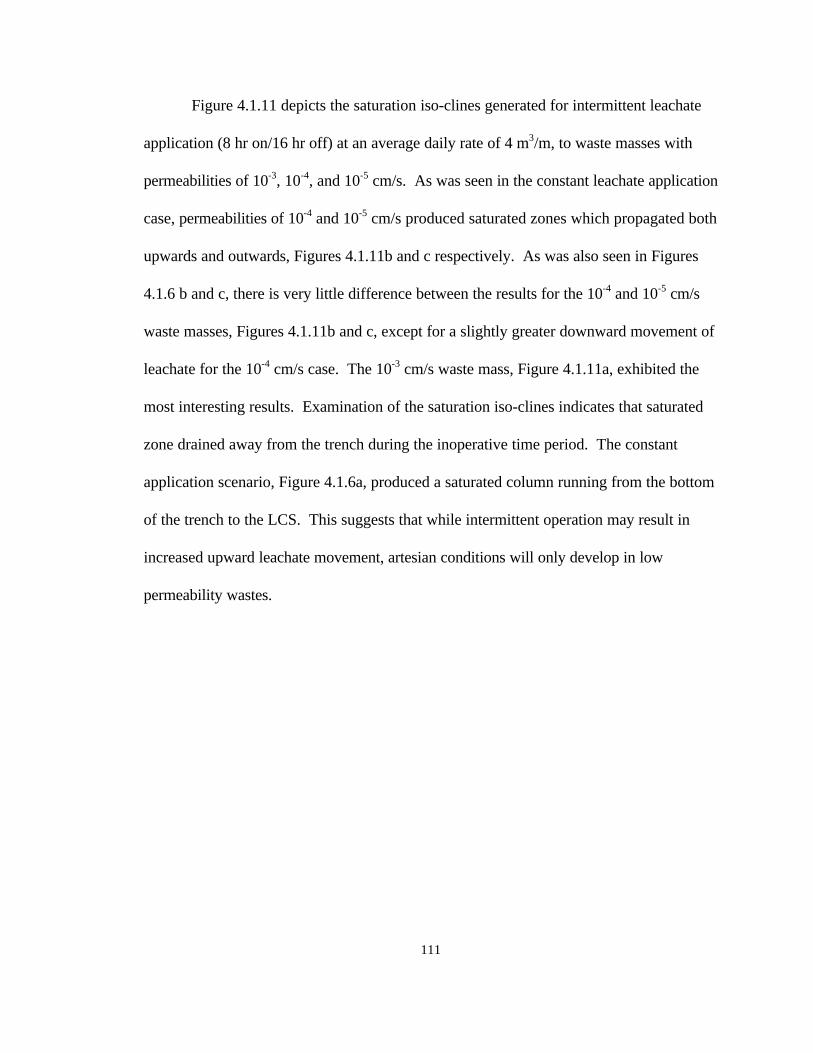
Figure 4.1.11 depicts the saturation iso-clines generated for intermittent leachate
application (8 hr on/16 hr off) at an average daily rate of 4 m3/m, to waste masses with
permeabilities of 10-3, 10-4, and 10-5 cm/s. As was seen in the constant leachate application
case, permeabilities of 10-4 and 10-5 cm/s produced saturated zones which propagated both
upwards and outwards, Figures 4.1.11b and c respectively. As was also seen in Figures
4.1.6 b and c, there is very little difference between the results for the 10-4 and 10-5 cm/s
waste masses, Figures 4.1.11b and c, except for a slightly greater downward movement of
leachate for the 10-4 cm/s case. The 10-3 cm/s waste mass, Figure 4.1.11a, exhibited the
most interesting results. Examination of the saturation iso-clines indicates that saturated
zone drained away from the trench during the inoperative time period. The constant
application scenario, Figure 4.1.6a, produced a saturated column running from the bottom
of the trench to the LCS. This suggests that while intermittent operation may result in
increased upward leachate movement, artesian conditions will only develop in low
permeability wastes.
112
0 2 4 6 8
Horizontal Co-ordinate, m
0
2
4
6
8
10
12
14W
aste
Hei
ght,
m
0 2 4 6 8
Horizontal Co-ordinate, m
0
2
4
6
8
10
12
14
Was
te H
eigh
t, m
0 2 4 6 8
Horizontal Co-ordinate, m
0
2
4
6
8
10
12
14
Was
te H
eigh
t, m
0.30
0.45
0.60
0.75
0.90
1.00
Satu
ratio
n, f
ract
iona
l
(a) (b) (c)
Figure 4.1.11. Saturation iso-clines for the horizontal trench operated intermittently ( 8 hr on /16 hr off) at an average rate of 4m3/m/day for waste mass permeabilities of 10-3 (a), 10-4 (b), and 10-5 (c) cm/s, one week elapsed time.
113
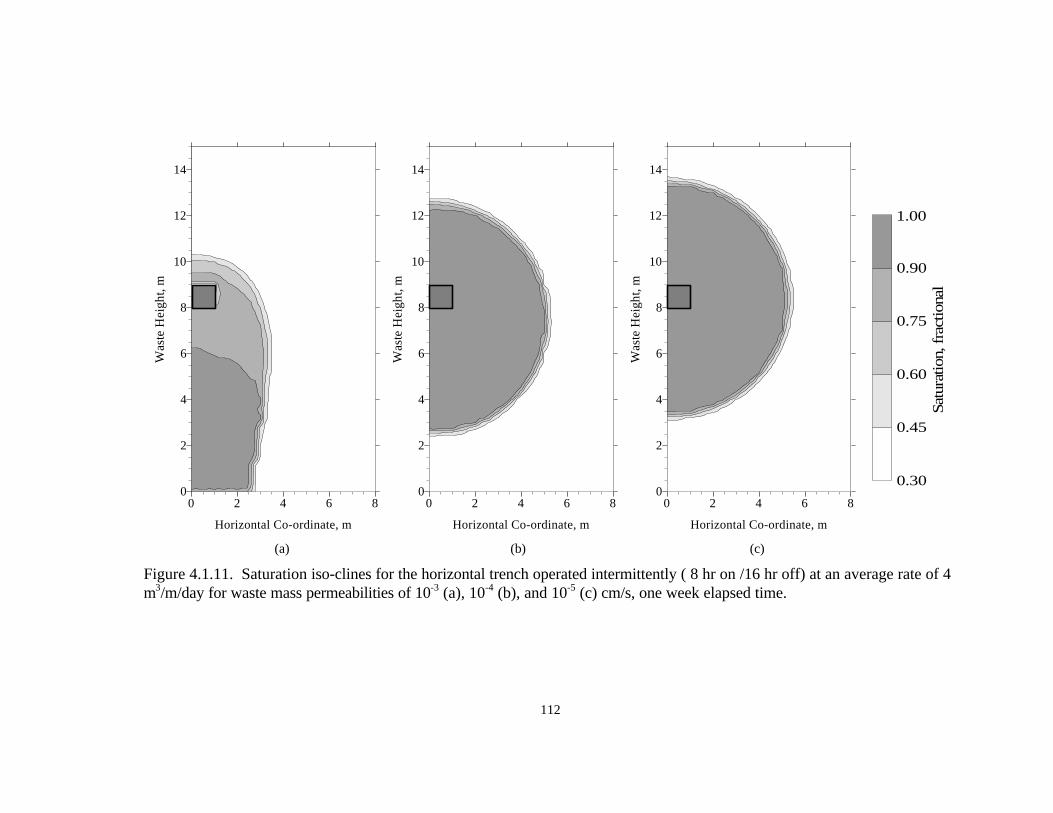
4.1.3 Discussion
Tables 4.1.1 presents the lateral movement results for constant and intermittent (8
hr on/16 hr off) leachate application. These data suggest that intermittent operation
increases the lateral movement slightly for a high permeability waste (10-3 cm/s) but has no
effect at lower permeabilities (10-4 and 10-5 cm/s). This behavior was most likely due to
the fact that at lower permeabilities, liquid is transmitted more readily in all directions
whereas at higher permeabilities, liquid movement is restricted and the greatest pressure
gradient will be in the vertical direction. In practice, leachate should be recirculated with
less frequency (one day per week) at higher rates which will result in increased lateral
movement.
Table 4.1.1. Maximum lateral movement for constant and intermittent leachateapplication via the horizontal trench.
Permeability,cm/s
Constant Application Intermittent Application(8 hr on/16 hr off).
Application Rate, m3/m/day Application Rate, m3/m/day2 4 8 2 4 8
10-3 2.1 2.8 4.35 2.6 3.5 4.8
10-4 3.8 5.25 7.25 3.8 5.3 7.27
10-5 4 5.4 7.3 3.95 5.5 7.55
114
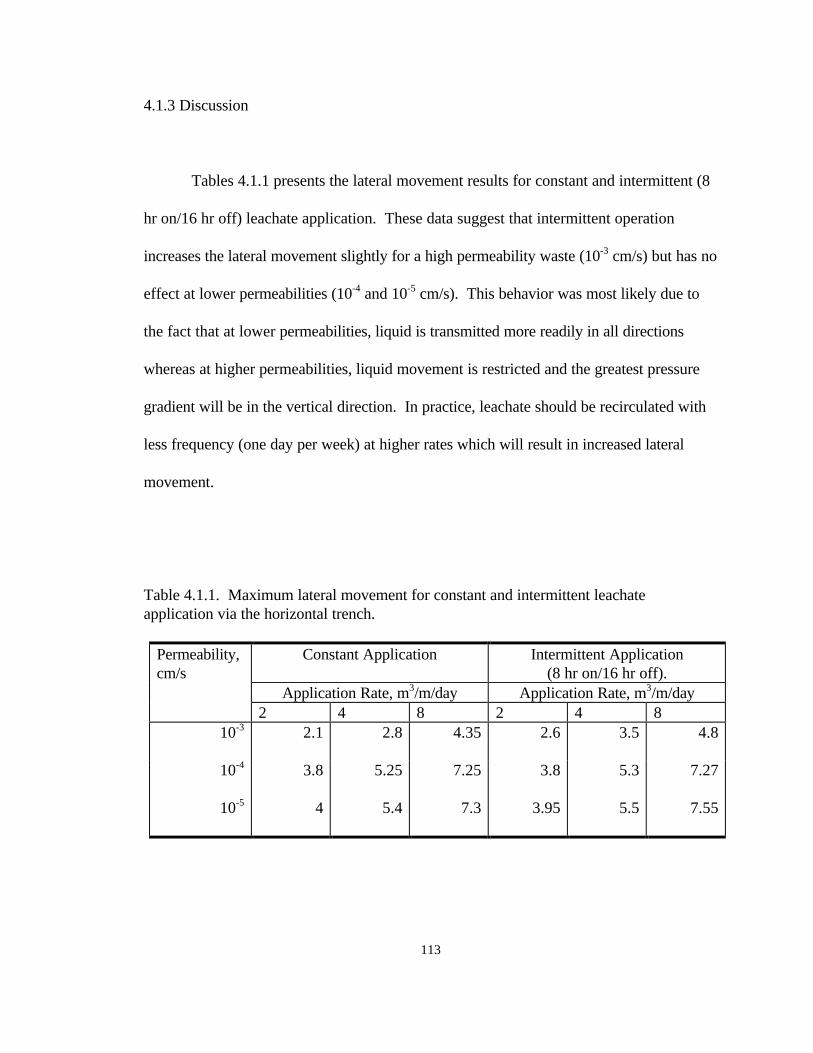
Table 4.1.2 presents the upward movement results for constant and intermittent (8
hr on/16 hr off) leachate application. Inspection of these data indicates that at a waste
permeability of 10-3 cm/s, intermittent operation results in an increase in the upward
movement of leachate as compared to constant injection. However, while there is a slight
increase in upward movement, the leachate drains away when leachate is not applied and
head does not build up.
Table 4.1.2. Maximum upward movement for constant and intermittent leachateapplication via the horizontal trench.
Permeability,cm/s
Constant Application Intermittent Application(8 hr on/16 hr off).
Application Rate, m3/m/day Application Rate, m3/m/day2 4 8 2 4 8
10-3 0.2 0.3 1.5 0.25 1.4 2.4
10-4 2.3 3.8 5.8 2.25 3.75 6
10-5 3.2 4.6 6 3 4.7 6
Figure 4.1.12a clearly shows that leachate is able to drain away from the trench
once application has stopped while Figure 4.1.12b shows a predominantly saturated
influence area indicating that leachate movement under gravity forces is slow and that
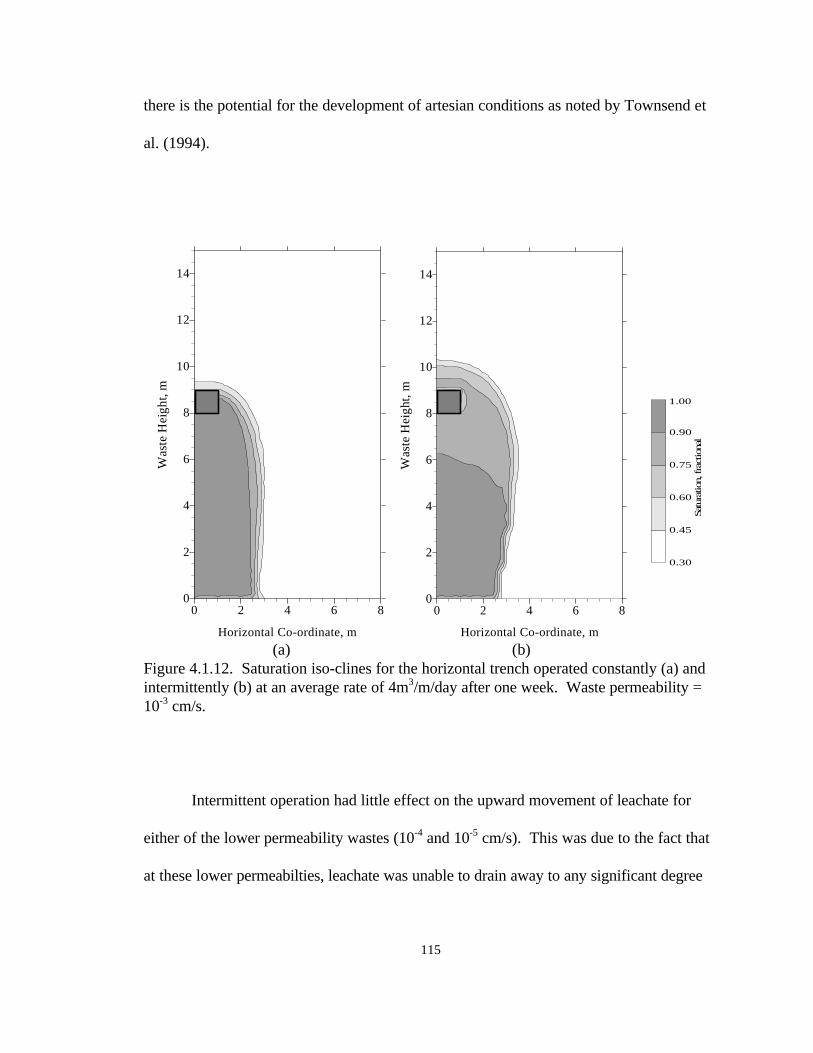
115
there is the potential for the development of artesian conditions as noted by Townsend et
al. (1994).
0 2 4 6 8
Horizontal Co-ordinate, m
0
2
4
6
8
10
12
14
Was
te H
eigh
t, m
0 2 4 6 8
Horizontal Co-ordinate, m
0
2
4
6
8
10
12
14
Was
te H
eigh
t, m
0.30
0.45
0.60
0.75
0.90
1.00
Satu
ratio
n, fra
ctio
nal
(a) (b)Figure 4.1.12. Saturation iso-clines for the horizontal trench operated constantly (a) andintermittently (b) at an average rate of 4m3/m/day after one week. Waste permeability =10-3 cm/s.
Intermittent operation had little effect on the upward movement of leachate for
either of the lower permeability wastes (10-4 and 10-5 cm/s). This was due to the fact that
at these lower permeabilties, leachate was unable to drain away to any significant degree
116
during the inoperative periods. In lower permeability wastes, it may be necessary to limit
the rate at which leachate is applied in order to prevent surface seep problems. However,
lowering the rate at which leachate is applied will also decrease the lateral area impacted.
The saturation profiles shown also suggest that the ability to pump leachate at high
rates will be limited not only by pump size but, also by the proximity of the trench to the
landfill surface and side slopes. Overpumping may result in leachate seeps at the sides of
the landfill or upward movement of leachate and possibly artesian conditions at the landfill
surface. Either of these conditions will result in operational problems and, potentially,
regulatory violations. Therefore, conservative pumping of trenches near the vertical and
horizontal boundaries of the landfill would be prudent.
4.2 Vertical Well
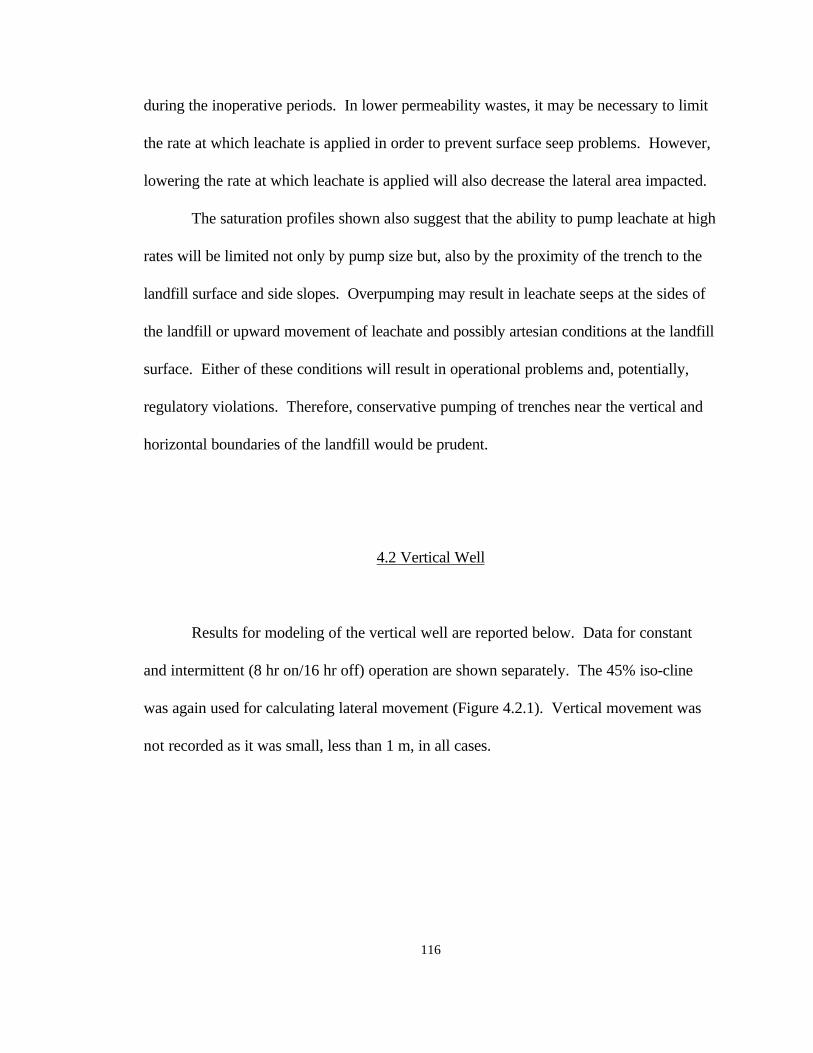
Results for modeling of the vertical well are reported below. Data for constant
and intermittent (8 hr on/16 hr off) operation are shown separately. The 45% iso-cline
was again used for calculating lateral movement (Figure 4.2.1). Vertical movement was
not recorded as it was small, less than 1 m, in all cases.
117
0 2 4 6 8
Horizontal Co-ordinate, m
0
2
4
6
8
10
12
14
Was
te H
eigh
t, m
Lateral<-------------->
1.00
Sat
urat
ion,
fra
ctio
nal
0.30
0.45
0.60
0.75
0.90
Movement
Figure 4.2.1. Calculation of lateral movement, leachate applied intermittently (8 hr on/16hr off) at 10 m3/m/day for three weeks, waste permeability = 1x10⁻³ cm/s.
4.2.1 Constant Operation
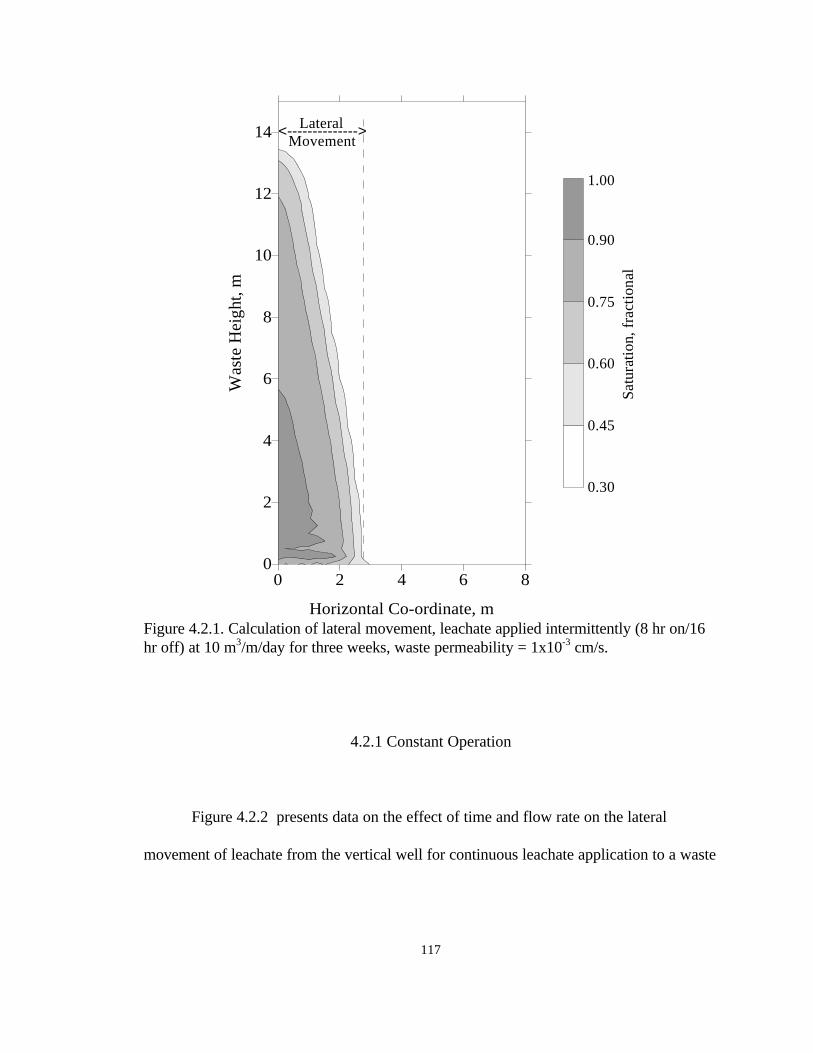
Figure 4.2.2 presents data on the effect of time and flow rate on the lateral
movement of leachate from the vertical well for continuous leachate application to a waste
118
with a permeability of 10-3 cm/s. Inspection of this figure shows that there is only a slight
increase in leachate movement after three weeks of operation.
1
2
3
4
5
6 La
tera
l Mov
emen
t, m
0 10 20 30 40 50 60 Application Rate, m^3/day
1 2 3 4Elapsed Time, weeks
Figure 4.2.2. Lateral movement versus flow rate for one to four weeks of constantleachate application to a waste mass with a permeability of 10-3 cm/s.
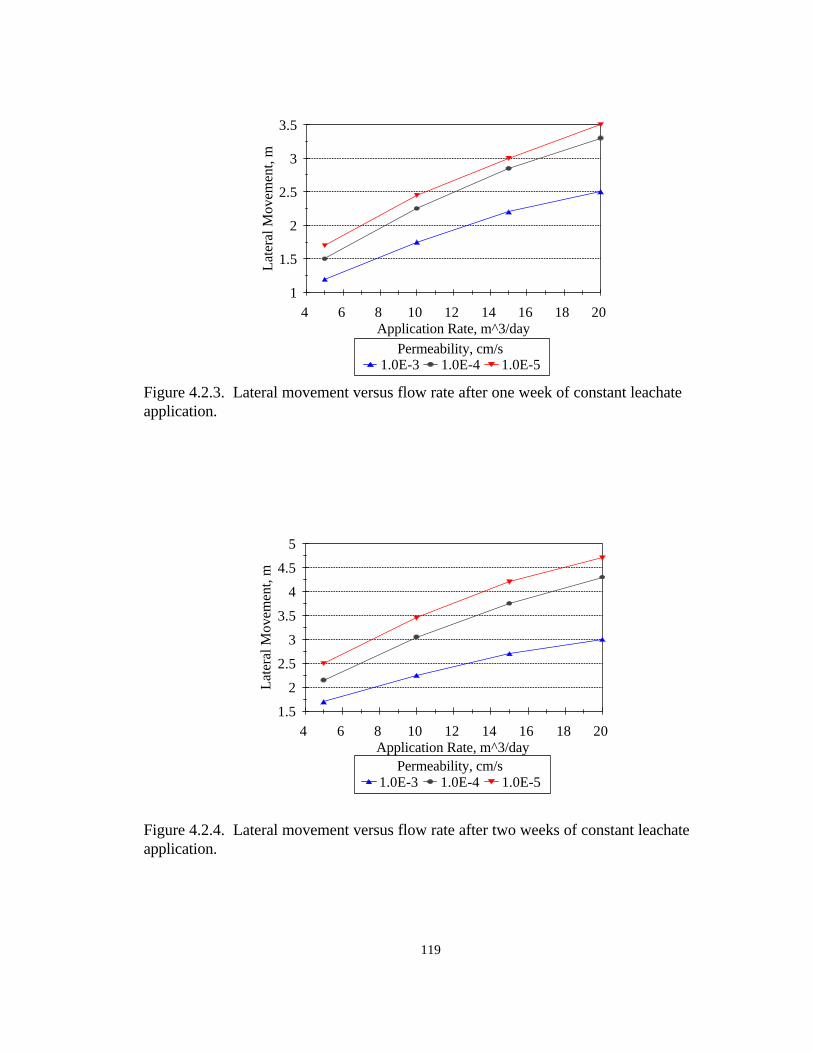
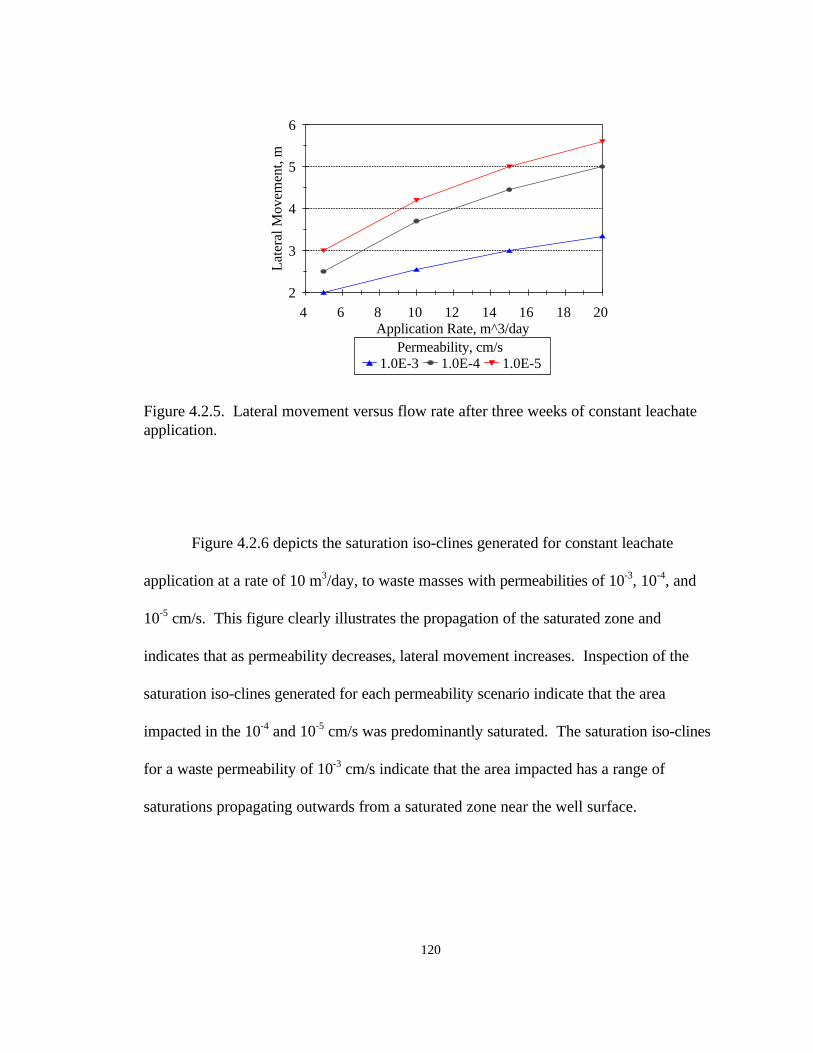
Figures 4.2.3 through 4.2.5 plot the lateral movement of leachate versus the
leachate application rate and the waste permeability for elapsed times of one, two, and
three weeks. As would be expected from the trench results previously discussed, lateral
movement increased with decreasing permeability and increasing application rates.
119
1
1.5
2
2.5
3
3.5
Lat
eral
Mov
emen
t, m
4 6 8 10 12 14 16 18 20 Application Rate, m^3/day
1.0E-3 1.0E-4 1.0E-5Permeability, cm/s
Figure 4.2.3. Lateral movement versus flow rate after one week of constant leachateapplication.
1.5
2
2.5
3
3.5
4
4.5
5
Lat
eral
Mov
emen
t, m
4 6 8 10 12 14 16 18 20 Application Rate, m^3/day
1.0E-3 1.0E-4 1.0E-5Permeability, cm/s
Figure 4.2.4. Lateral movement versus flow rate after two weeks of constant leachateapplication.
120
2
3
4
5
6
Lat
eral
Mov
emen
t, m
4 6 8 10 12 14 16 18 20 Application Rate, m^3/day
1.0E-3 1.0E-4 1.0E-5Permeability, cm/s
Figure 4.2.5. Lateral movement versus flow rate after three weeks of constant leachateapplication.
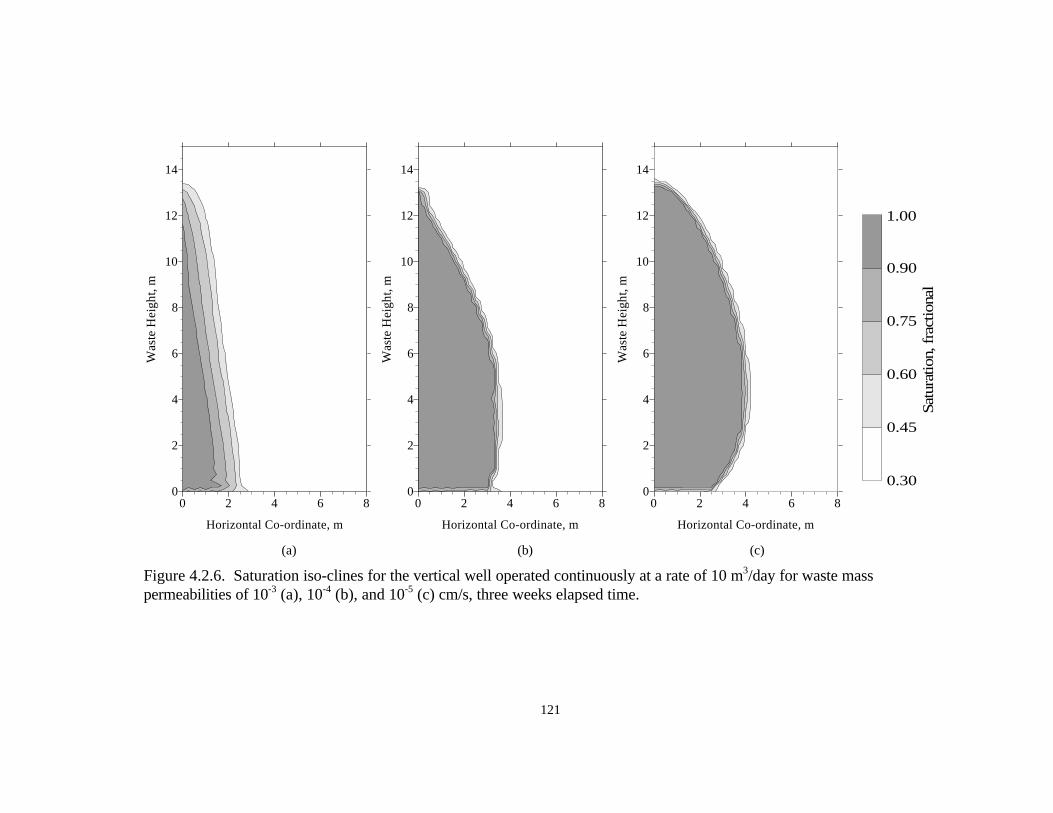
Figure 4.2.6 depicts the saturation iso-clines generated for constant leachate
application at a rate of 10 m3/day, to waste masses with permeabilities of 10-3, 10-4, and
10-5 cm/s. This figure clearly illustrates the propagation of the saturated zone and
indicates that as permeability decreases, lateral movement increases. Inspection of the
saturation iso-clines generated for each permeability scenario indicate that the area
impacted in the 10-4 and 10-5 cm/s was predominantly saturated. The saturation iso-clines
for a waste permeability of 10-3 cm/s indicate that the area impacted has a range of
saturations propagating outwards from a saturated zone near the well surface.
121
0 2 4 6 8
Horizontal Co-ordinate, m
0
2
4
6
8
10
12
14
Was
te H
eigh
t, m
0 2 4 6 8
Horizontal Co-ordinate, m
0
2
4
6
8
10
12
14
Was
te H
eigh
t, m
0 2 4 6 8
Horizontal Co-ordinate, m
0
2
4
6
8
10
12
14
Was
te H
eigh
t, m
0.30
0.45
0.60
0.75
0.90
1.00
Satu
ratio
n, f
ract
iona
l
(a) (b) (c)
Figure 4.2.6. Saturation iso-clines for the vertical well operated continuously at a rate of 10 m3/day for waste masspermeabilities of 10-3 (a), 10-4 (b), and 10-5 (c) cm/s, three weeks elapsed time.
122
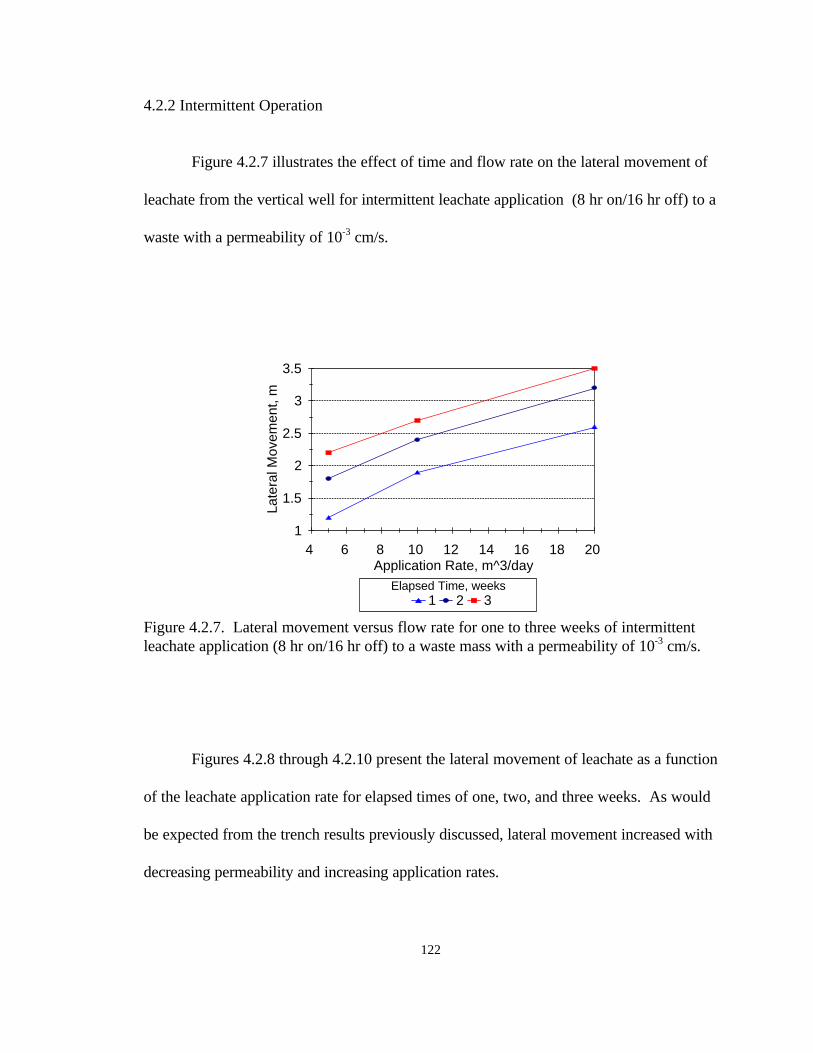
4.2.2 Intermittent Operation
Figure 4.2.7 illustrates the effect of time and flow rate on the lateral movement of
leachate from the vertical well for intermittent leachate application (8 hr on/16 hr off) to a
waste with a permeability of 10-3 cm/s.
1
1.5
2
2.5
3
3.5
Late
ral M
ovem
ent,
m
4 6 8 10 12 14 16 18 20 Application Rate, m^3/day
1 2 3Elapsed Time, weeks
Figure 4.2.7. Lateral movement versus flow rate for one to three weeks of intermittentleachate application (8 hr on/16 hr off) to a waste mass with a permeability of 10-3 cm/s.
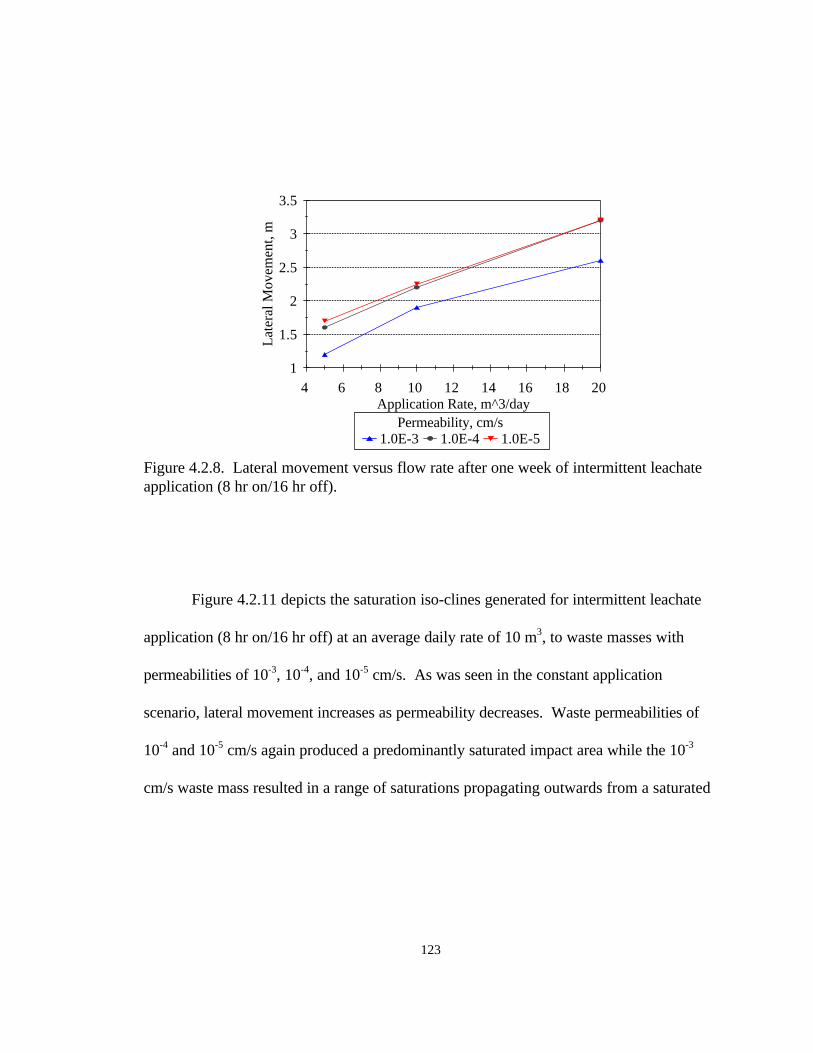
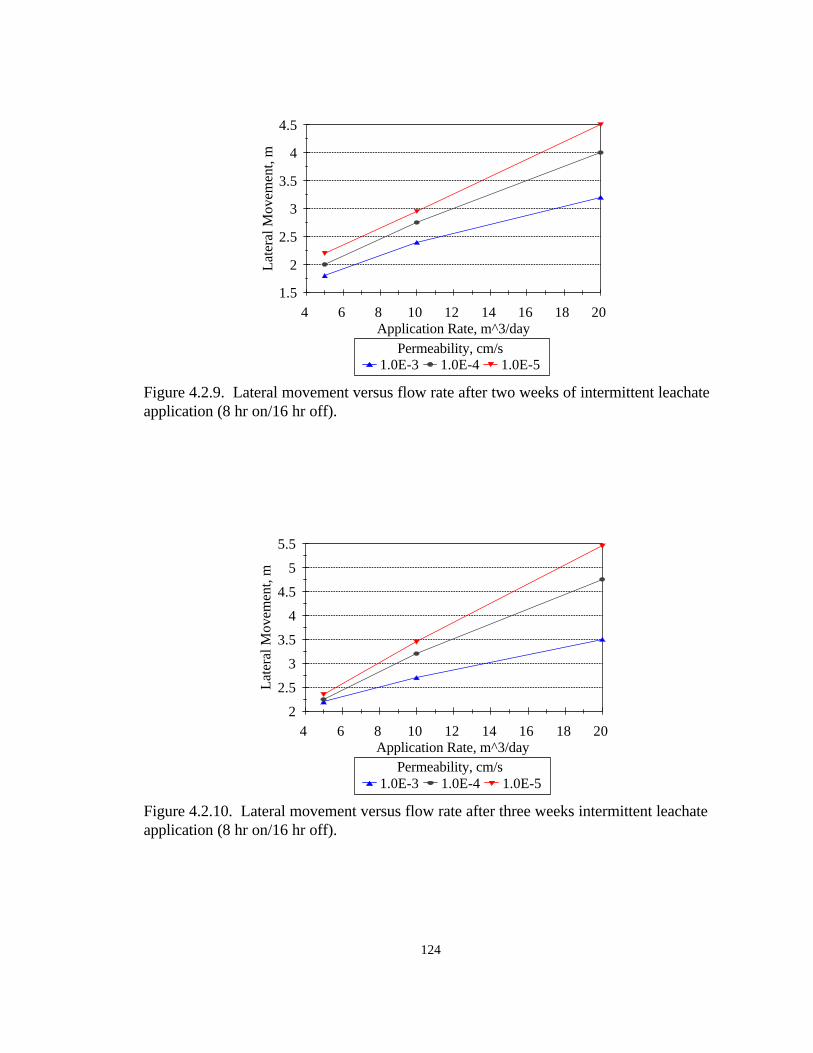
Figures 4.2.8 through 4.2.10 present the lateral movement of leachate as a function
of the leachate application rate for elapsed times of one, two, and three weeks. As would
be expected from the trench results previously discussed, lateral movement increased with
decreasing permeability and increasing application rates.
123
1
1.5
2
2.5
3
3.5
Lat
eral
Mov
emen
t, m
4 6 8 10 12 14 16 18 20 Application Rate, m^3/day
1.0E-3 1.0E-4 1.0E-5Permeability, cm/s
Figure 4.2.8. Lateral movement versus flow rate after one week of intermittent leachateapplication (8 hr on/16 hr off).
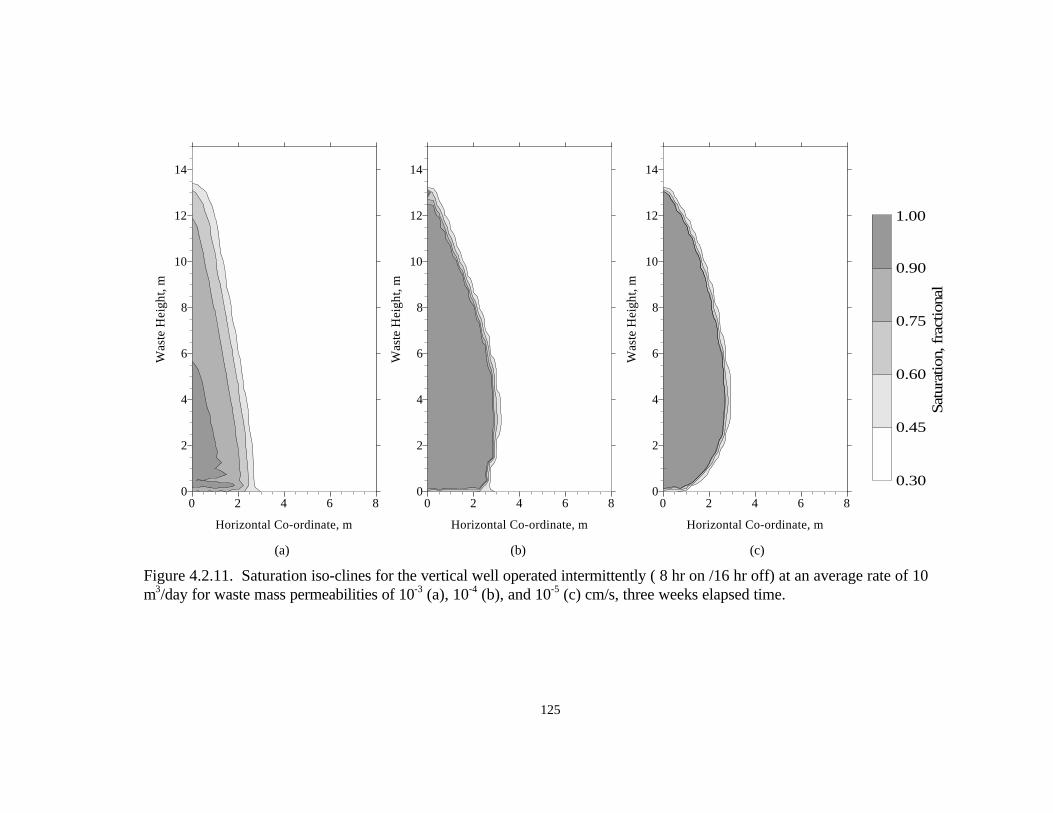
Figure 4.2.11 depicts the saturation iso-clines generated for intermittent leachate
application (8 hr on/16 hr off) at an average daily rate of 10 m3, to waste masses with
permeabilities of 10-3, 10-4, and 10-5 cm/s. As was seen in the constant application
scenario, lateral movement increases as permeability decreases. Waste permeabilities of
10-4 and 10-5 cm/s again produced a predominantly saturated impact area while the 10-3
cm/s waste mass resulted in a range of saturations propagating outwards from a saturated
124
1.5
2
2.5
3
3.5
4
4.5
Lat
eral
Mov
emen
t, m
4 6 8 10 12 14 16 18 20 Application Rate, m^3/day
1.0E-3 1.0E-4 1.0E-5Permeability, cm/s
Figure 4.2.9. Lateral movement versus flow rate after two weeks of intermittent leachateapplication (8 hr on/16 hr off).
2
2.5
3
3.5
4
4.5
5
5.5
Lat
eral
Mov
emen
t, m
4 6 8 10 12 14 16 18 20 Application Rate, m^3/day
1.0E-3 1.0E-4 1.0E-5Permeability, cm/s
Figure 4.2.10. Lateral movement versus flow rate after three weeks intermittent leachateapplication (8 hr on/16 hr off).
125
0 2 4 6 8
Horizontal Co-ordinate, m
0
2
4
6
8
10
12
14W
aste
Hei
ght,
m
0 2 4 6 8
Horizontal Co-ordinate, m
0
2
4
6
8
10
12
14
Was
te H
eigh
t, m
0 2 4 6 8
Horizontal Co-ordinate, m
0
2
4
6
8
10
12
14
Was
te H
eigh
t, m
0.30
0.45
0.60
0.75
0.90
1.00
Satu
ratio
n, f
ract
iona
l
(a) (b) (c)
Figure 4.2.11. Saturation iso-clines for the vertical well operated intermittently ( 8 hr on /16 hr off) at an average rate of 10m3/day for waste mass permeabilities of 10-3 (a), 10-4 (b), and 10-5 (c) cm/s, three weeks elapsed time.
126
zone near the well surface. Inspection of Figure 4.2.1a also indicates that intermittent
operation enables the saturated zone to drain away during the periods between leachate
application.
4.2.3. Discussion
Table 4.2.1 presents the results for constant and intermittent leachate application
after three weeks of operation. The lowest lateral movement was for leachate applied
constantly to a waste mass with a permeability of 10-3 cm/s while the highest lateral
movement was for leachate applied constantly to a waste mass with a permeability of 10-5
cm/s.
These data also indicate that for the high permeability waste mass (10-3 cm/s),
intermittent operation increases lateral spreading while for the lower permeability waste
masses (10-4 and 10-5 cm/s), intermittent operation resulted in a reduction in the lateral
spreading. This behavior can be attributed to the ability of leachate to move laterally and
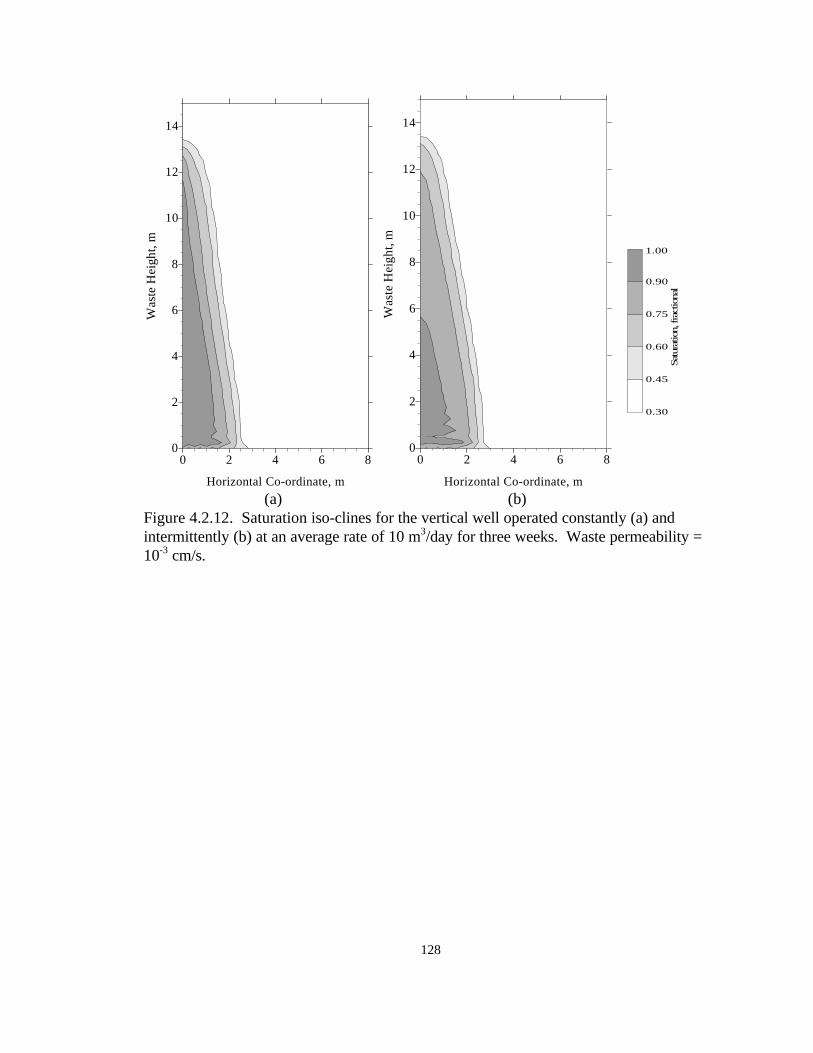
vertically and the proximity of the vertical well to the drainage layers. Figure 4.2.12
depicts the saturation iso-clines for leachate applied at an average rate of 10 m3/day to a
waste mass with a permeability of 10-3 cm/s. Inspection of this figure indicates that the
saturated zone drains significantly between leachate applications for the intermittent
application scenario. Intermittent application results in higher-short term application rates
which drive leachate laterally into the waste mass.
127
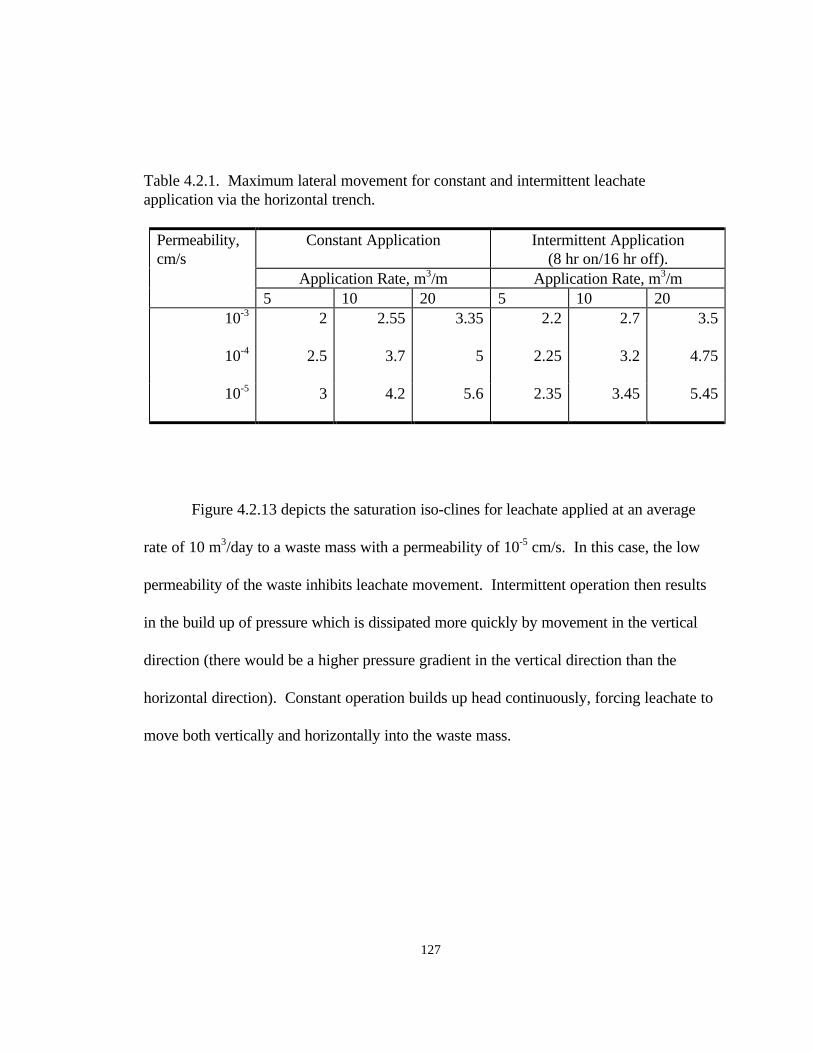
Table 4.2.1. Maximum lateral movement for constant and intermittent leachateapplication via the horizontal trench.
Permeability,cm/s
Constant Application Intermittent Application(8 hr on/16 hr off).
Application Rate, m3/m Application Rate, m3/m5 10 20 5 10 20
10-3 2 2.55 3.35 2.2 2.7 3.5
10-4 2.5 3.7 5 2.25 3.2 4.75
10-5 3 4.2 5.6 2.35 3.45 5.45
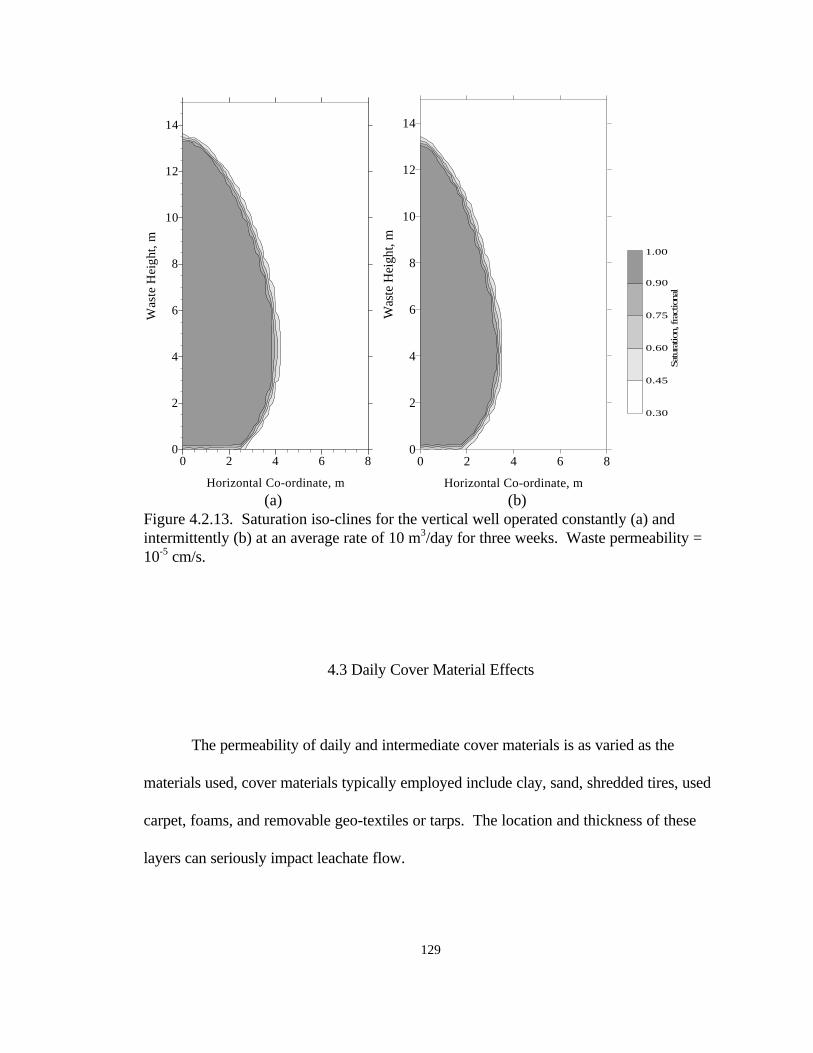
Figure 4.2.13 depicts the saturation iso-clines for leachate applied at an average
rate of 10 m3/day to a waste mass with a permeability of 10-5 cm/s. In this case, the low
permeability of the waste inhibits leachate movement. Intermittent operation then results
in the build up of pressure which is dissipated more quickly by movement in the vertical
direction (there would be a higher pressure gradient in the vertical direction than the
horizontal direction). Constant operation builds up head continuously, forcing leachate to
move both vertically and horizontally into the waste mass.
128
0 2 4 6 8
Horizontal Co-ordinate, m
0
2
4
6
8
10
12
14
Was
te H
eigh
t, m
0 2 4 6 8
Horizontal Co-ordinate, m
0
2
4
6
8
10
12
14
Was
te H
eigh
t, m
0.30
0.45
0.60
0.75
0.90
1.00
Satu
ratio
n, fra
ctio
nal
(a) (b)Figure 4.2.12. Saturation iso-clines for the vertical well operated constantly (a) andintermittently (b) at an average rate of 10 m3/day for three weeks. Waste permeability =10-3 cm/s.
129
0 2 4 6 8
Horizontal Co-ordinate, m
0
2
4
6
8
10
12
14
Was
te H
eigh
t, m
0 2 4 6 8
Horizontal Co-ordinate, m
0
2
4
6
8
10
12
14
Was
te H
eigh
t, m
0.30
0.45
0.60
0.75
0.90
1.00
Satu
ratio
n, fra
ctio
nal
(a) (b)Figure 4.2.13. Saturation iso-clines for the vertical well operated constantly (a) andintermittently (b) at an average rate of 10 m3/day for three weeks. Waste permeability =10-5 cm/s.
4.3 Daily Cover Material Effects
The permeability of daily and intermediate cover materials is as varied as the
materials used, cover materials typically employed include clay, sand, shredded tires, used
carpet, foams, and removable geo-textiles or tarps. The location and thickness of these
layers can seriously impact leachate flow.
130
The selection and application of daily and intermediate covers is of particular
importance to successful leachate recirculation. The use of low permeability materials will
significantly impede vertical movement of leachate resulting in perched lenses of leachate
and potentially side seep problems as leachate moves laterally along the daily cover
material. A leachate recirculating Delaware landfill (Miller et al., 1991) noted several
perched lenses of leachate directly above daily cover materials. The waste beneath these
perched lenses was found to be dry and well preserved. Once the cover material was
pierced, the leachate drained quickly. Some landfill operators breach the daily cover
material prior to applying the next layer of waste in order to limit perching and lateral
leachate flows. The use of high-permeability materials will not inhibit vertical flow but
rather, may result in lateral flow to side slopes again resulting in potential seep problems.
Figures 4.3.1 through 4.3.5 illustrate the effect of cover material permeability,
breaches in the cover, and leachate application rate on leachate routing. The waste
modeled in these simulations had uniform permeabilities of 10-3 or 10-4 cm/s while the
cover material had permeabilities ranging from 10-2 to 10-5 cm/s, and a thickness of 0.4 m.
A 1-m breach was created in two locations at each cover material level. Leachate was
applied intermittently (8 hr. on/16 hr. off) for daily average rates of 2, 4, and 8 m3/m of
trench/day. The results for a waste mass with a permeability of 10-3 cm/s (Figures 4.3.1
through 4.3.3) best illustrate cover material effects. The movement of leachate in the 10-4
cm/s waste permeability simulations (Figures 4.3.4 and 4.3.5) was influenced by the
imposition of a no flow upper boundary condition.
131
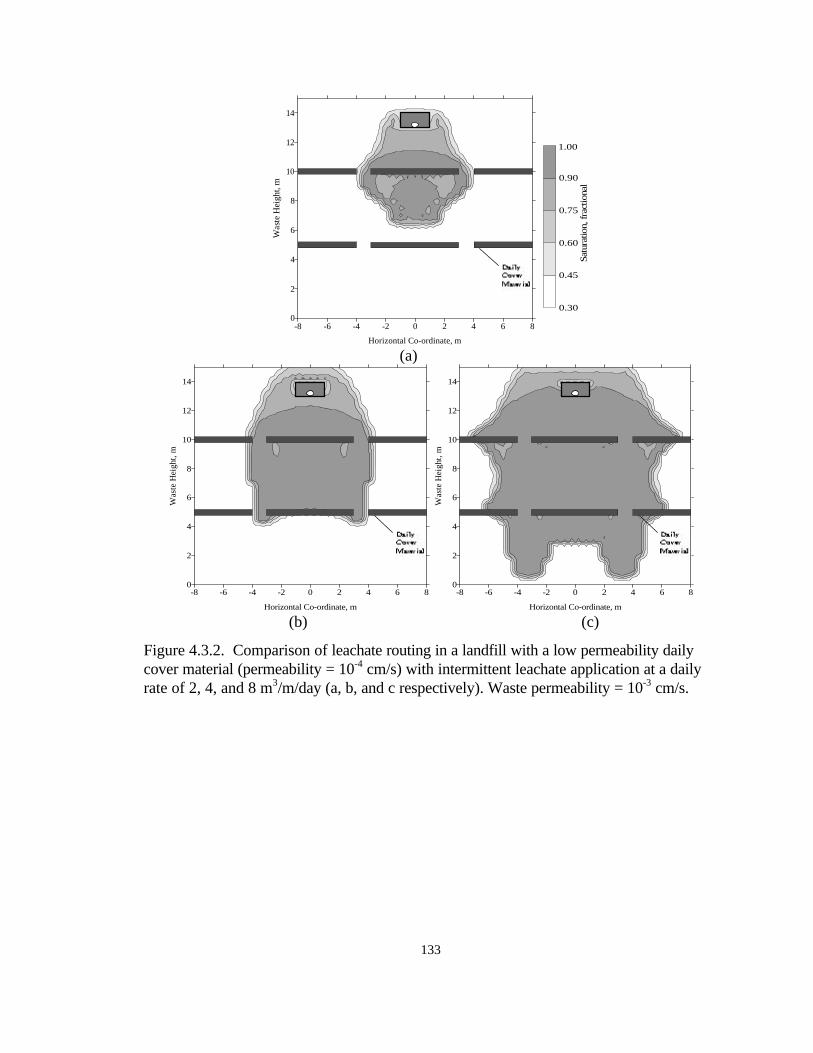
Figures 4.3.1 and 4.3.2 depict the movement of leachate through a waste mass in
which the daily cover material has a lower permeability than the waste. A saturated lens of
leachate can be seen perched above and moving laterally along the cover material in both
figures. Leachate channels vertically through the two breaches and begins to flow
downward again. The location of breaches in the cover material has an obvious effect on
leachate routing. Strategic location of the breaches may then be used to control and to
some degree direct leachate movement. A comparison of Figures 4.3.1 and 4.3.2 indicates
that the permeability of the cover material is also important. Lateral flow was more
significant and the impact of flow through breaches more pronounced for the lower
permeability material (Figure 4.3.1). These figures do indicate that flow through low
permeability cover materials is possible however, these materials significantly slowed the
rate of vertical movement and flow through the breaches was a major leachate flow route.
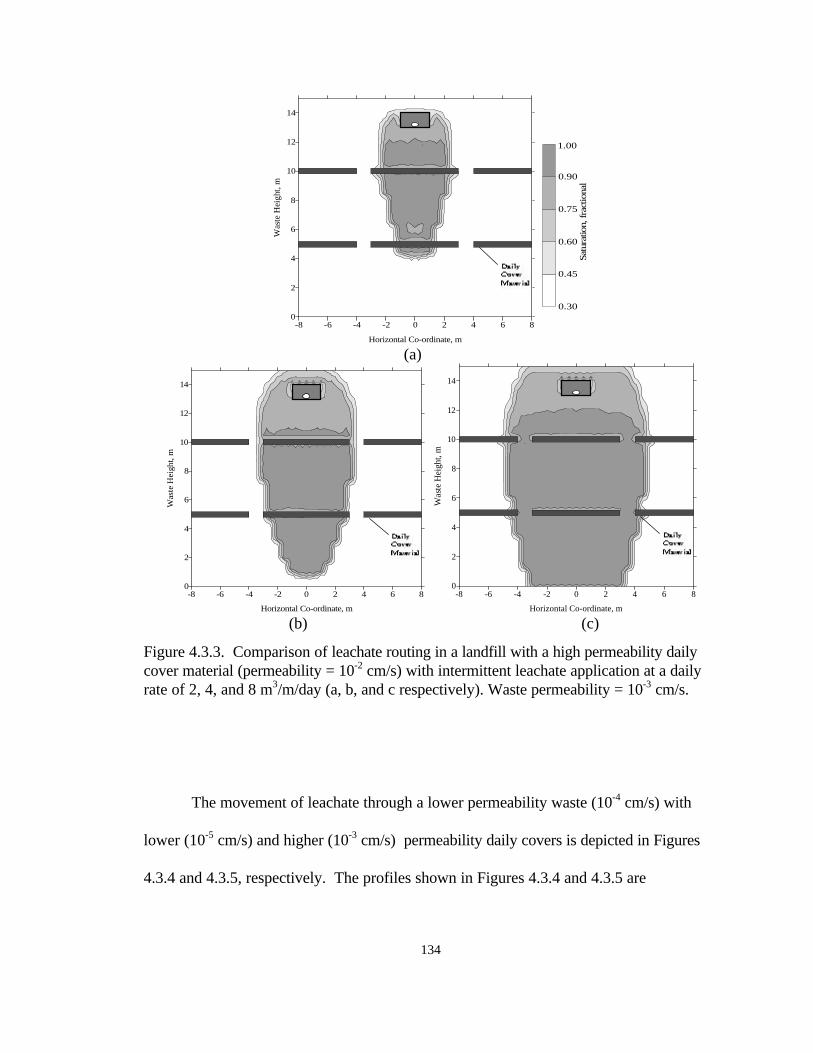
Figure 4.3.3 depicts the movement of leachate through a waste mass in which the
daily cover material has a higher permeability than the waste. The cover material has a
slight affect on both lateral and vertical leachate movement. Close inspection of saturation
iso-clines around the daily cover material indicates minimal lateral movement through the
cover material but a general de-saturation around the cover layer which would imply an
increase in the rate of vertical movement.

132
-8 -6 -4 -2 0 2 4 6 8
Horizontal Co-ordinate, m
0
2
4
6
8
10
12
14
Was
te H
eigh
t, m
0.30
0.45
0.60
0.75
0.90
1.00
Satu
ratio
n, f
ract
iona
l
(a)
-8 -6 -4 -2 0 2 4 6 8
Horizontal Co-ordinate, m
0
2
4
6
8
10
12
14
Was
te H
eigh
t, m
-8 -6 -4 -2 0 2 4 6 8
Horizontal Co-ordinate, m
0
2
4
6
8
10
12
14
Was
te H
eigh
t, m
(b) (c)
Figure 4.3.1. Comparison of leachate routing in a landfill with a low permeability dailycover material (permeability = 10-5 cm/s) with intermittent leachate application at a dailyrate of 2, 4, and 8 m3/m/day (a, b, and c respectively). Waste permeability = 10-3 cm/s.
133
-8 -6 -4 -2 0 2 4 6 8
Horizontal Co-ordinate, m
0
2
4
6
8
10
12
14
Was
te H
eigh
t, m
0.30
0.45
0.60
0.75
0.90
1.00
Satu
ratio
n, f
ract
iona
l
(a)
-8 -6 -4 -2 0 2 4 6 8
Horizontal Co-ordinate, m
0
2
4
6
8
10
12
14
Was
te H
eigh
t, m
-8 -6 -4 -2 0 2 4 6 8
Horizontal Co-ordinate, m
0
2
4
6
8
10
12
14
Was
te H
eigh
t, m
(b) (c)
Figure 4.3.2. Comparison of leachate routing in a landfill with a low permeability dailycover material (permeability = 10-4 cm/s) with intermittent leachate application at a dailyrate of 2, 4, and 8 m3/m/day (a, b, and c respectively). Waste permeability = 10-3 cm/s.
134
-8 -6 -4 -2 0 2 4 6 8
Horizontal Co-ordinate, m
0
2
4
6
8
10
12
14
Was
te H
eigh
t, m
0.30
0.45
0.60
0.75
0.90
1.00
Satu
ratio
n, f
ract
iona
l
(a)
-8 -6 -4 -2 0 2 4 6 8
Horizontal Co-ordinate, m
0
2
4
6
8
10
12
14
Was
te H
eigh
t, m
-8 -6 -4 -2 0 2 4 6 8
Horizontal Co-ordinate, m
0
2
4
6
8
10
12
14
Was
te H
eigh
t, m
(b) (c)
Figure 4.3.3. Comparison of leachate routing in a landfill with a high permeability dailycover material (permeability = 10-2 cm/s) with intermittent leachate application at a dailyrate of 2, 4, and 8 m3/m/day (a, b, and c respectively). Waste permeability = 10-3 cm/s.
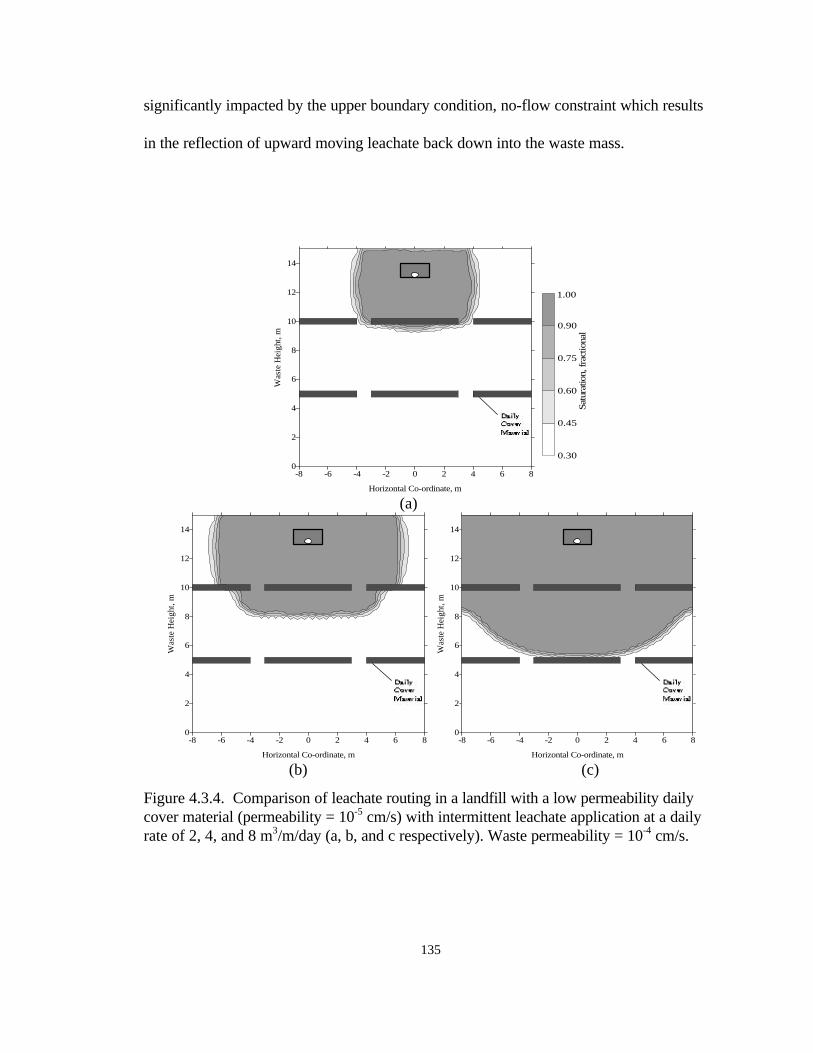
The movement of leachate through a lower permeability waste (10-4 cm/s) with
lower (10-5 cm/s) and higher (10-3 cm/s) permeability daily covers is depicted in Figures
4.3.4 and 4.3.5, respectively. The profiles shown in Figures 4.3.4 and 4.3.5 are
135
significantly impacted by the upper boundary condition, no-flow constraint which results
in the reflection of upward moving leachate back down into the waste mass.
-8 -6 -4 -2 0 2 4 6 8
Horizontal Co-ordinate, m
0
2
4
6
8
10
12
14
Was
te H
eigh
t, m
0.30
0.45
0.60
0.75
0.90
1.00
Satu
ratio
n, f
ract
iona
l
(a)
-8 -6 -4 -2 0 2 4 6 8
Horizontal Co-ordinate, m
0
2
4
6
8
10
12
14
Was
te H
eigh
t, m
-8 -6 -4 -2 0 2 4 6 8
Horizontal Co-ordinate, m
0
2
4
6
8
10
12
14
Was
te H
eigh
t, m
(b) (c)
Figure 4.3.4. Comparison of leachate routing in a landfill with a low permeability dailycover material (permeability = 10-5 cm/s) with intermittent leachate application at a dailyrate of 2, 4, and 8 m3/m/day (a, b, and c respectively). Waste permeability = 10-4 cm/s.
136
-8 -6 -4 -2 0 2 4 6 8
Horizontal Co-ordinate, m
0
2
4
6
8
10
12
14
Was
te H
eigh
t, m
0.30
0.45
0.60
0.75
0.90
1.00
Satu
ratio
n, f
ract
iona
l
(a)
-8 -6 -4 -2 0 2 4 6 8
Horizontal Co-ordinate, m
0
2
4
6
8
10
12
14
Was
te H
eigh
t, m
-8 -6 -4 -2 0 2 4 6 8
Horizontal Co-ordinate, m
0
2
4
6
8
10
12
14
Was
te H
eigh
t, m
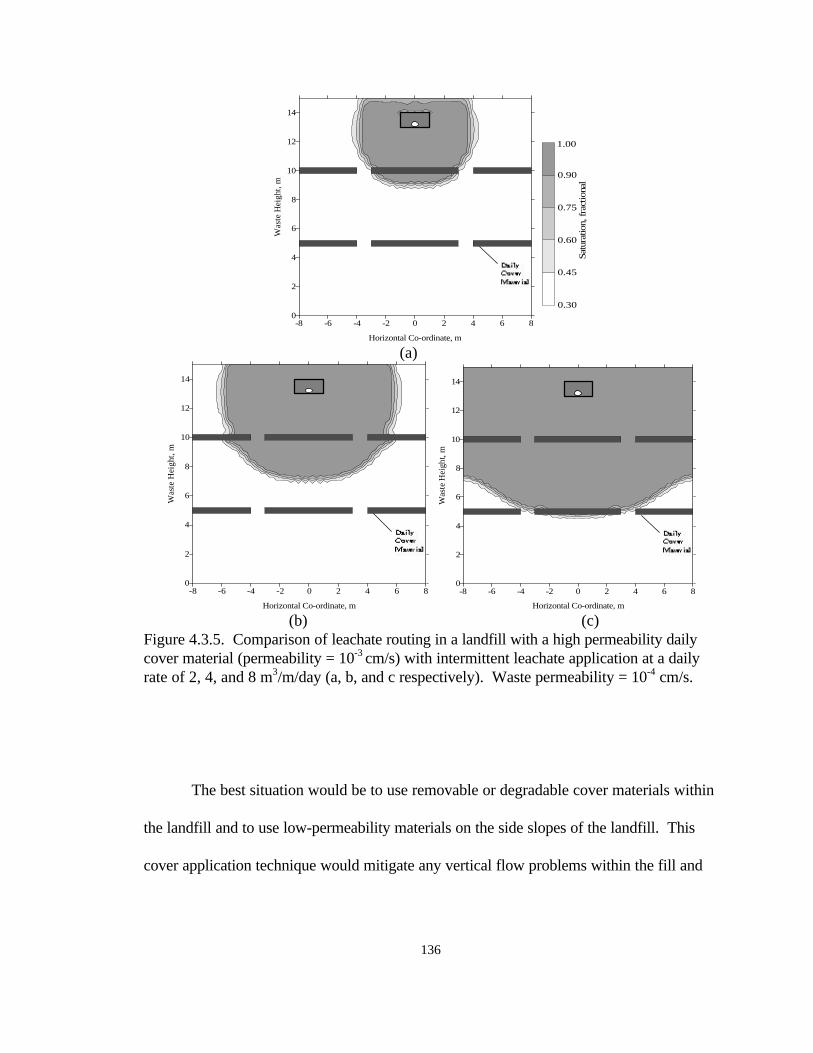
(b) (c)Figure 4.3.5. Comparison of leachate routing in a landfill with a high permeability dailycover material (permeability = 10-3 cm/s) with intermittent leachate application at a dailyrate of 2, 4, and 8 m3/m/day (a, b, and c respectively). Waste permeability = 10-4 cm/s.
The best situation would be to use removable or degradable cover materials within
the landfill and to use low-permeability materials on the side slopes of the landfill. This
cover application technique would mitigate any vertical flow problems within the fill and
137
help to prevent side seeps. An added benefit would be increased air-space for waste
placement within the landfill. Landfills which must use some type of non-degradable cover
material, whether it be local soil, compost, or shredded tires, should breach horizontal
layers to ensure that leachate will flow down through the fill and not along or through the
cover layer.
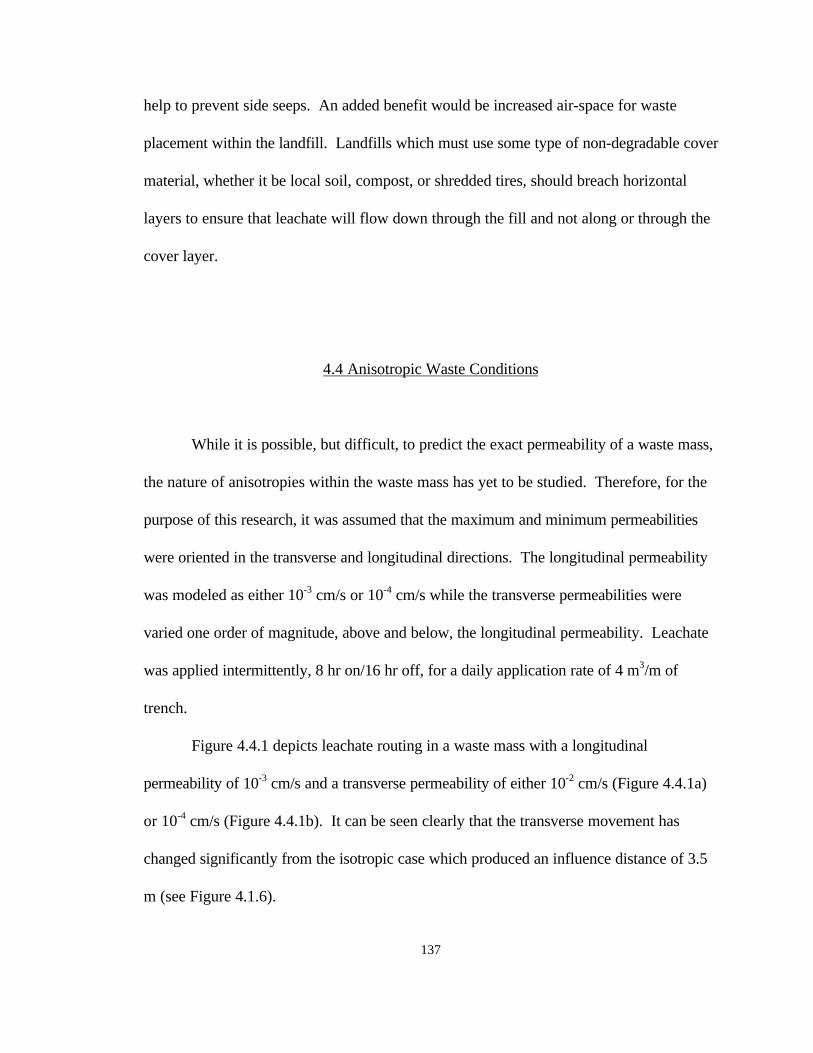
4.4 Anisotropic Waste Conditions
While it is possible, but difficult, to predict the exact permeability of a waste mass,
the nature of anisotropies within the waste mass has yet to be studied. Therefore, for the
purpose of this research, it was assumed that the maximum and minimum permeabilities
were oriented in the transverse and longitudinal directions. The longitudinal permeability
was modeled as either 10-3 cm/s or 10-4 cm/s while the transverse permeabilities were
varied one order of magnitude, above and below, the longitudinal permeability. Leachate
was applied intermittently, 8 hr on/16 hr off, for a daily application rate of 4 m3/m of
trench.
Figure 4.4.1 depicts leachate routing in a waste mass with a longitudinal
permeability of 10-3 cm/s and a transverse permeability of either 10-2 cm/s (Figure 4.4.1a)
or 10-4 cm/s (Figure 4.4.1b). It can be seen clearly that the transverse movement has
changed significantly from the isotropic case which produced an influence distance of 3.5
m (see Figure 4.1.6).
138
0 2 4 6 8
Horizontal Co-ordinate, m
0
2
4
6
8
10
12
14W
aste
Hei
ght,
m
0 2 4 6 8
Horizontal Co-ordinate, m
0
2
4
6
8
10
12
14
Was
te H
eigh
t, m
0.30
0.45
0.60
0.75
0.90
1.00
Sat
urat
ion,
fra
ctio
nal
(a) (b)
Figure 4.4.1. Leachate routing for an anisotropic waste mass with a longitudinalpermeability of 10-3 cm/s and a transverse permeability of 10-2 cm/s (a) or 10-4 cm/s (b)after one week of operation. Leachate applied 8 hr per day at a rate of 4 m3/m oftrench/day.
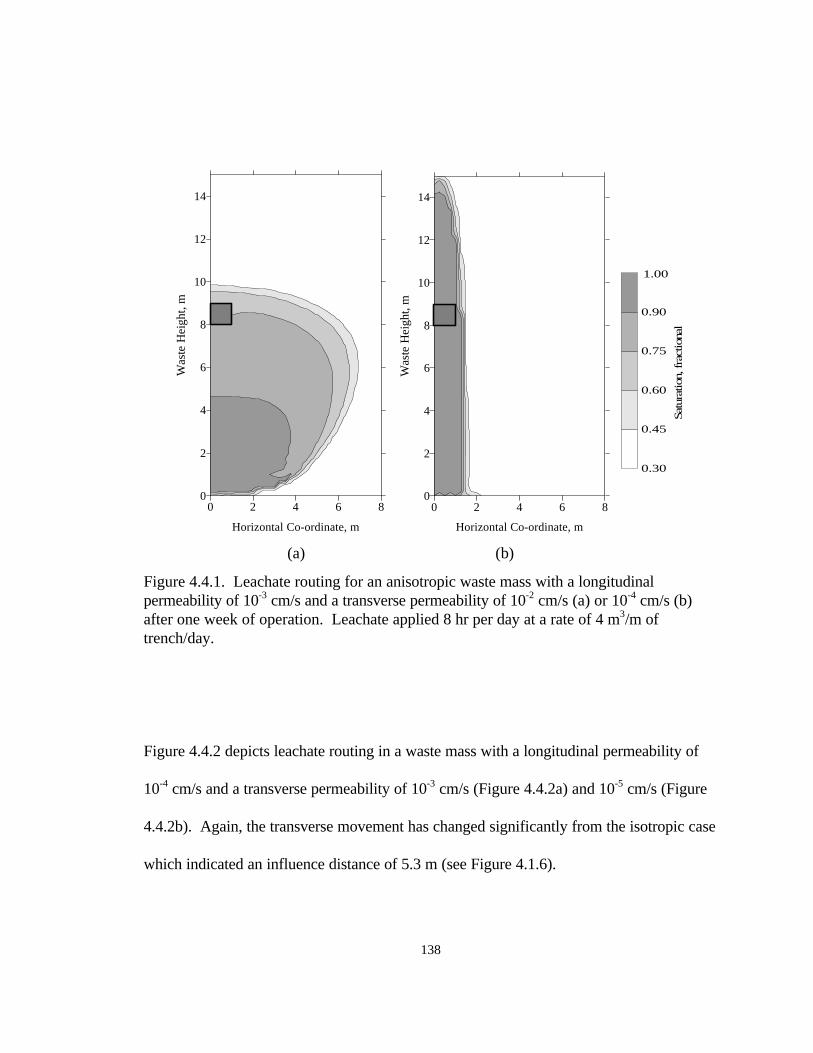
Figure 4.4.2 depicts leachate routing in a waste mass with a longitudinal permeability of
10-4 cm/s and a transverse permeability of 10-3 cm/s (Figure 4.4.2a) and 10-5 cm/s (Figure
4.4.2b). Again, the transverse movement has changed significantly from the isotropic case
which indicated an influence distance of 5.3 m (see Figure 4.1.6).
139
0 2 4 6 8
Horizontal Co-ordinate, m
0
2
4
6
8
10
12
14W
aste
Hei
ght,
m
0 2 4 6 8
Horizontal Co-ordinate, m
0
2
4
6
8
10
12
14
Was
te H
eigh
t, m
0.30
0.45
0.60
0.75
0.90
1.00
Sat
urat
ion,
fra
ctio
nal
(a) (b)
Figure 4.4.2. Leachate routing for an anisotropic waste mass with a longitudinalpermeability of 10-4 cm/s and a transverse permeability of 10-3 cm/s (a) or 10-5 cm/s (b)after one week of operation. Leachate applied 8 hr per day at a rate of 4 m3/m oftrench/day.
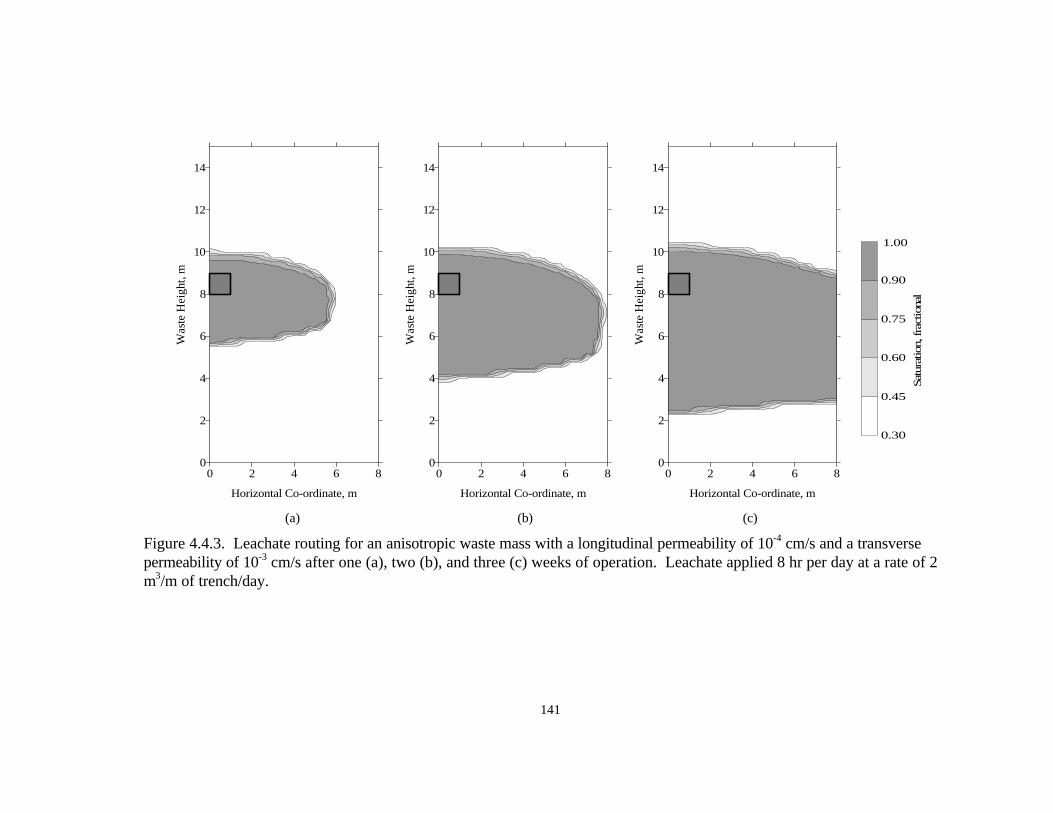
The simulation which generated Figure 4.4.2a was limited by the model scale resulting in
the moisture profile reaching the lateral boundaries. Figure 4.4.3 was included to provide
a better inspection of the effects of anisotropy and covers three weeks of trench operation.
The simulation which produced Figure 4.4.3 differs from the simulation for Figure 4.4.2a
140
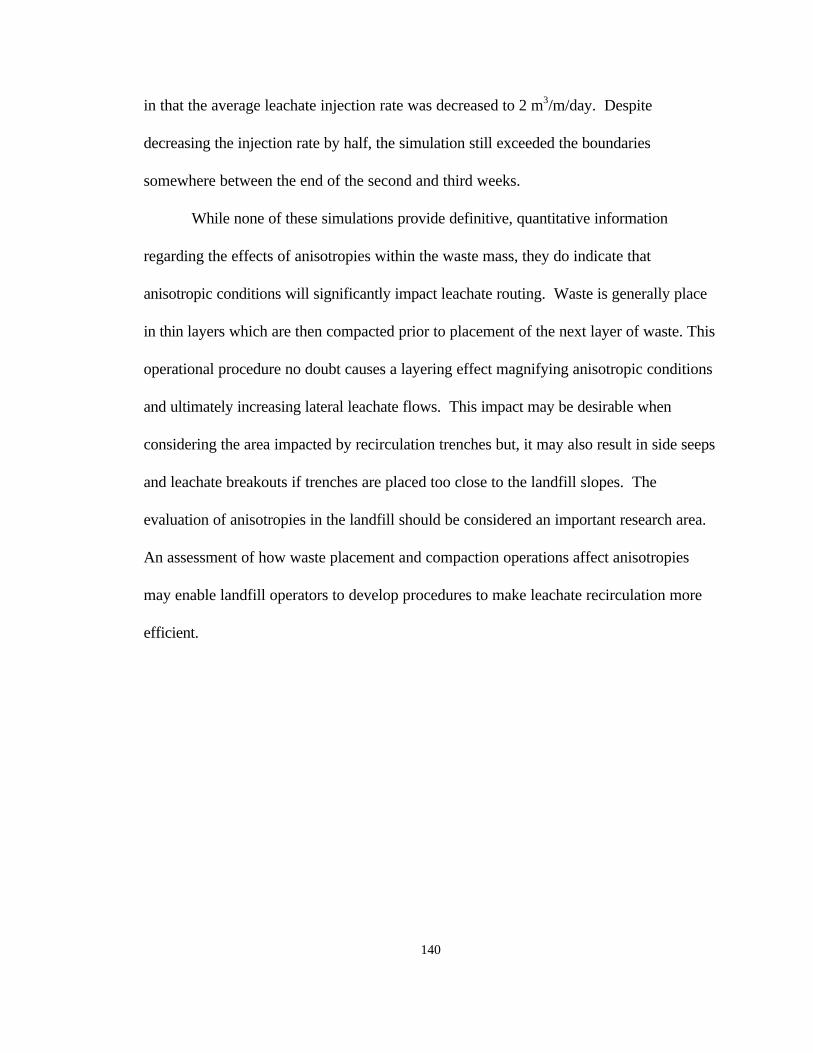
in that the average leachate injection rate was decreased to 2 m3/m/day. Despite
decreasing the injection rate by half, the simulation still exceeded the boundaries
somewhere between the end of the second and third weeks.
While none of these simulations provide definitive, quantitative information
regarding the effects of anisotropies within the waste mass, they do indicate that
anisotropic conditions will significantly impact leachate routing. Waste is generally place
in thin layers which are then compacted prior to placement of the next layer of waste. This
operational procedure no doubt causes a layering effect magnifying anisotropic conditions
and ultimately increasing lateral leachate flows. This impact may be desirable when
considering the area impacted by recirculation trenches but, it may also result in side seeps
and leachate breakouts if trenches are placed too close to the landfill slopes. The
evaluation of anisotropies in the landfill should be considered an important research area.
An assessment of how waste placement and compaction operations affect anisotropies
may enable landfill operators to develop procedures to make leachate recirculation more
efficient.
141
0 2 4 6 8
Horizontal Co-ordinate, m
0
2
4
6
8
10
12
14W
aste
Hei
ght,
m
0 2 4 6 8
Horizontal Co-ordinate, m
0
2
4
6
8
10
12
14
Was
te H
eigh
t, m
0 2 4 6 8
Horizontal Co-ordinate, m
0
2
4
6
8
10
12
14
Was
te H
eigh
t, m
0.30
0.45
0.60
0.75
0.90
1.00
Sat
urat
ion,
fra
ctio
nal
(a) (b) (c)
Figure 4.4.3. Leachate routing for an anisotropic waste mass with a longitudinal permeability of 10-4 cm/s and a transversepermeability of 10-3 cm/s after one (a), two (b), and three (c) weeks of operation. Leachate applied 8 hr per day at a rate of 2m3/m of trench/day.
142
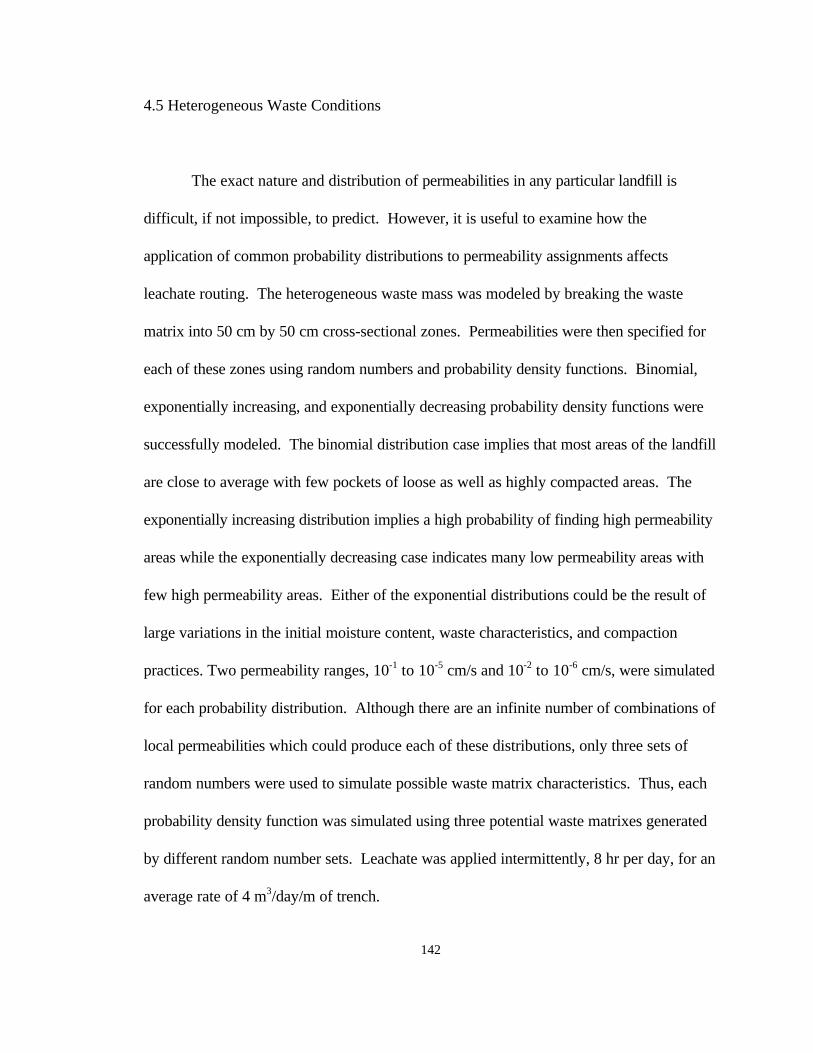
4.5 Heterogeneous Waste Conditions
The exact nature and distribution of permeabilities in any particular landfill is
difficult, if not impossible, to predict. However, it is useful to examine how the
application of common probability distributions to permeability assignments affects
leachate routing. The heterogeneous waste mass was modeled by breaking the waste
matrix into 50 cm by 50 cm cross-sectional zones. Permeabilities were then specified for
each of these zones using random numbers and probability density functions. Binomial,
exponentially increasing, and exponentially decreasing probability density functions were
successfully modeled. The binomial distribution case implies that most areas of the landfill
are close to average with few pockets of loose as well as highly compacted areas. The
exponentially increasing distribution implies a high probability of finding high permeability
areas while the exponentially decreasing case indicates many low permeability areas with
few high permeability areas. Either of the exponential distributions could be the result of
large variations in the initial moisture content, waste characteristics, and compaction
practices. Two permeability ranges, 10-1 to 10-5 cm/s and 10-2 to 10-6 cm/s, were simulated
for each probability distribution. Although there are an infinite number of combinations of
local permeabilities which could produce each of these distributions, only three sets of
random numbers were used to simulate possible waste matrix characteristics. Thus, each
probability density function was simulated using three potential waste matrixes generated
by different random number sets. Leachate was applied intermittently, 8 hr per day, for an
average rate of 4 m3/day/m of trench.
143
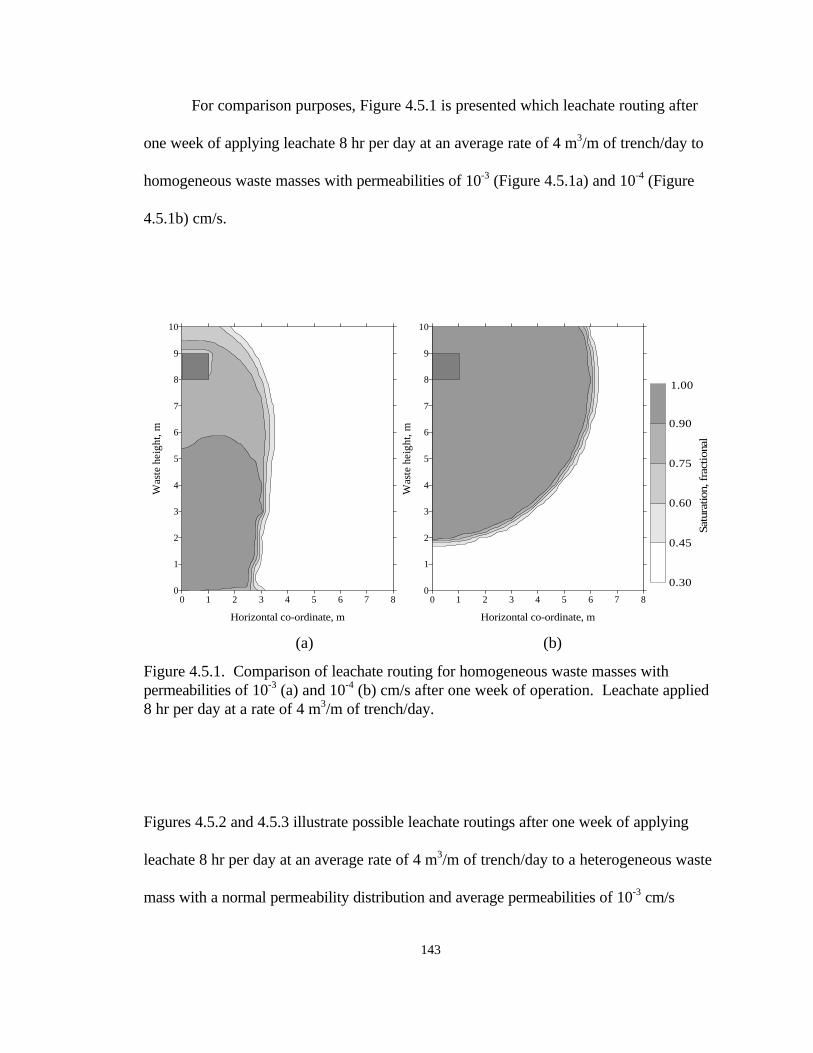
For comparison purposes, Figure 4.5.1 is presented which leachate routing after
one week of applying leachate 8 hr per day at an average rate of 4 m3/m of trench/day to
homogeneous waste masses with permeabilities of 10-3 (Figure 4.5.1a) and 10-4 (Figure
4.5.1b) cm/s.
0 1 2 3 4 5 6 7 8
Horizontal co-ordinate, m
0
1
2
3
4
5
6
7
8
9
10
Was
te h
eigh
t, m
0 1 2 3 4 5 6 7 8
Horizontal co-ordinate, m
0
1
2
3
4
5
6
7
8
9
10
Was
te h
eigh
t, m
0.30
0.45
0.60
0.75
0.90
1.00
Satu
ratio
n, f
ract
iona
l
(a) (b)
Figure 4.5.1. Comparison of leachate routing for homogeneous waste masses withpermeabilities of 10-3 (a) and 10-4 (b) cm/s after one week of operation. Leachate applied8 hr per day at a rate of 4 m3/m of trench/day.
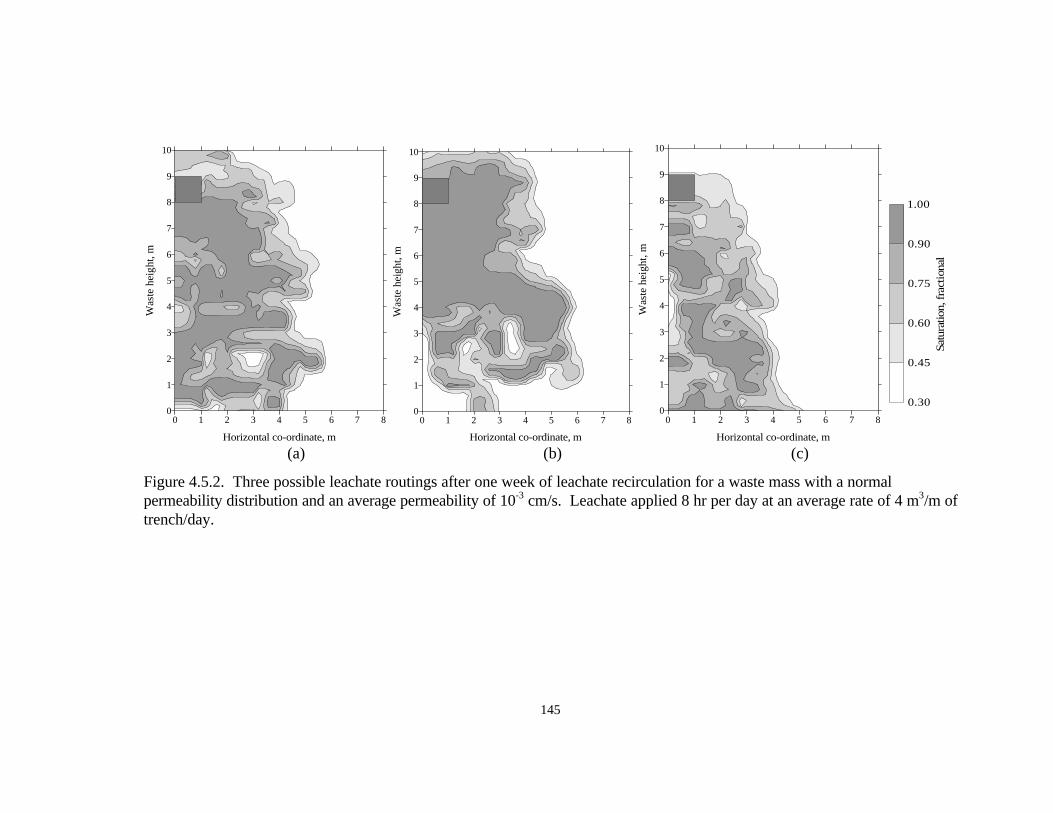
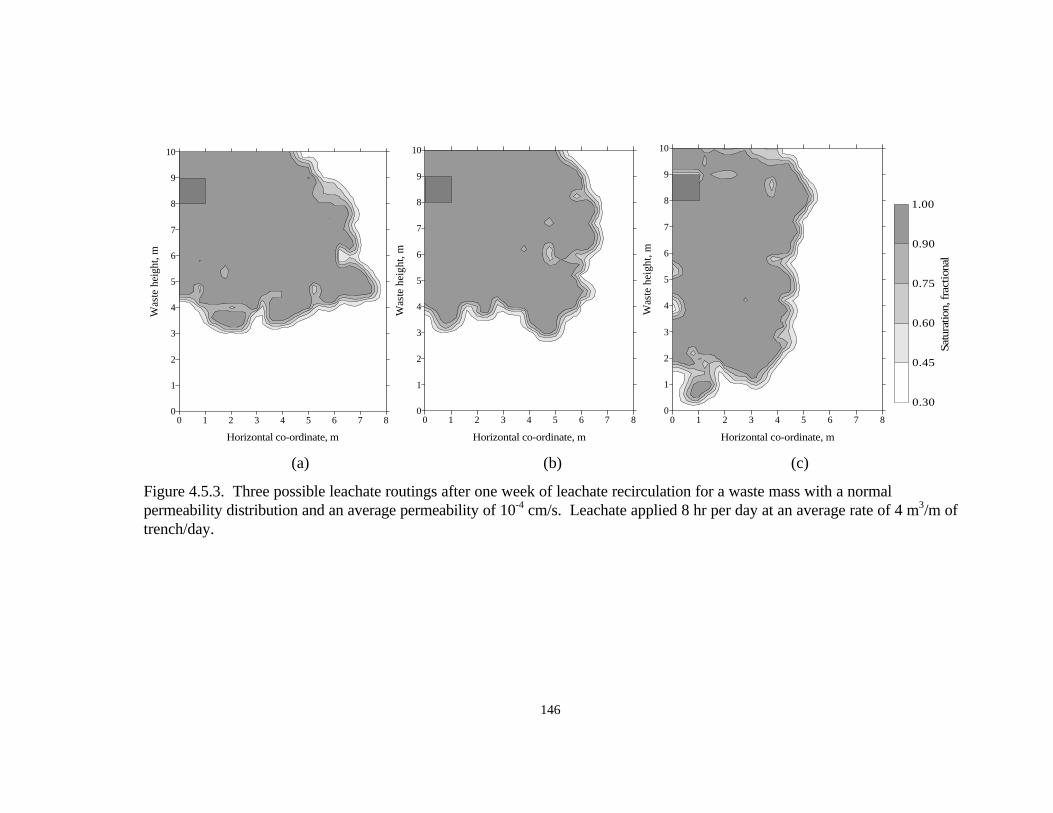
Figures 4.5.2 and 4.5.3 illustrate possible leachate routings after one week of applying
leachate 8 hr per day at an average rate of 4 m3/m of trench/day to a heterogeneous waste
mass with a normal permeability distribution and average permeabilities of 10-3 cm/s
144
(Figure 4.5.2) and 10-4 cm/s (Figure 4.5.3). It is interesting to note, the normal
distribution case with a mean permeability of 10-3 cm/s (Figure 4.5.2) results in increased
lateral movement of leachate and decreased overall saturation. This effect on leachate
routing suggests enhanced leachate storage opportunities potentially stimulating biological
activity. The 10-4 cm/s mean permeability case differed from the homogeneous case in the
shape of the saturation profile but, the waste mass was still predominantly saturated.
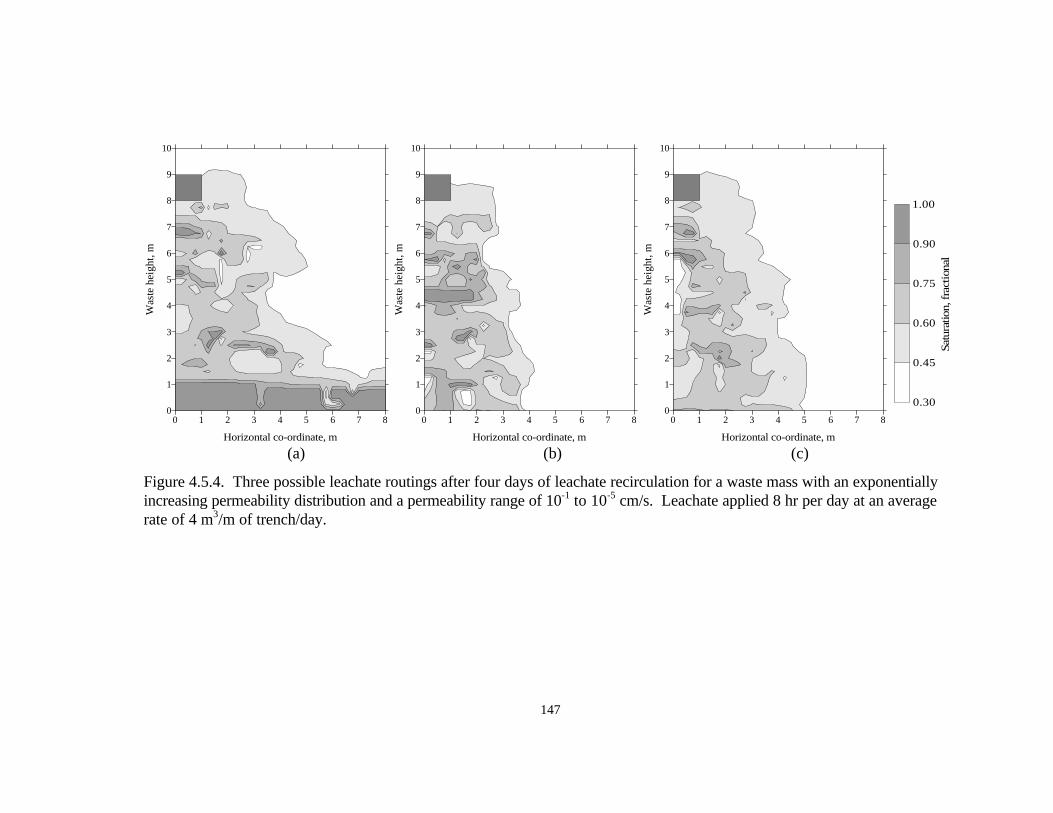
Figures 4.5.4 and 4.5.5 depict possible leachate routings after four days and one
week, respectively, of applying leachate 8 hr per day at an average rate of 4 m3/m of
trench/day to a heterogeneous waste mass with an exponentially decreasing permeability
distribution and median permeabilities of 10-3 cm/s (Figure 4.5.4) and 10-4 cm/s (Figure
4.5.5). The results for the waste mass with a median permeability of 10-3 cm/s simulation
were presented at four days rather than one week due to the rapid leachate movement in
this simulation. Leachate quickly piled up in the lower waste layers limiting the visual
impact of the waste heterogeneities. Both figures show a high degree of preferential flow.
Figure 4.5.4 shows rapid leachate movement with slight saturation increases and few
pockets of highly saturated areas. Figure 4.5.5 again shows
145
0 1 2 3 4 5 6 7 8
Horizontal co-ordinate, m
0
1
2
3
4
5
6
7
8
9
10W
aste
hei
ght,
m
0 1 2 3 4 5 6 7 8
Horizontal co-ordinate, m
0
1
2
3
4
5
6
7
8
9
10
Was
te h
eigh
t, m
0 1 2 3 4 5 6 7 8
Horizontal co-ordinate, m
0
1
2
3
4
5
6
7
8
9
10
Was
te h
eigh
t, m
0.30
0.45
0.60
0.75
0.90
1.00
Satu
ratio
n, f
ract
iona
l
(a) (b) (c)
Figure 4.5.2. Three possible leachate routings after one week of leachate recirculation for a waste mass with a normalpermeability distribution and an average permeability of 10-3 cm/s. Leachate applied 8 hr per day at an average rate of 4 m3/m oftrench/day.
146
0 1 2 3 4 5 6 7 8
Horizontal co-ordinate, m
0
1
2
3
4
5
6
7
8
9
10W
aste
hei
ght,
m
0 1 2 3 4 5 6 7 8
Horizontal co-ordinate, m
0
1
2
3
4
5
6
7
8
9
10
Was
te h
eigh
t, m
0 1 2 3 4 5 6 7 8
Horizontal co-ordinate, m
0
1
2
3
4
5
6
7
8
9
10
Was
te h
eigh
t, m
0.30
0.45
0.60
0.75
0.90
1.00
Satu
ratio
n, f
ract
iona
l
(a) (b) (c)
Figure 4.5.3. Three possible leachate routings after one week of leachate recirculation for a waste mass with a normalpermeability distribution and an average permeability of 10-4 cm/s. Leachate applied 8 hr per day at an average rate of 4 m3/m oftrench/day.
147
0 1 2 3 4 5 6 7 8
Horizontal co-ordinate, m
0
1
2
3
4
5
6
7
8
9
10W
aste
hei
ght,
m
0 1 2 3 4 5 6 7 8
Horizontal co-ordinate, m
0
1
2
3
4
5
6
7
8
9
10
Was
te h
eigh
t, m
0 1 2 3 4 5 6 7 8
Horizontal co-ordinate, m
0
1
2
3
4
5
6
7
8
9
10
Was
te h
eigh
t, m
0.30
0.45
0.60
0.75
0.90
1.00
Satu
ratio
n, f
ract
iona
l
(a) (b) (c)
Figure 4.5.4. Three possible leachate routings after four days of leachate recirculation for a waste mass with an exponentiallyincreasing permeability distribution and a permeability range of 10-1 to 10-5 cm/s. Leachate applied 8 hr per day at an averagerate of 4 m3/m of trench/day.
148
0 1 2 3 4 5 6 7 8
Horizontal co-ordinate, m
0
1
2
3
4
5
6
7
8
9
10W
aste
hei
ght,
m
0 1 2 3 4 5 6 7 8
Horizontal co-ordinate, m
0
1
2
3
4
5
6
7
8
9
10
Was
te h
eigh
t, m
0 1 2 3 4 5 6 7 8
Horizontal co-ordinate, m
0
1
2
3
4
5
6
7
8
9
10
Was
te h
eigh
t, m
0.30
0.45
0.60
0.75
0.90
1.00
Satu
ratio
n, f
ract
iona
l
(a) (b) (c)
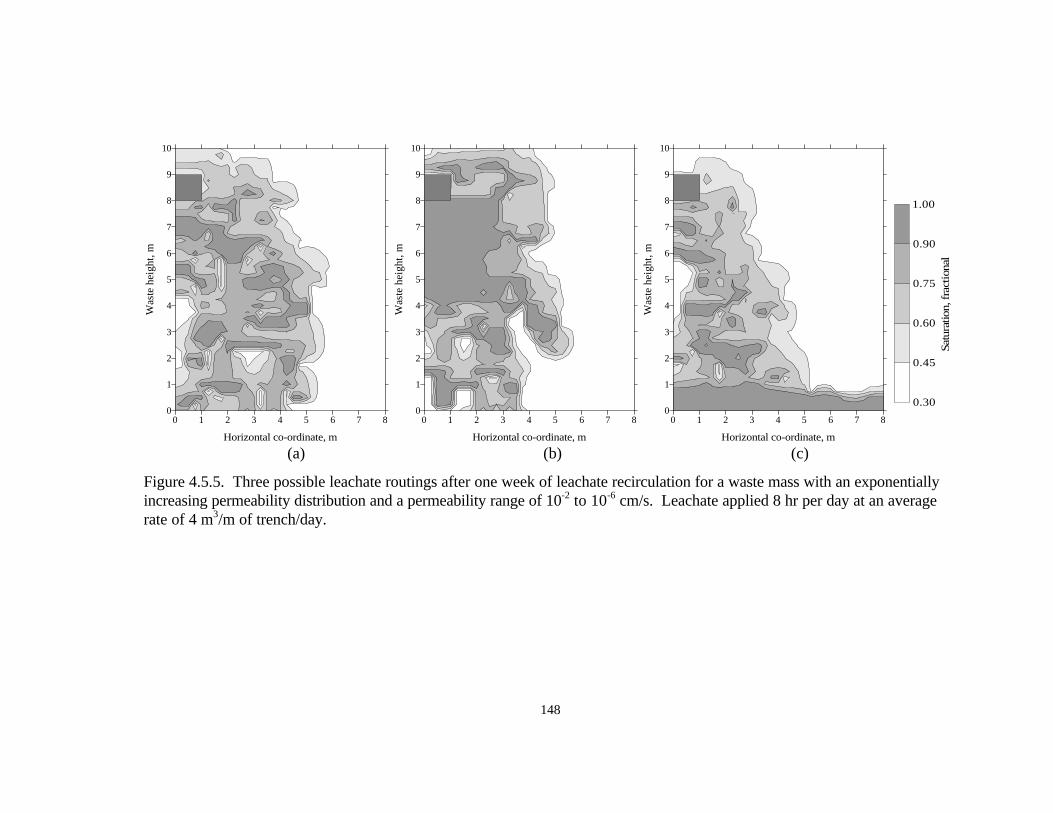
Figure 4.5.5. Three possible leachate routings after one week of leachate recirculation for a waste mass with an exponentiallyincreasing permeability distribution and a permeability range of 10-2 to 10-6 cm/s. Leachate applied 8 hr per day at an averagerate of 4 m3/m of trench/day.
149
rapid leachate flow, although slower than in the previous case, saturation is greatly
increased with numerous pockets and some larger areas of high saturation.
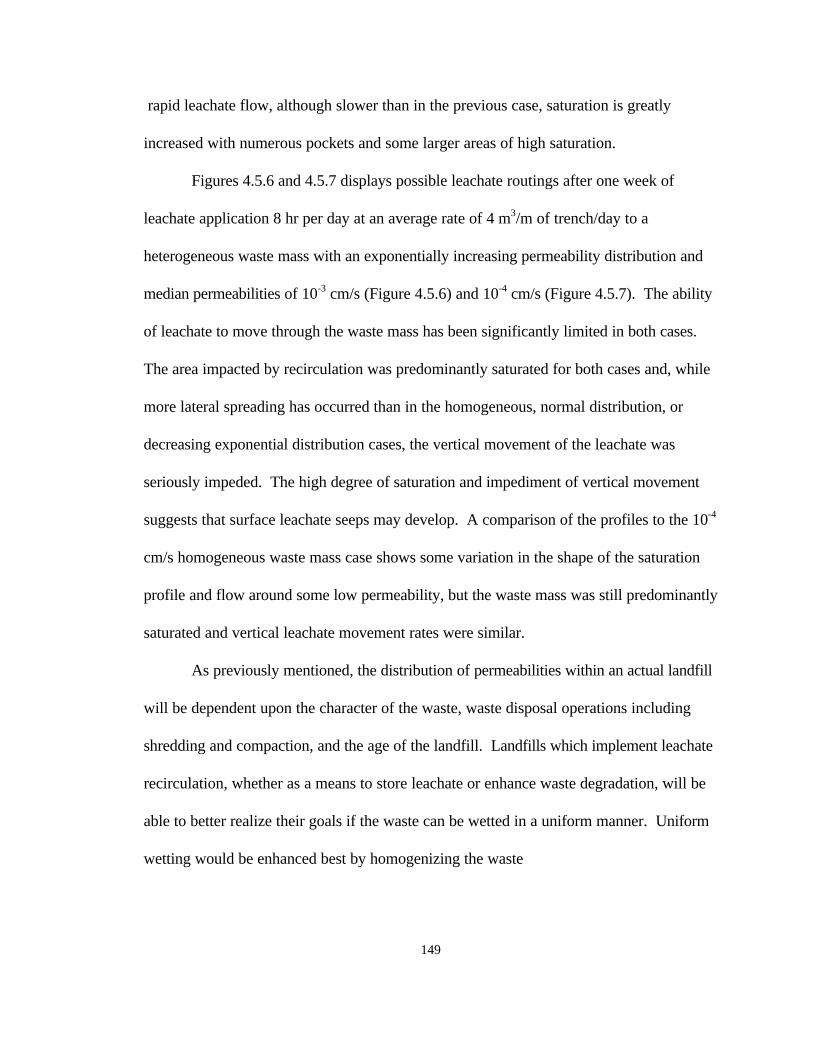
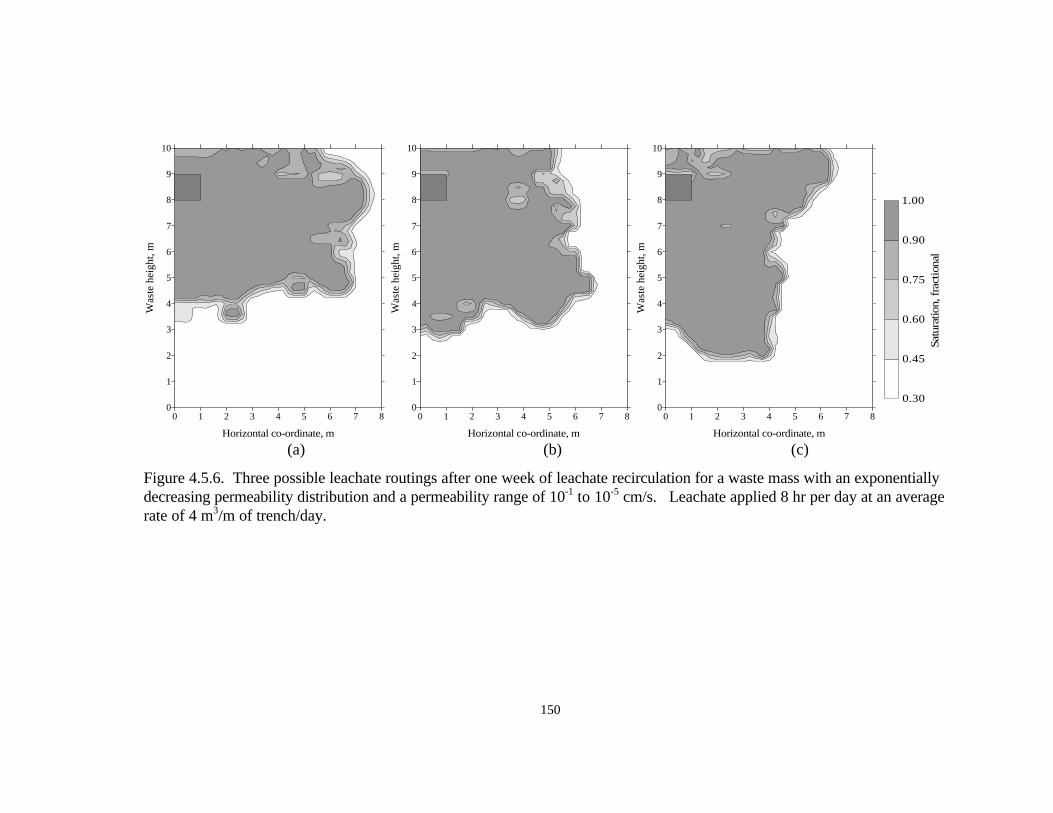
Figures 4.5.6 and 4.5.7 displays possible leachate routings after one week of
leachate application 8 hr per day at an average rate of 4 m3/m of trench/day to a
heterogeneous waste mass with an exponentially increasing permeability distribution and
median permeabilities of 10-3 cm/s (Figure 4.5.6) and 10-4 cm/s (Figure 4.5.7). The ability
of leachate to move through the waste mass has been significantly limited in both cases.
The area impacted by recirculation was predominantly saturated for both cases and, while
more lateral spreading has occurred than in the homogeneous, normal distribution, or
decreasing exponential distribution cases, the vertical movement of the leachate was
seriously impeded. The high degree of saturation and impediment of vertical movement
suggests that surface leachate seeps may develop. A comparison of the profiles to the 10-4
cm/s homogeneous waste mass case shows some variation in the shape of the saturation
profile and flow around some low permeability, but the waste mass was still predominantly
saturated and vertical leachate movement rates were similar.
As previously mentioned, the distribution of permeabilities within an actual landfill
will be dependent upon the character of the waste, waste disposal operations including
shredding and compaction, and the age of the landfill. Landfills which implement leachate
recirculation, whether as a means to store leachate or enhance waste degradation, will be
able to better realize their goals if the waste can be wetted in a uniform manner. Uniform
wetting would be enhanced best by homogenizing the waste
150
0 1 2 3 4 5 6 7 8
Horizontal co-ordinate, m
0
1
2
3
4
5
6
7
8
9
10W
aste
hei
ght,
m
0 1 2 3 4 5 6 7 8
Horizontal co-ordinate, m
0
1
2
3
4
5
6
7
8
9
10
Was
te h
eigh
t, m
0 1 2 3 4 5 6 7 8
Horizontal co-ordinate, m
0
1
2
3
4
5
6
7
8
9
10
Was
te h
eigh
t, m
0.30
0.45
0.60
0.75
0.90
1.00
Satu
ratio
n, f
ract
iona
l
(a) (b) (c)
Figure 4.5.6. Three possible leachate routings after one week of leachate recirculation for a waste mass with an exponentiallydecreasing permeability distribution and a permeability range of 10-1 to 10-5 cm/s. Leachate applied 8 hr per day at an averagerate of 4 m3/m of trench/day.
151
0 1 2 3 4 5 6 7 8
Horizontal co-ordinate, m
0
1
2
3
4
5
6
7
8
9
10W
aste
hei
ght,
m
0 1 2 3 4 5 6 7 8
Horizontal co-ordinate, m
0
1
2
3
4
5
6
7
8
9
10
Was
te h
eigh
t, m
0 1 2 3 4 5 6 7 8
Horizontal co-ordinate, m
0
1
2
3
4
5
6
7
8
9
10
Was
te h
eigh
t, m
0.30
0.45
0.60
0.75
0.90
1.00
Satu
ratio
n, f
ract
iona
l
(a) (b) (c)
Figure 4.5.7. Three possible leachate routings after one week of leachate recirculation for a waste mass with an exponentiallydecreasing permeability distribution and a permeability range of 10-2 to 10-6 cm/s. Leachate applied 8 hr per day at an averagerate of 4 m3/m of trench/day.
152
mass and controlling the placement of low permeability materials within the landfill.
Waste shredding would have the most significant effect on homogenizing the waste mass
but may not be feasible at many sites. Bag breaking during placement and the removal of
large, low permeability materials would be beneficial to sites which could not implement
shredding.