Chapter 4 Andhra Pradesh Power Sector: A...
35
Chapter 4 Andhra Pradesh Power Sector: A Profile Case Study of Andhra Pradesh: Introduction Electricity has throughout played a dynamic role in the development process of all the States. Over the plan years sustained efforts towards an integrated and balanced socio- economic development has resulted in considerable growth of the power sector. Power sector in Andhra Pradesh has grown considerably over the years, with an enviable hydro-thermal mix and operational standards. However, the complex mosaic of changing consumption patterns, expanding demand-supply hiatus, irrational and myopic policies, and poor financial health of APSEB, besides a horde of other inadequacies and maladies, has led to the stagnation of the power sector. Moreover, a rapidly growing power sector, in Andhra Pradesh, has serious environmental impacts, which on exceeding the threshold level may have severe repercussions on the development process. Thus, the imperative to bring the power sector out of the present lacunae, mutatis mutandis, and pave the way for a sustainable development process, has motivated and necessitated studies which would provide guidelines to the decision makers involved in the reform process. With similar objective, the least cost power system expansion plan model formulated is applied to the Andhra Pradesh Power Sector, as a Case Study, to assess the pattern of power system development in the state and evaluate its environmental implications. Thus, the study is structured to trace the power sector development in Andhra Pradesh under alternative scenarios. Besides, this study would also illustrate the flexibility and the generality of the model designed to be applicable to the power sector of any region or state and act as a tool for the decision-maker. The status of the power sector in this state, as discussed below, shows its unique as well as representative features as compared to those in the other states and regions. Thus, the choice of Andhra Pradesh as the state for case study has important bearing to a decision-maker in quest for the analytical implications of alternative policy regimes. It would be appropriate to present a profile of the power sector in Andhra Pradesh, which would provide the necessary backdrop for this diagnostic study. However, prior to an elaborate and involved discussion ofthe status ofthe power sector in Andhra Pradesh, a brief outline of the salient features of the state, chosen for this study, is presented. Features of the State: A Brief Outline The state of Andhra Pradesh is flanked by the Bay of Bengal and a coastline of 960 kms on the East, the states of Orissa and Madhya Pradesh on the North, Tamil Nadu on the South, and Kamataka and Maharashtra on the West. With a total land area of about 2.76lakh
Transcript of Chapter 4 Andhra Pradesh Power Sector: A...

Chapter 4
Andhra Pradesh Power Sector: A Profile
Case Study of Andhra Pradesh: Introduction Electricity has throughout played a dynamic role in the development process of all the
States. Over the plan years sustained efforts towards an integrated and balanced socio
economic development has resulted in considerable growth of the power sector. Power sector
in Andhra Pradesh has grown considerably over the years, with an enviable hydro-thermal
mix and operational standards. However, the complex mosaic of changing consumption
patterns, expanding demand-supply hiatus, irrational and myopic policies, and poor financial
health of APSEB, besides a horde of other inadequacies and maladies, has led to the
stagnation of the power sector. Moreover, a rapidly growing power sector, in Andhra Pradesh,
has serious environmental impacts, which on exceeding the threshold level may have severe
repercussions on the development process. Thus, the imperative to bring the power sector out
of the present lacunae, mutatis mutandis, and pave the way for a sustainable development
process, has motivated and necessitated studies which would provide guidelines to the
decision makers involved in the reform process.
With similar objective, the least cost power system expansion plan model formulated
is applied to the Andhra Pradesh Power Sector, as a Case Study, to assess the pattern of power
system development in the state and evaluate its environmental implications. Thus, the study
is structured to trace the power sector development in Andhra Pradesh under alternative
scenarios. Besides, this study would also illustrate the flexibility and the generality of the
model designed to be applicable to the power sector of any region or state and act as a tool for
the decision-maker. The status of the power sector in this state, as discussed below, shows its
unique as well as representative features as compared to those in the other states and regions.
Thus, the choice of Andhra Pradesh as the state for case study has important bearing to a
decision-maker in quest for the analytical implications of alternative policy regimes.
It would be appropriate to present a profile of the power sector in Andhra Pradesh,
which would provide the necessary backdrop for this diagnostic study. However, prior to an
elaborate and involved discussion ofthe status ofthe power sector in Andhra Pradesh, a brief
outline of the salient features of the state, chosen for this study, is presented.
Features of the State: A Brief Outline
The state of Andhra Pradesh is flanked by the Bay of Bengal and a coastline of 960
kms on the East, the states of Orissa and Madhya Pradesh on the North, Tamil Nadu on the
South, and Kamataka and Maharashtra on the West. With a total land area of about 2.76lakh
Chapter 4 119 --~~~-------------------------------------------
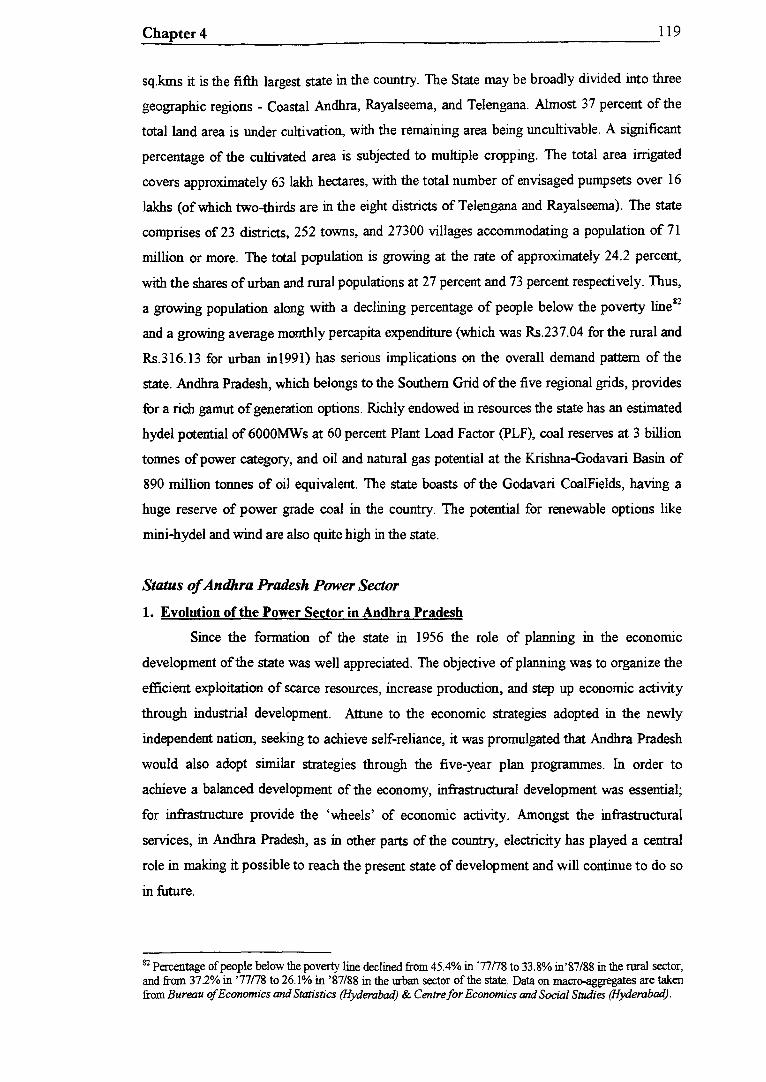
sq.kms it is the fifth largest state in the country. The State may be broadly divided into three
geographic regions- Coastal Andhra, Rayalseema, and Telengana. Almost 37 percent ofthe
total land area is under cultivation, with the remaining area being uncultivable. A significant
percentage of the cultivated area is subjected to multiple cropping. The total area irrigated
covers approximately 63 lakh hectares, with the total number of envisaged pumpsets over 16
lakhs (ofwhich two-thirds are in the eight districts ofTelengana and Rayalseema). The state
comprises of 23 districts, 252 towns, and 27300 villages accommodating a population of 71
million or more. The total population is growing at the rate of approximately 24.2 percent,
with the shares of urban and rural populations at 27 percent and 73 percent respectively. Thus,
a growing population along with a declining percentage of people below the poverty line82
and a growing average monthly percapita expenditure (which was Rs.237.04 for the rural and
Rs.316.13 for urban inl991) has serious implications on the overall demand pattern of the
state. Andhra Pradesh, which belongs to the Southern Grid of the five regional grids, provides
for a rich gamut of generation options. Richly endowed in resources the state has an estimated
hydel potential of 6000MWs at 60 percent Plant Load Factor (PLF), coal reserves at 3 billion
tonnes of power category, and oil and natural gas potential at the Krishna-Godavari Basin of
890 million tonnes of oil equivalent. The state boasts of the Godavari CoalFields, having a
huge reserve of power grade coal in the country. The potential for renewable options like
mini-hydel and wind are also quite high in the state.
Status of Andhra Pradesh Power Sector
1. Evolution of the Power Sector in Andhra Pradesh
Since the formation of the state in 1956 the role of planning in the econormc
development ofthe state was well appreciated. The objective of planning was to organize the
efficient exploitation of scarce resources, increase production, and step up economic activity
through industrial development. Attune to the economic strategies adopted in the newly
independent nation, seeking to achieve self-reliance, it was promulgated that Andhra Pradesh
would also adopt similar strategies through the five-year plan programmes. In order to
achieve a balanced development of the economy, infrastructural development was essential;
for infrastructure provide the 'wheels' of economic activity. Amongst the infrastructural
services, in Andhra Pradesh, as in other parts of the country, electricity has played a central
role in making it possible to reach the present state of development and will continue to do so
in future.
82 Percentage of people below the poverty line declined from 45.4% in '77n8 to 33.8%) in'87/88 in the rural sector, and from 37.2% in '77n8 to 26.1% in '87/88 in the urban sector of the state. Data on macro-aggregates are taken from Bureau of Economics and Statistics (Hyderabad) & Centre for Economics and Social Studies (Hyderabad).
Chapter 4 120 --~--~-------------------------------------------
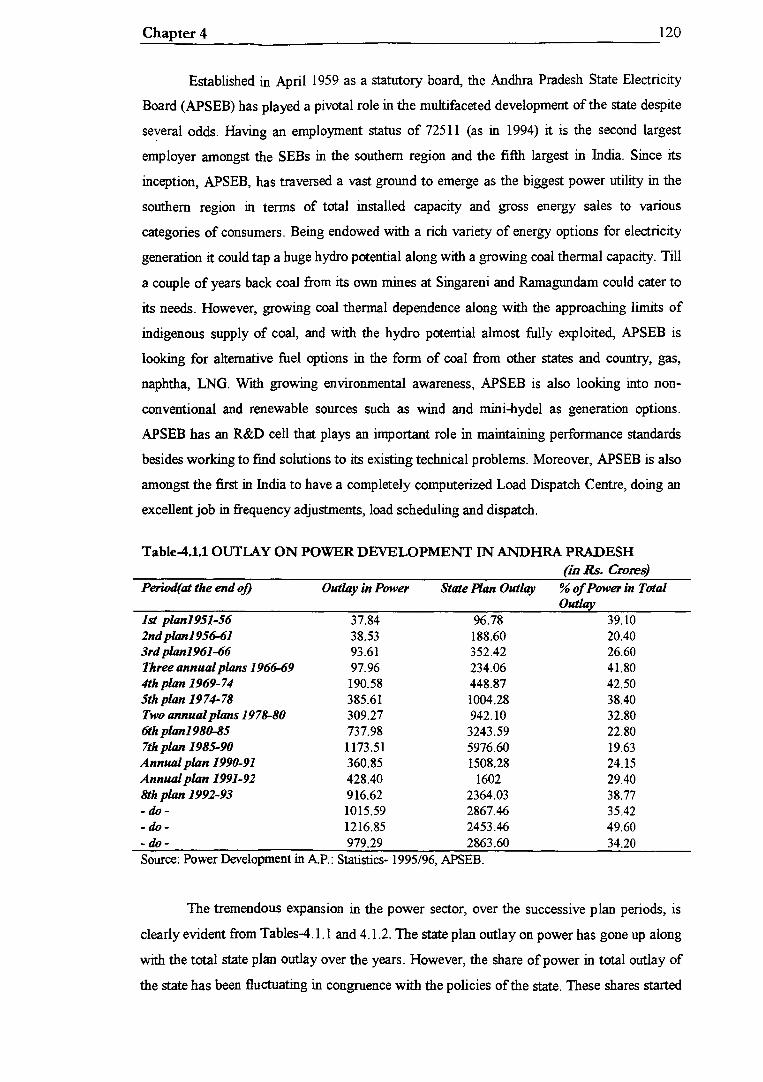
Established in April 1959 as a statutory board, the Andhra Pradesh State Electricity
Board (APSEB) has played a pivotal role in the multifaceted development of the state despite
several odds. Having an employment status of 72511 (as in 1994) it is the second largest
employer amongst the SEBs in the southern region and the fifth largest in India. Since its
inception, APSEB, has traversed a vast ground to emerge as the biggest power utility in the
southern region in terms of total installed capacity and gross energy sales to various
categories of consumers. Being endowed with a rich variety of energy options for electricity
generation it could tap a huge hydro potential along with a growing coal thermal capacity. Till
a couple of years back coal from its own mines at Singareni and Ramagundam could cater to
its needs. However, growing coal thermal dependence along with the approaching limits of
indigenous supply of coal, and with the hydro potential almost fully exploited, APSEB is
looking for alternative fuel options in the form of coal from other states and country, gas,
naphtha, LNG. With growing environmental awareness, APSEB is also looking into non
conventional and renewable sources such as wind and mini-hydel as generation options.
APSEB has an R&D cell that plays an important role in maintaining performance standards
besides working to find solutions to its existing technical problems. Moreover, APSEB is also
amongst the first in India to have a completely computerized Load Dispatch Centre, doing an
excellent job in frequency adjustments, load scheduling and dispatch.
Table-4.1.1 OUTLAY ON POWER DEVELOPMENT IN ANDHRA PRADESH (in Rs. Crores)
Period( at the end of) Outlay in Power State Plan Outlay % of Power in Total Outlay
1st plan1951-56 37.84 96.78 39.10 2nd plon1956-61 38.53 188.60 20.40 3rd plan1961-66 93.61 352.42 26.60 Three annual plans 1966-69 97.96 234.06 41.80 4th plan 1969-74 190.58 448.87 42.50 5th plan 1974-78 385.61 1004.28 38.40 Two annual plans 1978-80 309.27 942.10 32.80 6th plan1980-85 737.98 3243.59 22.80 7th plan 1985-90 1173.51 5976.60 19.63 Annual pkm 1990-91 360.85 1508.28 24.15 Annual plan 1991-92 428.40 1602 29.40 8th plan 1992-93 916.62 2364.03 38.77 -do- 1015.59 2867.46 35.42 -do- 1216.85 2453.46 49.60 -do- 979.29 2863.60 34.20 Source: Power Development in AP.: Statistics- 1995/96, APSEB.
The tremendous expansion in the power sector, over the successive plan periods, is
clearly evident from Tables-4.1.1 and 4.1.2. The state plan outlay on power has gone up along
with the total state plan outlay over the years. However, the share of power in total outlay of
the state has been fluctuating in congruence with the policies of the state. These shares started

Chapter4 121
going up from 20.4% in the early sixties reaching 42.5% in the fourth plan. Thereafter, the
shares started declining till the late '80s, only to take an upturn again in the '90s. The
underlying reasons for fluctuating share of the state power sector outlay in total state outlay
are diverse. The state economy in its nascent stage required massive funds for the basic
development of the power sector.
Thus, massive funds were utilized for constructing generating capacity and setting up
ofT&D network for the evacuation of power from these generating stations. Subsequently, in
the '60's and '70's the board became involved in a rapid rural electrification programme and
in the extension of an urban based power system to the entire expanse of the state. This
explains the substantial shares of power in total outlay during this period. However,
consequential to the bulkiness of the investment carried out in the power sector compared to
the growing but moderately low system demand, surplus power prevailed in the state through
the '70's. The power outlay shares, subsequently, started declining from the mid '70's. The
power supply situation started changing from the '80's, and from mid '80's the situation
deteriorated drastically. This was mainly on account of rapid growth in consumption of power
in all the sectors ofthe state economy.
Table-4.1.2 PROGRESS UNDER FIVE YEAR PLANS IN ANDHRA PRADESH
Period( at the end of) Installed Generation Peak Sales Per Capita Capacity (GWh) Demand (GWh) Consmn.
(MW) (MW) (KWh) 1st plan1951-56 98.9 239 54.6 186 7 2nd plan195~61 213 784 190 601 19 3rd plan1961-66 292 1399 258 1048 31 Three annual plans 196~9 615 2277 440 1638 44 4th plan 1969-64 668 3106 652 2479 60 5th plan 1974-78 1563 5148 970 3782 80 Two annual plans 1978-80 1888 6493 1055 4624 96 6th plan1980-85 3156 12551 2158 9924 168 7th plan 1985-90 3825 15407 3070 14581 238 Annual plan 1990-91 4131 18286 3465 16093 260 Annual plan 1991-92 4166 17987 3703 17750 273 8th plan 1992-93 4228 17913 3916 19227 318 -do- 4729 18733 4170 21206 347 -do- 5214 21800 4434 22954 364 -do- 5258 22568 4576 23400 385 Source: Power Development in AP.: Statistics- 1995/96, APSEB; Power Scenario, 1996/97, APSEB.
As is evident from Table-4.1.2 energy sales, peak demand and per capita
consumption has progressed considerably over the plan periods. Thus, the growing need for
setting up of more capacity has once again obliged the state to increase the share of outlay to
power sector from 1990/91 onwards. Over the past three and a half decades, per capita
consumption has grown steadily from a low 31KWh in '65/66 to 385KWh in '95/96. With
progressive development of the power sector and provision of services to the various sectors

Chapter4 122
of the state economy by the board, fresh demands were created, which in tum influenced
capacity expansion and generation by the board. This spiral effect has caused the power sector
in A.P. to reach the present heights, both in terms of demand and supply.
2. Consumption
Tables-4.2.1, 4.2.2, 4.2.4 below portray the growth in consumption of electricity and
power services over the past decades. The number of consumers has increased seven folds
over the past two decades, with the most dramatic increase observed at the L.T. level.
Connected load has gone up from 2792MW in '74/75 to 14562MW in '95/96, with the
maximum additions having taken place at the L.T. level.
Table-4.2.1 NUMBER OF CONSUMERS AND CONNECTED LOAD IN ANDHRA PRADESH
L.T. H.T. TOT .Air----YEAR Consumer Load Consumer Load Consumer Load
(MW) (MW) (MW) 1974175 1481574 2096 1314 696 1482888 2792 1980181 2380152 3202 1905 1281 2382057 4483 1984185 3471866 4405 2627 1973 3474493 6378 1990191 6594715 7532 3809 2882 6598524 10414 1995196 8910255 11178 3720 3384 8913975 14562 Source: Power Development in AP.: Statistics- 1995/96, APSEB.
Tables-4.2.2, 4.2.4, 4.2.5 illustrate the growth of energy and load, aggregate as well
as category-wise, since 1970/71. Over the past two and a half-decade energy has registered an
average growth of 9.95%, with L.T. and H.T. achieving an average of 12.4% and 7%
respectively. Peak demand has gone up from 562MW in 1970/71 to 4576MW in '95/96 with
an average growth rate of about 9%.
Table-4.2.2 SALE OF ELECfRICI1Y CATEGORY-WISE IN A.P. (GWh) YEAR LT L.T. H.T. total
Dom- Non- Indus- Agricu- public gen. total total HT+LT estic domestic -trial ltural light Purpose
1970171 179 127 162 394 35 n.a. 897 1289 2186 1976177 309 163 264 726 33 2 1497 1936 3433 1980/81 546 216 426 915 49 15 2167 3130 5297 1985186 1195 340 653 2569 91 28 4876 5975 10851 1986187 1402 375 673 3347 100 28 5925 6096 12021 1990191 2079 513 %7 6285 134 40 10018 6075 16093 1991192 2438 553 %3 6972 140 44 11110 6640 17750 1994195 3213 672 1149 10922 152 64 16172 6782 22954 1995/96 3276 704 1194 11399 159 64 16796 6604 23400 Source: Power Development in AP.: Statistics- 1995/96, APSEB.

Chapter 4 123 --~------------------------------------------------------
The underlying changes in the pattern of electricity consumption amongst the various
sectors may be observed in Table-4.2.3 below. It is clearly evident that agricultural sector
with consumption share increasing from 18% in 1970/71 to 49% in 1995/96, has emerged as
the most important consumer of electricity. Proactive efforts of the state towards rural
electrification and preferential policies in favour of agriculture, since the post draught years,
have resulted in massive additions to electric pumpsets and connected load, which has caused
such a skewed consumption pattern. Finding its genesis in the same causal factors, the
domestic sector has also registered a massive growth in consumption. Its share has increased
from 8% in '70/71 to 14% in '95/96. However, the share of other categories - industry,
commercial, and public lighting - has declined over the years. The overall share of L.T.
consumption has gone up, even though the shares of commercial and public lighting have
come down; mainly because of the substantial share of agricultural and domestic consumption
in total L.T. and their high growth rates. Noteworthy is the massive decline in the share of
industrial H.T. consumption share from 59% in '70/71 to 28% in '95/96. There are several
factors that have triggered the decline in the relative share of industry. This decline has been
partially due to the autonomous energy efficiency improvements motivated by the urge to
retain profit margins in the face of high and rising power tariffs. There are other important
issues, such as immense tariff discrimination against industries with the objective of cross
subsidizing agriculture and domestic sectors, and biased restriction & curtailment (R&C)
policies, which have been responsible for the changing pattern of industrial consumption. It
may be further noted that these factors have also directly and indirectly affected consumption
in the agriculture and domestic sectors.
Table-4.2.3 PATTERN OF ELECfRICITY CONSUMPTION IN A.P. (p_ercent.L L.T.
YEAR Domestic Non-domestic Industrial Agricultural public light L. T. total H. T. total 1970171 0.08 0.06 0.07 0.18 0.02 0.41 0.59 1976177 0.09 0.05 0.08 0.21 0.01 0.44 0.56 1980/81 0.10 0.04 0.08 0.17 O.oi 0.41 0.59 1985/86 0.11 0.03 0.06 0.24 O.oi 0.45 0.55 1986/87 0.12 0.03 0.06 0.28 0.01 0.49 0.51 1990/91 0.13 0.03 0.06 0.39 O.oi 0.62 0.38 1991/92 0.14 0.03 0.05 0.39 0.01 0.63 0.37 1994195 0.14 O.o3 0.05 0.48 0.01 0.70 0.30 1995/96 0.14 0.03 0.05 0.49 0.01 0.72 0.28 Note: Obtained from the above Table-4.2.2
Table-4.2.4 PEAK DEMAND FOR ELECfRICITY CONSUMPTION IN A.P.
YEAR 191on1 1976n7 1980/81 1985/86 1986/87 1990/91 1991/92 1994/95 1995/96 PEAK 562 871 1281 2404 2665 3465 3703 4434 4576 Source: Administration Report, 1994/95, APSEB.

Chapter 4
Table-4.2.5 GROWI'H OF ELECTRICITY CONSUMPTION IN A.P. (percen~
------------~ENERGY.---------------· YEAR total energy domestic agricultural L. T. H.T. PEAK
1970/71-80181 9.25 11.8 8.79 9.22 9.28 8.59
1976/77-85186 13.64 16.22 15.07 14.02 13.34 11.94
1986/87-95/96 7.68 9.89 14.59 12.27 0.9 6.19
Note: [1] Values calculated from the Tables above.
124
[2] Agricultural consumption has grown at a faster rate than the addition of pumpsets. This clearly indicates that the consumption per pumpset has gone up considerably over the years (observable from Table-4.2.5 above and 4.3.1 below). Also notable is the variation in the growth rates amongst the various categories of consumers in the pre- and on going power cut periods, i.e. before and after 1986/87.
Considerable disparities in consumption amongst the 23 districts of the state are
observable. Energy sales in '95/96 vary from 1306GWh in Chittor district to 192GWh in
Vizianagaram district. Consumption is observed to be on the higher side in the predominantly
agricultural districts of Warangal (1202GWh), Chittor (l081GWh), Nalgonda (l062GWh),
Karimnagar (1025GWh), Nizamabad (790GWh), Medak (754GWh), Mahaboobnagar
(765GWh), and Ananthapur (680GWh) - (The figures in the brackets are agricultural
consumption data in the respective districts.). Industrial consumption seems to be
concentrated mainly in the industrial regions of the state with the predominance of H.T.
consumption in these districts. These are Vishakapatnam (605GWh), Karimnagar (711GWh),
Rangareddy (485GWh), Medak (595GWh), Adilabad (565GWh), and Nalgonda (372GWh).
District-wise per capita consumption varies from 599KWh in Medak to ll4KWh m
Srikakulam, while connected load varies from 11 OOMW in Medak to 162MW m
Vizianagaram. Such a wide regional variance in consumption has important technical,
commercial and financial implications for the board.
3. Rural Electrification
The rapid growth in the power sector from the mid-'60s may be explained by the
proactive efforts in an extensive rural electrification programme, as indicated in the Table-
4.3.l.below. The primary thrust of this programme was to extend the power system from
urban to the rural areas and use electricity to boost agricultural production. Consequently, the
next two decades saw rapid energization of pumpsets and electrification of villages.
Moreover, with the objective of providing impetus to the development of small rural based
industries emphasis has also been placed on the promotion ofH.T. and L.T. in the rural areas.
By '90/91, 100% of the villages were electrified, thereby substantially enhancing the
consumption potential of the rural regions of the state. Presently, out of the total 26586
villages, 26565 villages are electrified, 9 villages are uninhabited, 2 occupied by NTPC and
the balance 10 are submergible. Sustained efforts on the part ofthe government has also led to
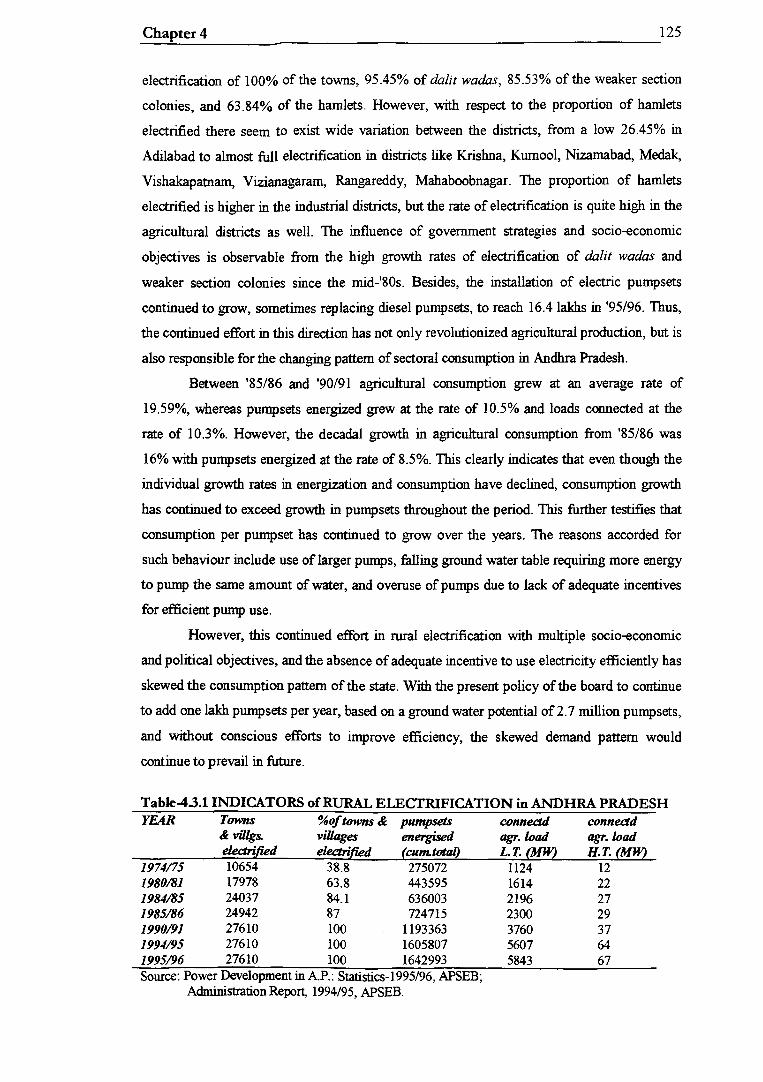
Chapter4 125
electrification of 100% of the towns, 95.45% of dalit wadas, 85.53% of the weaker section
colonies, and 63.84% of the hamlets. However, with respect to the proportion of hamlets
electrified there seem to exist wide variation between the districts, from a low 26.45% in
Adilabad to almost full electrification in districts like Krishna, Kumool, Nizarnabad, Medak,
Vishakapatnam, Vi.zianagaram, Rangareddy, Mahaboobnagar. The proportion of hamlets
electrified is higher in the industrial districts, but the rate of electrification is quite high in the
agricultural districts as well. The influence of government strategies and socio-economic
objectives is observable from the high growth rates of electrification of dalit wadas and
weaker section colonies since the mid-'80s. Besides, the installation of electric pumpsets
continued to grow, sometimes replacing diesel pumpsets, to reach 16.4lakhs in '95/96. Thus,
the continued effort in this direction has not only revolutionized agricultural production, but is
also responsible for the changing pattern of sectoral consumption in Andhra Pradesh.
Between '85/86 and '90/91 agricultural consumption grew at an average rate of
19.59%, whereas pumpsets energized grew at the rate of 10.5% and loads connected at the
rate of 10.3%. However, the decadal growth in agricultural consumption from '85/86 was
16% with pumpsets energized at the rate of 8.5%. This clearly indicates that even though the
individual growth rates in energization and consumption have declined, consumption growth
has continued to exceed growth in pumpsets throughout the period. This further testifies that
consumption per pumpset has continued to grow over the years. The reasons accorded for
such behaviour include use of larger pumps, falling ground water table requiring more energy
to pump the same amount of water, and overuse of pumps due to lack of adequate incentives
for efficient pump use.
However, this continued effort in rural electrification with multiple socio-economic
and political objectives, and the absence of adequate incentive to use electricity efficiently has
skewed the consumption pattern of the state. With the present policy ofthe board to continue
to add one lakh pumpsets per year, based on a ground water potential of 2. 7 million pump sets,
and without conscious efforts to improve efficiency, the skewed demand pattern would
continue to prevail in future.
Table-4.3.1 INDICATORS of RURAL ELECTRIFICATION in ANDHRA PRADESH YEAR Towns %oftowns& pump sets connedd connectd
& villgs. villages energised agr. load agr.load electrified electrified (cum.totall L.T. (MW) H.T. (MW)
1974175 10654 38.8 275072 1124 12 1980/81 17978 63.8 443595 1614 22 1984/85 24037 84.1 636003 2196 27 1985/86 24942 87 724715 2300 29 1990191 27610 100 1193363 3760 37 1994195 27610 100 1605807 5607 64 1995/96 27610 100 1642993 5843 67 Source: Power Development in AP.: Statistics-1995/96, APSEB;
Administration Report, 1994/95, APSEB.

Chapter 4 126
4. Capacity and Generation The progress of installed capacity and generation in the state are illustrated in Tables-
4.4.1 and 4.4.2 below.
Table-4.4.1 PROGRESS OF INSTALLED CAPACITY IN A.P. state sector -central sector-
--HYDRO- --THERMAL- GAS
YEAR MW % MW % MW % MW %
1960161 124 58.20 89 41.80 - - -- --1979180 838 44.40 1050 55.60 ---- - ---- --1989190 2422 53.30 1403 39.90 -- - 717 15.80
1990191 2452 50.10 1613 33.00 66 1.30 762 15.60
1991192 2453 49.30 1613 32.50 100 2.00 807 16.20
1992/93 2515 49.50 1613 31.70 100 2.00 852 16.80
1993194 2596 46.10 2033 36.20 100 1.80 897 15.90 1994195 2656 43.50 2453 40.10 100 1.70 897 14.70
1995196 2661 43.20 2453 39.90 100 1.60 897 14.60
Source: Power Development m AP.: Statistics- 1995/96, APSEB. Note: In 1994/95 and 1995/96 there is also respectively 5MW and 44MW capacity of wind option, out of which only 2MW is state owned and the rest in private sector. Having a very poor load factor it has contributed only 8GWh in 1995/%.
Table-4.4.2 PATTERN OF ELECTRICITY GENERATION IN A.P.
I state sector
--HYDRO-- --THERMAL- --GAS--
-central sector-
YEAR GWh % GWh % GWh % GWh % 1960161 610 77.80 174 22.20 ---- -- --- -1979180 3225 49.70 3268 50.30 ---- -- -- -1989/90 7946 42.00 7461 39.40 -- -- 3550 18.60 1990/91 10231 48.60 8055 38.30 -- -- 2766 13.10 1991192 8894 38.20 9093 39.10 --- -- 5283 22.70 1992193 8795 34.50 9118 35.80 ---- -- 7548 29.70 1993194 8938 34.00 9270 35.30 525 1.90 17552 28.80 1994/95 10052 33.30 11317 37.50 431 1.40 8369 27.80 1995196 6602 21.70 15426 50.80 540 1.80 17814 25.70
Source: Power Development mAP.: Statistics- 1995/96, APSEB; Power Scenario, 1996/97, APSEB.
The state of Andhra Pradesh has 23 generating stations of which nine are thermal, and
fourteen are hydro and wind stations. The installed capacity in the state is 5258MW
comprising of 2661MW hydro, 2453MW coal thermal, lOOMW gas, and 44MW wind
capacities. The operation and maintenance of all these stations including Machkund
Hydroelectric (A.P. -Orissa joint scheme) are under the control of APSEB. The only exception
is the Tungha Bhadra Hydroelectric (A.P.-Kamataka joint scheme) which is managed by the
Tungha Bhadra Board. As per the agreements between the states, Andhra Pradesh and Orissa
have the right to share Machkund power in the ratio 70:30 and A.P. and Kamataka to share
power from Tungha Bhadra in the ratio 80:20. In addition to the capacity installed by the
I
I

Chapter4 127
state, the 897 MW central sector allocation to the state includes 580MW from NTPC,
277MW from Neyveli Lignite Corporation (NLC), and 40MW from Madras Atomic Power
Station (MAPS). Thus, the total installed capacity ofthe state amounts to 6155MW.
The tables indicate that both the installed capacity and A.P. generation have gradually
increased over the years. Besides the figures depicted above, one coal thermal project of
500MW capacity and five hyde! projects with a total 1135 MW of capacity are under
construction by APSEB. Moreover, there are other committed capacities within both the state
and private sectors. These include a total coal thermal capacity of 1800MW, about 600MW of
gas, and 650MW of naphtha based generation83. Most of the gas, naphtha and wind based
plants, and some coal thermal plants are entrusted to the private sector. The tables further
reveal the changing shares of the various options in the total installed capacity over the years.
Contrary to the increasing share of thermal capacities, the share of hydro in total installed
capacity has declined gradually over the years. The total A.P. generation has steadily
increased to 22568GWh in '95/96 attune to the increase in installed capacity.
The traditional procedure to planning involves minimizing the cost while meeting the
given requirements of load and reliability. However, one ofthe basic imperatives ofthe power
system is the hourly, daily, seasonal and regional fluctuations in power demand. Besides,
different generating options have different costs and techno-economic norms. Thus, to meet
the power requirements reliably and at least cost, an optimal mix of technologies is desirable.
It is uneconomical to instantly start and stop boiler operated thermal plants and other backstop
technologies designed for base load operation. Thus, the importance of hyde! and open cycle
gas/naphtha technology arises out of the necessity to have options that can be easily backed
off during off-peak hours.
With this objective ofrespondingto a fluctuating demand instantly and economically,
APSEB has tried to exploit the hydro potential of the state as much as possible besides adding
thermal capacity to the system. Thus, a very favourable hydro-thermal mix has been the
strong feature of Andhra Pradesh power system both for meeting the demand as well as
keeping the average cost down. As evident from the tables below both capacity and
generation of hydro and thermal options have increased steadily. The tables further indicate
that hydel power in Andhra Pradesh has throughout played a crucial role in effective system
management. During monsoon months hydro units supply power to their maximum capacity
and energy potential contributing to the base load of the system. Thermal units in this period
are mainly used as peaking units and are used to meet the rest of the demand. Sometimes
during years of very good monsoon, however, thermal units are used to meet the intermediate
load and hydro units meet the peaking demand besides catering to the base mode of the
83 The list of committed plants is presented in a later chapter on the assumptions and norms of the case study, i.e. chapter6.

Chapter 4 128 --~------------------------------------------------------
system. For post-monsoon periods, when hydropower is primarily dictated by the needs of the
irrigation system resulting in larger and faster withdrawals, thermal and hydel units switch
roles. Hydro units are always used to meet the peak load during post-monsoon periods. The
underlying principle is that during off-peak periods, when the system frequency goes up,
some plants need to be backed off instantly; and it is easier and economical to back-off hydro
plants at short notice. However, a caveat to such a system so immensely dependent on hydro
options is that crisis situations may arise during years of bad monsoon, as was experienced by
A.P. in '95/96. Hence, a predominantly hydro system also needs to build in sufficient
contingency reserves to tide along during crisis years.
Table-4.4.3 HYDRO AND THERMAL GENERATION IN A.P. (GWh)
YEAR --.....,Monsoon-
APGen. Hydro Thermal 4306 2317 1989 4859 2725 2135 5240 2835 2405
----.Post Monsoon:---- ----Whole Year-APGen. Hydro Thermal APGen Hydro Thermal
7864 3013 4851 12170 5330 6840 8648 3170 5477 13507 5895 7612 8415 2860 5555 13655 5695 7960
1985/86 1986/87 1987/88 1988/89 1989/90 199_0/91 1991/92 1992/93 1993/94
5107 3380 1727 9010 3662 3970 5556 4230 4984 4429 5013 3493
5348 14117 7042 7075 5527 3976 6921 4675 6775 4664 6146 3809 6922 4511
1994/95 8004 5037 1995/96 7453 3109
1551 9880 2246 11366 2111 11212 2337 11767 2411 11811 2968 4343
13796 15115
Source: Power Scenario 1996-97, APSEB.
5910 15407 7946 7461 5809 18286 10231 8055 6982 17987 8894 9093 6783 17913 8795 9118 7382 18733 8938 9795 8782 21800 10052 11748
11623 22568 6602 15966
Table-4.4.4 SHARE OF HYDRO AND THERMAL IN TOTAL A.P. GENERATION ---Monsoon--
YEAR Hydro Thermal 1985/86 0.54 0.46 1986/87 0.56 1987/88 0.54 1988/89 0.66 1989/90 0.72 1990/91 0.68 1991/92· 0.69 1992/93 0.62 1993/94 0.65 1994/95 0.63 1995/96 0.42
0.44 0.46 0.34 0.28 0.32 0.31 0.38 0.35 0.37 0.58
Note: Obtained from Table above.
---...,Post Monsoon-- --Whole Year--Hydro Thermal Hydro Thermal 0.38 0.62 0.44 0.56 0.37 0.34 0.41 0.40 0.49 0.38 0.42 0.37 0.36 0.23
0.63 0.66 0.59 0.60 0.51 0.62 0.58 0.63 0.64 0.77
0.44 0.42 0.50 0.52 0.56 0.49 0.49 0.48 0.46 0.29
0.56 0.58 0.50 0.48 0.44 0.51 0.51 0.52 0.54 0.71
The tables also testify that the share of hydro relative to that of thermal has been
declining since '90/91. Although hydro potential has been harnessed to a great extent in A.P.,
still there remains a reasonably large hydro potential untapped. The rationale behind such an
observable shift in favour of thermal options may be sought in the following:

Chapter 4 129
• shorter lead times for thermal over hydro options, thereby allowing faster response to
demand increases,
• coal represents major fossil fuel energy resource in A.P., which too should be harnessed
to the maximum permissible limit,
• cost of hydro projects are project specific, and the initial costs involved are generally
much more than thermal options,
• interstate water disputes, rising costs and interest during construction, inadequate funding,
delays in decision making on land acquisition, non standardization of unit size and plant
design, faulty construction management, environmental problems, concerns regarding
relocation of thousands of people, and objections and agitation by local pressure groups.
5. Performance & Environmental Status of Power Plants in A.P.
The performances of thermal plants in A.P. are worthy of praise for they operate
efficiently on a consistent basis. A comparison of the performance indicators of A.P. with '
their all India averages, central sector, and private sector, as in Table-4.5.1 below, shows that
power plants of this state have been consistently doing better in terms of plant load factors
(PLF) and plant availability (PA). The only factor that used to be somewhat lower compared
to that in the private sector was the forced outage rate. However, the state has also made
substantial progress in this direction since '92/93, mainly through refurbishment and
modernization of its existing plants, besides scheduling planned outages judiciously. A.P.
power system being endowed with a well-balanced hydro-thermal system can schedule its
maintenance downtime in a manner such that thermal plants have their planned outages
during monsoon periods and hydel units during post-monsoon periods. This has allowed the
system to achieve and maintain a high PA factor.
The reasons for achieving the high PLF are many. It is true that efficient performance
of thermal plants during the post-monsoon periods, when the demand for both energy and
power are also higher, have been responsible for high PLFs in the system. Moreover, the huge
hydro capacity of the system, used both for meeting peak and off-peak demand, enables the
thermal plants to achieve a high system PLF. The hydro options can be easily backed off
during off-peak periods as compared to the thermal plants. However, even in the presence of a
high P A it may not be able to achieve a high PLF of the system on a consistent basis without
suitable demand management to maintain a high system load factor (SLF). The data in the
table below shows the performance of A.P. plants during years when restrictions and
curtailment (R&C) policy of the board was in force. The objective of R&C policy was to
manage and balance the system load, balance the system frequency and raise the SLF. This
may also have contributed to a high average PLF of the system in A.P. over the past years. It

Chapter 4 130 --~~~-------------------------------------------
has been empirically observed that systems heavily dependent on hydro potential have PLF of
thermal plants inversely related to the inflow of water into the reservoirs. However, the fact
that A.P. has maintained a high PLF, with only minor changes in PLFs, irrespective of
inflows substantiates the explanation forwarded in terms of the influence of high SLF rather
thanPA.
Table-4.5.1 PERFORMANCE INDICATORS OF THERMAL POWER PLANfS IN ANDHRA PRADESH rp_ercm~
YEAR 1989/90 1990/91 1991192 1992193 1993194 1994195 1995196
A.P.PA 77.90 78.10 77.40 82.20 83.30
A.P.PLF 66.10 65.80 62.10 65.00 68.70 70.20 78.16
A.P.FOR 12.73 12.36 11.28 5.70 8.20
A.P.AC 9.90 9.70 9.90 10.00 10.00 9.40
A.LPA 74.00 71.70 72.80 76.60 78.00
A.LPLF 56.50 53.90 55.30 57.10 61.00 60.00
AI FOR 15.47 16.49 15.19 16.50 13.20
A.I.AC 9.83 9.74 9.61 9.50 C.S.PLF 62.20 58.10 64.50 62.70 69.80 69.20
C.S.FOR 13.90 15.30 13.50 15.20 10.20
P.S.PLF 69.50 58.40 64.50 54.10 56.60 65.90 P.S.FOR 4.33 5.20 8.60 7.30 9.90 Source: Annual Report on the Working of SEEs and Eds, Plann.Comm., GO I, 1994 & 1995 Note: A.P.=Andhra Pradesh., A.I.=All India, C.S.=Central Sector, P.S.=Private Sector, PA=Plant Availability,
PLF=Plant Load Factor, FOR=Forced Outage Rate, AC=Auxiliary Consumption
Table-4.5.2 CALORIFIC VALUE OF COAL USED IN THE V ARlO US COAL THERMAL PLANTS IN ANDHRA PRADESH (KCal/Kg)
YEAR 1989190 1990191 1991192 1992193 1993194 1995196 Vijaywada Kothagudem Ramagundam Nellore Rayalseema
3569 3466 3445 3459 3483 3318 3280 3226 3927 3791 2997 2972
3095 3562 2835
3140 3616 2446
Source: Performance Review of Thermal Power Stations, 1993/94, APSEB.
3151 3575 2625
Table-4.5.3 ASH CONTENT OF COAL USED IN THE VARIOUS COAL THERMAL PLANTS IN ANDHRA PRADESH rp_ercm~
YEAR 1989190 1990191 1991192 1992193 1993194 vijaywada 48.74 45.95 46.93 43.73 45.20 kothagudem 40.98 48.99 46.18 43.65 43.11 ramagundam 34.34 36.86 43.57 45.59 46.59 neUore 42.45 49.54 51.44 50.98 50.17 Source: Performance Review of Thennal Power Stations, 1993/94, APSEB.
2968 3783 3422 3544

Chapter 4 131
Table-4.5.4 Cumulative Performance Indices of Thermal Units (April'95- March'%) Station/ Rated Energy AF PLF Aux Coal Sp. Oil Sp. Coal No. Heat Rate
unit Coal Oil of capacity Genera- Cons Cons Cons Cons Cons cv Out- Desig Actu
-tion (kcal/ -age n al kg) days
MW MU 0/o 0/o 0/o Tons Kg/ KL mil Kcall Kcal Kwh Kwh Kwh I
Kwh VTPSI Unit -I 210 1621.13 92.32 87.88 8.37 1182399 0.73 1136 0.7 3360 17 2351 2457 Unit-D 210 1623.61 91.97 88.02 8.03 1189831 0.73 1291 0.8 3357 24 2351 2468 Sub Total 420 3244.74 87.95 8.2 2372230 0.73 2427 0.75 3359 41 2351 2463 VTPSD Unit-ill 210 1693.74 94.23 91.82 9.1 1241271 0.73 1124 0.66 3333 14 2303 2449 Unit-IV 210 1712.18 93.67 92.82 8.35 1254144 0.73 1212 0.71 3314 16 2303 2434 Sub Total 420 3405.92 92.32 8.73 2495415 0.73 2336 0.69 3323 30 2303 2442 VTPSID Unit-V 210 1738.04 95.88 94.22 7.87 1275769 0.73 1652 0.95 3291 30 2251 2425 Unit-VI 210 1469.05 99.46 98.2 7.95 1092015 0.75 4027 0.79 3250 37 2251 2332 Sub Total 420 3207.09 95.69 7.9 2367784 0.74 5679 0.89 3271 67 2251 2432 VTPS 1260 9857.75 98.71 8.3 7235429 0.73 10442 0.77 3318 130 2302 2445 Complex KTPS-A Unit -I 60 299.16 87.91 56.76 9.93 332951 1.11 1212 4.05 3006 10 2755 3385 Unit-D 60 319.51 94.24 60.62 9.71 356311 1.12 1359 7.25 3006 9 2755 3394 Unit-m 60 294.67 93.41 55.91 10.22 328933 l.l2 1429 4.85 3006 12 2755 3403 Unit-IV 60 304.99 98.76 57.87 8.85 340268 1.12 1209 3.96 3006 16 2755 3392 Sub Total 240 1218.33 57.79 9.68 1358463 l.l2 5209 4.28 3006 55 2755 3393 KTPS-B Unit-V 105 558.94 8l.l3 60.6 12.48 606837 1.09 1604 2.87 2971 16 2472 3254 Unit-VI 105 559.04 76.68 60.61 12 599498 1.07 1346 2.41 2971 22 2472 3210 Sub Total 210 ll17.98 60.61 12.24 1206335 1.08 2950 2.64 2971 38 2472 3232 KTPS-C Unit-VD 110 582.37 85.64 60.27 11.52 647352 l.l1 3132 5.38 2892 27 2447 3267 Unit-vm 110 495.2 75.98 51.25 11.26 546532 1.1 3586 7.24 2892 20 2447 3263 Sub Total 220 1077.57 55.76 11.39 1193884 l.l1 6718 6.23 2892 47 2447 3265 KTPS 670 3413.88 58.01 11.06 3758682 l.IO 14877 4.36 2956 140 2607 3298 Complex RTPP Unit-1 210 348.14 292168 6699 - 3544 2251 3164 Unit-II 210 979.37 88.31 70.85 12.12 784370 0.81 11323 7.27 3544 112 2251 3032 Total 420 1327.51 70.85 12.12 1076538 0.81 18022 7.27 3544 3098 RTPP RTS-B 62.5 374.38 81.87 68.19 8.75 232349 0.7 1640 4.38 3783 29 2616 2694 NTS 30 129.34 98.76 49.08 15.19 142229 l.l 1288 9.96 3422 34 2916 3861 Total 2442.5 15102.9 78.16 9.25 12445227 0.83 46269 2.17 3405 453 2550 2842 Thermal Source: APSEB.
The Tables-4.5.2 to 4.5.4 above display the performance parameters of the thermal
power plants in A.P. and the quality of coal used by these plants. Coal for the thermal plants
in A.P. comes mainly from the local coalmines in Godavari Valley- Singareni and
Ramagundam coal mines among others. Recently, however, coal has also been obtained from
Talcher coalfields in Orissa. The coal supplied by these coalmines is generally poor quality F-
grade coal with a heavy ash content. The boilers are mostly not designed to cater to such poor
quality coal with such high ash contents. Ifthe exclusively F-grade coal supplied is used, then
the secondary fuel consumption for the thermal plants needed to stabilize the boiler
temperature is also substantially increased. However, as indicated in the above tables, A.P. in

Chapter4 132
order to maintain high performance standards has been using mixed grades coal, i.e. mixing
higher grade coal acquired at a higher price with lower grade coal, so that the calorific values
and ash content has been moderately stable rather than declining. These and several other
factors have contributed towards a declining secondary fuel consumption over the years, as
shown in Table-4.10.4 later. Consequently, there is hardly any change in the average specific
coal consumption in the thermal plants, along with some exceptional performance by plants
like VTPS and RTPP. The thermal plants in A.P. have been consistently receiving incentive
awards for exceptional performances for the past few years. Table-4.5.4 above details the
performance of the thermal power plants in A.P. in '95/96. It is clearly evident that except for
KTPS and NTS the performances of all the plants are laudable. KTPS being the oldest of the
plants and NTS the smallest failed to achieve standards that the other plants did. However,
recent efforts towards plant renovation and updates have made substantial contributions and
are expected improve things further in future if sufficient funds are allocated for this.
However, one basic problem with the existing A.P. system is its lack of adequate
peaking thermal plants. As already mentioned, at present hydel plants are used for peaking
purposes, supported by thermal plants designed for base load operations. The gas plants
operated in the system are of the combined cycle type which, although highly efficient and
economical, are designed as base and intermediate load plants. With a rapidly growing peak
demand in the system it may be useful and cost effective to have some exclusively peaking
thermal plants in the system.
In the wake of environmental awareness and regulations imposed by the ministry, the
status of power plants in A.P. is broadly in compliance with the existing standards. Regular
environmental audits are carried out for each of the plants, and a special cell in APSEB looks
after the environmental issues involved.
The audit reports with the APSEB for the past years confirm that all the units of the
thermal power plants are fitted with electrostatic precipitators (ESPs) with microprocessor
based controllers to limit suspended particulate matter (SPM) levels. The Table-4.5.5 gives
the stack emission data for thermal power plants in A.P. for years 1994/95 and '95/96. As
Indian coal has low sulphur content and high sulphur imported coal is not yet used so the
plants are not fitted with Flue Gas Desulfurization units (FGDs). Notwithstanding the ability
of the installed ESPs to arrest 99.8% of SPMs, most of the thermal plants are unable to
mitigate to the full extent. This aberration is mainly due to inadequate maintenance of ESPs,
lack of operational efficiency to keep the flue gas temperature within stipulated limits, and
higher ash content of coal compared to the design of the ESPs. Some additional measures,
such as lime injection and flame adjustments, are currently employed to keep the emission
level as low as possible. Gas plants instead of installing FGDs are presently using burners
designed to restrict the emissions of SOx and NOx. However, with the gradual use of imported

Chapter4 133
coal, more gas, and LNG these units would have to be eventually fitted with appropriate
mitigation instruments. The plants are designed and constructed with stacks of appropriate
heights. All plants at present, excepting VTPS, use natural cooling towers; and is expected
that the future plants would have spiral cooling tower.
Regarding the monitoring of stack emissions and ambient air quality, APSEB
monitors the emissions once or twice a month continuously for twenty-four hours. The TSP
monitoring instruments used in the plants are mobile and are not buih into the stacks.
Moreover, pre-stack and post-stack monitoring are not separately carried out. However, there
is a firm proposal for using buih-in monitoring instruments in future. For monitoring ambient
air quality in the surrounding area APSEB takes the help of private consuhants. These private
consuhants with the aid of air dispersion models use their expertise to provide APSEB with
the required information and suggestions. Recently, however, APSEB has also developed in
house competence in this area with the help of the Environmental Division at VTPS. Training
for conducting tests on stack emission, monitoring ambient air quality and environmental
management is imparted on a regular basis to the staff of the environmental cell.
Table-4.5.5 STACK EMISSIONS FOR THERMAL POWER PLANTS IN A.P. SPM (mg1Nm3
) S02 (mg 1 Nm3) NO" (mg I Nm3
)
1994195 1995196 1994195 1995196 1994195 1995196 VTPS-1 328 480 717 264 21 20 VTPS-II 299 395 522 228 42 22 VTPS-III 336 350 535 228 36 16 VTPS-W 271 190 472 202 55 16 VTPS-V 100 184 12 VTPS-VI 120 198 18 KTPS-1 268.04 312 40.60 17 8.00 7 KTPS-11 168.03 279 44.30 16 9.45 6 KTPS-111 358.50 2423 89.41 23 23.58 7 KTPS-W 505.75 401 35.84 18 8.00 5 KTPS-V 231.90 368 40.26 17 8.30 9 KTPS-VI 242.88 318 40.51 18 8.27 8 KTPS-V/1 219.77 378 48.33 14 6.94 6 KTPS-VIII 283.38 332 42.63 14 7.88 5 NTS-1 252 450 55 62 46 12 NTS-II 236 297 30 42 7 14 RTS-1 263.92 176 492.11 124 34.38 38 Vijjeswaram-1 traces traces 100 41 Viji.eswaram-11 traces traces 112 42 Source: APSEB Audit Reports.
In view of the fact that most plants, particularly the older plants, inspite of conscious
efforts of the board, are unable to fully conform to the environmental standards forwarded by
the ministry; APSEB has appealed to the pollution control boards to raise the SPM standards
to 600mg/Nm3. This appeal has been made mainly on the basis of the incompatibility ofthe

Chapter 4 134
poor quality coal having high ash content with the installed ESPs and the operational
inefficiency due to old age of plants such as KTPS.
Afforestation and the development of 'green belts' around the thermal power plants
have distinct environmental advantages. With NTPC indulging in extensive afforestation
around the thermal plant in Ramagundam, an improvement in the overall ecological condition
of the entire area has been experienced. In view of this it is proposed that all existing and
future thermal plants should indulge in greening of the area surrounding the thermal plants.
Although all plants are furnished with oil and grease trapping devices, non of these
devices function properly. Adequate measures are being undertaken to ensure the proper
functioning of these devices. Moreover, none of the plants has provisions for liquid effluent
treatment. Concerned by this fact, APSEB has prepared designs and drawings of the treatment
plants and has communicated to the field authorities for immediate implementation.
However, the most serious hurdle facing the thermal plants involve disposal of
colossal quantities of ash produced every day. The cumulative ash stock piling up outside the
thermal plants is a major environmental hazard. Only about 5% of the ash produced is taken
away by the cement industries and few additional percent by other industries. The rest of it is
dumped either in ash-ponds or simply left in a pile outside the plants. Hence, adequate
measures need to be immediately implemented to stall further degradation of the environment
and contamination of groundwater. The ash management measures initiated in VTPS have to
be extended to other power plants with immediate effect.
6. Transmission and Distribution
An efficient and cost effective power system of a state requires a well-developed
transmission and distribution (T&D) network, and integration ofthe system to the regional
and national grid. Integration of the system brings down the total capacity requirement
considerably, and hence the cost of the investment plan for obvious reasons. The steady state
performance of the system requires that line and transformer limits not be exceeded under
normal loading and operating conditions, or with single contingencies such as loss of one line,
transformer or generator. Moreover, the location of new sub-stations and primary feeders, and
the up-gradation and operation of the existing ones, should be such as to meet the peak and
off-peak consumer demand within acceptable voltage limits under both normal conditions and
emergency conditions.

Chapter 4 135
Table-4.6.1 PROGRESS IN T&D UNES AND SUB-STATIONS IN A.P.
[A] TRANSMISSION & DISTRIBUTION UNES ( Circuit Km)
YEAR 220KV 132KV 66KV 33KV llKV LT TOTAL 1960 na na na 2833 11918 13738 28489 1971 1144 2473 2743 6163 33185 49584 95292 1980 2428 4231 2623 10188 62427 107614 189511 1986 3839 4578 1811 15170 91087 183461 299946 1991 4987 7612 1570 19064 123460 285110 441803 1995 6900 9897 420 24334 148101 382270 571922 1996 7189 9954 420 25069 150540 392787 585959 Source: Power Development in AP.: Statistics- 1995/96, APSEB.
(B] SUB-STATIONS (NUMBERS) YEAR 220KV 132KV 66KV 33KV TOTAL Distribution
Tranf[ormers 1960 na 8 24 60 92 4667 1971 4 23 34 192 253 18133 1980 11 36 35 353 435 34701 1986 17 74 19 635 745 53830 1991 27 108 14 986 1135 88054 1995 44 155 6 1340 1545 131692 1996 47 154 6 1420 1627 141839 Source: Power Development in AP. : Statistics- 1995/96, APSEB.
Table-4.6.2 OUTLAY IN T&D UNDER FIVE YEAR PLANS IN ANDHRA PRADESH Period( at the end of) Transmis- Distribu- Outlay propn.of propn.of
-sion -tion on Power totL outlay totL Outlay (RsCrores) (RsCrores) (RsCrores) on trans. on distrbn.
1st piml1951-56 na na 37.84 2nd piml1956-61 17.78 38.53 0.46 3rd piml1961-66 8.52 21.81 93.61 0.09 0.23 Three annual plans 1966-69 22.14 19.21 97.96 0.23 0.20 4th plan 1969-64 13.44 54.31 190.58 0.07 0.28 5thplml 1974-78 35.05 51.92 385.61 0.09 0.13 Two annual plmls 1978-80 40.02 51.48 309.27 0.13 0.17 6th plan1980-85 159.33 82.40 737.98 0.22 0.11 7th plan 1985-90 178.99 220.45 1173.51 0.15 0.19 Annual plan 1990-91 77.26 65.48 360.85 0.21 0.18 Annual plan 1991-92 73.22 60.60 428.40 0.17 0.14 8th plan 1992-93 83.97 113.41 916.62 0.09 0.12 -do- 55.93 124.91 1015.59 0.06 0.12 -do- 141.54 226.99 1216.85 0.12 0.19 -do- 59.31 80.48 979.29 0.06 0.08 Source: Power Development in AP.: Statistics- 1995/96, APSEB.
APSEB's T &D system has grown into a very large network as evident from the
Tables-4.6.1-4.6.2 above. The state has a fairly laid out 220KV network of 7189ckm for
transmission of power from the major generating stations to the major load centre via 47 nos.
of 220/132KV sub-stations; and 10374ckm of 132KV and 66KV for further transmission of
power to the other load centres via 160 nos. of 132/33KV sub-stations. The 33KV sub
transmission consists of 25069ckm lines feeding the llKV primary distribution and L.T.

Chapter 4 136
secondary distribution lines VIa 1420 nos. of 33/llKV sub-stations. The primary and
secondary distribution network spans the entire state through 150540ckm and 392787ckm
lines and distributes power via 141839 nos. of distribution transformers. The growth of the
T &D network, as evident from the above tables, has been to a great extent influenced by the
rural electrification programme and the board's socio-economic objective of serving the
domestic and agricultural sectors. The 220KV and 132KV system has a strung overlay of
400KV network of Power Grid Corporation. The 400KV system is connected at several
points to the 220KV and 132KV levels. Apart from the 400KV network, A.P. is connected
with Madhya Pradesh at 220KV AC and 1 OOKV HVDC. Moreover, the Southern Region is
connected with the Western Region through Chandrapura-Ramagundam 400KV line, and the
Eastern Region is connected with the state at 220KV level.
Notwithstanding the progress of T&D network in A.P., it may be observed from
Table-4.6.2 that the development of the power sector has been lopsided with the primary
weightage of outlay on generation. This has led to gross under-investment in T &D over the
years, as evident from the declining share of outlay on T &D in the above table. Inadequate
attention to the development of T &D has resulted in poor quality of service due to massive
voltage fluctuations, transformer breakdowns, and line outages. Besides, also notable is the
lack of co-ordination between the capacity additions in generation and T &D required to
evacuate power from these stations.
Table-4.6.3 T&D LOSSES AS A PERCENTAGE OF AV AILABIUTY AND NUMBER OF THEFTS & MALPRACTICES DETECTED IN A.P.
YEAR T&DLoss(%) Thefts (Nos.) Malpractices(Nos.) 1990191 19.62 1387 3281 1991192 19.30 1323 3502 1992193 19.20 1650 4600 1993/94 19.10 3164 2753 1994195 18.94 1725 2894 1995196 18.85 5863 6124
Source: Power Development in AP.: Statistics- 1995/96 Annual Report on the Working of SEBs and EDs, Plann.Comm., GOI, various issues.
Table-4.6.3 above testifies that APSEB has continued to suffer from high T&D
losses, with minor improvements in recent years. In absolute terms, the losses at 18.85%
continue to remain much above that in the advanced countries. The persistence of high T &D
losses in the state is a consequence of both technical and non-technicallosses. The technical
losses arises from:
• low priority accorded to T &D against generating capacity,
• high priority accorded to rural electrification resulting in long lines with low power
factor,
• massive transformer losses due to over abundance of transformation stages,

Chapter 4 137
• inadequate reactive compensation in the system,
• improper load distribution resulting in system overloading,
• transformer and line losses occurring because of poor maintenance and care.
The technical losses account for only one third of the total T &D losses. What is
reported as T &D losses, in the above Table, also includes losses due to thefts (both detected
and undetected) and unaccounted for energy losses. The entire non-technicallosses amount to
approximately two thirds of the total T &D losses. The figures in the above Table have an
implicit element of inaccuracy because substantial portions of the losses remain undisclosed.
Non-technical losses like pilferage & thefts and malpractices have been growing steadily over
the years. Bulk ofthe T&D losses through thefts, unmetered supply, wrong meter reading due
to meter tampering, and other malpractices mostly occur at the llKV and LT levels, i.e. at the
primary and secondary distribution level. Massive extension of the L. T. level lines and
connections, attune to the preferential policies towards agricultural and domestic sectors, have
enhanced the scope of thefts and malpractices. The hefty non-technical losses along with the
technical losses have been to a great extent responsible for the depleting finances of the board.
7. Demand-Supply Balance
Investments in generating capacities have not been able to keep pace with the fast
growth in peak demand. Consequently there has been a perpetual peaking capacity shortage in
the state for the past many years. During the decade of the '70s Andhra Pradesh had enjoyed
an excess power supply situation. However, over the years the power situation in the state has
deteriorated, widening the gap between demand and supply, both in terms of peak and energy
demand. On the supply side capacity additions are inadequate mainly because of poor
financial situation of the board along with a host of other closely related problems. On the
demand side unrestrained consumption growth along with hefty losses are a consequence of
the lopsided and often irrational policies and socio-economic objectives of the board. The
high consumption growth in the agricultural sector is accentuated by increased demand
through additions of about llakh pumpsets every year and exceptionally low tariff structure.
This growing agricultural demand, along with growing additions to services in the domestic,
L.T. and H.T. sectors (as is evident from Table-4.2.1) far exceeds the capabilities of the state
to meet requirements. Considering the planning commission estimates, with peak at 600 lMW
and energy requirement of 35082GWh by the end of the eighth plan (1996/97), the deficit is
expected to deteriorate considerably and hover at around roughly 30% of the requirements.
However, according to the High Level Committee (set up in A.P. under the chairmanship of
Shri. Hiten Bhaya, 1995), even if the expectations of capacity additions materialize by the end

I
Chapter 4 138 --~------------------------------------------------------
of the eighth plan and during the ninth plan, a gap of about 2000MW or more would still
persist upto the end of the ninth plan.
From the Tables-4.7.1 and 4.7.2, illustrating generation, imports, and availability
(including imports) of energy, in A.P., it is implicitly evident that with widening gap between
energy requirement and generation the import of energy has gone up to meet the
requirements. Particularly noteworthy is that the post-monsoon imports dominate over the
imports during monsoon periods. Further, the share of import during the post-monsoon period
has been increasing over the years. Given the structural composition of demand in A.P. this is
not an unusual phenomenon. Agricultural demand for electricity is higher during the post
monsoon period for irrigation purposes. Moreover, the weather during this period in A.P. is
such that the demands by the domestic and commercial sectors are also high. These together
impose pressure on the power system, lowering the frequency considerably, during the post
monsoon months when the energy generation from the hydro projects is lower, even under
normal hydro conditions. Consequently, the energy imports and drawdown from the regional
grids are higher during these months compared to the monsoon period.
Table-4.7.3 gives the break up of imports from the various sources during the
monsoon and post-monsoon periods. The table shows that the net imports of Andhra Pradesh
have increased over time. Besides major portion of the import~ coming from the Central
Generating Stations (CGS), energy is also obtained from Vijjeswaram Gas Station, other
private operators, and the neighbouring state electricity boards. Occasionally a very small .
fraction is exported and that too mostly during the monsoon season. With demands far in
excess of A.P. generation, the imports are higher during the post-monsoon period.
Table-4.7.1 ENERGY AVAILABIUTY IN A.P. (G'Wh)
I Monsoon I Post Monsoon- I Whole Year--jYEAR IAPGen. Import Availbty. I APGen. Import Availbty.j APGen. Import Availbty.
ji985/86 1 4306 292 4598 I 7864 1916 978o 1 12110 2208 14378 11986187 I 4859 331 5190 I 8648 1484 10133 I 13507 1815 15323 11987188 I 5240 440 5681 I 8415 1647 10059 I 13655 2087 15740 11988/89 I 5107 372 5479 I 9010 2947 11957 I 14117 3319 17436 11989/90 I 5527 769 6296 I 9880 2867 12748 I 15407 3636 19044 11990/91 I 6921 253 7174 I 11366 3034 14399 I 18286 3287 21573 11991/92 I 6775 1430 8204 I 11212 4420 15633 I 17987 5850 23837 11992/93 I 6146 2331 8477 I 11767 5951 17718 I 17913 8282 26195 11993194 I 6922 2339 9261 I 11811 6402 18213 I 18733 8742 27475 11994/95 I 8004 2510 10514 I 13796 6796 20592 I 21800 9306 31106 11995/96 I 7453 2629 10082 I 15115 6443 21558 I 22568 9073 31640 Source: Power Scenario 1996-97, APSEB. Note: Monsoon (July-October), Post-Monsoon (November-June)

Chapter4 139
Table-4 7 2 SHARE AND GROWfH RATES OF A.P. GENERATION AND IMPORTS .. Share in tot avail. Five yearly growth rates % Growth over previous year (IAJ)
Year A.P. gen Import A.P.gen Import Avail A.P.gen Import
1985186 0.85 0.15
1986187 0.88 0.12 10.99 -17.80
1987188 0.87 0.13 1.10 14.99
1988189 0.81 0.19 3.38 59.03
1989190 0.81 0.19 9.14 9.55
1990191 0.85 0.15 8.48 8.28 8.45 18.69 -9.60
1991192 0.75 0.25 5.90 26.37 9.24 -1.64 77.97
1992193 0.68 0.32 5.58 31.74 10.72 -0.41 41.57
1993194 0.68 0.32 5.82 21.37 9.52 4.58 5.55
1994/95 0.70 0.30 7.19 20.68 10.31 16.37 6.45
1995196 0.71 0.29 4.30 22.52 7.96 3.52 -2.50
Note: Obtamed from table above.
Table-4.7.3 COMPONENTS OF IMPORTS
[A] MONSOON (GWh) monsoon
YEAR CGS VGTS captives MPEB MSEBIWREB OSEB NET IMP. 1990191 256 1 (4) 1991192 1340 86 15 (11)
1992193 2096 130 9 53 1993/94 2006 138 16 1994195 2284 163 27 23
{B] POST -MONSOON post-monsoon
YEAR CGS VGTS captives MPEB 1990191 2510 163 33 12 1991192 3943 310 49 69 1992193 5452 303 49 93 1993194 5546 386 98 54 1994195 6085 265 71 54
Source: Power Scenario 1996/97, APSEB. Note:
44 180 11
253 1430 2331 2339 2510
(GWh)
MSEBIWREB OSEB NET IMP. 268 48 3034 60 (11) 4420
54 5951 319 6402 49 271 6796
Avail
6.57 2.72 10.78 9.22 13.28 10.49 9.89 4.89 13.22 1.72
• CGS= Central Generating Stations ( NTPC, Neyveli Lignite Corp., Madras Atomic Power Station); VGTS= Viijeswaram Gas Thermal Station (Joint Venture of APSEB and some participating industries); MPEB= Madhya Pradesh Electricity Board; MSEB= Maharashtra State Electricity Board; WREB= Western Region Electricity Board; OSEB= Orissa State Electricity Board
• The figures in brackets represent export from APSEB.
The major sources of import during this period are the CGS and other state electricity
boards. Table-4.7.4 gives the contribution of CGS to the total A.P. availability over the years.
Andhra Pradesh is allocated 897MW of power from all the Central Generating Stations. The
unallocated power from these stations, which currently amount to about 550MW, is
reallocated to the beneficiary states depending on their power requirements. Particularly

Chapter 4 140 ~~~~-------------------------------------------
during times of distress due to acute power shortage the Central Generating Stations consider
reallocation taking the extent of shortage of the state into consideration. As per the latest
decision about 50% of this unallocated power is allocated to Andhra Pradesh, contributing an
additional capacity of 204MW towards its requirement.
Table-4.7.4 SHARE OF A.P. IN CENTRAL GENERATION AND A.P.'s ACfUAL UTIUZATION {Gwh}
YEAR Fed to grid APshare A.P. utln A.P. share A.P. utln
1985186 4024 1088 2363 0.27 0.59 1986187 6592 1520 1663 0.23 0.25 1987188 8309 1847 1806 0.22 0.22 1988189 9638 2382 2749 0.25 0.29 1989190 12107 3177 3402 0.26 0.28 1990191 12158 3196 2766 0.26 0.23 1991192 16298 4483 5283 0.28 0.32 1992193 18819 5549 7548 0.29 0.40 1993194 21036 6329 7552 0.30 0.36 1994195 22521 6680 8369 0.30 0.37 Source: Power Scenario 1996/97, APSEB
As already mentioned above, APSEB has been importing power from the private and
captive operators during the formidable power situations ofthe post-monsoon months. Over
the past decade, during times of dire crisis APSEB has often approached the captive operators
to pump energy into the grid. Responding to this plea the Vishakapatnam Steel Plant, HPCL,
and the Manugur Heavy Water Plant have consistently contributed to the extent possible.
Besides, assistance was also sought from the neighbouring states during periods of acute
power shortage since the late '80s. The fact that over the decade private contribution has gone
up, and policies to encourage captive generation and sales to board are being formulated,
indicate the earnest attempt being made by the board to bridge the widening demand-supply
gap.
8. Restrictions and Curtailment Policy
As already discussed, Andhra Pradesh between 1976/77 and 1985/86 had enjoyed
unconstrained power supply. However, this period was followed by a period of formidable
power shortage since the mid-80's. Interplay of several related factors has resulted in massive
growth in power demand during this period. Such excessive and growing demand has
maintained a continuous pressure on the system. Consequential to the excessive load on the
system, pressing against generation and T &D capacities, the system frequency was severely
affected. Ever since, APSEB has been registering very poor system frequency. Even though
the statutory limits specify a minimum of 48.5 Hz, the frequency in Andhra Pradesh has been
barely hovering around 43-45 Hz for most of the time, and sometimes goes down even
further. This not only causes partial brown- and blackouts, thereby adversely affecting the

Chapter 4 141 --~--~-------------------------------------------
end-use appliances and productive processes, but also in the extreme case leads to major
faults and total grid disintegration. The A.P. system being, to a great extent, dependent on the
hydro generation option performs miserably during years of bad monsoon. It is particularly
during these periods that the frequency of the system dips drastically. Under regular
conditions also the frequency in A.P. is particularly low and fluctuating during the irrigation
months (November-April). Moreover, inadequate investment in T&D and a lopsided
development of the power sector has exacerbated the situation even further.
Unable to meet the unconstrained demand and seeking to tackle the crisis at hand,
APSEB has adopted Restriction and Curtailment (R&C) policies as load management
measures since 1986/87. The most frequently adopted measures include load rostering,
reduction of contracted power, and scheduled power cuts. However, the policies adopted by
the board, mainly because of State pressure, have a distinct bias against industry. Power cuts
imposed on the H.T. customers are between 30% and 60% as energy restrictions and between
25% and 50% as peak demand shaving. Besides, the Board has started getting into lower
contractual agreements of power supply with the power intensive H.T. industries. According
to the policy of the Board no power cuts are imposed on the agricultural sector. The only tool
employed to curb agricultural consumption is load rostering. The commercial and domestic
sectors are subjected to scheduled power cuts of both energy and peak load. The impacts of
these policies on the apparent growth rates of the various sectors are detailed in Table-4.2.5.
Growth rates of the sectors in the pre- and post-power cut era indicate the plight of the
industrial sector due to the R&C policies. It is observed that the energy growth rates of all the
sectors except the agricultural sector have substantially declined consequent upon the R&C
policies. Even peak demand growth rate has been brought down from 11.94% to 6.19%
through effective power cuts. The most phenomenal decline in growth rate is observed for the
H.T., i.e. from 13.34% to 0.9%. According to the High Level Committee Report, industrial
H.T. has declined from 12% to 2.5% mainly because of the power cuts. Consequent upon lack
of power availability, several industries have been experiencing under utilization of capacity
over the length of the power cut period. Besides, with the objective of cross-subsidizing the
agricultural and domestic sectors, the industries are charged tariffs much above the average
cost of electricity supply. High and growing tariffs along with unreliable poor quality and
restricted availability of power, have not left the industries with much of a choice but to either
set up their own captive units or move to other states.
Captive power generation in A.P. has been mainly in the iron & steel, cement,
chemical and process industries. Even though in absolute terms the total capacity is small,
both capacity and generation is going up quite steeply. It has come up to a capacity of924.7
MW generating 3745.31GWh of energy in 1995/96 from a capacity of 804.4MW generating
2999.58 GWh of energy in 1994/95. The captive capacity has registered a growth of 15%,

Chapter 4 142 --~------------------------------------------------------
with generation going up by 25% approximately. Thus, industries being unable to receive the
desired quality and quantity of power from the board, due to availability shortage and
consequent R&C policies, have turned to captive generation in a big way.
In this context it may be pointed out that the declining share of industrial
consumption (sales) and the increasing share of agricultural consumption, as indicated in an
earlier table, may be due to the lopsided R&C policies implemented by the Board. It could
also be the case that the industries are indulging in conservation measures to come to terms
with the poor quality and quantity of power supplied to them. Thus, autonomous energy
efficiency improvement along with conscious conservation measures and forced curtailment
have together brought about declining industrial sales. However, the agricultural sector being
unaffected to any great extent, continued to register a steady growth in consumption over the
years. In the absence of load rostering in agriculture, wasteful consumption and malpractices
are observed due to lack of adequate incentive for agriculturists to voluntarily act otherwise.
Thus, the policy advocated for the agricultural sector was meant mainly to reduce the wasteful
consumption of electricity.
The R&C policy has been to some extent responsible for the persistently high level of
T &Q losses. Wrth the implementation of the curtailment policy the share of H. T. has :full en
drastically contrary to the share of L.T. consumption. Since bulk of the losses occurs at the
L.T. level, ceteris paribus the policy has only assisted the losses to remain high. Further, it is
believed that if the R&C policies and existing tariff policies of the Board continue to prevail
then it might force the industries to shift away from the state very soon. Besides with the
prevailing policies, the agricultural and L.T. consumption will register unhindered stable
growth and the associated T &D losses will continue to soar high.
9. Unrestricted Demand for Energy and Peak
From the discussion on R&C it is clear that the demand and its growth rates depicted
in the tables in section 2 do not represent the true demand. APSEB believes that the growth
rates achi_eved during the pre-power cut period represent the true potential for growth. Thus,
for reasons quite obvious it is absolutely imperative to have an understanding of the
unrestricted historical and expected demand of the state. However, the entire exercise of
unconstrained demand forecast involves uncertainties. It is, thus, questionable whether
industries who have already set up huge captive capacities, and are expected to continue
doing so for some more time, will really assume the growth rate that prevailed during 'no
power cut' periods. Nevertheless, with the objective of arriving at some indicative
approximate unrestricted demand estimates APSEB follows an estimation procedure as
detailed below:

Chapter 4 143 --~-----------------------------------------------
• The historical unrestricted figures for each month of the financial year are estimated by
APSEB on the basis of actual power cut figures (load category-wise) maintained by them.
(In the Table below only the aggregate figures are displayed for spatial convenience.)
• The historical unrestricted figures for each month for the latest five years are considered
for forecasting unrestricted energy and peak demand. The methodology used by APSEB
is as follows. The monthly average of the five growth rates, say g, is estimated. Let a;, u;
, be the actual and unrestricted demands for the i th preceding year of the forecast year.
Thus, five projections for each month of the forecast year are obtained using the formula:
a; (1 +gi +( u; - a;), V i = 1, 2, 3, 4, 5. It is to be noted that while the growth rate is applied
to the actual, the excess of unrestricted over the actual is carried forward without applying
the growth rates. Finally, the average of these five estimates is obtained to arrive at the
forecasted unrestricted figures for energy and peak. However, sometimes some
adjustments are made based on Delphi's rule to these forecasted figures to correct for
baseline system abnormalities, such as exceptionally low frequencies in some months of
the base year.
• Thus, between 1990/91 and 1995/96 even though energy demand was restricted to a
growth rate of 7.96% to keep it in line with the available energy, the true unrestricted
demand growth rate was more than 9%. Similarly, between 1990/91 and 1995/96 the
growth rates for restricted and unrestricted peak demands were 5.72% and 8.15%
respectively.
Table-4.9.1 UNRESTRICTED ENERGY (GWh) AND PEAK (MW) DEMAND ENERGY. PEAK
YEAR ACTUAL UNRESTRICTED ACTUAL UNRESTRICTED 1990191 21573 22971 3465 3801 1991192 23837 25201 3703 4089 1992193 26195 27668 3916 4513 1993/94 27475 29180 4170 4712 1994195 31106 32644 4434 5160 1995196 31640 35618 4576 5623 1996197 39494 6121 I (forecast) Source: Power Scenano 1996/97, APSEB
10. Financial Status
The most crucial problem that the power sector today is facing is the severe dearth of
financial resources leading to total financial breakdown. The poor financial situation not only
creates formidable problems for the future development, but also presents difficulties for
meeting the day-to-day expenses of the board. Unable to generate enough internal resources
and funds from outside, the board cannot even carry out extensive renovation and
modernization (R&M) programmes. This is quite vital, in the presence of a financial crisis, as

Chapter4 144
R&M programmes can add significant effective capacities to the system at a relatively lower
cost. Besides, expenses on T&D, which substantially enhance the effective capacity of the
system, also have to be shelved in the presence of an acute financial crunch. Consequently,
inability to indulge in these programs due to fund crunch further exacerbates the financial
crisis perpetuating the vicious trap.
The most important reason for the decaying financial situation rests in the irrational
tariff policies of the board. Although the Electricity Supply Act has entrusted the
responsibility of pricing on the SEBs, with the State governments provided with only an
advisory role, this is never realized in practice. Most often the ruling party in the State, with
the sole objective of retaining its political mandate, compels the SEB to take decisions having
little economic content. Such protracted political and state interference have severely eroded
the financial health of the SEB, thereby precluding it from indulging in any prudent
investment endeavours towards capacity addition and system improvement.
Table-4.10.1 UNIT REVENUE REALIZATION PER UNIT COST OF POWER SUPPLY IN A.P.
YEAR Avg.Tariff Avg.Cost Ratio (paise/KWh) (paise/KWh)
1980181 37.30 37.80 0.99
1981182 42.22 41.97 1.01
1985186 49.96 53.27 0.94
1986187 48.3 55.60 0.87 1990191 74.49 78.72 0.95 1991192 83.29 89.23 0.93 1992193 94.29 100.07 0.94 1993194 98.62 113.67 0.87
1994195 122.75 138.20 0.89
Source: Annual Report on the Working of SEBs and EDs, P1ann.Comm., GOL 1995
Table-4.10.2 CONSUMER CATEGORYWISE AVERAGE TARIFF IN A.P. (paise I KWh )
YEAR Domestk CommercL Agri.llrrig. Industrial Rly. Tractn. overall avg. 1990/91 72.77 134.44 2.87 142.58 156.09 74.49 1991/92 78.14 154.70 3.28 161.14 203.59 83.29 1992/93 85.75 160.20 8.10 177.50 193.19 94.29 1993194 89.30 169.30 6.40 194.70 207.30 98.62 1994195 90.00 169.10 7.50 207.20 211.90 122.75 1995196 90.00 168.90 7.40 207.20 211.90 126.43
Source: Annual Report on the Working of SEBs and EDs, Plann.Comm., GOI, 1994 & 1995
Despite the occasional revision of tariffs by APSEB, it has been grossly unsuccessful
m generating additional resources for investment. As Table-4.1 0.1 shows, the average
realization per unit cost of supply has declined over the years. This indicates that an
increasing average realization could not keep pace with the rising unit cost. This observed
peculiarity finds its genesis in the lopsided and non-commercial tariff policies of the board.

Chapter4 145
Thus, although tariff increases over the years have tried to take into consideration the
escalations of various cost components, it is the dominant socio-political basis of tariff setting
which has led to massive tariff distortions. Besides, excessive reliance on cross subsidization
has severely eroded the consumption efficiency leading to a skewed consumption pattern.
Table-4.10.2 details the consumer category-wise tariff structure for the past few years. This
indicates that the industrial, commercial and traction sectors, being charged much in excess of
the average tariffs, have been cross subsidizing the domestic and agricultural sectors. The
average tariffs charged for the agricultural and domestic sectors are much below the overall
average tariffs, with the agricultural tariff showing a further decline in the past couple of
years.
The phenomenally low tariffs charged to the agricultural consumers have serious
repercussions on the revenue realization of the board. Thus, lack of adequate incentive in the
presence of abnonnally low rates charged on energy or flat rates on connected load have led
to unrestrained consumption, wastage and malpractices in the rural agricultural sector.
Malpractices in the form of using agricultural connections for domestic and commercial
purposes are a common phenomenon in the rural regions. Moreover, the R&C policies,
adopted by the board, affected industry adversely but did not (to any great extent) affect the
consumption of the agricultural sector. In fact, some of the power curtailment by the board
was a direct consequence of the decision to provide the requirements of the agricultural
sector. This has contributed to the substantial rise and hence skewed consumption of the
agricultural sector. Table-4.10.3 clearly indicates that revenue share of agriculture has
declined inspite of a substantial rise in the consumption share. The domestic sector, although
charged below the average rate, exhibits an increasing share in total sales revenue. However,
with growing unreported consumption in the form of pilferage (hooking), tampered meters,
wrong meter readings, usage of domestic and agricultural connections for commercial
purposes, the revenue losses offset the revenue realization of the board. The industrial sector,
which is, the major revenue generating sector, being burdened by the responsibility of cross
subsidization in the form of higher tariffs and poor quality as well as quantity of power
supply, is registering lower share of sales. In fact, as already discussed, for the same reasons
some of the power intensive industries are gradually resorting to captive generation.
Moreover, the scheduling and restrictions of power supply for the commercial sector have
further affected consumption and revenue generation. The lower and declining consumption
shares of the industrial and commercial sector can do little to appease the wearing financial
situation of the board. All these together have resulted in the peculiar consumption pattern of
the state leading to poor average revenue generation. Finally, substantial financial losses are a
direct consequence of the very high T &D losses, both technical and non-technical. The
technical losses are mainly due to poor planning, massive extension of T &D network at the

Chapter4 149
Table-4.10.8 COST OF POWERATVARIOUS VOLTAGE ENDS (Paise I KWh) YEAR 33KVEJVD llKVEND L.T. END
1985/86 34.67 40.41 68.93
1986187 35.36 41.26 68.90
1990191 39.82 54.26 88.90
1991/92 50.75 66.30 102.93
1992193 61.82 79.24 117.83
1993194 67.59 80.98 126.74
1994195 84.55 99.19 154.22
Source: Power Development in AP.: Statistics- 1995/96, APSEB.
Till only recently APSEB did not have any equity base. Consequently, the board was
obliged to meet the non-governmental debts out of any surplus generated, before the
repayment of governmental debts. The total capital liability of the board, including state
government loans, was Rs.3998.04crores in 1993/94. Loans constituted a major portion of the
liability since the board mainly finances its expenditures through loans. The high capital
liability acted as a deterrent in attracting fresh loans and investments. In an effort to appease
the situation somewhat the State Government converted part of the loan to equity in 1993/94
and again in 1994/95, with a total amount of Rs.l321.13 crores of equity. Thus, the State
Government loan declined from Rs.2164.62 crores in 1993/94 to Rs.1381.15 crores in
1994/95.
Thus, the entire discussion on the financial status endorses the need for financial
reform to bring the power sector out of the status quo and provide a stable platform for its
future development.
11. Potential for New and Alternative Technologies in A.P.
With depleting natural resources and rising environmental consciousness, the use of
alternative and renewable technologies are assuming considerable importance. Hence, a
discussion of the Andhra Pradesh power scenario would be incomplete without an exposure
of the potential for new and alternative technologies in Andhra Pradesh.
The potential for wind generation in Andhra Pradesh is limited to no more than
300MWs, even though according to popular belief it stands at 850MW. This discrepancy
arises from the expected harnessing capability given the meteorological uncertainties
involved. However, having an extremely low PLF of 0.22 and a high capital cost, the
generation costs may be quite high. The disadvantage of wind generation is that it tends to
have its highest output during monsoon months, when hydro projects are used to the
maximum capacity. However, being a clean form of energy it is environmentally appealing
and demands to be harnessed to the full extent. Proposals for a number of wind projects are
being processed and many more are likely to come up. Most ofthe wind projects are likely to

Chapter 4
Table-4.10.5 SUBSIDY TO SALES REVENUE RATIO FOR A.P. YEAR with cross subsidy without cross subsidy
1992193 6.1 42.5 1993194 10.5 47.5
1994195* 12.6 43.1 1995196* 19.5 46.3
Source: Annual Report on the Working of SEBs and EDs, Plann.Comm., GOI, 1994 & 1995 Note: * Figures for these years are estimated values.
Table-4.10.6 [A] COMPONENTS OF COST Cp_aise/ KWhL YEAR fuel power purchase o&m eslt.ladm. misc. Depreciation interest
1990/91 17.80 14.65 3.81 12.94 7.09 5.81 16.62 1991192 20.93 23.06 4.38 13.86 3.69 6.43 16.87 1992193 24.% 30.51 5.31 11.48 -0.26 7.57 20.48 1993194 28.52 34.80 5.75 11.55 5.69 8.07 19.29 1994195 37.47 36.95 6.50 13.96 7.83 8.72 26.71 1995196 43.33 37.56 6.25 14.34 7.68 9.99 31.92
Source: Annual Report on the Working ofSEBs andEds, P1ann.Comm., GOI, 1994 & 1995
[B) SHARE OF THE COST COMPONENTS IN PER UNIT COST YEAR fuel power purchase o&m estt./adm. misc. Depreciation interest
1990/91 0.23 0.19 0.05 0.16 0.09 0.07 0.21 1991192 0.23 0.26 0.05 0.16 0.04 0.07 0.19 1992193 0.25 0.30 0.05 0.11 0.00 0.08 0.20 1993194 0.25 0.31 0.05 0.10 0.05 0.07 0.17 1994195 0.27 0.27 0.05 0.10 0.06 0.06 0.19 1995196 0.29 0.25 0.04 0.09 0.05 0.07 0.21
Source: Annual Report on the Working of SEBs and Eds, Plann.Comm., GOI, 1994 & 1995
Table-4.10.7 SPECIFIC CONSUMPTION AND COST OF FUElS PER UNIT GENERATION IN COAL BASED THERMAL PLANfS
148
total 78.72 89.23 100.05 113.67 138.14 151.07
total 1.00 1.00 1.00 1.00 1.00 1.00
YEAR coal (kg/kwh) oil (mllkwh) coal cost(paiselkwh) oil cost (paise/kwh)
1990191 0.78 3.02 34.57 1.13
1991192 0.82 3.06 41.61 1.40
1992193 0.84 3.13 51.56 1.50
1993/94 0.86 2.88 61.40 1.80
1994195 0.83 2.70 68.20 1.70
1995196 0.83 2.70 71.90 1.70
Source: Annual Report on the Working ofSEBs andEDs, P1ann.Comm., GOI, 1994 & 1995. Performance Review ofThennal Power Stations, APSEB, 1993/94.
Finally, at the consumption end, the delivery costs of power taking T &D costs into
account are depicted in Table-4.10.8 below. The table clearly shows that this cost is
maximum at the L. T. end. High consumption along with high losses and low tariffs at the L. T.
end explain for the low revenue and formidable financial losses ofthe board.

Chapter 4 146 --~--~-------------------------------------------
L.T. level, poor investment in T&D; whereas the non-technical losses, as already discussed,
are mainly influenced, among other factors, by the distorted tariff structure.
Table-4.10.3 SHARE OF AGRICULTURE AND DOMESTIC IN TOTAL SALES AND REVENUE (percen~
AGRICULTIURE DOMESTIC
YEAR sales share ('IAI) rev share ('141) sales share(%) rev share ('141) 1992193 40.7 3.50 14.57 13.25
1993194 43 2.75 14.93 13.51
1994195 48 2.68 14.80 13.75
1995196 49 1.39 14.50 15.36
Source: Power Development in AP.: Statistics- 1995/96, APSEB. Annual Report on the Working of SEBs and EDs, Plann.Comm., GOI, 1995
The extent of subsidy in the finances ofthe board is depicted in Table-4.10.4 and
4.10.5 below. These indicate that the extent of subsidies has gone up over the years with
markedly increasing assistance to the agricultural sector. The extent of effective subsidy to
agriculture is much more than that to the domestic sector, mainly because of the higher
average cost and tariff differential for agriculture. Even if the proposed tariff of 50 paise per
unit were levied on agricultural consumption, still the effective subsidy would continue to
remain very high and exceed the subsidy to the domestic sector. The board has been suffering
commercial losses even with the subsidies, although the extent of losses is lower with subsidy
than otherwise. The consequence of such distorted tariff structure and mounting losses, both
in sales and revenues, is that the board has been earning negative rates of return for some
time. The last two years in the table gives estimated figures, which could be quite different
from actual accounting figures. The fact that the Board has increased its equity base in the last
two years and has been earning non negative returns does not in anyway ensure financial
stability of the board.
Thus, it may be deduced, from the above discussion, that the subsidies have reached a
level beyond which any further increase through pressure on industry is not commercially
viable. In fact, ceteris paribus, any further industrial tariff increase with the objective of cross
subsidizing agriculture and domestic sector would trigger mass exodus of industries from the
state. Under these circumstances it seems that formulation of a rational tariff structure is a
sine qua non for improving the financial situation of the board.
On the supply side the costs of generation have been increasing quite steadily. These
cost components of generation and their shares in total cost are indicated in Tables-4.10.6 and
4.10.7 below. Among the various components of cost, fuel costs constitute the main
component and have been increasing steadily over the years. Another major component of
cost, that has been registering steady increase, is purchase of power. With an expanding
demand and supply imbalance the share of purchased power is going up, which along with

Chapter 4 147
increasing average cost adversely affect the average unit cost of generation. Other cost
components have remained fairly stable, excepting for the per unit cost on O&M and interest
charges that have nearly doubled in five years. In terms of the share of cost components in
total costs, it is only the share of fuel that is registering a steady increase over the years and is
expected to go up further in future. The relative share of power purchase costs after an initial
increase is exhibiting a declining trend, mainly because of the rising trend in relative fuel cost
and interest charges. The other cost shares have remained more or less stable with no major
individual influences on total cost. Table-4.1 0. 7 indicates that the coal cost per unit of
generation has gone up. The figures for specific consumption of coal in the table are
testimony to the fact that the quality of the coal used has declined over the years. This results
in more coal being required to generate same quantity of power, and together with higher
costs of coal this has been pushing the per unit coal costs substantially in the upward
direction. With decontrol of lower grade coals the cost is expected to go up further in future.
However, because of efficient performance of some of the major coal thermal plants
(excepting for a few old plants) and the use of mix grade coal, the use of secondary fuels
could be kept at a low level. This has substantially influenced the declining per unit cost of oil
consumption in the thermal power plants.
Table-4.10.4 SUBSIDY AND COMMERCIAL PROFIT / LOSS IN A.P.
YEAR
1990191 1991192 1992193 1993194
1994195* 1995196*
commercial profit/loss with
subsidy
27.73 33.38 -4.20
-22.60 -206.20 -468.70
commercial profit/loss
without subsidy -16.00 -1.60 -4.30
-22.70 -206.20 -468.70
effective effective subsidy subsidy subsidy for foragri for agricultural cons. with SOps domestic consumers tariff consumer
476.72 180.51 2.01 599.24 273.51 28.74 725.90 394.90 40.00 925.30 532.30 63.00
1045.30 705.30 166.00 1264.20 889.20 229.00
rate of return on capital** with subsidy
(%) 1.32 1.48 -0.2 -0.8 -7.1 -11.3
Source: Annual Report on the Working ofSEBs andEDs, Plann.Comm., GOI, 1994 & 1995 Note: [1] Effective subsidy to a sector is defined as total sales in that sector multiplied by the difference between average cost of supply and average tariff to the sector.
[2]* Figures for these years are estimated values and may considerably diverge from realized values. In the past such estimated values for agricultural sector were always on the lower side, and commercial losses were understated. For the domestic sector however in the past such estimated values were slightly overstated.
[3]**Estimated on the basis of net fixed assets at the beginning of the year. In terms of section 59 of the Electricity Supply Act, 1948, the SEBs are required to earn a minimum rate of return of 3% on their net fixed assets in service after providing for depreciation and interest charges.

Chapter4 150
be developed by private power developers. A total of 370.20MWs of wind farm projects,
located mostly in Ramagiri, Narsimhakonda, and Bheemunipatnam have been allotted to the
private sectors. At present A.P. has 44MWs ofwind capacity of which only 2MWs are state
owned.
The potential for micro, mini, and small hydel projects, with a PLF of 0.4 and low
generating costs, is approximately 4000MWs. However, with an existing capacity of llMWs
generating 43.37GWh, their potential till date has been grossly under-utilized. Such limited
implementation of this option is a national phenomenon and is not something unique to A.P ..
Among the several problems involved, one of the most formidable obstacles in case of
irrigation canal drop schemes is the need for co-ordination with the state irrigation
departments. Unfortunately, the irrigation departments are not generally noted for their
administrative efficacy. Besides, in some cases the economics of the small hydro option is
dependent on subsidies, to cover part of the capital cost, that are available only in Delhi.
Notwithstanding the help available from the Non-Conventional Energy Development
Corporation (A.P.), the actual paperwork involved to obtain these funds are formidable and
discourage all, but the most, experienced industrialists. Mini hydel projects of the irrigation
canal drop types are particularly promising in A.P. because generation by this option is
concentrated in exactly the same months as those in which the agricultural demand is at its
peak. Thus, mini hydel option may be effectively used to meet the peak demand during the
irrigation months. Besides, this option is also noted for its capability to be used as a
decentralised option for meeting agricultural demand in rural areas, thereby catering to the
demand at minimum loss of energy. Several mini hydel projects are under consideration of
which five projects, amounting to 5150KWs of capacity, are under construction in
Karimnagar.
Yet another technological option assuming importance is the possibility of co
generation. Within the present industrial structure, Andhra Pradesh does not seem to have a
large co-generation potential. However, by the end of another 1 0-year period it is expected to
develop a potential for at least another 384MWs.
According to IRP draft report, at least the following resources can be tapped in a
couple ofyears:
• 220MWs ofwind option,
• 170MWs of micro I mini hydel,
• 43MWs of cogeneration.

Chapter 4 151
12. Fast Track Projects
Considering the scarcity of financial resources with the APSEB as well as public
sector undertakings and the widening demand and supply gap, efforts are being made to
mobilize additional resources by encouraging private sector investments in the power sector.
Equipped with the policies formulated by the ministry of power and its subsequent
amendments, the board could successfully invite large numbers of proposals from the private
sector. In view of the enormous demand-supply gap and the need to address this issue
immediately, the government and the board are encouraging short gestation period projects. In
fact most of the private sector projects which are likely to assume financial closure faster are
of the short gestation type. Private power developers are mostly proposing power projects
based on naphtha, gas, liquefied natural gas, and fuel oils, though some coal thermal plants
proposal by independent power producer (IPPs) are also under consideration.
However, given the present financial distress of the board and a situation of status
quo, the security package to the IPPs is crucial to the success of mobilizing resources through
actual private participation. Thus, as an initial measure the central government has decided to
provide counter-guarantees84 to the state-guarantees for the board's obligation to the IPPs in
three fast track projects in Andhra Pradesh (out ofthe 8 fast track projects in India). Most of
these fast track projects are expecting technical and financial closure soon. These three
projects are:
• Jegurupadu CCGT (GVK. Reddy) with a capacity of 216MW and a provisional project
cost Rs.816 Crores is under construction. The first three units ofthe project have already
been commissioned.
• Godavari CCGT (M/s Spectrum Power Generation) with a capacity of 208MW and a
provisional project cost Rs.748 Crores is under construction. The first unit of the project
has already been commissioned.
• Vishakapatnam TPS (Ashok Leyland and M/s National Power Plc., UK) with a capacity
of 1040MW and a provisional project cost Rs.4797 Crores is expected to be
commissioned by 2000. The PPA is being finalised at the moment.
Although, these counter-guarantees increase the investment security of the lenders,
extensive use of these measures can lead to large contingent liabilities of the government.
Hence, alternative arrangements are being considered for making the investment environment
for the private enterprises conducive. These alternative measures may be implemented in the
case of other committed private sector projects, which has not yet reached the closure stage.
84 The present Ruling Government has amended this decision by making it mandatory for the State to set up a Regulatory Commission in order to be eligible for a central government counter guarantee.
Chapter 4 152
Conclusion
Although, a number of state and private sector power projects are expected to be
commissioned soon, the above exposition clearly indicates that the state power sector is
facing structural and financial constraints. Thus, an acute capacity shortage and poor financial
health plague APSEB inspite of having achieved technical and operational standards that is
laudable as compared to other SEBs ofthe country. The present crisis finds its genesis in the
complex interplay of several inadequacies and irrationalities existing in the system. Some of
the more important ones may be listed as:
• the enormous size of the board and lack of competition within the system,
• the control regime within which it operates,
• state intervention in tariff setting and other decisions of the board,
• high and persistent T &D losses,
• lopsided development of the system, as evident in minimal fund allocation for T &D
investment,
• an over expanded but inadequately planned distribution network,
• non-commercial and distorted tariff structure,
• poor billing, metering, and collection of sales revenues,
• lopsided curtailment and restriction policies practised,
• inadequate technological and pecuniary energy conservation efforts.
In view ofthe inherent problems ofthe A.P. power sector, the board has decided to
take necessary actions to reform the power system. The present policy of opening up of the
power sector to private enterprises, essentially for resource mobilization, offers a viable
option towards atonement of the situation. However, the policy of opening up by itself does
not ensure private participation. Active private participation requires a secure and stable
business environment. Besides, such a structural change can be socially beneficial from the
point of view of the state if it flourishes in a competitive set up. Further, the environmental
implications of a rapidly growing power sector, and more so for a power sector plagued by
severe shortcomings, are quite acute. This enhances the need for taking explicit account of the
environmental issues in the overall development planning of the power sector, besides
initiating a firm regulatory, administrative and judicial structure. The ultimate success in the
direction of improving the working of the power sector, therefore, lies in rational planning
and appropriate institutional policy initiatives. Thus, the institutional and organizational
structure of the power sector requires immediate redesigning taking into consideration the
economic, environmental, and political specificities of the problems.