CHAPTER 4 ANALYTICAL RESULTS AND EVALUATION ON...
18
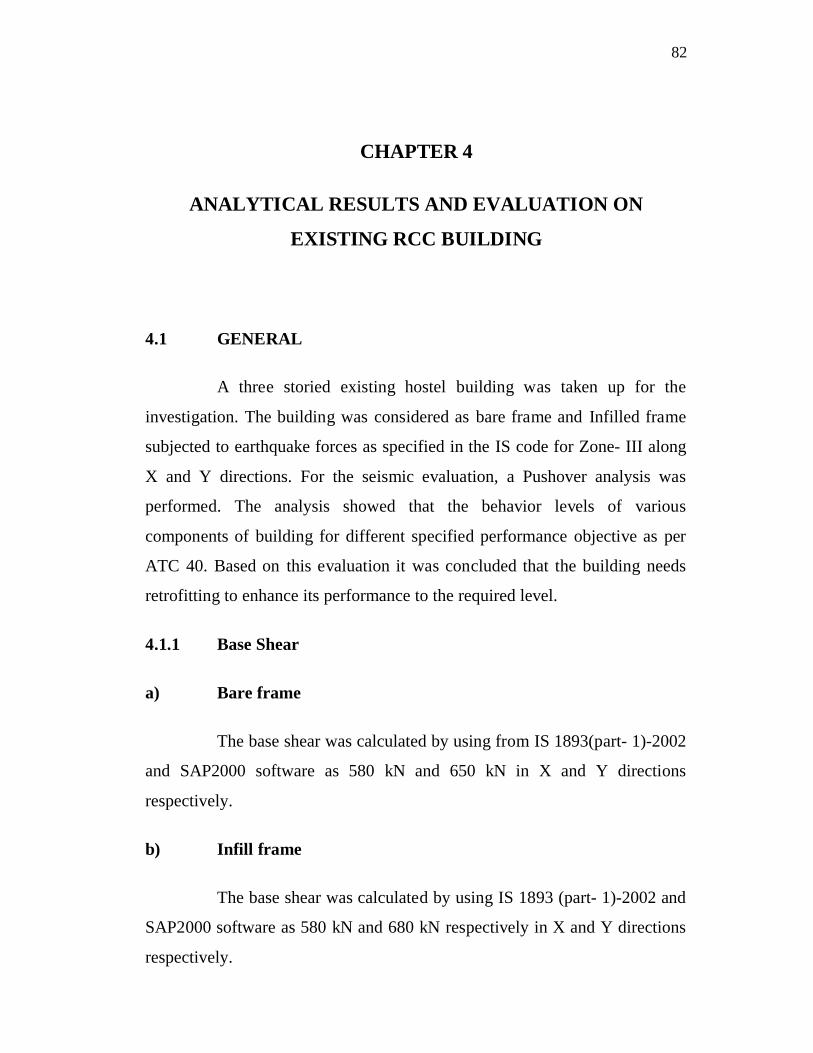
82 CHAPTER 4 ANALYTICAL RESULTS AND EVALUATION ON EXISTING RCC BUILDING 4.1 GENERAL A three storied existing hostel building was taken up for the investigation. The building was considered as bare frame and Infilled frame subjected to earthquake forces as specified in the IS code for Zone- III along X and Y directions. For the seismic evaluation, a Pushover analysis was performed. The analysis showed that the behavior levels of various components of building for different specified performance objective as per ATC 40. Based on this evaluation it was concluded that the building needs retrofitting to enhance its performance to the required level. 4.1.1 Base Shear a) Bare frame The base shear was calculated by using from IS 1893(part- 1)-2002 and SAP2000 software as 580 kN and 650 kN in X and Y directions respectively. b) Infill frame The base shear was calculated by using IS 1893 (part- 1)-2002 and SAP2000 software as 580 kN and 680 kN respectively in X and Y directions respectively.
Transcript of CHAPTER 4 ANALYTICAL RESULTS AND EVALUATION ON...
82
CHAPTER 4
ANALYTICAL RESULTS AND EVALUATION ON
EXISTING RCC BUILDING
4.1 GENERAL
A three storied existing hostel building was taken up for the
investigation. The building was considered as bare frame and Infilled frame
subjected to earthquake forces as specified in the IS code for Zone- III along
X and Y directions. For the seismic evaluation, a Pushover analysis was
performed. The analysis showed that the behavior levels of various
components of building for different specified performance objective as per
ATC 40. Based on this evaluation it was concluded that the building needs
retrofitting to enhance its performance to the required level.
4.1.1 Base Shear
a) Bare frame
The base shear was calculated by using from IS 1893(part- 1)-2002
and SAP2000 software as 580 kN and 650 kN in X and Y directions
respectively.
b) Infill frame
The base shear was calculated by using IS 1893 (part- 1)-2002 and
SAP2000 software as 580 kN and 680 kN respectively in X and Y directions
respectively.
83
Though Fundamental natural period of vibration (Ta), is different
for frame with and without infill, since Sa/g is 2.5, there is no difference in
base shear (Vb) in both cases as per calculation of IS 1893 (part- 1)-2002.
4.1.2 Pushover Curve
a) Bare Frame
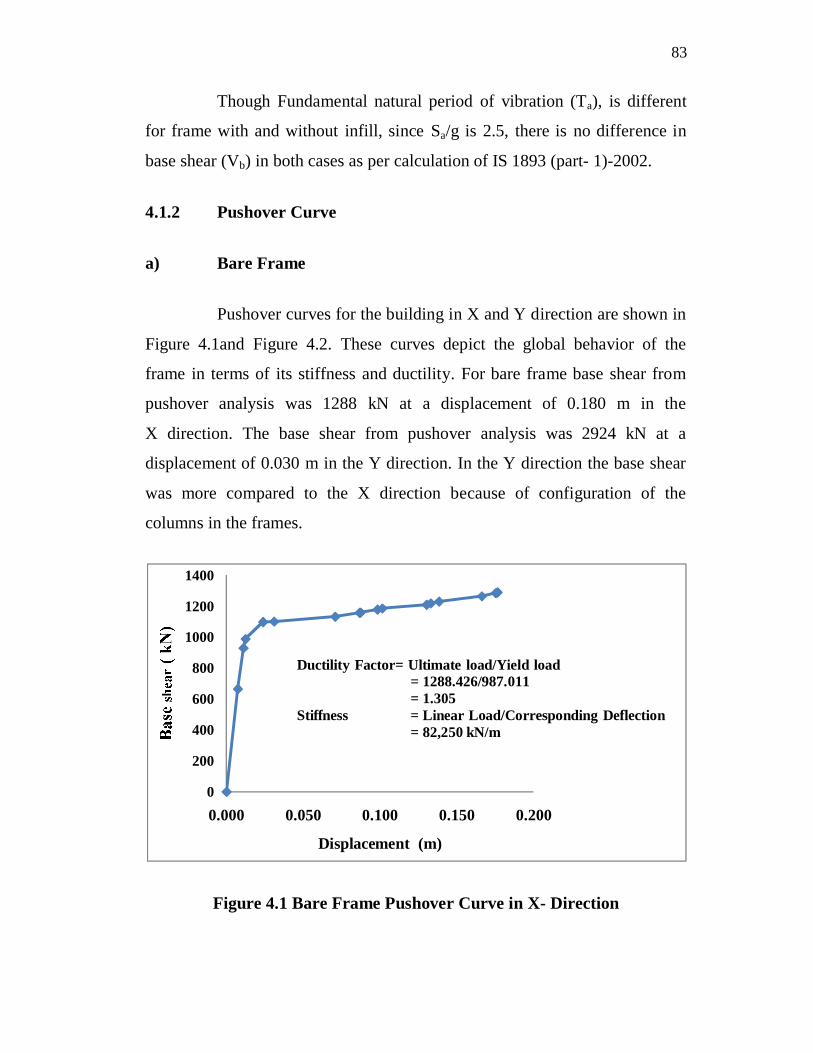
Pushover curves for the building in X and Y direction are shown in
Figure 4.1and Figure 4.2. These curves depict the global behavior of the
frame in terms of its stiffness and ductility. For bare frame base shear from
pushover analysis was 1288 kN at a displacement of 0.180 m in the
X direction. The base shear from pushover analysis was 2924 kN at a
displacement of 0.030 m in the Y direction. In the Y direction the base shear
was more compared to the X direction because of configuration of the
columns in the frames.
Figure 4.1 Bare Frame Pushover Curve in X- Direction
0
200
400
600
800
1000
1200
1400
0.000 0.050 0.100 0.150 0.200
Displacement (m)
Ductility Factor= Ultimate load/Yield load= 1288.426/987.011= 1.305
Stiffness = Linear Load/Corresponding Deflection= 82,250 kN/m

84
Figure 4.2 Bare Frame Pushover Curve in Y -Direction
b) Infill Frame
Pushover curves for the building in X and Y directions are shown
in Figure 4.3 and Figure 4.4. For infill frame base shear from pushover
analysis was 1381 kN at a displacement of 0.36 m in the X direction and base
shear from pushover analysis was 3270 kN at a displacement of 0.023 m in
the Y direction. Therefore, infill frame stiffness would result in more
resistance to earthquake force when compared to the bare frame resistance.
Thus the use of the infill, had increased the base shear capacity of the
structure.
0500
1000
1500200025003000
3500
0.000 0.010 0.020 0.030 0.040Displacement (m)
Ductility Factor= Ultimate load/Yield load= 2923.675/2171.5= 1.346
Stiffness = Linear Load/CorrespondingDeflection= 2,71,437 kN/m

85
Figure 4.3 Infill Frame Pushover Curve in X -Direction
Figure 4.4 Infill Frame Pushover Curve in Y –Direction
0
200
400
600
800
1000
1200
1400
1600
0.00 0.05 0.10 0.15 0.20 0.25 0.30 0.35 0.40
Displacement (m)
Ductility Factor= Ultimate load/Yield load= 1381/1028.469= 1.342
Stiffness = Linear Load/CorrespondingDeflection= 1,02,846 kN/m
0
500
1000
1500
2000
2500
3000
3500
0.000 0.005 0.010 0.015 0.020
Displacement (m)
Ductility Factor= Ultimate load/Yield load= 3049.009/2349.6= 1.297
Stiffness = Linear Load/CorrespondingDeflection= 2,61,068 kN/m

86
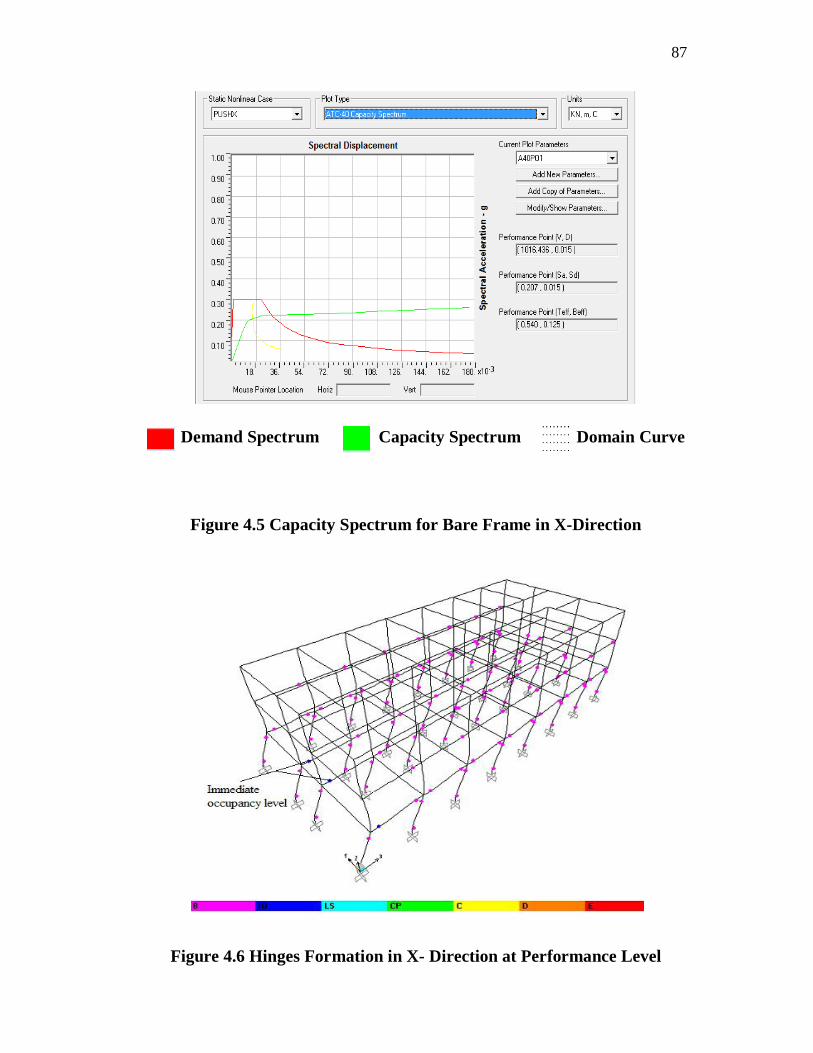
4.1.3 Capacity Spectrum and Building Performance Level
Capacity spectrum is the capacity curve transformed from base
shear versus roof displacement co-ordinates into spectral acceleration versus
spectral displacement (Sa Vs Sd) co-ordinates. The performance point is
obtained by superimposing demand spectrum on capacity curve transformed
into spectral coordinates. To have desired performance, every structure has to
be designed for the spectral acceleration corresponding to the performance
point.
a) Bare Frame
The bare frame performance point was obtained at a base shear
level of 1016.436 kN and displacement of 0.015 m in the X direction as
shown in Figure 4.5. In that performance point, the structure reached
immediate occupancy level as shown in Figure 4.6. The performance point
was obtained at a base shear level of 1,330.743 kN and displacement of
0.0044 m in the Y- direction as shown in Figure 4.7. In that performance
point, the structure reached collapse prevention level as shown in Figure 4.8.
Therefore, it is found that the structure is more critical in the Y direction
compared to the X direction.
87
Demand Spectrum Capacity Spectrum Domain Curve
Figure 4.5 Capacity Spectrum for Bare Frame in X-Direction
Figure 4.6 Hinges Formation in X- Direction at Performance Level

88
Demand Spectrum Capacity Spectrum Domain Curve
Figure 4.7 Capacity Spectrum for Bare Frame in Y-direction
Figure 4.8 Hinges Formation in Y direction at Performance Level
89
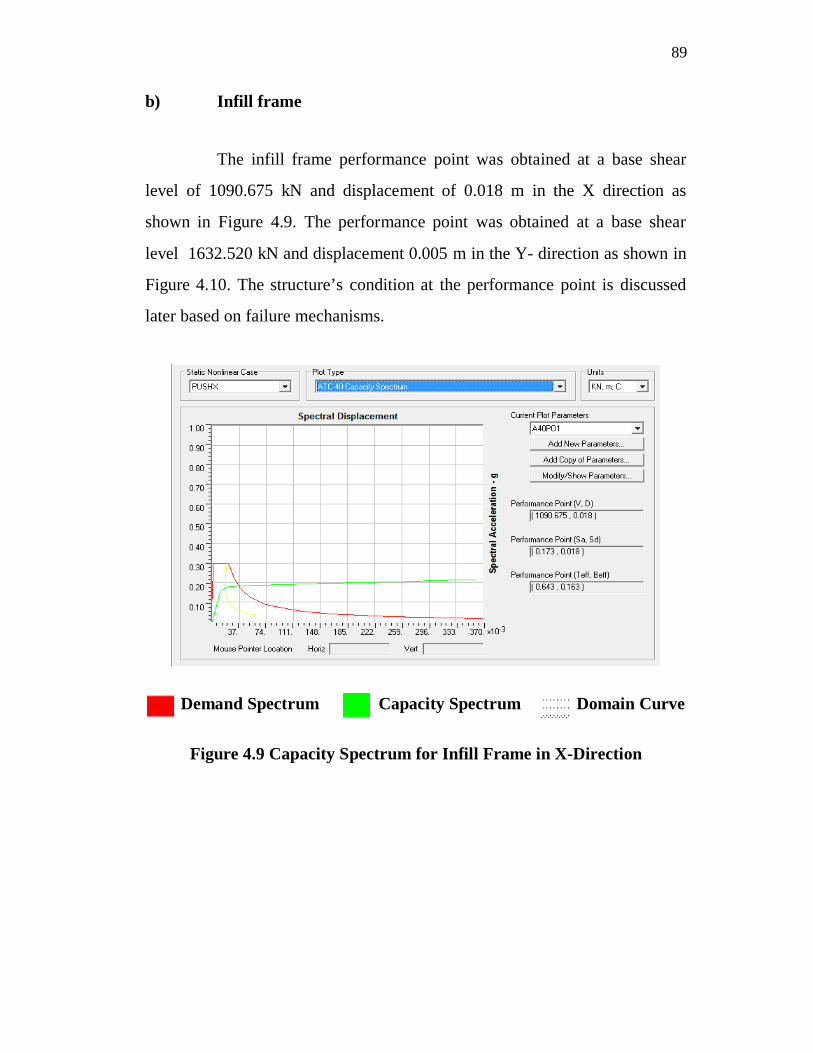
b) Infill frame
The infill frame performance point was obtained at a base shear
level of 1090.675 kN and displacement of 0.018 m in the X direction as
shown in Figure 4.9. The performance point was obtained at a base shear
level 1632.520 kN and displacement 0.005 m in the Y- direction as shown in
Figure 4.10. The structure’s condition at the performance point is discussed
later based on failure mechanisms.
Demand Spectrum Capacity Spectrum Domain Curve
Figure 4.9 Capacity Spectrum for Infill Frame in X-Direction

90
Demand Spectrum Capacity Spectrum Domain Curve
Figure 4.10 Capacity Spectrum for Infill Frame in Y-Direction
4.1.4 Plastic Hinge formation
a) Bare frame
In the X direction plastic hinge formation of the building was
observed at different displacements levels. Plastic hinge formation starts with
beam ends and later on proceeds to base of columns of lower stories and then
propagates to upper stories and continues with the yielding of interior
intermediate beams. However, yielding occurs at designated events such as B
(yielding), IO (Immediate occupancy), LS (Life safety) and last hinge CP
(collapse prevention) respectively, the amount of damage in this direction was
expected to be limited based on the predicted displacements as below.

91
The first hinge formation occurs at a load of 664.45 kN and at a
displacement of 0.007 m as shown Figure 4.1. The typical moment versus
rotation curve for first hinge formation of beam element is shown in Figure
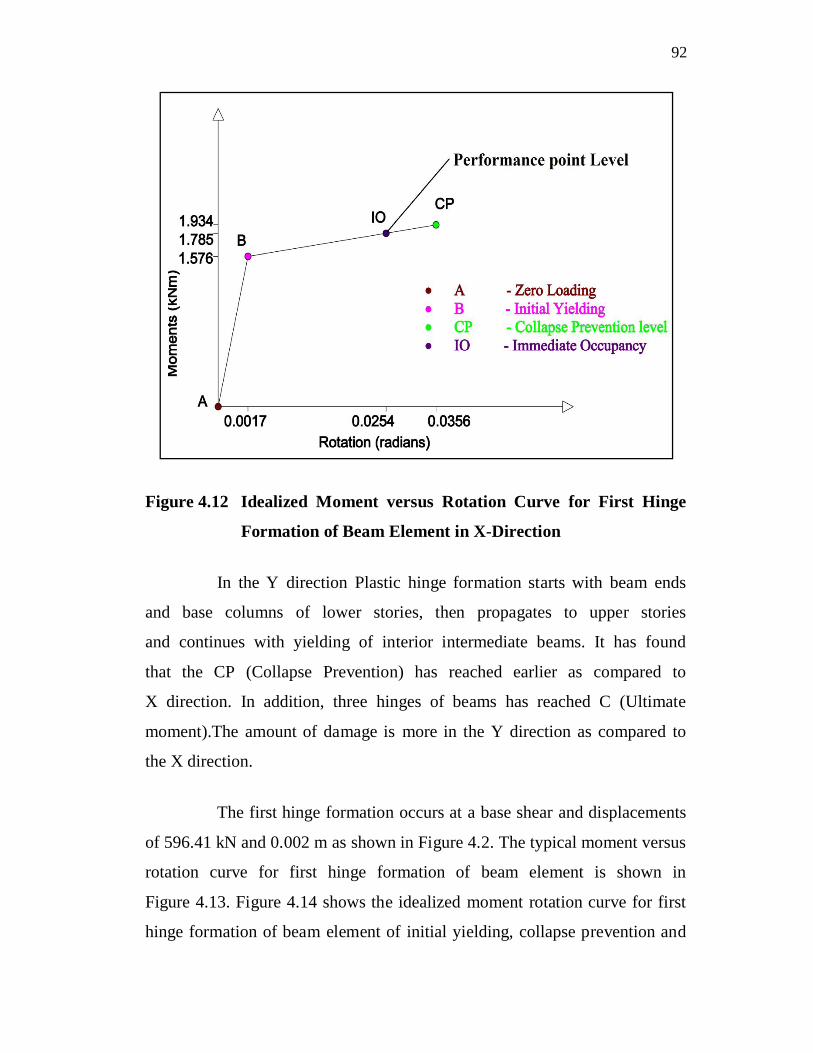
4.11. Figure 4.12 shows the idealized moment rotation curve for first hinge
formation of beam element of initial yielding, immediate occupancy and
collapse prevention. The moment and rotation value for point B (Yielding)
were 1.576 kNm and 0.0017 radians respectively. The moment and rotation
value for point IO (Immediate occupancy) were 1.785 kNm and 0.0254
radians respectively. The moment and rotation value for point CP (Collapse
Prevention) were 1.934 kNm and 0.0356 radians respectively.
Figure 4.11 Typical Moment versus Rotation Curve for First Hinge
Formation of Beam Element in X-Direction
0
0.5
1
1.5
2
2.5
0 0.01 0.02 0.03 0.04Rotation (radians)
92
Figure 4.12 Idealized Moment versus Rotation Curve for First Hinge
Formation of Beam Element in X-Direction
In the Y direction Plastic hinge formation starts with beam ends
and base columns of lower stories, then propagates to upper stories
and continues with yielding of interior intermediate beams. It has found
that the CP (Collapse Prevention) has reached earlier as compared to
X direction. In addition, three hinges of beams has reached C (Ultimate
moment).The amount of damage is more in the Y direction as compared to
the X direction.
The first hinge formation occurs at a base shear and displacements
of 596.41 kN and 0.002 m as shown in Figure 4.2. The typical moment versus
rotation curve for first hinge formation of beam element is shown in
Figure 4.13. Figure 4.14 shows the idealized moment rotation curve for first
hinge formation of beam element of initial yielding, collapse prevention and
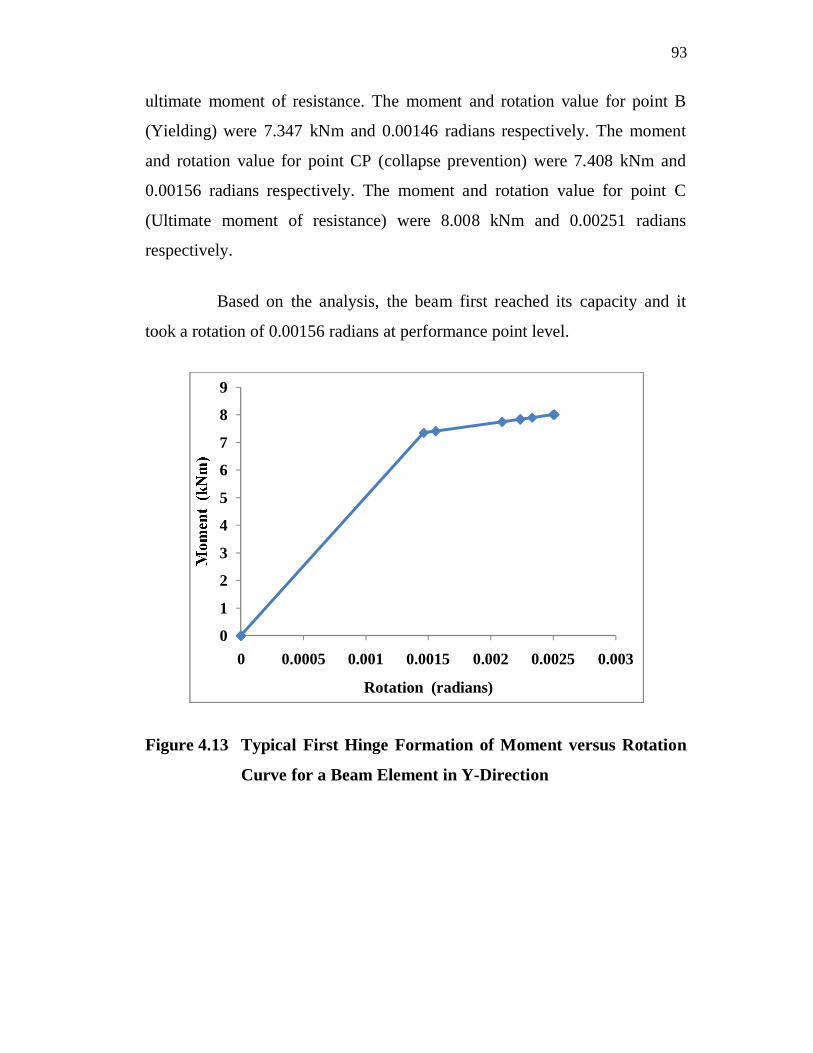
93
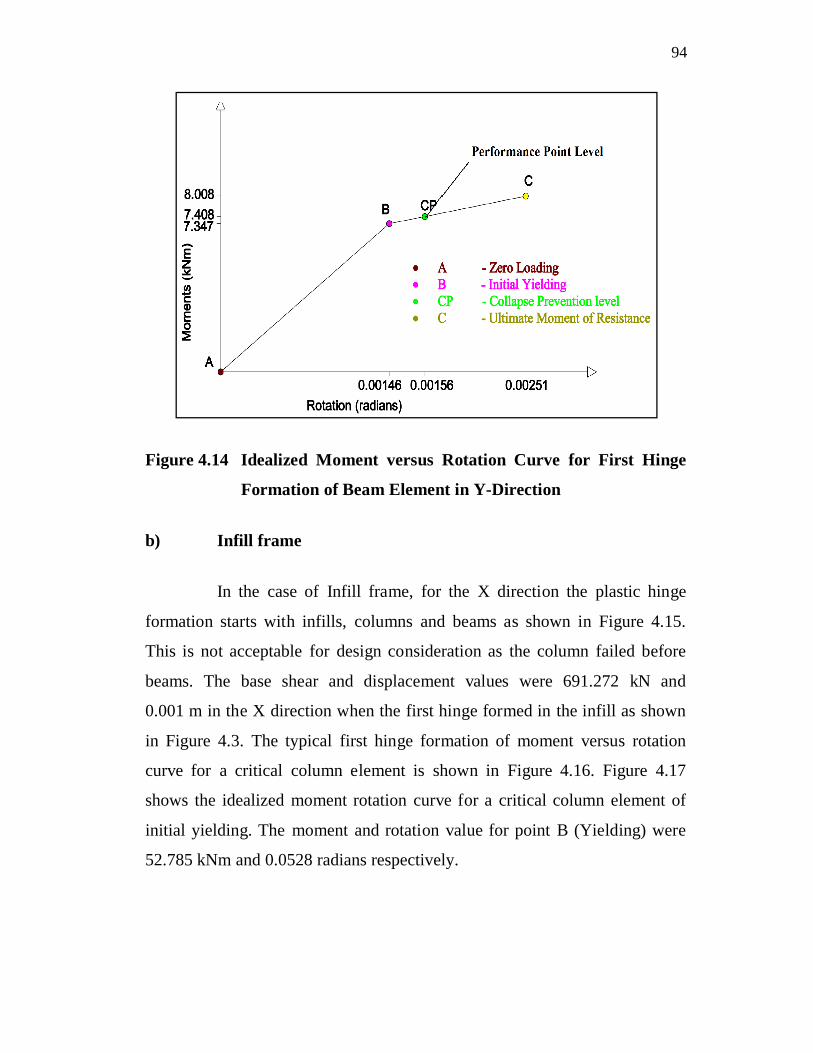
ultimate moment of resistance. The moment and rotation value for point B
(Yielding) were 7.347 kNm and 0.00146 radians respectively. The moment
and rotation value for point CP (collapse prevention) were 7.408 kNm and
0.00156 radians respectively. The moment and rotation value for point C
(Ultimate moment of resistance) were 8.008 kNm and 0.00251 radians
respectively.
Based on the analysis, the beam first reached its capacity and it
took a rotation of 0.00156 radians at performance point level.
Figure 4.13 Typical First Hinge Formation of Moment versus Rotation
Curve for a Beam Element in Y-Direction
0
1
2
3
4
5
6
7
8
9
0 0.0005 0.001 0.0015 0.002 0.0025 0.003
Rotation (radians)
94
Figure 4.14 Idealized Moment versus Rotation Curve for First Hinge
Formation of Beam Element in Y-Direction
b) Infill frame
In the case of Infill frame, for the X direction the plastic hinge
formation starts with infills, columns and beams as shown in Figure 4.15.
This is not acceptable for design consideration as the column failed before
beams. The base shear and displacement values were 691.272 kN and
0.001 m in the X direction when the first hinge formed in the infill as shown
in Figure 4.3. The typical first hinge formation of moment versus rotation
curve for a critical column element is shown in Figure 4.16. Figure 4.17
shows the idealized moment rotation curve for a critical column element of
initial yielding. The moment and rotation value for point B (Yielding) were
52.785 kNm and 0.0528 radians respectively.
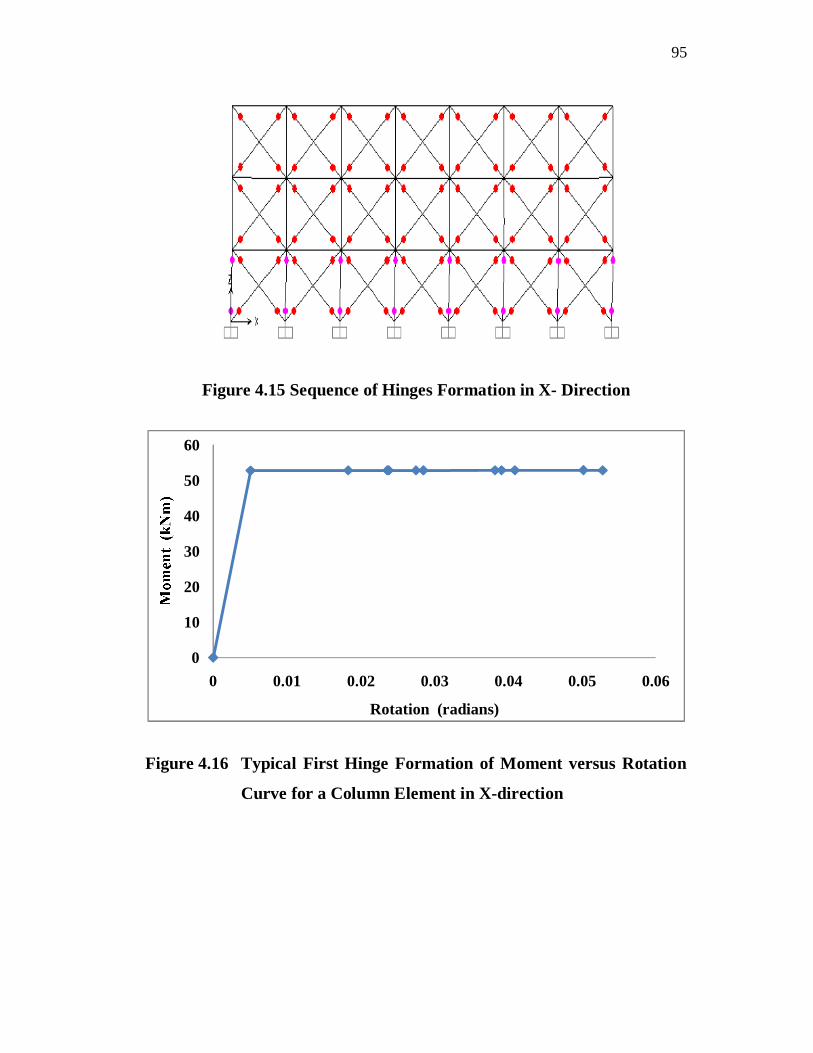
95
Figure 4.15 Sequence of Hinges Formation in X- Direction
Figure 4.16 Typical First Hinge Formation of Moment versus Rotation
Curve for a Column Element in X-direction
0
10
20
30
40
50
60
0 0.01 0.02 0.03 0.04 0.05 0.06
Rotation (radians)

96
Figure 4.17 Idealized Moment versus Rotation Curve for a Column
Element in X-direction
For Y direction, the plastic hinge formation starts with infills
followed by columns and beams as shown in Figure 4.18 This is also not
acceptable for design consideration as column failed before beams. The base
shear and displacement values were 263.756 kN and 0.001 m in the X
direction when the first hinge formed in the infill as shown in Figure 4.4. The
typical first hinge formation of moment versus rotation curve for a critical
column element is shown in Figure 4.19. Figure 4.20 shows the idealized
moment rotation curve for a critical column element of initial yielding. The
moment and rotation value for point B (Yielding) were 106.434 kNm and
0.0328 radians respectively.
The sequence of hinge formation indicates that the column hinge
forms before the formation of beam hinges. This gives rise to strong beam-
weak column and not advisable for earthquake design concept. Hence, the

97
columns in the building have to be retrofitted so that they do not reach their
capacity before beams.
Figure 4.18 Sequence of Hinges Formation in Y- Direction
Figure 4.19 Typical First Hinge Formation of Moment versus Rotation
Curve for a Column Element in Y-direction
0
20
40
60
80
100
120
0 0.005 0.01 0.015 0.02 0.025 0.03 0.035
Rotation (radians)

98
Figure 4.20 Idealized Moment versus Rotation Curve for a Column
Element in Y-direction
4.2 CONCLUSIONS
In this chapter, analysis results and evaluation of existing hostel
building are presented. The bare frame and infill frame building were
evaluated by the pushover curve, capacity spectrum, building performance
level and plastic hinge formation level using software SAP 2000 version 11.
In fact, this building is acting as bare frame because of analyses as well as
design of the frames which were carried out by considering the mass but
neglecting the strength and stiffness of the contribution of infill. Therefore,
the entire lateral load is assumed to be resisted by the frame only.
Based on the bare frame analysis result, it is concluded that, in
event of earthquake occurs in Coimbatore region which is located in Zone-III,
this existing hostel building will first yield in the Y direction because of weak
beams. The base shear capacity was low in the Y direction as compared to the

99
X direction for first hinge formation levels and also at the performance point
level, this building reached immediate occupancy level in the X direction and
collapse prevention level in the Y direction. It is found that this building is
more critical in the Y direction when compared to the X direction.
From the above discussion it is clear that the building is more
vulnerable in the Y direction and therefore weak beams in the Y-direction
must be strengthened by locally available strengthening techniques, before an
occurrence of earthquake.