Chapter 3_Regression Analysis1
35
³Regression is a statistical technique which establish a functional relationship between two or more variables in the form of an equation to estimate the value of one variable based on the value of another variable´
-
Upload
divya-saranu -
Category
Documents
-
view
225 -
download
0
Transcript of Chapter 3_Regression Analysis1

8/8/2019 Chapter 3_Regression Analysis1
http://slidepdf.com/reader/full/chapter-3regression-analysis1 1/35
³Regression is a statistical
technique which establish afunctional relationship between
two or more variables in theform of an equation to
estimate the value of one
variable based on the value of another variable´

8/8/2019 Chapter 3_Regression Analysis1
http://slidepdf.com/reader/full/chapter-3regression-analysis1 2/35
Regression Analysis
Simple Linear Regression Model
y = F0 + F1 x + I
Simple Linear Regression Equationy = F0 + F1 x
Estimated Simple Linear Regression Equation
x b byÖ 10 !

8/8/2019 Chapter 3_Regression Analysis1
http://slidepdf.com/reader/full/chapter-3regression-analysis1 3/35
Principle of least squares technique

8/8/2019 Chapter 3_Regression Analysis1
http://slidepdf.com/reader/full/chapter-3regression-analysis1 4/35
Case 1:
Observed points : (4,8); (8,1); (12,6)
Estimated points : (4,6); (8,5); (12,4)
Observed points : (4,8); (8,1); (12,6)
Estimated points : (4,2); (8,5); (12,8)

8/8/2019 Chapter 3_Regression Analysis1
http://slidepdf.com/reader/full/chapter-3regression-analysis1 5/35
Error (graph 1) Error (graph 2)8-6=-2 8-2=6
1-5=-4 1-5=-4
6-4=2 6-8=-2
Total error=0 Total error=0

8/8/2019 Chapter 3_Regression Analysis1
http://slidepdf.com/reader/full/chapter-3regression-analysis1 6/35
Absolute error Absolute error
I8-6I=2 I8-2I=6
I1-5I=4 I1-5I=4
I6-4I=2 I6-8I=2
Total Absolute error=8 Total Abs error=12

8/8/2019 Chapter 3_Regression Analysis1
http://slidepdf.com/reader/full/chapter-3regression-analysis1 7/35
Case 2:
Observed points: (2,4); (6,7); (10,2)
Estimated points: (2,4); (6,3); (10,2)
Observed points: (2,4); (6,7); (10,2)
Estimated points: (2,5); (6,4); (10,3)

8/8/2019 Chapter 3_Regression Analysis1
http://slidepdf.com/reader/full/chapter-3regression-analysis1 8/35
Abs Error Abs Error
I4-4I=0 I4-5I=1I7-3I=4 I7-4I=3
I2-2I=0 I2-3I=1
Total Abs error=4 Total Abs error=5

8/8/2019 Chapter 3_Regression Analysis1
http://slidepdf.com/reader/full/chapter-3regression-analysis1 9/35
Error Square ErrorSquare
(4-4)2 =0 (4-5) 2=1(7-3) 2=16 (7-4) 2=9
(2-2) 2=0 (2-3) 2=1
Sum of error square=16 (Graph 1)
Sum of error square=11 (Graph 2)

8/8/2019 Chapter 3_Regression Analysis1
http://slidepdf.com/reader/full/chapter-3regression-analysis1 10/35
Least Squares Method
Least Squares Criterion
where:
y i = observed value of the dependent variable
for the i th observation
? A§ 2)Ö(min
iiy y
nobservatioithfor the
variabledependenttheof valueestimatedyÖ i !

8/8/2019 Chapter 3_Regression Analysis1
http://slidepdf.com/reader/full/chapter-3regression-analysis1 11/35
Slope for the Estimated Regression Equation
x = value of independent variable for i th observation
y = value of dependent variable for i th observation
n = total number of observations
y -Intercept for the Estimated Regression Equation
221
§§
§ §§
! x xn
y x x yn
b
xb yb 10 !
variabledependentor mean valuey
t variableindependenor mean valuex
!
!

8/8/2019 Chapter 3_Regression Analysis1
http://slidepdf.com/reader/full/chapter-3regression-analysis1 12/35
Simple Linear Regression
Reed Auto periodically has a special week-longsale. As part of the advertising campaign Reedruns one or more television commercials duringthe weekend preceding the sale. Data from a
sample of 5 previous sales are shown below.
Number of TV Ads Number of Cars Sold
1 143 24
2 18
1 17
3 27

8/8/2019 Chapter 3_Regression Analysis1
http://slidepdf.com/reader/full/chapter-3regression-analysis1 13/35
The HRD manager of a company wants to find a
measure which he can use to fix the monthly
income of persons applying for a job in the
production department. As an experimental
project, he collected data on 7 persons from that
department referring to years of service and their
monthly income (in 000¶s).
Years of
experience 11 7 9 5 8 6 10Income 10 8 6 5 9 7 11

8/8/2019 Chapter 3_Regression Analysis1
http://slidepdf.com/reader/full/chapter-3regression-analysis1 14/35
Find the regression equation of income onyears of service.
What initial start would you recommend for a person applying for the job after having
served in a similar capacity in another company for 13 years?
Do you think other factors are to beconsidered (in addition to the years of service) in fixing the income? Explain.

8/8/2019 Chapter 3_Regression Analysis1
http://slidepdf.com/reader/full/chapter-3regression-analysis1 15/35
Properties of regression lines andtheir coefficients:
1. Correlation coefficient is thegeometric mean between theregression coefficient
2. The sign of correlation coefficient isthe same as that of regressioncoefficient.
3. Regression coefficients aredependent of the change origin but
not of scale.

8/8/2019 Chapter 3_Regression Analysis1
http://slidepdf.com/reader/full/chapter-3regression-analysis1 16/35
In partially destroyed laboratory recordof an analysis of correlation data, the
following results only are available.Variance of X is 9Regression equations :
8x-10y+66=040x-18y=214Find
1. The mean values of x and y
2. The correlation coefficientbetween x and y
3. The standard deviation of y

8/8/2019 Chapter 3_Regression Analysis1
http://slidepdf.com/reader/full/chapter-3regression-analysis1 17/35
In finance, it is of interest to look at the relationship
between Y, a stock¶s average return, and X, the
overall market return. The slope coefficient computed
by linear regression is called the stock¶s beta by
investment analysts. A beta greater than 1 indicates
that the stock is relatively sensitive to changes in the
market; a beta less than 1 indicates that the stock is
relatively insensitive. For the following data, compute
the beta and suggest market trend.
X(%)
10 12 8 15 9 11 8 10 13 11
Y
(%)11 15 3 18 10 12 6 7 18 13

8/8/2019 Chapter 3_Regression Analysis1
http://slidepdf.com/reader/full/chapter-3regression-analysis1 18/35
Multiple regression Analysis

8/8/2019 Chapter 3_Regression Analysis1
http://slidepdf.com/reader/full/chapter-3regression-analysis1 19/35
A linear regression equation with morethan one independent variable is called a
mul t ipl e regression mod el.

8/8/2019 Chapter 3_Regression Analysis1
http://slidepdf.com/reader/full/chapter-3regression-analysis1 20/35
chance.todueerrorrandomtheis
variable.tindependenxtheof eachwith
associatedtscoefficienregressiontheare...
constantais
estimatedbetovariabledependentof valuetheisy
where
x........xxxy:formthetakesvariablestindependenk
withequationregressionlinearThe
k
k 2,1,
0
k k 3322110
y
y
y
y
!

8/8/2019 Chapter 3_Regression Analysis1
http://slidepdf.com/reader/full/chapter-3regression-analysis1 21/35
technique.squaresleastof principlethebyobtained
areandtscoefficienregressionpartial....bb,b,b
yvariabledependentof valueestimatedtheisy
where
)y-(y(SSE)errorssquaresof sumthe
minimizeswhichxb.......xbxbbybeequationregressionlinearfittedtheLet
k 321
2
k k 22110
y
y
!
!
§
Ö
Ö
Ö

8/8/2019 Chapter 3_Regression Analysis1
http://slidepdf.com/reader/full/chapter-3regression-analysis1 22/35
Let us consider the case where two
independent variables and a dependent
variable.

8/8/2019 Chapter 3_Regression Analysis1
http://slidepdf.com/reader/full/chapter-3regression-analysis1 23/35
ts.coefficienregressiontheare,
intercept.-ytheis
chance.todueerrorrandomtheis
variables.tindependenarexand x
variabledependenttheisywhere
xxy
:isvariablestindependentwoinvolving
modelregressionlinearmultipleThe
21
0
21
22110
y
y
y
y
y
!

8/8/2019 Chapter 3_Regression Analysis1
http://slidepdf.com/reader/full/chapter-3regression-analysis1 24/35
§!
y
y
y
!
!
2
21,0
21
2y2.11y1.20
22110
)y-(y(SSE)errorssquresof sumtheminimizeswhich
techniquesquaresleastof priniplethebydeterminedare
andconstantsunknownthearebb,b
variables.tindependenthearex,x
y.variabledependentof valueestimatedtheisywhere
xbxbby
xbxbby
beequationregressionlinearmultiplefittedtheLet
Ö
Ö
Ö
Ö
or

8/8/2019 Chapter 3_Regression Analysis1
http://slidepdf.com/reader/full/chapter-3regression-analysis1 25/35
§ §§§
§ §§§§ §§
!
!
!
2
2y2.121y1.2202
21y2.1
2
1y1.2101
2y2.11y1.20
210
xbxxbxbxy
xxbxbxbxy
xbxbnby
.determinedbecanb,b,b
of valuestheequationsfollowingthesolvingBy
8/8/2019 Chapter 3_Regression Analysis1
http://slidepdf.com/reader/full/chapter-3regression-analysis1 26/35
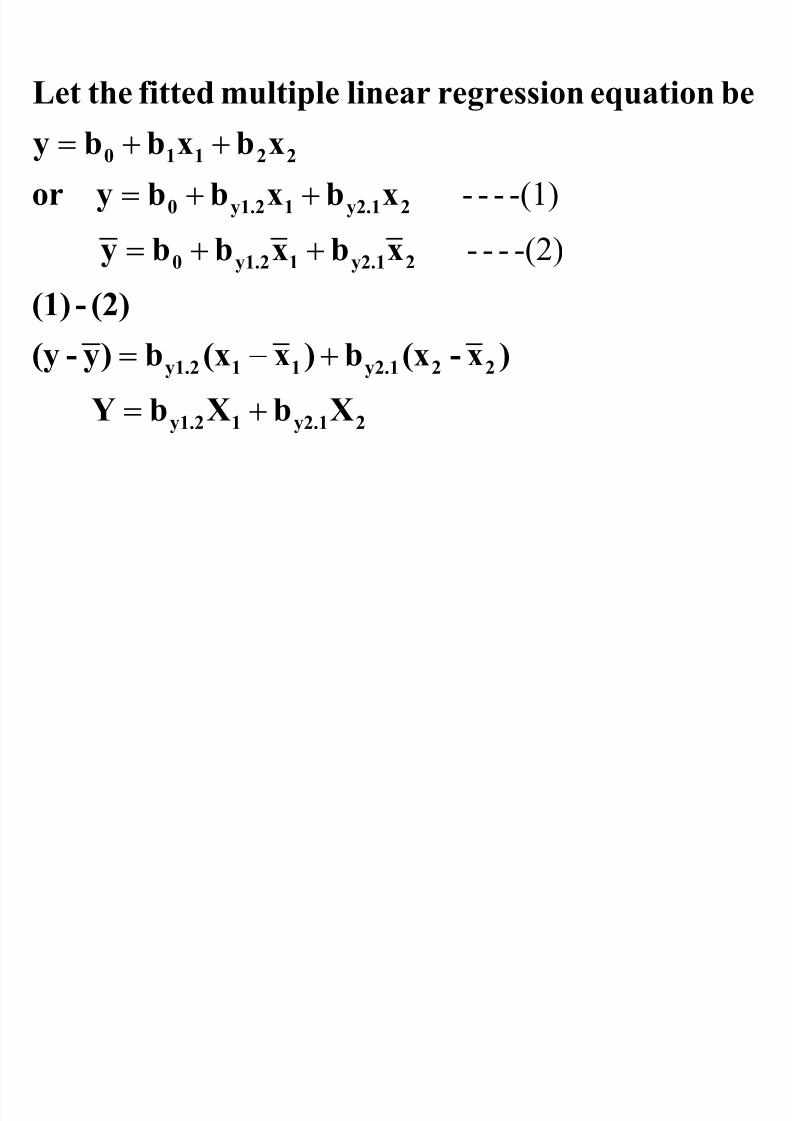
2y2.11y1.2
22y2.111y1.2
2y2.11y1.20
2y2.11y1.20
22110
XbXbY
)x-(xb)x(xb)y-(y
(2)-(1)
xbxbby
xbxbbyor
xbxbby
beequationregressionlinearmultiplefittedtheLet
!
!
!
!!
-(2)---
-(1)---

8/8/2019 Chapter 3_Regression Analysis1
http://slidepdf.com/reader/full/chapter-3regression-analysis1 27/35
xxX
xxXy-yY
where
XXXX
XXXYXXY
b
XXXX
XXXYXXYb
222
111
2
2122
21
121
2
12
y2.1
2
21
2
2
2
1
122
2
21
y1.2
!
!!
v
vv
!
v
vv!
§§§§§§§
§§§
§§§§

8/8/2019 Chapter 3_Regression Analysis1
http://slidepdf.com/reader/full/chapter-3regression-analysis1 28/35
§§
§
§§§
§§§
v!!
v!!
v!!
¹¹ º
¸©©ª
¨
v
!
¹
¹
º
¸
©
©
ª
¨
v
!
22
21
21
2112
2
2
2
22y2
2
1
2
1
1y1
2
y
2
12
12y1y2
y2.1
1
y
2
12
12y2y1
y1.2
XX
XXx&xb/wncorrelatiother
XYXYx&yb/wncorrelatiother
XY
XYx&yb/wncorrelatiother
r1
)r(rrb
r1
)r(rrb
:tscoefficiennCorrelatio&
tscoefficienregressionpartialb/wipRelationsh

8/8/2019 Chapter 3_Regression Analysis1
http://slidepdf.com/reader/full/chapter-3regression-analysis1 29/35
A marketing manager of a company wants
to predict demand for the product. He isbelieving strongly demand is highly
influenced by annual average price of the
product (in units) & advertising
expenditure (Rs in lakh).He has collectedpast data to know the effect of these
factors on demand and given below:
Y 4 6 7 9 13 15
X1 15 12 8 6 4 3
X2 30 24 20 14 10 4

8/8/2019 Chapter 3_Regression Analysis1
http://slidepdf.com/reader/full/chapter-3regression-analysis1 30/35
cc.52.5isvolumeandmm58islengthwhose
egganof weighttheestimateHencevolume.andlengthitson
weighteggof equationregressionlineartheObtain
0.974r 0.581r 0.578r
4.41 4.39 2.26
56.03y 51.48x 55.95x
eggs.300of gm)(inweightand
cc)(involumemm),(inlengthontmeasuremen
fromobtainedareresultsfollowingThe
12y2y1
y21
21
!!!
!!!
!!!

8/8/2019 Chapter 3_Regression Analysis1
http://slidepdf.com/reader/full/chapter-3regression-analysis1 31/35
The Federal Reserve is performing a
preliminary study to determine the
relationship between certain economic
indicators and annual percentage change
in the gross national product (GNP). Two
such indicators being examined are theamount of the federal government¶s deficit
(in billions of dollars) and the Dow Jones
Industrial Average (the mean value over
the year). Data for 6 years follow:

8/8/2019 Chapter 3_Regression Analysis1
http://slidepdf.com/reader/full/chapter-3regression-analysis1 32/35
Change in GNP 2.5 -1.0 4.0 1.0 1.5 3.0
Federal Deficit 100.0 400.0 120.0 200.0 180.0 80.0Dow Jones 2850 2100 3300 2400 2550 2700
i) Calculate the least squares equation that bestdescribes the data.
ii) What % change in GNP would be expected in a year in which the federal deficit was $240 billion and themean Dow Jones value was 3000?

8/8/2019 Chapter 3_Regression Analysis1
http://slidepdf.com/reader/full/chapter-3regression-analysis1 33/35
Multiple correlation analysis:
It is a measure of association
between a dependent variable and severalindependent variables taken together.

8/8/2019 Chapter 3_Regression Analysis1
http://slidepdf.com/reader/full/chapter-3regression-analysis1 34/35
The coefficient of multiple correlation is given
by,
1.a0et eeilieal aysval eItsr1
rr2rrr2
12
12y2y1
2
y2
2
y1
y.12
!

8/8/2019 Chapter 3_Regression Analysis1
http://slidepdf.com/reader/full/chapter-3regression-analysis1 35/35
Coefficient of multiple determination:
It is the proportion of the total variation
in the multiple values of dependent
variable y, accounted for or explained bythe independent variables in the multiple
regression model.
The square of coefficient of multiple
correlation is called Coefficient of multiple
determination.