Chapter 3A: Status of Water Quality in the Everglades...
59
2011 South Florida Environmental Report Chapter 3A 3A-1 Chapter 3A: Status of Water Quality in the Everglades Protection Area Grover G. Payne 1 , Katie Hallas 2 and Shi Kui Xue SUMMARY This chapter was prepared by the Florida Department of Environmental Protection (FDEP) with the support of the South Florida Water Management District (District or SFWMD). It is intended to: (1) provide an assessment of water quality within the Everglades Protection Area (EPA) during Water Year 2010 (WY2010) (May 1, 2009–April 30, 2010), (2) fulfill numerous reporting requirements of the Everglades Forever Act (EFA), (3) provide a preliminary assessment of total phosphorus (TP) criterion achievement, and (4) provide an annual update of the comprehensive overview of nitrogen and phosphorus levels throughout the EPA. The information provided in this chapter is an update to Chapter 3A of the 2010 South Florida Environmental Report (SFER) – Volume I. The reporting requirements of the non-Everglades Construction Project permit and the Interim Operational Plan for Protection of the Cape Sable Seaside Sparrow, which were previously included in this chapter, are presented in Volume III, Appendices 3-2 and 5-2, respectively. WATER QUALITY CRITERIA EXCURSION ANALYSIS The analyses and summaries presented provide a synoptic view of water quality conditions in the EPA on a regional scale, including the Arthur R. Marshall Loxahatchee National Wildlife Refuge (Refuge), Water Conservation Areas 2 and 3 (WCA-2 and WCA-3), and the Everglades National Park (ENP or Park). For parameters with water quality criteria, regional analyses were conducted based on the frequency of exceedances of the applicable criteria, similar to the methods employed in the 1999 Everglades Interim Report, 2000–2004 Everglades Consolidated Reports (ECRs), and 2005–2010 SFERs. For WY2010, water quality parameters that did not meet existing standards were classified into three categories based on excursion frequencies that were statistically tested using the binomial hypothesis test (or raw score method where data are limited). These categories are: (1) concern – any parameter with a criterion exceedance frequency statistically greater than 10 percent, (2) potential concern – any parameter with an exceedance frequency statistically greater than 5 percent but less than 10 percent, and (3) minimal concern – any parameter with an exceedance frequency less than 5 percent but greater than zero. With a few exceptions, water quality was in compliance with existing state water quality criteria during WY2010. Comparisons of WY2010 water quality data with applicable Class III water quality criteria revealed excursions for five parameters: dissolved oxygen (DO), alkalinity, 1 Florida Department of Environmental Protection, Division of Environmental Assessment and Restoration, Environmental Assessment and Support Program, Tallahassee, FL 2 Florida Department of Environmental Protection, Division of Environmental Assessment and Restoration, Restoration Planning and Permitting Program, Tallahassee, FL
Transcript of Chapter 3A: Status of Water Quality in the Everglades...

2011 South Florida Environmental Report Chapter 3A
3A-1
Chapter 3A: Status of Water Quality in the Everglades
Protection Area Grover G. Payne1, Katie Hallas2 and Shi Kui Xue
SUMMARY
This chapter was prepared by the Florida Department of Environmental Protection (FDEP) with the support of the South Florida Water Management District (District or SFWMD). It is intended to: (1) provide an assessment of water quality within the Everglades Protection Area (EPA) during Water Year 2010 (WY2010) (May 1, 2009–April 30, 2010), (2) fulfill numerous reporting requirements of the Everglades Forever Act (EFA), (3) provide a preliminary assessment of total phosphorus (TP) criterion achievement, and (4) provide an annual update of the comprehensive overview of nitrogen and phosphorus levels throughout the EPA. The information provided in this chapter is an update to Chapter 3A of the 2010 South Florida Environmental Report (SFER) – Volume I. The reporting requirements of the non-Everglades Construction Project permit and the Interim Operational Plan for Protection of the Cape Sable Seaside Sparrow, which were previously included in this chapter, are presented in Volume III, Appendices 3-2 and 5-2, respectively.
WATER QUALITY CRITERIA EXCURSION ANALYSIS
The analyses and summaries presented provide a synoptic view of water quality conditions in the EPA on a regional scale, including the Arthur R. Marshall Loxahatchee National Wildlife Refuge (Refuge), Water Conservation Areas 2 and 3 (WCA-2 and WCA-3), and the Everglades National Park (ENP or Park). For parameters with water quality criteria, regional analyses were conducted based on the frequency of exceedances of the applicable criteria, similar to the methods employed in the 1999 Everglades Interim Report, 2000–2004 Everglades Consolidated Reports (ECRs), and 2005–2010 SFERs. For WY2010, water quality parameters that did not meet existing standards were classified into three categories based on excursion frequencies that were statistically tested using the binomial hypothesis test (or raw score method where data are limited). These categories are: (1) concern – any parameter with a criterion exceedance frequency statistically greater than 10 percent, (2) potential concern – any parameter with an exceedance frequency statistically greater than 5 percent but less than 10 percent, and (3) minimal concern – any parameter with an exceedance frequency less than 5 percent but greater than zero.
With a few exceptions, water quality was in compliance with existing state water quality criteria during WY2010. Comparisons of WY2010 water quality data with applicable Class III water quality criteria revealed excursions for five parameters: dissolved oxygen (DO), alkalinity,
1 Florida Department of Environmental Protection, Division of Environmental Assessment and Restoration, Environmental Assessment and Support Program, Tallahassee, FL
2 Florida Department of Environmental Protection, Division of Environmental Assessment and Restoration, Restoration Planning and Permitting Program, Tallahassee, FL

Chapter 3A Volume I: The South Florida Environment
3A-2
pH, specific conductance, and un-ionized ammonia. Similar to previous periods, these excursions were localized to specific areas of the EPA, and all of these parameters exhibited excursions in WY2009. In WY2009, two exceedances of the turbidity criterion were reported; however, in WY2010 no exceedances were observed.
Dissolved Oxygen
Because DO is assessed as an annual station average rather than as point measures, insufficient data were available to confidently apply the binominal hypothesis test to the regional assessment units. Excursion categories were based on a five-year period of record (WY2006–WY2010). During WY2010, excursions of the DO site-specific alternative criterion only occurred at interior sites in the Refuge and WCA-2 and inflow sites of WCA-3. Based on the five-year period of record (POR), DO was classified as a concern for the interiors of the Refuge and WCA-2 and as a minimal concern for the WCA-3 inflows. Most of the DO excursions observed during the five-year POR were associated with sites historically impacted by phosphorus enrichment.
Alkalinity and pH
As in previous years, exceedances of the alkalinity and the pH criteria were observed in the Refuge, which is a soft-water system hydrologically dominated by rainfall and naturally low in alkalinity. The FDEP considers the low alkalinity values to be representative of the natural range of variability within the Refuge; therefore, these should not be considered violations of state water quality standards. The pH levels slightly below the Class III criteria frequently observed at interior sites in the Refuge have been linked to the naturally low alkalinity conditions and generally occur at sites well away from the influence of inflows. The FDEP does not consider the observed pH excursions within the interior of the Refuge to be in violation of state water quality standards. Additionally, the inflow data for WCA-2 and the Refuge showed two and one pH measurements above the state criterion, respectively, and were therefore categorized as minimal concern for these areas. These pH levels, which were slightly above the 8.0 pH unit limit, likely resulted from high rates of photosynthetic activity during low flow conditions.
Specific Conductance
During WY2010, specific conductance was categorized as a minimal concern for the Refuge inflows and Rim Canal sites, WCA-2 inflows and interior sites, and WCA-3 inflows. Site specifically, higher exceedance frequencies resulted in specific conductance being categorized as a concern at the G-335 inflow site to WCA-2. Previous ECRs and SFERs explained that the elevated conductivity levels at water control structures (e.g., G-335) and interior stations near canal inflows were probably linked to groundwater intrusion into canal surface waters (Weaver et al., 2001, 2002). This groundwater intrusion can be caused by (1) seepage into canals, (2) pumping station operations (which can pull additional groundwater into surface water), and (3) agricultural dewatering practices.
Specific conductance excursion frequency in WCA-2 inflows declined significantly from 25.2 and 9.3 percent for the baseline (WY1979–WY1993) and Phase I (WY1994–WY2004) periods, respectively. Furthermore, excursion frequencies decreased from 10.6 percent in Phase II (WY2005–WY2009) to 6.9 percent in WY2010. Likewise, excursion frequencies in the Refuge inflows fell from 39.6 and 14.4 percent during the baseline and Phase I periods, respectively, to 3.8 percent in WY2010, which is a decrease from the 9.5 percent observed in WY2009.
2011 South Florida Environmental Report Chapter 3A
3A-3
Un-ionized Ammonia
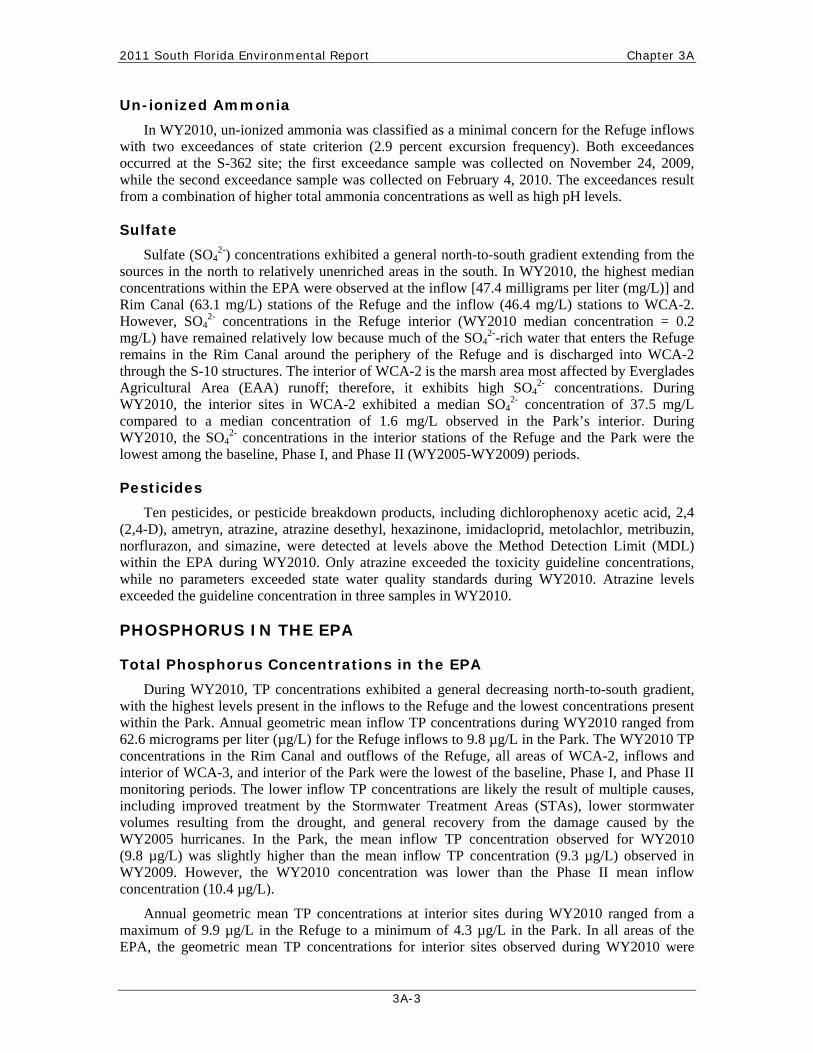
In WY2010, un-ionized ammonia was classified as a minimal concern for the Refuge inflows with two exceedances of state criterion (2.9 percent excursion frequency). Both exceedances occurred at the S-362 site; the first exceedance sample was collected on November 24, 2009, while the second exceedance sample was collected on February 4, 2010. The exceedances result from a combination of higher total ammonia concentrations as well as high pH levels.
Sulfate
Sulfate (SO42-) concentrations exhibited a general north-to-south gradient extending from the
sources in the north to relatively unenriched areas in the south. In WY2010, the highest median concentrations within the EPA were observed at the inflow [47.4 milligrams per liter (mg/L)] and Rim Canal (63.1 mg/L) stations of the Refuge and the inflow (46.4 mg/L) stations to WCA-2. However, SO4
2- concentrations in the Refuge interior (WY2010 median concentration = 0.2 mg/L) have remained relatively low because much of the SO4
2--rich water that enters the Refuge remains in the Rim Canal around the periphery of the Refuge and is discharged into WCA-2 through the S-10 structures. The interior of WCA-2 is the marsh area most affected by Everglades Agricultural Area (EAA) runoff; therefore, it exhibits high SO4
2- concentrations. During WY2010, the interior sites in WCA-2 exhibited a median SO4
2- concentration of 37.5 mg/L compared to a median concentration of 1.6 mg/L observed in the Park’s interior. During WY2010, the SO4
2- concentrations in the interior stations of the Refuge and the Park were the lowest among the baseline, Phase I, and Phase II (WY2005-WY2009) periods.
Pesticides
Ten pesticides, or pesticide breakdown products, including dichlorophenoxy acetic acid, 2,4 (2,4-D), ametryn, atrazine, atrazine desethyl, hexazinone, imidacloprid, metolachlor, metribuzin, norflurazon, and simazine, were detected at levels above the Method Detection Limit (MDL) within the EPA during WY2010. Only atrazine exceeded the toxicity guideline concentrations, while no parameters exceeded state water quality standards during WY2010. Atrazine levels exceeded the guideline concentration in three samples in WY2010.
PHOSPHORUS IN THE EPA
Total Phosphorus Concentrations in the EPA
During WY2010, TP concentrations exhibited a general decreasing north-to-south gradient, with the highest levels present in the inflows to the Refuge and the lowest concentrations present within the Park. Annual geometric mean inflow TP concentrations during WY2010 ranged from 62.6 micrograms per liter (µg/L) for the Refuge inflows to 9.8 µg/L in the Park. The WY2010 TP concentrations in the Rim Canal and outflows of the Refuge, all areas of WCA-2, inflows and interior of WCA-3, and interior of the Park were the lowest of the baseline, Phase I, and Phase II monitoring periods. The lower inflow TP concentrations are likely the result of multiple causes, including improved treatment by the Stormwater Treatment Areas (STAs), lower stormwater volumes resulting from the drought, and general recovery from the damage caused by the WY2005 hurricanes. In the Park, the mean inflow TP concentration observed for WY2010 (9.8 µg/L) was slightly higher than the mean inflow TP concentration (9.3 µg/L) observed in WY2009. However, the WY2010 concentration was lower than the Phase II mean inflow concentration (10.4 µg/L).
Annual geometric mean TP concentrations at interior sites during WY2010 ranged from a maximum of 9.9 µg/L in the Refuge to a minimum of 4.3 µg/L in the Park. In all areas of the EPA, the geometric mean TP concentrations for interior sites observed during WY2010 were

Chapter 3A Volume I: The South Florida Environment
3A-4
below the 10.0 µg/L five-year and 11.0 µg/L annual limits for assessing achievement of the TP criterion, with the mean concentrations in the Park and WCA-3 being well below these limits. The geometric mean TP concentrations at interior sites within all portions of the EPA, except for the Refuge, were the lowest among the four monitoring periods. The geometric mean TP concentration in the interior of the Refuge was 9.9 µg/L, which is less than the baseline and Phase II periods, but slightly above the Phase I period (9.6 µg/L). For WCA-2, the geometric mean TP concentration of 9.5 µg/L determined for interior sites during WY2010 represents the first time in the WY1979–WY2010 POR, except for WY1993, that the annual mean concentration has been below 10.0 µg/L. During WY1993, only 15 samples were collected at three sites in the interior of WCA-2, which resulted in an annual mean concentration well below 10 µg/L; however, that concentration is probably not representative of the overall conditions in WCA-2 during that year due to the limited number of samples collected. The low TP concentrations observed in WCA-2 during WY2010 likely represent continued recovery in one of the areas most highly impacted by historical phosphorus enrichment.
Annual geometric mean TP concentrations for individual interior marsh monitoring stations during WY2010 ranged from less than 3.0 µg/L in some unimpacted portions of the marsh to 57.0 µg/L at a Refuge site, which is highly influenced by canal inputs. During WY2010, 85.4 percent of the interior marsh sites in the EPA exhibited annual geometric mean TP concentrations of 15.0 µg/L or less, with 69.7 percent of the marsh sites having annual geometric mean TP concentrations of 10.0 µg/L or less.
Orthophosphate Concentrations in the EPA
During WY2010, orthophosphate (OP) concentrations at all stations (e.g., inflow, interior, rim, and outflow) within the EPA were lower than the levels observed during the baseline, Phase I, and Phase II periods. Inflow concentrations ranged from 8.3 µg/L in the Refuge to 1.2 µg/L in the Park.
The annual geometric mean OP concentration levels at interior sites during WY2010 were less than 2.0 µg/L for all areas. The lower OP levels determined for both the inflows and interior sites during WY2010 further show the continued recovery from the recent extreme climatic events, the preferential removal of OP by the STAs, and the effects of restoration activities to improve the overall phosphorus conditions in the interior marsh areas of the EPA.
Total Phosphorus Loads to the EPA
During WY2010, TP loads from surface sources to the EPA totaled approximately 85.0 metric tons (mt), with a flow-weighted mean concentration (FWMC) of 29.0 µg/L. Another 193 mt of TP are estimated to have entered the EPA through atmospheric deposition. The 85.0 mt of TP load in the surface inflows to the EPA represent an increase of approximately 31 percent compared to the previous year (65.0 mt in WY2009). The 2,410,298 acre-feet (ac-ft) of surface water flow to the EPA determined for WY2010 is approximately 18 percent higher than the 2,037,918 ac-ft reported for WY2009. Therefore, the higher TP loads to the EPA during WY2010 were primarily the result of increased flow volumes above those observed in WY2009.
The effectiveness of the Best Management Practices (BMPs) and STA phosphorus removal efforts is demonstrated by the decreased TP loading to the Refuge, WCA-2, and WCA-3 during the Phase I and Phase II periods compared to the baseline period (despite increased flows to the EPA). The effect of the phosphorus removal efforts is less apparent in the Park, where inflow concentrations have remained near background levels and TP loading responds more directly to changes in flow and climatic conditions.

2011 South Florida Environmental Report Chapter 3A
3A-5
The average flow and TP load for the more recent Phase II period (WY2005–WY2009) and WY2010 were influenced by the effects of extreme climatic events, including both multiple tropical rainfall events (WY2005 and WY2006) and prolonged periods of drought (WY2007–WY2008). Additional years of monitoring are needed before the effects of the current Phase II BMP/STA optimization projects can be seen in the Refuge. In general, TP levels for WY2010 across all areas and classes of sites were similar to or lower than those for the WY2005–WY2009 and WY2010 period and were within the range exhibited during the earlier periods. Future SFERs are expected to continue to track long-term trends in TP levels throughout the EPA.
Phosphorus Criterion Achievement Assessment in the EPA
Phosphorus criterion achievement is mandated for the most recent five reporting years; for this report, the POR is WY2006–WY2010. The results of this WY2006–WY2010 TP criterion assessment indicate that the unimpacted (i.e., non-phosphorus enriched) portions of each WCA passed all four parts of the compliance test. Therefore, these sites are in compliance with the 10 µg/L TP criterion. Occasionally, individual sites within the unimpacted portions of the WCAs exhibited an annual site geometric mean TP concentration above 10 µg/L, but in no case did the values for the individual unimpacted sites cause an overall exceedance of the annual or long-term network limits. During WY2010, none of the annual geometric mean TP concentrations for the individual unimpacted sites exceeded the 15 µg/L annual site limit.
In contrast, the impacted (i.e., phosphorus enriched) portions of each water body failed one or more parts of the test. The impacted portions of the WCAs routinely exceeded the annual and five-year network TP concentration limits of 11 µg/L and 10 µg/L, respectively. Occasionally, selected individual sites within the impacted areas exhibited annual geometric mean TP concentrations below the 15 µg/L annual site limit. In a few instances, the annual mean for individual impacted sites was below 10 µg/L; however, none of the impacted sites were consistently below the 10 µg/L long-term limit. Except for the impacted portion of WCA-3, the annual network geometric mean TP concentrations for WY2010 were the lowest of the five-year assessment period. In the impacted area of WCA-3, only three of the five sites had sufficient data for WY2010 to be included in the assessment.
Future TP criterion achievement assessments conducted with increasingly complete datasets are expected to provide a better understanding of phosphorus concentrations in the EPA.
TOTAL NITROGEN CONCENTRATIONS IN THE EPA
Due to the nitrogen-enriched agricultural discharges to the northern portions of the system and assimilative processes in the marshes that result in a gradual reduction in levels as the water moves to the south, total nitrogen (TN) concentrations in the EPA during WY2010 exhibited a north-to-south gradient as documented in previous years. The highest average TN concentrations were observed in the inflows to the Refuge (2.68 mg/L), and the lowest concentrations were observed within the Park (1.09 mg/L).
During WY2010, the geometric mean TN concentrations for the interior sites in the Refuge and WCA-2 were slightly lower than the levels for any of the preceding reporting periods. In addition, the mean TN inflow concentrations for WCA-2 were slightly below those for the other reporting periods. Slight increases in TN concentrations were observed for the inflow, interior, and outflow sites of WCA-3 and for the inflow and interior sites of the Park; however, these increases were not significant. In WY2010, TN concentrations at interior marsh sites ranged from 1.09 mg/L in the Park to 1.93 mg/L in WCA-2.

Chapter 3A Volume I: The South Florida Environment
3A-6
PURPOSE
The primary purpose of this chapter is to provide an assessment of water quality within the Everglades Protection Area (EPA) during Water Year 2010 (WY2010) (May 1, 2009–April 30, 2010) and an update to the information provided in Chapter 3A of the 2010 South Florida Environmental Report (SFER) – Volume I.
The chapter is intended to fulfill the requirement of the Everglades Forever Act (EFA) that the annual report “shall identify water quality parameters, in addition to phosphorus, which exceed state water quality standards or are causing or contributing to adverse impacts in the Everglades Protection Area.” In addition, this chapter provides an annual update of the comprehensive overview of nitrogen (N) and phosphorus (P) levels throughout the EPA along with a preliminary assessment of total phosphorus (TP) criterion achievement utilizing the protocol provided in the 2007 SFER – Volume I, Chapter 3C.
More specifically, this chapter and its associated appendices use water quality data collected during WY2010 to achieve the following objectives:
1. Summarize areas and times where water quality criteria are not being met, and indicate trends in excursions over space and time.
2. Discuss factors contributing to excursions from water quality criteria, and provide an evaluation of natural background conditions where existing standards may not be appropriate.
3. Summarize sulfate (SO42-) concentrations in the EPA, and indicate spatial and
temporal trends.
4. Present an updated review of pesticide and priority pollutant data made available during WY2010.
5. Present a preliminary TP criterion achievement assessment for different areas within the EPA for the most recent five-year period (i.e., WY2006–WY2010).
6. Summarize P and N concentrations measured in surface waters within different portions of the EPA.
7. Provide a summary of the flow and phosphorus loads entering different portions of the EPA during WY2010, and describe spatial and temporal trends observed.
8. Describe and discuss factors contributing to any spatial and temporal trends observed.

2011 South Florida Environmental Report Chapter 3A
3A-7
METHODS
A regional synoptic approach similar to that used for water quality evaluations in previous SFERs was applied to P and N data for WY2010 to provide an overview of water quality status within the EPA. Consolidating regional water quality data provides for analysis over time but limits spatial analyses within each region. However, spatial analyses can be made between regions because the majority of inflow and pollutants enter the northern third of the EPA, and the net water flow is from north to south.
WATER QUALITY DATA SOURCES
The majority of the water quality data evaluated in this chapter were retrieved from the South Florida Water Management District’s (SFWMD or District) DBHYDRO database. The DBHYDRO monitoring projects evaluated for WY2010 included C111D, CAMB, ENP, EVER, EVPA, HOLY, LOXA, NECP, STA1E, STA1W, STA2, and PEST. Additionally, water quality data from the nutrient gradient sampling stations monitored by the District in the northern part of Water Conservation Area 3A (WCA-3A), the southwestern part of the Arthur R. Marshall Loxahatchee National Wildlife Refuge (Refuge), the west-central portion of WCA-3A, and Taylor Slough in Everglades National Park (ENP or Park) were obtained from the District’s Everglades Division database.
WATER QUALITY SAMPLING STATIONS IN THE EPA
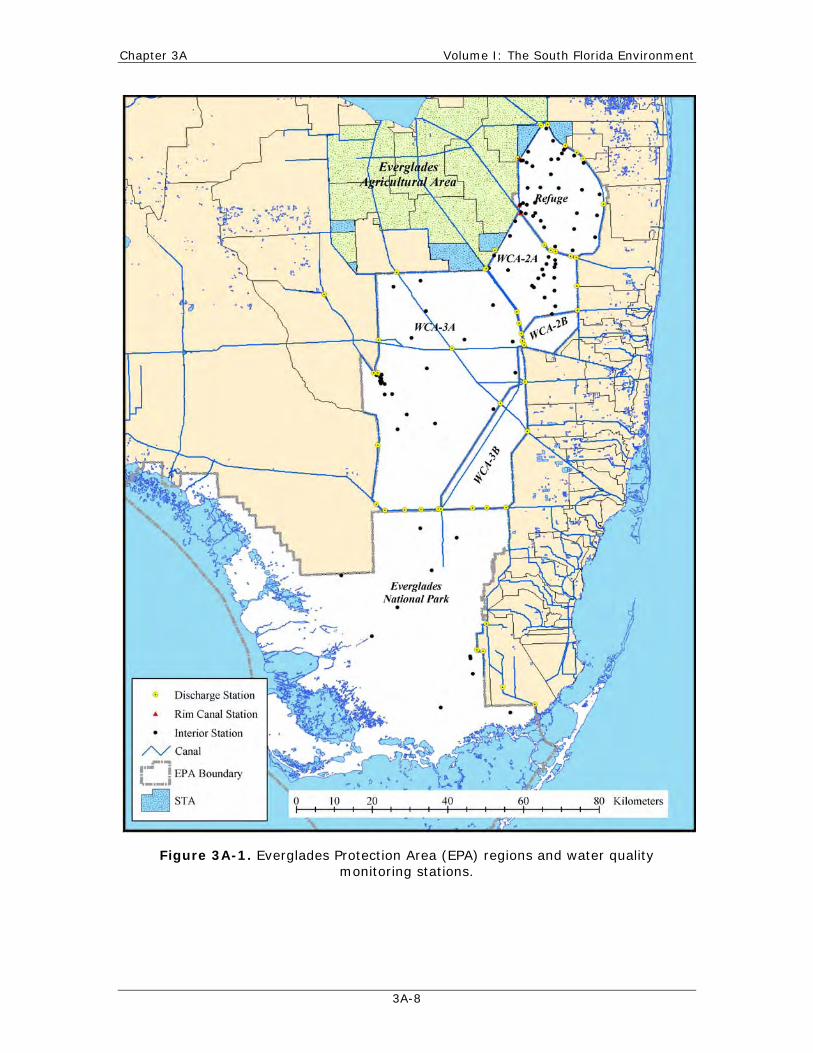
In order to efficiently assess the annual water quality standard violations and the long-term trends, a network of water quality sampling sites has been identified (Figure 3A-1). These sites are part of the District’s existing long-term monitoring projects and are monitored for different purposes. These stations were carefully selected to be representative of either the EPA boundary conditions (i.e., inflow or outflow) or ambient marsh conditions (interior). Furthermore, an effort has been made to utilize a consistent group of stations among previous annual consolidated reports to ensure consistent and comparable results. To further ensure that data are comparable from year-to-year and are of high quality, every attempt is made to maintain the same sampling frequency for the network of monitoring sites to ensure a consistent number of samples across years, and the data available for each year undergo the same careful quality assurance/quality control (QA/QC) screening to assure accuracy.
Chapter 3A Volume I: The South Florida Environment
3A-8
Figure 3A-1. Everglades Protection Area (EPA) regions and water quality monitoring stations.

2011 South Florida Environmental Report Chapter 3A
3A-9
Water quality sampling stations located throughout the WCAs and the Park were categorized as inflow, interior, or outflow sites within each region based on their location and function (Figure 3A-1). This organization of monitoring sites allowed a more detailed analysis of the water quality status in each region of the EPA and assisted in the evaluation of potential causes for observed excursions from Class III water quality criteria.
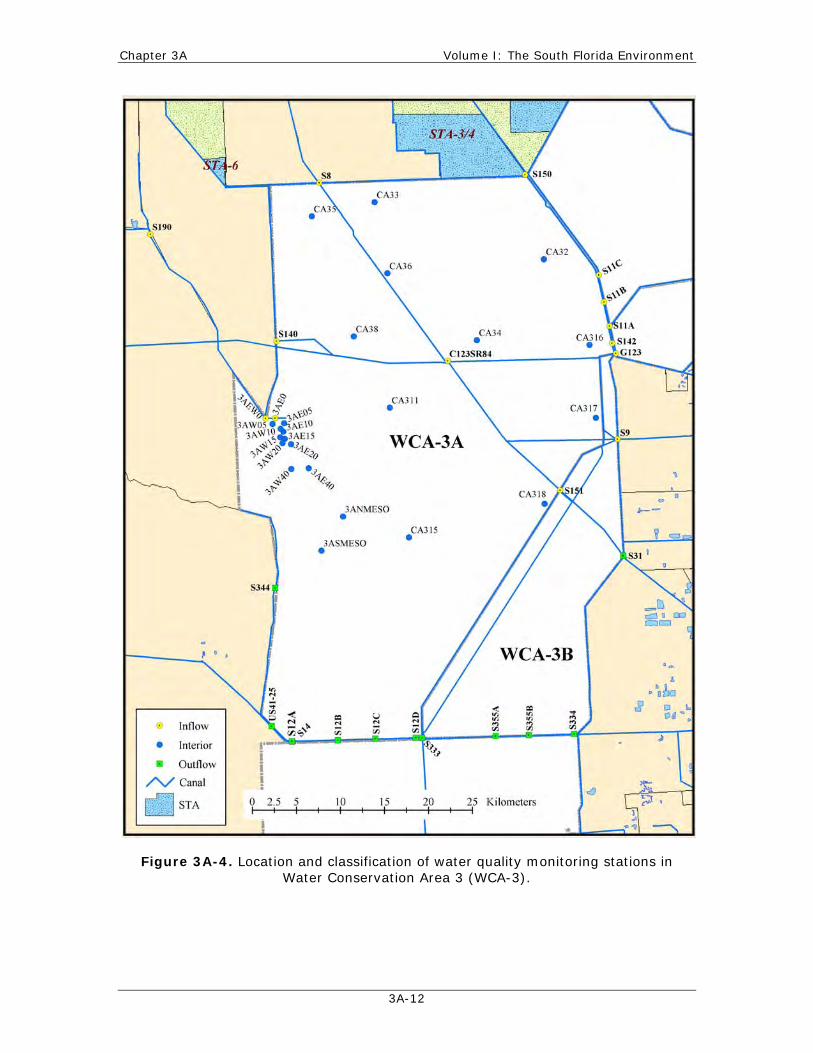
Several interior structures convey water between different regions in the EPA and therefore are designated as both inflow and outflow stations based on this categorization system. For example, the S-10 structures act as both outflow stations for the Refuge and inflow sites to Water WCA-2 (Figures 3A-2 and 3A-3). Additionally, the S-11 structures are designated as outflows from WCA-2 as well as inflow points to WCA-3 (Figures 3A-3 and 3A-4). The S-12 structures, S-355A, S-355B, and S-333, are outflows from WCA-3 and are also inflow sites to the Park (Figures 3A-4 and 3A-5). The interior sites of each region consist of marsh and canal stations as well as structures that convey water within the area.
In addition to inflow, outflow, and interior sites, the Refuge has an additional site category (Rim Canal sites) to account for the fact that much of the water entering the interior of the Refuge is conveyed in Rim canals that border the east and west levees of the Refuge (Figure 3A-2). Waters discharged to the L-7 Rim Canal will either overflow into the Refuge interior when canal stages exceed the levee height or will bypass the marsh and be discharged to WCA-2A through the S-10 structures. The extent (distance) to which Rim Canal overflows penetrate the marsh depends on the relative stages of the L-7 Rim Canal and the Refuge interior.
The current District monitoring programs were described by Germain (1998). Sampling frequency varies by site depending on site classification, parameter group, and hydrologic conditions (e.g., water depth and flow). Water control structures (inflows and outflows) were typically sampled biweekly when flowing; otherwise, sampling was performed monthly. Generally, interior monitoring stations were sampled monthly for most parameters reported in this chapter. Pesticide monitoring is conducted across the entire SFWMD at 15 sites on a quarterly basis. An overview of the water quality monitoring projects, including project descriptions and objectives with limited site-specific information, is available on the District’s website at www.sfwmd.gov/environmentalmonitoring.

Chapter 3A Volume I: The South Florida Environment
3A-10
Figure 3A-2. Location and classification of water quality monitoring stations in the Arthur R. Marshall Loxahatchee National Wildlife Refuge (Refuge).
Arthur R. Marshall
Loxahatchee National Wildlife
Refuge

2011 South Florida Environmental Report Chapter 3A
3A-11
Figure 3A-3. Location and classification of water quality monitoring stations in Water Conservation Area 2 (WCA-2).
Chapter 3A Volume I: The South Florida Environment
3A-12
Figure 3A-4. Location and classification of water quality monitoring stations in Water Conservation Area 3 (WCA-3).

2011 South Florida Environmental Report Chapter 3A
3A-13
Figure 3A-5. Location and classification of water quality monitoring stations in Everglades National Park (ENP or Park).
ANALYSIS PERIODS
As previously noted, the primary focus of this chapter is to summarize the status of water quality within the EPA during WY2010 and to describe trends or changes in water quality conditions over time. To accomplish this objective, comparisons are made across discrete multiple periods that correspond to major restoration activities occurring within the EPA. The four periods are: (1) the historical WY1979–WY1993 period (baseline), which corresponds to the time frame prior to implementation of the Everglades Agricultural Area (EAA) Best Management Practices (BMPs) Program and the Everglades Construction Project (ECP) [i.e., the Stormwater Treatment Areas (STAs)], (2) the intermediate WY1994–WY2004 period (Phase I), (3) the Phase II BMP/STA implementation period after WY2004 (i.e., WY2005–WY2009), and (4) WY2010.
Phase I represents the period in which implementation of the BMP Program was increasing, and all the initial STAs were constructed and became operational. The Phase II BMP/STA implementation period corresponds to the time in which the performance of the BMPs and STAs were being optimized and enhanced and various Long-Term Plan for Achieving Water Quality Goals in the Everglades Protection Area (Long-Term Plan) and Comprehensive Everglades Restoration Plan (CERP) restoration projects are being implemented. Because optimization and

Chapter 3A Volume I: The South Florida Environment
3A-14
enhancement (and other restoration activities) are expected to continue for a number of years, the Phase II period will be expanded in future SFERs to include the previous water year at the time of the report. In addition, data for the current water year (in this case, WY2010) will be used to make comparisons with the historic periods and will be analyzed independently as the fourth period. Individual station assessments and certain mandated reporting (e.g., TP criterion achievement) were based on the previous five water years (WY2006–WY2010), rather than on the single year used for regional analysis (e.g., WY2010). Reporting periods are specified in each section of this chapter.
DATA SCREENING AND HANDLING
Water quality data were screened based on laboratory qualifier codes, consistent with the Florida Department of Environmental Protection’s (FDEP) Quality Assurance Rule [Chapter 62-160, Florida Administrative Code (F.A.C.)]. Any datum with an associated fatal qualifier (H, J, K, N, O, V, Q, Y, or ?) was removed from the analysis (SFWMD, 2008). Values that exceeded possible physical or chemical measurement constraints [e.g., if resulting pH is greater than ( > ) 14], had temperatures well outside seasonal norms (e.g., 6° Celsius in July), or represented data transcription errors were excluded. Statistical outlier analysis was not performed for these data. All data passing the qualifier screening were used in the analysis. Multiple samples collected at the same location on the same day were considered as one sample, with the arithmetic mean used to represent the sampling period.
Additional considerations in the handling of water quality data are the accuracy and sensitivity of the laboratory method used. Each analytical method for a particular water quality constituent has a Method Detection Limit (MDL) that defines the minimum concentration or the level at which the constituent can be identified. The MDL is usually statistically above the background noise level associated with the analytical method. A constituent present in a concentration at or below the MDL may not be quantified within established limits of accuracy or precision using that method. The Practical Quantitation Limit (PQL) represents a practical and routinely achievable quantification level with a relatively good certainty that a value determined using that method is reliable (APHA, 1995). For purposes of summary statistics presented in this chapter, data reported as less than the MDL were assigned a value of one-half the MDL unless otherwise noted. All data presented in this chapter, including historical results, were handled consistently with regard to screening and MDL replacement.

2011 South Florida Environmental Report Chapter 3A
3A-15
WATER QUALITY DATA PARAMETERS
The District monitors approximately 109 water quality parameters within the EPA (Bechtel et al., 1999, 2000). Given this chapter’s focus on water quality criteria, the evaluation was primarily limited to parameters with Class III criteria pursuant to the FDEP’s Surface Water Quality Standards Rule (Chapter 62-302, F.A.C.). The parameters evaluated in this chapter include 62 pesticides and the following water quality constituents:
Alkalinity
Dissolved oxygen (in situ)
Specific conductance (in situ)
pH (in situ)
Total selenium*
Total thallium*
Total zinc*
Turbidity
Un-ionized ammonia
Sulfate
Total nitrogen (total Kjeldahl nitrogen + nitrate/nitrite)
Total cadmium*
Total iron
Total lead*
Total nickel*
Total silver*
Total antimony*
Total arsenic*
Total beryllium*
Total copper*
Total phosphorus
Orthophosphate
*Note: Indicates parameters not measured in WY2010; however, these have been analyzed and reported in previous SFERs and, if measured in the future, will be analyzed and reported in future SFERs.
WATER QUALITY CRITERIA EXCURSION ANALYSIS
The FDEP and the District have developed and clearly documented an excursion analysis protocol for use in the annual SFER (Weaver and Payne, 2005). The primary objective of the protocol is to provide a synoptic view of water quality criteria compliance on a regional scale (i.e., the Refuge, WCA-2, WCA-3, and the Park). This protocol was developed to balance consistency with previous versions of the report, other State of Florida ambient water quality evaluation methodologies [e.g., Impaired Waters 303(d) designations], and the U.S. Environmental Protection Agency (USEPA) exceedance frequency recommendations, as well as to provide a concise summary for decision makers and the public. This methodology is being used in order to ensure that the results will be compatible with information from other sources provided to water managers.
A multi-tiered categorical system was used in this chapter to rank the severity of excursions from state water quality criteria (Table 3A-1). Categories were assigned based on sample excursion frequencies evaluated using a statistically valid assessment methodology (i.e., binomial hypothesis test) that accounted for uncertainty in monitoring data. The basis for selecting the binomial approach is presented in Weaver and Payne (2004, 2005). Parameters without excursions were categorized as “no concern” and are not discussed further in this chapter.

Chapter 3A Volume I: The South Florida Environment
3A-16
Table 3A-1. Definitions of excursion categories for water quality constituents in the EPA. For conventional water quality constituents with at least
28 samples, frequencies were statistically tested using the binomial hypothesis test at the 90 percent confidence level.
Excursion Category Conventional Water Quality Constituents Pesticides
Concern > 10% Excursion1 Class III criterion and/or toxicity
levels exceeded
Potential Concern > 5% and ≤ 10% Excursions2 ≥ MDL3
Minimal Concern ≤ 5% Excursions Not Applicable
No Concern No Excursions < MDL
1 For sample sizes less than (<) 28, an excursion frequency of greater than (>) 20 percent was used to define the concern category. 2 For sample sizes < 28, an excursion frequency of less than or equal to (≤) 20 percent was used to define the potential concern category. 3 MDL = Method Detection Limit
For any parameter with excursions and at least 28 samples during the period of record (POR), the binomial hypothesis test at the 90 percent confidence level was applied to evaluate whether the given parameter was a concern; that is, whether it exhibited an excursion rate greater than 10 percent. If the binomial hypothesis test failed to reject the null hypothesis (H0: f ≤ 0.10; HA: f > 0.10), then the binomial test at the 90 percent confidence level was used to determine whether the parameter was a potential concern (excursion rate from 5 to 10 percent, i.e., HA: f > 0.05) or a minimal concern (an excursion rate of 5 percent or less, i.e., H0: f ≤ 0.05).
Because the binominal hypothesis test does not adequately balance statistical error rates at sample sizes of less than 28, parameters with reported excursions and fewer than 28 samples were initially categorized as a concern or potential concern based on excursion frequencies (raw scores) of greater than 20 percent and less than 20 percent, respectively. It is assumed that an observed excursion frequency of greater than 20 percent provides substantial reason to suspect that the true exceedance frequency may exceed 10 percent and warrants further investigation. Furthermore, given the high degree of uncertainty associated with small sample sizes (fewer than 28), any excursions warrant further review.
However, extreme caution must be exercised when interpreting results drawn from such small samplings. As a means to reduce uncertainty, any parameter initially identified as a concern or potential concern based on fewer than 28 samples was further evaluated based on longer term (five-year) excursion rates. Utilization of a longer period of record assumes that exceedance frequencies are constant among years; that is, there is no trend. Parameters with human health-based criteria were evaluated under the assumption that the Class III criteria values represent instantaneous maximum concentrations for which any exceedance constitutes a non-attainment of designated use.
Additionally, methods to detect and delineate localized exceedance patterns within each water body were utilized to supplement and refine the regional analyses (Weaver and Payne, 2005). The binomial hypothesis test and excursion criterion were applied to individual station data. Individual station assessments were based on the previous five water years (WY2006–WY2010), rather than on the single year used for regional analyses. The use of a five-year period provided sufficient data for most parameters. No determination was made for any

2011 South Florida Environmental Report Chapter 3A
3A-17
parameter with less than 28 samples. If one or more monitoring stations were categorized at a higher level of concern than the region as a whole, then a localized exceedance was recorded. Localized exceedances are noted in the summary tables of this chapter.
Because the USEPA recommended that a 10 percent excursion frequency does not apply to pesticides (USEPA, 1997, 2002), the pesticide evaluation method presented in this chapter is identical to the method used in previous Everglades Consolidated Reports (ECRs) and SFERs. Pesticides were categorized based on the exceedance of Class III criteria or chronic toxicity values and detection (measurement ≥ MDL) frequency.
PHOSPHORUS CRITERION ACHIEVEMENT ASSESSMENT
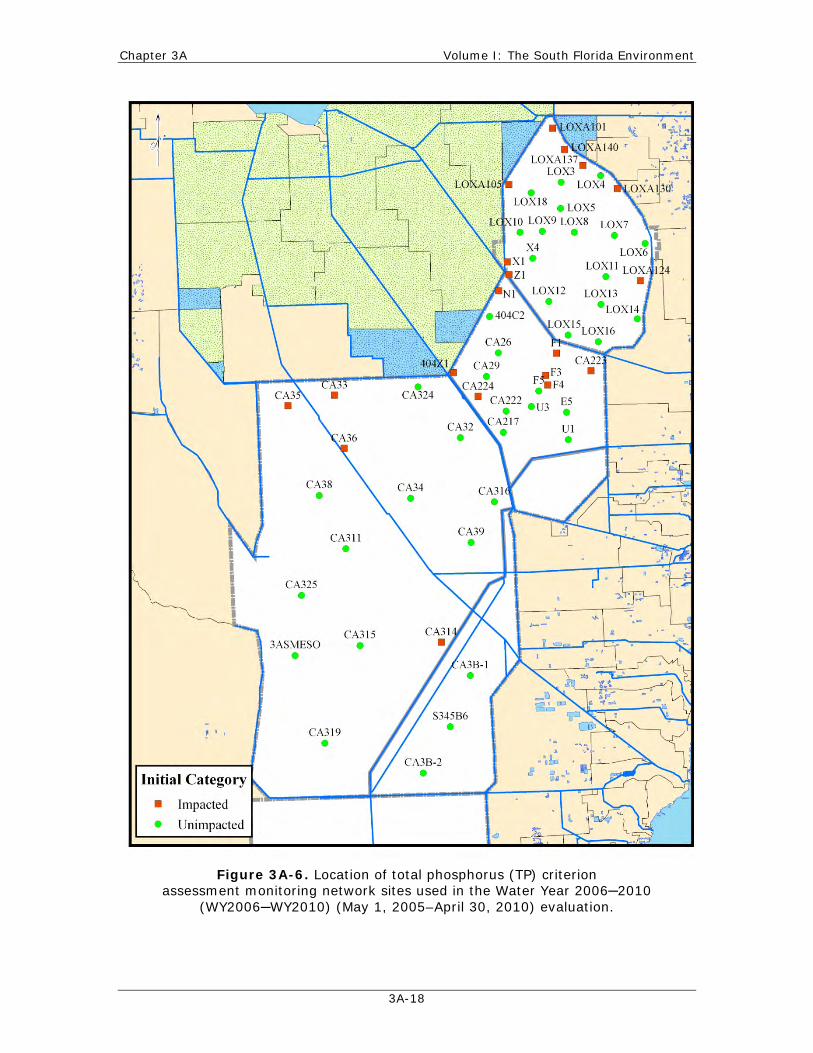
A preliminary evaluation to determine achievement of the TP criterion was performed in accordance with the protocol provided in the 2007 SFER – Volume I, Chapter 3C, and the four-part test specified in the FDEP’s Water Quality Standards for Phosphorus Within the Everglades Protection Area (Chapter 62-302.540, F.A.C.) (Table 3A-2). The available data from the 58 sites comprising the TP criterion monitoring network for the most recent five-year period (i.e., WY2006–WY2010) were utilized in the evaluation.
The TP criterion rule requires that a network be established for the purpose of evaluating compliance with the TP criterion. In establishing this network, existing sites being monitored for different purposes were selected wherever possible. However, to get the required spatial coverage, new sites were added. The location of the TP criterion network monitoring sites used in this assessment and their classification as “impacted” or “unimpacted” are provided in Figure 3A-6.
Table 3A-2. Summary of the four-part test as required by Section 62-302.540, Florida Administrative Code (F.A.C.).
Component
TP Criterion Achievement Value
microgram per liter (µg/L)
Noted in This Chapter As
Five-year geometric mean TP concentration averaged across the monitoring network
10 µg/L or less five-year network
limit
Annual geometric mean TP concentration averaged
across all stations
10 µg/L or less for three out of each five years
multi-year network limit
Annual geometric mean TP concentration averaged
across all stations 11 µg/L or less annual network limit
Annual geometric mean TP concentration at all individual
monitoring stations 15 µg/L or less annual site limit
Chapter 3A Volume I: The South Florida Environment
3A-18
Figure 3A-6. Location of total phosphorus (TP) criterion assessment monitoring network sites used in the Water Year 2006─2010
(WY2006─WY2010) (May 1, 2005–April 30, 2010) evaluation.

2011 South Florida Environmental Report Chapter 3A
3A-19
Data collection from the complete TP criterion monitoring network, which includes the new sites, was initiated in January 2007. It should be noted that due to the relatively recent inception of the network monitoring, not all sites have data available for the full five-year assessment period. In addition, due to extremely dry conditions that have prevailed during a number of years since WY2007, data availability is further limited for certain portions of the EPA. Because the results of the TP criterion compliance assessment presented in this chapter could be affected by these data limitations, this evaluation should be considered preliminary and the results cautiously interpreted. It is expected that future assessments will improve as additional datasets for all sites within the monitoring network are added. Data were screened according to the QA/QC procedures described in the protocol on the FDEP’s website (as of August 2009) at www.dep.state.fl.us/water/wqssp/everglades/docs/DataQualityScreeningProtocol.pdf.
WATER YEAR 2010 WATER QUALITY RESULTS
WATER QUALITY CRITERIA EXCURSION ANALYSIS
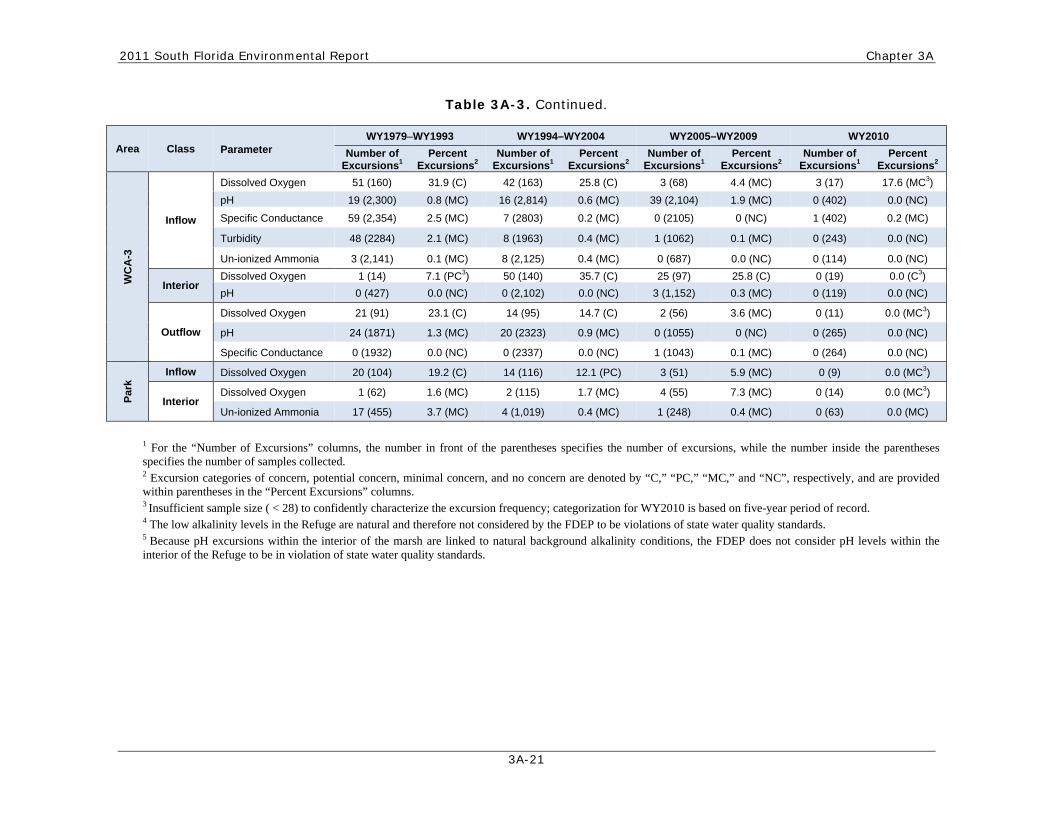
WY2010 data for water quality parameters with Class III numeric criteria are summarized by region and monitoring station in Appendices 3A-1 and 3A-2 of this volume, respectively. Comparisons of WY2010 water quality data with applicable Class III water quality criteria resulted in excursions for five water quality parameters: dissolved oxygen (DO), alkalinity, pH, specific conductance, and un-ionized ammonia (Table 3A-3). Similar to previous periods, these excursions were generally localized to specific areas of the EPA. In WY2009, all of these parameters exhibited excursions. In WY2009, two exceedances of the turbidity criterion were reported; however, in WY2010 no exceedances were observed.
Water quality parameters with exceedances of applicable criteria are discussed in greater detail below with the excursion frequencies summarized for the baseline through current water year periods (WY1979–WY1993, WY1994–WY2004, WY2005–WY2009, and WY2010) to evaluate the presence of any temporal trends (Table 3A-3). Due to the link between SO4
2-levels and mercury methylation, the temporal and spatial trends in SO4
2- concentrations within the EPA are also summarized and discussed using a similar approach although no water quality criteria currently exist for SO4
2- or methylmercury. The SO42- concentrations for WY2010 in the interior
stations of the Refuge and the Park were lower than the SO42-values reported for WY2009.
Additionally, during WY2010, 10 pesticides, or pesticide breakdown products, including dichlorophenoxy acetic acid, 2,4 (2,4-D), ametryn, atrazine, atrazine desethyl, hexazinone, imidacloprid, metolachlor, metribuzin, norflurazon, and simazine, were detected at levels above the MDL within the EPA. Of the 10 pesticides detected at levels above the MDL, seven were detected in WY2009. Only 2,4-D, atrazine desethyl, and imidacloprid were not detected in the previous report. Similar to WY2009, only atrazine exceeded the toxicity guideline concentrations (Table 3A-5). No other parameters exceeded state water quality criteria during WY2010.

Chapter 3A Volume I: The South Florida Environment
3A-20
Table 3A-3. Summary of excursions from Class III criteria in the EPA for the pre-Best Management Practice (BMP) baseline period (WY1979–WY1993), Phase I (WY1994–WY2004), Phase II (WY2005–WY2009), and WY2010.
Area Class Parameter WY1979–WY1993 WY1994–WY2004 WY2005–WY2009 WY2010
Number of Excursions1
Percent Excursions2
Number of Excursions1
Percent Excursions2
Number of Excursions1
Percent Excursions2
Number of Excursions1
Percent Excursions2
Ref
ug
e
Inflow
Dissolved Oxygen 13 (61) 21.3 (C) 8 (68) 11.8 (PC) 5 (25) 20 (C) 0 (3) 0.0 (PC3)
pH 9 (890) 1.0 (MC) 4 (1,782) 0.2 (MC) 3 (874) 0.3 (MC) 1 (153) 0.7 (MC)
Specific Conductance
355 (896) 39.6 (C) 258 (1,786) 14.4 (C) 83 (870) 9.5 (NC) 6 (156) 3.8 (MC)
Turbidity 28 (1,109) 2.5 (MC) 34 (1,034) 3.3 (MC) 1 (296) 0.3 (MC) 0 (0) 0.0 (NC)
Un-ionized Ammonia
36 (867) 4.2 (MC) 2 (1255) 0.2 (MC) 1 (356) 0.3 (MC) 2 (68) 2.9 (MC)
Rim Specific Conductance
36 (118) 30.5 (C) 71 (634) 11.2 (PC) 3 (188) 1.6 (MC) 1 (31) 3.2 (MC)
pH 0 (118) 0.0 (NC) 3 (629) 0.5 (MC) 1 (189) 0.5 (MC) 0 (31) 0.0 (NC)
Interior
Alkalinity 91 (367) 24.8 (C4) 477 (1,971) 24.2 (C4) 257 (1,171) 21.9 (MC) 55 (161) 34.2 (MC4)
Dissolved Oxygen 0 (12) 0.0 (NC3) 66 (210) 31.4 (C) 44 (156) 28.2 (C) 6 (32) 18.8 (C3)
pH 59 (238) 24.8 (C5) 164 (2,204) 7.4 (PC5) 47 (1,463) 3.2 (MC5) 19 (271) 7 (MC5)
Un-ionized Ammonia
0 (177) 0.0 (NC) 3 (1,698) 0.2 (MC) 0 (817) 0 (NC) 0 (146) 0.0 (NC)
Outflow Turbidity 7 (572) 1.2 (MC) 4 (708) 0.6 (MC) 3 (277) 1.1 (MC) 0 (35) 0.0 (NC)
WC
A-2
Inflow
Dissolved Oxygen 21 (51) 41.2 (C) 22 (84) 26.2 (C) 2(37) 5.4 (MC) 0 (7) 0.0 (MC3)
Specific Conductance
161 (640) 25.2 (C) 152 (1233) 12.3 (C) 82 (776) 10.6 (MC) 11 (159) 6.9 (MC)
Turbidity 9 (732) 1.2 (MC) 6 (721) 0.8 (MC) 3 (331) 0.9 (MC) 0 (45) 0.0 (NC)
Un-ionized Ammonia
6 (616) 1.0 (MC) 62 (1012) 6.1 (PC) 27 (368) 7.3 (PC) 0 (97) 0.0 (NC)
pH 2 (621) 0.3 (MC) 6 (1230) 0.5 (MC) 4 (773) 0.5 (MC) 2 (159) 1.3 (MC)
Interior
Dissolved Oxygen 16 (52) 30.87 (C) 97 (211) 46.0 (C) 41 (99) 41.4 (C) 9 (20) 45 (C3)
pH 17 (869) 2.0 (MC) 4 (3,294) 0.1 (MC) 3 (1,218) 0.2 (MC) 0 (168) 0.0 (NC)
Specific Conductance
86 (762) 11.3 (PC) 335 (3,344) 10.0 (PC) 128 (1,235) 10.4 (MC) 8 (165) 4.8 (MC)
Un-ionized Ammonia
6 (777) 0.8 (MC) 6 (2,691) 0.2 (MC) 2 (787) 0.3 (MC) 0 (141) 0.0 (NC)
2011 South Florida Environmental Report Chapter 3A
3A-21
Table 3A-3. Continued.
Area Class Parameter WY1979–WY1993 WY1994–WY2004 WY2005–WY2009 WY2010
Number of Excursions1
Percent Excursions2
Number of Excursions1
Percent Excursions2
Number of Excursions1
Percent Excursions2
Number of Excursions1
Percent Excursions2
WC
A-3
Inflow
Dissolved Oxygen 51 (160) 31.9 (C) 42 (163) 25.8 (C) 3 (68) 4.4 (MC) 3 (17) 17.6 (MC3)
pH 19 (2,300) 0.8 (MC) 16 (2,814) 0.6 (MC) 39 (2,104) 1.9 (MC) 0 (402) 0.0 (NC)
Specific Conductance 59 (2,354) 2.5 (MC) 7 (2803) 0.2 (MC) 0 (2105) 0 (NC) 1 (402) 0.2 (MC)
Turbidity 48 (2284) 2.1 (MC) 8 (1963) 0.4 (MC) 1 (1062) 0.1 (MC) 0 (243) 0.0 (NC)
Un-ionized Ammonia 3 (2,141) 0.1 (MC) 8 (2,125) 0.4 (MC) 0 (687) 0.0 (NC) 0 (114) 0.0 (NC)
Interior Dissolved Oxygen 1 (14) 7.1 (PC3) 50 (140) 35.7 (C) 25 (97) 25.8 (C) 0 (19) 0.0 (C3)
pH 0 (427) 0.0 (NC) 0 (2,102) 0.0 (NC) 3 (1,152) 0.3 (MC) 0 (119) 0.0 (NC)
Outflow
Dissolved Oxygen 21 (91) 23.1 (C) 14 (95) 14.7 (C) 2 (56) 3.6 (MC) 0 (11) 0.0 (MC3)
pH 24 (1871) 1.3 (MC) 20 (2323) 0.9 (MC) 0 (1055) 0 (NC) 0 (265) 0.0 (NC)
Specific Conductance 0 (1932) 0.0 (NC) 0 (2337) 0.0 (NC) 1 (1043) 0.1 (MC) 0 (264) 0.0 (NC)
Par
k
Inflow Dissolved Oxygen 20 (104) 19.2 (C) 14 (116) 12.1 (PC) 3 (51) 5.9 (MC) 0 (9) 0.0 (MC3)
Interior Dissolved Oxygen 1 (62) 1.6 (MC) 2 (115) 1.7 (MC) 4 (55) 7.3 (MC) 0 (14) 0.0 (MC3)
Un-ionized Ammonia 17 (455) 3.7 (MC) 4 (1,019) 0.4 (MC) 1 (248) 0.4 (MC) 0 (63) 0.0 (MC)
1 For the “Number of Excursions” columns, the number in front of the parentheses specifies the number of excursions, while the number inside the parentheses specifies the number of samples collected. 2 Excursion categories of concern, potential concern, minimal concern, and no concern are denoted by “C,” “PC,” “MC,” and “NC”, respectively, and are provided within parentheses in the “Percent Excursions” columns. 3 Insufficient sample size ( < 28) to confidently characterize the excursion frequency; categorization for WY2010 is based on five-year period of record. 4 The low alkalinity levels in the Refuge are natural and therefore not considered by the FDEP to be violations of state water quality standards. 5 Because pH excursions within the interior of the marsh are linked to natural background alkalinity conditions, the FDEP does not consider pH levels within the interior of the Refuge to be in violation of state water quality standards.
Chapter 3A Volume I: The South Florida Environment
3A-22
Dissolved Oxygen
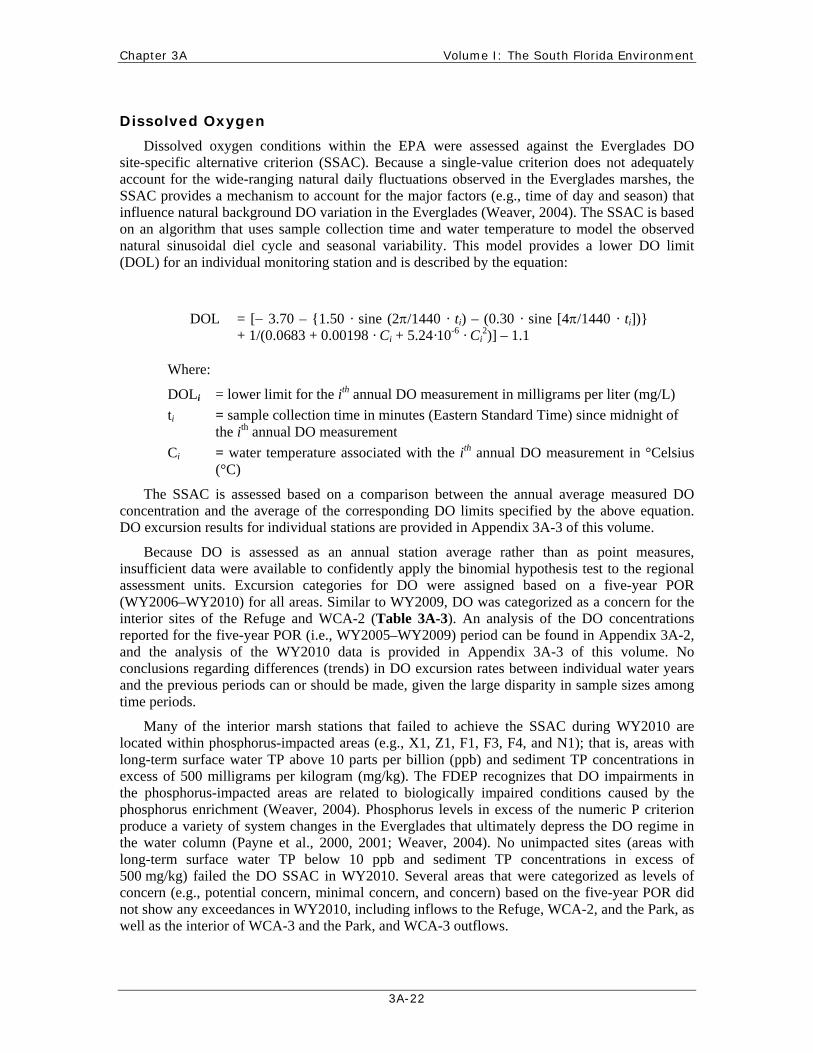
Dissolved oxygen conditions within the EPA were assessed against the Everglades DO site-specific alternative criterion (SSAC). Because a single-value criterion does not adequately account for the wide-ranging natural daily fluctuations observed in the Everglades marshes, the SSAC provides a mechanism to account for the major factors (e.g., time of day and season) that influence natural background DO variation in the Everglades (Weaver, 2004). The SSAC is based on an algorithm that uses sample collection time and water temperature to model the observed natural sinusoidal diel cycle and seasonal variability. This model provides a lower DO limit (DOL) for an individual monitoring station and is described by the equation:
DOL = [ 3.70 – {1.50 · sine (2/1440 · ti) – (0.30 · sine [4/1440 · ti])} + 1/(0.0683 + 0.00198 · Ci + 5.24·10-6 · Ci
2)] – 1.1
Where:
DOLi = lower limit for the ith annual DO measurement in milligrams per liter (mg/L)
ti = sample collection time in minutes (Eastern Standard Time) since midnight of the ith annual DO measurement
Ci = water temperature associated with the ith annual DO measurement in °Celsius (°C)
The SSAC is assessed based on a comparison between the annual average measured DO concentration and the average of the corresponding DO limits specified by the above equation. DO excursion results for individual stations are provided in Appendix 3A-3 of this volume.
Because DO is assessed as an annual station average rather than as point measures, insufficient data were available to confidently apply the binomial hypothesis test to the regional assessment units. Excursion categories for DO were assigned based on a five-year POR (WY2006–WY2010) for all areas. Similar to WY2009, DO was categorized as a concern for the interior sites of the Refuge and WCA-2 (Table 3A-3). An analysis of the DO concentrations reported for the five-year POR (i.e., WY2005–WY2009) period can be found in Appendix 3A-2, and the analysis of the WY2010 data is provided in Appendix 3A-3 of this volume. No conclusions regarding differences (trends) in DO excursion rates between individual water years and the previous periods can or should be made, given the large disparity in sample sizes among time periods.
Many of the interior marsh stations that failed to achieve the SSAC during WY2010 are located within phosphorus-impacted areas (e.g., X1, Z1, F1, F3, F4, and N1); that is, areas with long-term surface water TP above 10 parts per billion (ppb) and sediment TP concentrations in excess of 500 milligrams per kilogram (mg/kg). The FDEP recognizes that DO impairments in the phosphorus-impacted areas are related to biologically impaired conditions caused by the phosphorus enrichment (Weaver, 2004). Phosphorus levels in excess of the numeric P criterion produce a variety of system changes in the Everglades that ultimately depress the DO regime in the water column (Payne et al., 2000, 2001; Weaver, 2004). No unimpacted sites (areas with long-term surface water TP below 10 ppb and sediment TP concentrations in excess of 500 mg/kg) failed the DO SSAC in WY2010. Several areas that were categorized as levels of concern (e.g., potential concern, minimal concern, and concern) based on the five-year POR did not show any exceedances in WY2010, including inflows to the Refuge, WCA-2, and the Park, as well as the interior of WCA-3 and the Park, and WCA-3 outflows.
2011 South Florida Environmental Report Chapter 3A
3A-23
To achieve the level of nutrients necessary to meet the TP standard, the District is implementing a comprehensive restoration program. Dissolved oxygen levels at the nutrient impacted sites are expected to remain below the SSAC levels until phosphorus concentrations in surface water and sediment are reduced and the biological communities recover.
Alkalinity and pH
Alkalinity is the measure of water’s acid neutralization capacity and provides a measure of the water’s buffering capacity. In most surface water bodies, the buffering capacity is primarily the result of the equilibrium between carbon dioxide and biocarbonate and carbonate ions (CO2, HCO3
-, and CO32-). The dissociation of calcium carbonate, magnesium carbonate, or other
carbonate-containing compounds entering the surface water through weathering of carbonate-containing rocks and minerals (e.g., limestone and calcite) contributes to water’s buffering capacity. Therefore, in certain areas (such as the Park, WCA-2, and WCA-3) that are influenced by canal inflows primarily composed of mineral-rich agricultural runoff and groundwater, alkalinity levels are relatively high (Weaver et al., 2007). Conversely, other areas such as the interior of the Refuge, which receive hydrologic load primarily through rainfall, have very low alkalinities. Alkalinity protects aquatic life against dramatic pH changes, which can be lethal to sensitive organisms. The current Class III water quality criterion specifies that alkalinity shall not be lowered below 20 milligrams of calcium carbonate per liter (mg CaCO3/L).
Excursions from this water quality criterion have historically occurred in the interior of the Refuge (Bechtel et al., 1999, 2000; Weaver et al., 2001, 2002, 2003; Weaver and Payne, 2004, 2005, 2006; Weaver et al., 2007; Payne et al., 2010). Similar to previous years, alkalinity was designated as a minimal concern for the interior of the Refuge for WY2010 due to an excursion rate of 34.2 percent (Table 3A-3). However, as discussed in previous SFERs (e.g., Weaver and Payne, 2004; Weaver et al., 2007), the interior of the Refuge is hydrologically dominated by rainfall, which is naturally low in alkalinity. As such, the FDEP considers the low alkalinity values to be representative of the natural range of variability within the Refuge; therefore, these should not be considered violations of state water quality standards. Excursion rates for alkalinity in the interior of the Refuge during WY2010 were very similar to previous periods in which excursion rates of 24.8 percent, 24.2 percent, and 21.9 percent were reported for the baseline, Phase I (WY1994–WY2004), and Phase II (WY2005–WY2009) periods, respectively. In WY2010, excursions occurred at numerous stations including the following sites, with the number of exceedances for each site provided in parentheses: LOX3 (1), LOX5 (1), LOX6 (1), LOX7 (10), LOX8 (11), LOX9 (7), LOX11 (8), LOX13 (7), LOX14 (1), LOX15, LOX16 (4), and WCA1MESO (4).
The pH value is defined as the negative log(base10) of the hydrogen (H+) ion activity. Most living organisms, especially aquatic life, function best in a pH range of 6.0 to 9.0, although individual species have specific ideal ranges. In WY2010, pH was considered a minimal concern for the Refuge interior and inflow sites as well as for WCA-2 inflow. During WY2010, pH was classified as a minimal concern due to occasional pH levels slightly below the 6.0 minimum criteria, which occurred at 11 of the 26 monitoring sites. The excursions were recorded for the following sites, with the number of excursions for each site provided in parentheses: LOX11 (1), LOX13 (1), LOX16 (1), WCA1MESO (2), X2 (2), X3 (2), X4 (2), Y4 (3), Z2 (1), Z3 (2), and Z4 (2). Since the pH excursions within the interior of the Refuge generally occur at sites well away from the influence of inflows and have been linked to natural low background alkalinity conditions, as described in previous consolidated reports, the FDEP does not consider the observed pH excursions within the interior of the Refuge to be in violation of state water quality standards.
Chapter 3A Volume I: The South Florida Environment
3A-24
In addition, WCA-2 inflow stations E0 and F0, and Refuge inflow station ENR012 exhibited excursions in WY2010. The pH excursions at the inflows to the Refuge and WCA-2 were slightly above the 8.0 unit maximum limit and were likely associated with increased photosynthetic activity during low flow periods.
Specific Conductance
Specific conductance (conductivity) is a measure of water’s ability to conduct an electrical current and is an indirect measure of the total concentration of ionized substances (e.g., Ca2+, Mg2+, Na+, Cl-, HCO3
-, and SO42-) in the water. Conductivity will vary with the number and type
of these ions in solution. The current state water quality criteria for Class III fresh waters, which allows for a 50 percent increase in the specific conductance or 1,275 micromhos per centimeter (µmhos/cm), whichever is greater, is meant to preserve natural background conditions and to protect aquatic organisms from stressful ion concentrations. Given that background conductivities are low within the EPA, excursions were calculated using the 1,275 µmhos/cm criterion (Weaver et al., 2001, 2002).
For WY2010, specific conductance was categorized as a minimal concern for the Refuge inflow and Rim Canal sites, WCA-2 inflow and interior sites, and WCA-3 inflow sites (Table 3A-3). In WY2010, exceedances in the Refuge occurred at the S-362 inflow structure, which had six exceedances, and at Rim Canal station LOXA135, which had a single exceedance. In WCA-2, the G-335 and S-7 inflow sites showed exceedances as well as the F1 and F2 interior sites. Site-specifically, specific conductance was categorized as a concern at the G-335 inflow site to WCA-2 due to higher excursion rates based on an evaluation of the past five water years (i.e., WY2006–WY2010). Previous ECRs and SFERs have explained that the elevated conductivity levels at water control structures (e.g., G-335) and stations near canal inflows were probably linked to groundwater intrusion into canal surface waters (Krest and Harvey, 2003, Weaver et al., 2001, 2002). This groundwater intrusion can occur due to seepage into canals, via pumping station operation (which can pull additional groundwater into surface water), and as a result of agricultural dewatering practices.
Specific conductance excursion frequency in WCA-2 inflows declined significantly from 25.2 and 12.3 percent for the baseline (WY1979–WY1993) and Phase I (WY1994–WY2004) periods, respectively. Furthermore, excursion frequencies decreased from 10.6 percent in Phase II (WY2005–WY2009) to 6.9 percent in WY2010. Likewise, excursion frequencies in the Refuge inflows declined from 39.6 and 14.4 percent during the baseline and Phase I periods, respectively, to 9.5 percent in Phase II (WY2005–WY2009). Excursion frequencies declined further in WY2010 to 3.8 percent.
Overall, a steady long-term decrease in specific conductance within the Refuge and WCA-2 inflows has occurred since WY1979 (Figure 3A-7). In fact, median annual specific conductance levels in the Refuge inflows have decreased by 200 to 300 µmhos/cm over the POR. Similarly, specific conductance has decreased by approximately 100 µmhos/cm in WCA-2 inflows over the same period.

2011 South Florida Environmental Report Chapter 3A
3A-25
Figure 3A-7. Annual median specific conductance levels in the EPA (A) inflows, (B) interior, and (C) outflows for the period from WY1978–WY2010.
Me
dia
n A
nn
ua
l S
pe
cif
ic C
on
du
cta
nc
e (
µm
ho
/cm
)
Water Year

Chapter 3A Volume I: The South Florida Environment
3A-26
Un-ionized Ammonia
Un-ionized ammonia (NH3) is a colorless gas with a pungent odor that is very soluble in water at low pH. Ammonia can serve as an important source of nitrogen for plant life but is toxic to aquatic plant life when present in excess. In the aquatic environment, ammonia is very soluble and readily hydrolyzed to form ammonium (NH4
+) ions as shown in the following reaction:
NH3 + H2O = NH4+ + OH-
The NH4+ ions produced as a result of the hydrolysis are not toxic to aquatic life. However,
even though ammonia is highly soluble in water, the hydrolysis is not complete and some portion of the total ammonia remains in the toxic un-ionized (NH3) form. The equilibrium established between the un-ionized (NH3) form and ionized (NH4
+) form of ammonia is a function of temperature and pH. As shown in the above equation, increases in pH (increased levels of OH-
ions) as well as temperature forces the reaction to the left, resulting in increased levels of NH3. For example, in fresh water at 25°C, an increase in pH from 7.0 to 8.0 raises the level of NH3 from 0.5 to 5.4 percent. At a pH of 9.0, more than one-third (36 percent) of the total dissolved ammonia (i.e., the concentration of ammonia measured in the water column, NH3 + NH4
+) is in the un-ionized form. The resulting NH3 is able to diffuse across cell membranes more readily and is acutely toxic to aquatic life at relatively low concentrations.
Ammonia is unique among regulated water quality constituents because it is both a source of nitrogen (a nutrient required for life) and an endogenously produced toxicant for which organisms have developed a variety of strategies to excrete as a waste product. The concentration of NH3 necessary to become toxic is highly variable, because the toxic effect is affected by temperature, pH, DO, or carbon dioxide (CO2) concentrations; previous acclimation; and the presence of other toxic compounds. High external NH3 concentrations reduce or reverse diffusion gradients used by organisms to excrete excess NH3. This excess NH3 can accumulate in the organism, thereby resulting in altered metabolism, loss of equilibrium, hyperexcitability, increased respiratory activity and oxygen uptake, and increased heart rate. Even slightly elevated concentrations of NH3 have been associated with reductions in hatching success and growth rate in some animals, morphological development in others, and injuries to gill tissue, liver, and kidneys. In fish, extremely high levels of NH3 can result in convulsions, coma, and death.
The current state Class III water quality criterion for NH3 is ≤ 0.02 mg/L. NH3 is calculated from pH, temperature, and total dissolved NH3 measurements from the same sample. In WY2010, un-ionized NH3 was classified as a minimal concern for Refuge inflows. Two exceedances occurred in the Refuge at the S-362 inflow site. The first exceedance was collected on November 24, 2009, and the second exceedance occurred on February 4, 2010. Both exceedances occurred as a result of a combination of relatively high total ammonia concentrations and high pH levels.
Sulfate
The State of Florida has no surface water criterion for sulfate (SO42-); however, research has
provided evidence of a link between sulfur biogeochemistry in sediment and porewater and mercury methylation (Atkeson and Parks, 2002; Atkeson and Axelrad, 2003; Axelrad et al., 2005; Axelrad et al., 2006). SO4
2- in the surface waters of the Everglades is derived from a variety of natural and human sources. The SO4
2- monitoring results for the EPA are presented in this chapter to provide an overview of current concentrations and to evaluate temporal and spatial patterns. Table 3A-4 summarizes SO4
2- concentrations for WY2010 and the baseline, Phase I, and Phase II periods based on median, quartile, minimum, and maximum values. Individual station summaries are included in Appendix 3A-2 of this volume. Chapter 3B and Appendix 3B-1 of this volume summarize the current state of scientific understanding and uncertainties of the effects of SO4
2- on the ecology and biogeochemical processes of the Everglades.

2011 South Florida Environmental Report Chapter 3A
3A-27
Table 3A-4. Summary of sulfate (SO42-) concentrations [milligrams
per liter (mg/L)] in the EPA for the baseline (WY1979–WY1993), Phase I (WY1994–WY2004), Phase II (WY2005–WY2009), and WY2010 periods.
Region Class
Period
(Water Year) N Min. 25th
Percentile Median 75th
Percentile Max.
Ref
ug
e
Inflow
1979-1993 307 8.3 39 61 90 436
1994-2004 589 <0.10 33 48 66 461
2005-2009 390 2.4 31.2 46.4 62.1 172
2010 82 16.4 34.7 47.4 62.6 136
Rim
1979-1993 84 2.5 12 36 72 140
1994-2004 524 1.6 38 50 69 140
2005-2009 160 3.2 29.5 44.2 64 110
2010 10 14.7 18.4 63.1 70.4 77.4
Interior
1979-1993 325 2.5 5.5 9.8 16 663
1994-2004 2,040 <0.10 0.6 2.4 19 2,900
2005-2009 1,342 0.1 0.2 1.0 3.6 84.3
2010 192 0.1 0.1 0.2 0.9 50.2
Outflow
1979-1993 158 7.3 23 39 71 571
1994-2004 232 1.4 28 41 58 419
2005-2009 106 2.3 10.2 24.5 47 85.9
2010 62 4.0 15.6 27.2 45.4 76.2
WC
A-2
Inflow
1979-1993 194 7.3 35 51 72 644
1994-2004 603 6.2 32 46 61 419
2005-2009 327 2.5 27 38 55.1 106
2010 107 5.1 30.2 46.4 55.5 76.3
Interior
1979-1993 742 2.5 23 37 51 344
1994-2004 2,884 0.1 27 42 58 1400
2005-2009 1,012 1.8 17.9 32 48 295
2010 148 7.5 20.8 37.5 53.6 149
Outflow
1979-1993 209 2.5 23 36 49 224
1994-2004 190 2.3 19 28 37 73
2005-2009 117 4.5 23.8 36.3 45.3 86.1
2010 46 4.2 13.8 34.9 46.7 60.6
WC
A-3
Inflow
1979-1993 580 1 11 22 45.0 286
1994-2004 568 0.5 7.6 14 28.0 73
2005-2009 347 0.1 6.2 14.2 36.3 86.1
2010 90 0.6 14.8 37.3 46.9 67.2
Interior
1979-1993 459 2 6.3 11 17.0 262
1994-2004 1,890 <0.10 1.3 3.4 10.0 120
2005-2009 993 0.1 0.8 2.9 17.7 303
2010 96 0.1 0.9 4.6 30.5 73.5

Chapter 3A Volume I: The South Florida Environment
3A-28
Table 3A-4. Continued.
Region Class
Period
(Water Year) N Min. 25th
Percentile Median 75th
Percentile Max. W
CA
-3
Outflow
1979-1993 278 1 6.7 13 21 113
1994-2004 300 <0.10 0.27 1.7 8.5 36
2005-2009 192 0.1 0.1 1.0 10.1 69.3
2010 32 0.1 0.1 1.9 10.8 39.3
Par
k
Inflow
1979-1993 265 1.0 6.6 12 21 113
1994-2004 284 <0.10 0.49 2.2 8.1 36
2005-2009 159 0.1 0.1 1.2 8 35.8
2010 24 0.1 0.1 1.9 10.6 34.2
Interior
1979-1993 568 0.75 2.5 4.3 7.3 206
1994-2004 980 <0.10 1.0 2.2 4.9 403
2005-2009 334 0.1 0.5 1.8 4.8 242
2010 73 0.1 0.8 1.6 5.4 239
Given that one of the primary sources of SO42- entering the EPA is runoff from the north,
particularly the EAA, SO42- concentrations in the inflow and interior marsh generally follow
trends similar to those observed for TP and TN (total nitrogen); i.e., SO42- concentrations exhibit
a general north-to-south gradient extending from the sources in the north to relatively unenriched areas in the south (Figure 3A-8). Stormwater runoff from the EAA contains high concentrations of SO4
2- that arise from both the current and historical use of sulfur-containing fertilizers and soil amendments (Bates et al., 2002) and the oxidation of the organic sediments in the EPA.
During WY2010, the highest median SO42- concentrations within the EPA were observed at
the inflow (47.4 mg/L) and Rim Canal (63.1 mg/L) stations of the Refuge and the inflow (46.4 mg/L) stations to WCA-2. Although WY2010 concentrations in the Rim Canal stations of the Refuge were higher than the three other reporting periods, this increase may be the result of a sampling artifact (e.g., smaller sample size for WY2010 than for other reporting periods). Despite elevated concentrations in the inflows, the Refuge interior has remained relatively uninfluenced by the SO4
2--rich water because much of the surface water entering the area remains in the Rim Canal around the periphery and is discharged to WCA-2 through STA-2 and the S-10 structures. In early WY2010, Cells 1 and 5 of Stormwater Treatment Area 1 East (STA-1E) experienced dryout conditions. During dryout and subsequent rewetting, SO4
2- can be remobilized into the water column (Orem, 2007), so the Refuge may have received higher concentrations of SO4
2- in inflows from STA-1E following these events.
Among EPA marsh areas, the interior of WCA-2 is the area most affected by EAA runoff and consequently exhibits high SO4
2- concentrations. In WY2010, Stormwater Treatment Area 2 (STA-2), which provides inflows into WCA-2, experienced a brief dryout period in May 2009. Again, this dryout period and subsequent rewetting may have contributed to the higher concentrations of SO4
2- observed in the interior sites of WCA-2. During WY2010, the interior sites of WCA-2 exhibited a median SO4
2- concentration of 37.5 mg/L compared to lowest median concentration of 1.6 mg/L observed in the Park’s interior. During WY2010, the SO4
2- concentrations in the interior stations of the Refuge and the Park were the lowest among the baseline (WY1979–WY1993), Phase I (WY1994–WY2004), and Phase II (WY2005– WY2009) periods.

2011 South Florida Environmental Report Chapter 3A
3A-29
Figure 3A-8. Summary of geometric mean sulfate (SO42-) concentrations
(mg/L) for WY2010 at stations across the EPA. Geometric mean SO42- concentrations
are classified utilizing four levels: ≤ 2 mg/L, > 2–10 mg/L, > 20–50 mg/L, and > 50 mg/L.

Chapter 3A Volume I: The South Florida Environment
3A-30
Pesticides
The District has maintained a pesticide monitoring program in South Florida since 1984. The pesticide monitoring network includes sites designated in the Park Memorandum of Agreement (MOA), the Miccosukee Tribe MOA, the Lake Okeechobee Operating Permit, and the non-Everglades Construction Project (non-ECP) permit. Pesticide monitoring conducted as part of the Lake Okeechobee Operating Permit and the non-ECP permit is provided in Volume III. The current monitoring program in the EPA, consisting of 29 sites, is conducted on a quarterly basis (Figure 3A-9). These sites were grouped by basin for analysis.
Surface water concentrations of pesticides are regulated under criteria established in Chapter 62-302, F.A.C. Chemical-specific numeric criteria for a number of pesticides and herbicides (e.g., DDT, endosulfan, and malathion) are listed in Section 62-302.530, F.A.C. Compounds not specifically listed, including many contemporary pesticides (e.g., ametryn, atrazine, and diazinon), are evaluated based on acute and chronic toxicity. A set of toxicity-based guidelines for non-listed pesticides was presented in the 2001 ECR (Weaver et al., 2001). These guideline concentrations were developed based on the requirement in Subsection 62-302.530(62), F.A.C., which calls for Florida’s surface waters to be free from “substances in concentrations, which injure, are chronically toxic to, or produce adverse physiological or behavioral response in humans, plants, or animals.”
This chapter analyzes data collected during pesticide monitoring events conducted during WY2010 from August 2009 through March 2010. The POR was selected as an update to the 2010 SFER – Volume I, Chapter 3A. Monitoring results were evaluated relative to Class III water quality criteria, chronic toxicity guidelines, and detected concentrations. Pesticides exceeding either the Class III criteria or chronic toxicity guideline concentrations were classified as a concern for the basin in which the exceedance occurred.

2011 South Florida Environmental Report Chapter 3A
3A-31
Figure 3A-9. South Florida Water Management District (SFWMD or District) pesticide monitoring sites in the EPA.
Chapter 3A Volume I: The South Florida Environment
3A-32
Parameters classified as “concerns” have a high likelihood of resulting in an impairment of the designated use of the water body. Detected water quality constituents ( ≥ MDL) that did not exceed either a guideline or criterion were categorized as “potential concerns.” This classification signifies that the water quality constituent is known to be present within the basin at concentrations reasonably known to be below levels that can result in adverse biologic effects but may result in a problem at some future date or in interaction with other compounds. The “no concern” category was used to designate pesticides that were not detected at sites within a given area.
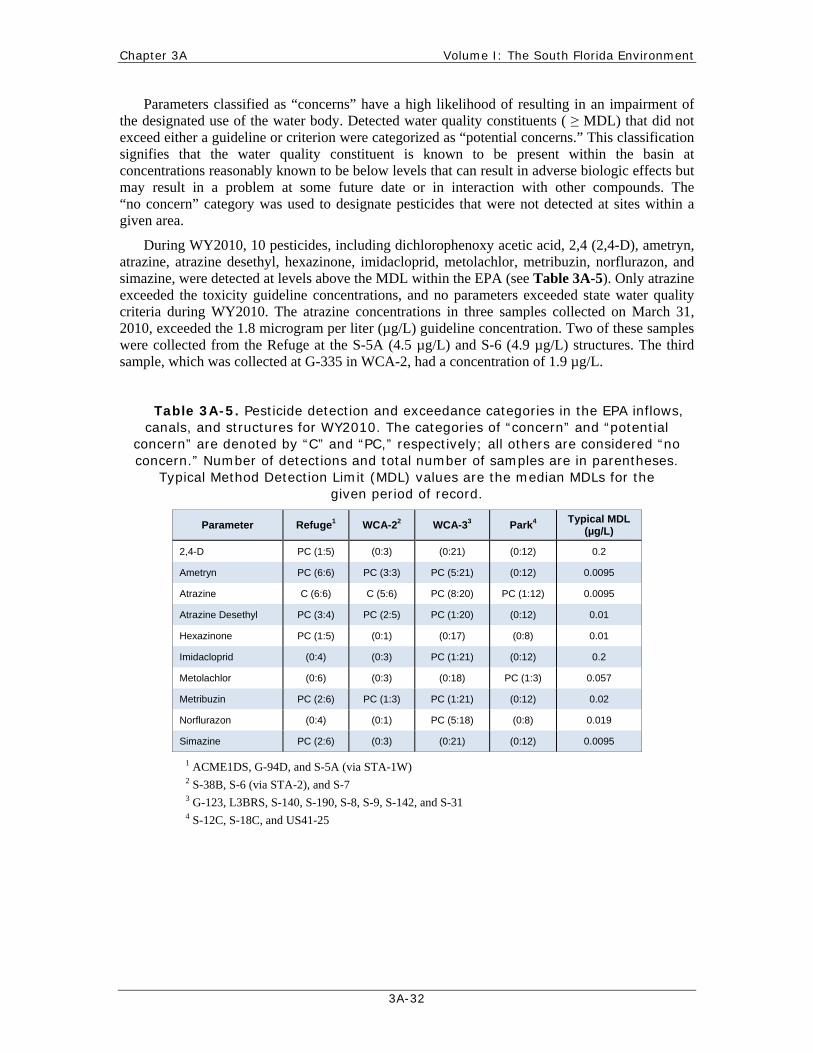
During WY2010, 10 pesticides, including dichlorophenoxy acetic acid, 2,4 (2,4-D), ametryn, atrazine, atrazine desethyl, hexazinone, imidacloprid, metolachlor, metribuzin, norflurazon, and simazine, were detected at levels above the MDL within the EPA (see Table 3A-5). Only atrazine exceeded the toxicity guideline concentrations, and no parameters exceeded state water quality criteria during WY2010. The atrazine concentrations in three samples collected on March 31, 2010, exceeded the 1.8 microgram per liter (µg/L) guideline concentration. Two of these samples were collected from the Refuge at the S-5A (4.5 µg/L) and S-6 (4.9 µg/L) structures. The third sample, which was collected at G-335 in WCA-2, had a concentration of 1.9 µg/L.
Table 3A-5. Pesticide detection and exceedance categories in the EPA inflows, canals, and structures for WY2010. The categories of “concern” and “potential
concern” are denoted by “C” and “PC,” respectively; all others are considered “no concern.” Number of detections and total number of samples are in parentheses.
Typical Method Detection Limit (MDL) values are the median MDLs for the given period of record.
Parameter Refuge1 WCA-22 WCA-33 Park4 Typical MDL (µg/L)
2,4-D PC (1:5) (0:3) (0:21) (0:12) 0.2
Ametryn PC (6:6) PC (3:3) PC (5:21) (0:12) 0.0095
Atrazine C (6:6) C (5:6) PC (8:20) PC (1:12) 0.0095
Atrazine Desethyl PC (3:4) PC (2:5) PC (1:20) (0:12) 0.01
Hexazinone PC (1:5) (0:1) (0:17) (0:8) 0.01
Imidacloprid (0:4) (0:3) PC (1:21) (0:12) 0.2
Metolachlor (0:6) (0:3) (0:18) PC (1:3) 0.057
Metribuzin PC (2:6) PC (1:3) PC (1:21) (0:12) 0.02
Norflurazon (0:4) (0:1) PC (5:18) (0:8) 0.019
Simazine PC (2:6) (0:3) (0:21) (0:12) 0.0095
1 ACME1DS, G-94D, and S-5A (via STA-1W) 2 S-38B, S-6 (via STA-2), and S-7 3 G-123, L3BRS, S-140, S-190, S-8, S-9, S-142, and S-31 4 S-12C, S-18C, and US41-25

2011 South Florida Environmental Report Chapter 3A
3A-33
PHOSPHORUS IN THE EPA
As primary nutrients, phosphorus and nitrogen are essential to the existence and growth of aquatic organisms in surface waters. The native flora and fauna in the Everglades, though, are adapted to successfully exist under nutrient-poor conditions; hence, relatively small additions of nutrients, especially of phosphorus, have dramatic effects on the ecosystem.
Until the recent adoption of the numeric P criteria, both phosphorus and nitrogen concentrations in the EPA’s surface water were only regulated by the Class III narrative criterion. The narrative criterion specifies that nutrient concentrations in a water body cannot be altered to cause an imbalance in the natural populations of aquatic flora or fauna. Because of the importance of phosphorus in controlling the natural biological communities, the FDEP has numerically interpreted the narrative criterion, as directed by the EFA, to establish a 10.0 µg/L TP criterion for the EPA. Currently, N does not have a numeric criterion and is still regulated by only the narrative criteria.
In addition to presenting analyses of individual TP and TN levels, this chapter provides an evaluation of spatial and temporal trends in nutrient levels within the EPA as measured during WY2010 and compares the results with previous monitoring periods to provide an overview of the changes in nutrient levels within the EPA.
Total Phosphorus Concentrations in the EPA
One of the primary objectives of this chapter is to document temporal changes in TP concentrations across the EPA using long-term geometric means to summarize and compare TP concentrations in accordance with the EFA and TP criterion rule requirements.
The EFA and TP criterion were designed to provide long-term, ecologically protective conditions and require the use of geometric means due to the log-normal distribution of natural TP concentrations in the environment. The geometric mean employed by the criterion and the methodology used in this chapter to assess the nutrient levels throughout the EPA accounts for short-term variability in water quality data, while providing more reliable, long-term values that can be used to evaluate and compare the status of nutrients.
Figures 3A-10 through 3A-13 illustrate the temporal changes in annual geometric mean TP concentrations during the POR from WY1978–WY2010 at both inflow and interior sites in each portion of the EPA, including the Refuge, WCA-2, WCA-3, and the Park. The figures also provide the geometric mean TP concentrations for the baseline, Phase I, and Phase II (WY2005–WY2009), and WY2010 periods for comparison. Table 3A-6 provides a summary of the TP concentrations measured within different portions of the EPA during WY2010, and the baseline, Phase I, and WY2005–WY2009 periods using both geometric mean and median values.
During the baseline period, annual geometric mean TP concentrations at inflow and interior marsh sites across the EPA reached peak historic levels and were highly variable as shown in Figures 3A-10 through 3A-13. As the agricultural BMP/STA programs were initiated and became operational during the Phase I period, annual mean TP concentrations at inflow and interior sites within all portions of the EPA were reduced markedly and became less variable compared to levels observed during the baseline period. The effectiveness of the continued optimization and enhancement of the BMPs and STAs that has occurred during the Phase II period on phosphorus levels within the EPA has been difficult to assess due to the effects of climatic extremes that have occurred during the period.

Chapter 3A Volume I: The South Florida Environment
3A-34
Figure 3A-10. Annual geometric mean TP concentrations [microgram per gram (µg/L)] for inflow (upper graph) and interior (lower graph) areas of the Refuge from
WY1978–WY2010. The horizontal lines indicate the average annual geometric mean TP concentrations for the WY1979–WY1993, WY1994–WY2004,
WY2005–WY2009, and WY2010 periods.
Water Year1978 1982 1986 1990 1994 1998 2002 2006 2010
Geo
met
ric
Mea
n T
PC
on
cen
trat
ion
(µ
g/L
)
0
50
100
150
200Annual Refuge InflowWY1979-1993 AvgWY1994-2004 AvgWY2005-2009 Avg
Inflow
Water Year1978 1982 1986 1990 1994 1998 2002 2006 2010
Geo
met
ric
Mea
n T
PC
on
cen
trat
ion
(µ
g/L
)
0
10
20
30
40
Annual Refuge InteriorWY1979-1993 AvgWY1994-2004 AvgWY2005-2009 Avg
Interior
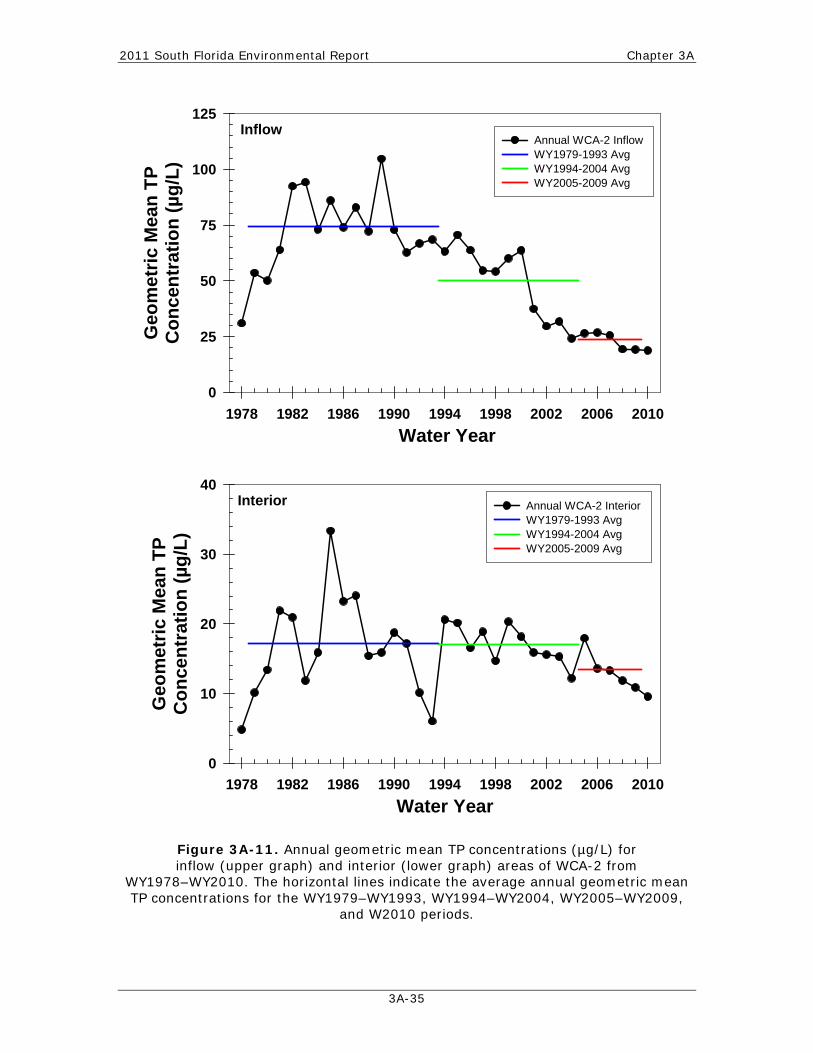
2011 South Florida Environmental Report Chapter 3A
3A-35
Figure 3A-11. Annual geometric mean TP concentrations (µg/L) for inflow (upper graph) and interior (lower graph) areas of WCA-2 from
WY1978–WY2010. The horizontal lines indicate the average annual geometric mean TP concentrations for the WY1979–WY1993, WY1994–WY2004, WY2005–WY2009,
and W2010 periods.
Water Year1978 1982 1986 1990 1994 1998 2002 2006 2010
Geo
met
ric
Mea
n T
PC
on
cen
trat
ion
(µ
g/L
)
0
25
50
75
100
125
Annual WCA-2 Inflow WY1979-1993 AvgWY1994-2004 AvgWY2005-2009 Avg
Inflow
Water Year1978 1982 1986 1990 1994 1998 2002 2006 2010
Geo
met
ric
Mea
n T
PC
on
cen
trat
ion
(µ
g/L
)
0
10
20
30
40Annual WCA-2 Interior WY1979-1993 AvgWY1994-2004 AvgWY2005-2009 Avg
Interior

Chapter 3A Volume I: The South Florida Environment
3A-36
Figure 3A-12. Annual geometric mean TP concentrations (µg/L) for inflow (upper graph) and interior (lower graph) areas of WCA-3 from WY1978–WY2010.
The horizontal lines indicate the average annual geometric mean TP concentrations for the WY1979–WY1993, WY1994–WY2004, WY2005–WY2009, and
WY2010 periods.
Water Year1978 1982 1986 1990 1994 1998 2002 2006 2010
Geo
met
ric
Mea
n T
PC
on
cen
trat
ion
(µ
g/L
)
0
10
20
30
40
50
60
70 Annual WCA-3 Inflow WY1979-1993 AvgWY1994-2004 AvgWY2005-2009 Avg
Inflow
Water Year1978 1982 1986 1990 1994 1998 2002 2006 2010
Geo
met
ric
Mea
n T
PC
on
cen
trat
ion
(µ
g/L
)
0
10
20
30
40
50
60
Annual WCA-3 Interior WY1979-1993 AvgWY1994-2004 AvgWY2005-2009 Avg
Interior

2011 South Florida Environmental Report Chapter 3A
3A-37
Figure 3A-13. Annual geometric mean TP concentrations (µg/L) for inflow (upper graph) and interior (lower graph) areas of the Park from WY1978–WY2010. The horizontal lines indicate the average annual geometric mean TP concentrations
for the WY1979–WY1993, WY1994–WY2004, WY2005–WY2009, and WY2010 periods.
Water Year1978 1982 1986 1990 1994 1998 2002 2006 2010
Geo
met
ric
Mea
n T
PC
on
cen
trat
ion
(µ
g/L
)
0
5
10
15
20
25
Annual ENP Inflow WY 1979-1993 AvgWY 1994-2004 AvgWY 2005-2009 Avg
Inflow
Water Year1978 1982 1986 1990 1994 1998 2002 2006 2010
Geo
met
ric
Mea
n T
PC
on
cen
trat
ion
(µ
g/L
)
0
5
10
15
Annual ENP Interior WY1979-1993 AvgWY1994-2004 AvgWY2005-2009 Avg
Interior

Chapter 3A Volume I: The South Florida Environment
3A-38
Table 3A-6. Summary of TP concentrations (µg/L) in the EPA for the WY1979–WY1993, WY1994–WY2004, WY2005–WY2009, and WY2010 periods.
Region Class Period Sample
Size (N)
Geometric Mean (µg/L)
Std. Deviation (Geometric
Mean)
Median (µg/L)
Min. (µg/L)
Max. (µg/L)
Ref
ug
e
Inflow
1979-1993 1,213 90.7 2.3 97.5 6.0 1,415
1994-2004 1,975 53.8 2.2 54.0 2.0 722
2005-2009 1,283 61.8 2.2 58 12 928.5
2010 260 62.6 2.1 57.75 17 800
Interior
1979-1993 364 13.3 2.6 12.0 <2.0 494
1994-2004 2,430 9.6 1.9 9.0 2.0 200
2005-2009 1,648 10.7 1.9 9.0 2.0 333
2010 350 9.9 1.8 9.0 2.0 127
Outflow
1979-1993 613 65.0 2.1 63.0 8.0 3,435
1994-2004 702 45.4 1.9 43.0 10.0 495
2005-2009 274 31.3 2.1 29.0 8.0 515
2010 75 23.7 1.7 20.0 11.0 170
Rim
1979-1993 118 75.7 1.9 81.0 12.0 473
1994-2004 632 60.7 1.7 57.0 17.0 290
2005-2009 197 45.4 2.1 45.0 4.0 653
2010 34 39.8 1.5 37.0 19.0 145
WC
A-2
Inflow
1979-1993 789 69.8 2.0 68.0 10.0 3,435
1994-2004 1,383 45.0 2.1 49.0 7.0 493
2005-2009 778 23.2 1.9 20.0 4.0 245
2010 158 18.7 1.6 17.5 9.0 125.5
Interior
1979-1993 1,698 16.2 3.4 13.0 <2.0 3,189
1994-2004 3,599 16.9 2.8 14.0 <2.0 2,400
2005-2009 1,443 12.9 2.4 11.0 <2.0 575
2010 271 9.5 2.0 8.0 3.0 87.0
Outflow
1979-1993 893 23.2 2.6 23.0 <2.0 556
1994-2004 682 17.6 2.2 17.0 2.0 199
2005-2009 400 15.0 1.8 14.0 5.0 179
2010 90 11.4 1.6 10.0 3.0 72
WC
A-3
Inflow
1979-1993 2,537 37.4 2.6 37.0 <2.0 933
1994-2004 3,325 31.5 2.3 30.0 2.0 1,286
2005-2009 2,159 23.9 2.0 22.0 6.0 450
2010 397 22.5 2.1 21.0 3.0 949
Interior
1979-1993 628 10.2 3.2 10.0 <2.0 438
1994-2004 2,097 8.1 2.2 7.0 <2.0 310
2005-2009 1,398 8.3 2.2 7.0 2.0 560
2010 205 5.4 1.7 5.0 2.0 39
Outflow
1979-1993 1,971 12.1 2.3 11.0 <2.0 593
1994-2004 2,412 10.1 2.0 10.0 2.0 171
2005-2009 1,042 13.8 1.9 12.0 3.0 1,083
2010 265 11.1 1.8 10.0 2.0 114
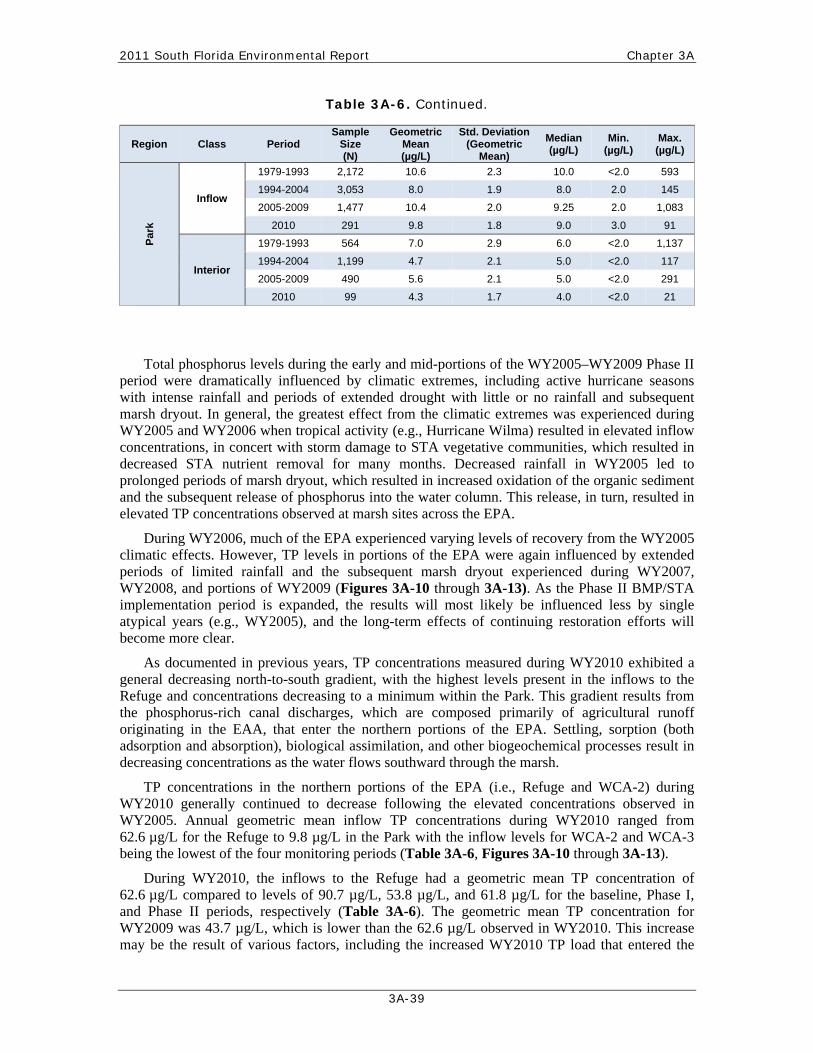
2011 South Florida Environmental Report Chapter 3A
3A-39
Total phosphorus levels during the early and mid-portions of the WY2005–WY2009 Phase II period were dramatically influenced by climatic extremes, including active hurricane seasons with intense rainfall and periods of extended drought with little or no rainfall and subsequent marsh dryout. In general, the greatest effect from the climatic extremes was experienced during WY2005 and WY2006 when tropical activity (e.g., Hurricane Wilma) resulted in elevated inflow concentrations, in concert with storm damage to STA vegetative communities, which resulted in decreased STA nutrient removal for many months. Decreased rainfall in WY2005 led to prolonged periods of marsh dryout, which resulted in increased oxidation of the organic sediment and the subsequent release of phosphorus into the water column. This release, in turn, resulted in elevated TP concentrations observed at marsh sites across the EPA.
During WY2006, much of the EPA experienced varying levels of recovery from the WY2005 climatic effects. However, TP levels in portions of the EPA were again influenced by extended periods of limited rainfall and the subsequent marsh dryout experienced during WY2007, WY2008, and portions of WY2009 (Figures 3A-10 through 3A-13). As the Phase II BMP/STA implementation period is expanded, the results will most likely be influenced less by single atypical years (e.g., WY2005), and the long-term effects of continuing restoration efforts will become more clear.
As documented in previous years, TP concentrations measured during WY2010 exhibited a general decreasing north-to-south gradient, with the highest levels present in the inflows to the Refuge and concentrations decreasing to a minimum within the Park. This gradient results from the phosphorus-rich canal discharges, which are composed primarily of agricultural runoff originating in the EAA, that enter the northern portions of the EPA. Settling, sorption (both adsorption and absorption), biological assimilation, and other biogeochemical processes result in decreasing concentrations as the water flows southward through the marsh.
TP concentrations in the northern portions of the EPA (i.e., Refuge and WCA-2) during WY2010 generally continued to decrease following the elevated concentrations observed in WY2005. Annual geometric mean inflow TP concentrations during WY2010 ranged from 62.6 µg/L for the Refuge to 9.8 µg/L in the Park with the inflow levels for WCA-2 and WCA-3 being the lowest of the four monitoring periods (Table 3A-6, Figures 3A-10 through 3A-13).
During WY2010, the inflows to the Refuge had a geometric mean TP concentration of 62.6 µg/L compared to levels of 90.7 µg/L, 53.8 µg/L, and 61.8 µg/L for the baseline, Phase I, and Phase II periods, respectively (Table 3A-6). The geometric mean TP concentration for WY2009 was 43.7 µg/L, which is lower than the 62.6 µg/L observed in WY2010. This increase may be the result of various factors, including the increased WY2010 TP load that entered the
Table 3A-6. Continued.
Region Class Period Sample
Size (N)
Geometric Mean (µg/L)
Std. Deviation (Geometric
Mean)
Median (µg/L)
Min. (µg/L)
Max. (µg/L)
Par
k
Inflow
1979-1993 2,172 10.6 2.3 10.0 <2.0 593
1994-2004 3,053 8.0 1.9 8.0 2.0 145
2005-2009 1,477 10.4 2.0 9.25 2.0 1,083
2010 291 9.8 1.8 9.0 3.0 91
Interior
1979-1993 564 7.0 2.9 6.0 <2.0 1,137
1994-2004 1,199 4.7 2.1 5.0 <2.0 117
2005-2009 490 5.6 2.1 5.0 <2.0 291
2010 99 4.3 1.7 4.0 <2.0 21

Chapter 3A Volume I: The South Florida Environment
3A-40
EPA as well as the dryout experienced in STA-1E during April–June 2009. Inflows to WCA-2 have progressively decreased from 69.8 µg/L in the baseline period to 45.0 µg/L in the Phase I period, 23.2 µg/L in the Phase II period (WY2005–WY2009) to 18.7 µg/L in WY2010 (Table 3A-6). Inflow TP concentrations for WCA-3 have also exhibited a continual but less dramatic decrease, dropping from 37.4 µg/L in the baseline period to 22.5 µg/L in WY2010. The lower TP concentrations in the inflows to WCA-2 and WCA-3 over the four monitoring periods are likely the result of multiple variables, including improved treatment by the STAs, lower stormwater volumes resulting from the periods of limited rainfall, and the general recovery from the damage resulting from the WY2005 hurricanes.
Meanwhile, the mean inflow concentration to the Park in WY2010 (9.8 µg/L) was slightly higher than the 9.3 µg/L mean concentration observed in WY2009. WY2010 TP concentrations in the Park’s inflows were slightly below the levels reported for the baseline (10.6 µg/L) and Phase II (10.4 µg/L) periods but were higher than the Phase I period (8.0 µg/L) (Table 3A-6). Meanwhile, the interior TP concentration (4.3 µg/L) in WY2010 was the lowest of the four monitoring periods. This decrease may be an indication that Park’s interior is beginning to recover from the effects of recent drought conditions and low water levels in upstream areas.
Similar to WY2009, the WY2010 geometric mean TP concentrations at interior sites within WCA-2, WCA-3, and the Park were the lowest among the four monitoring periods. During WY2010, geometric mean TP concentrations at interior sites within the EPA ranged from 9.9 µg/L in the Refuge to 4.3 µg/L in the Park. Within the Refuge, the mean TP concentration for WY2010 was well below the level for the baseline period and comparable to the mean concentrations for the Phase I and Phase II periods. The greatest decreases in TP concentration for interior sites were observed in WCA-2 and WCA-3. The geometric mean TP concentrations in WCA-2 have decreased from 16.2 µg/L during the baseline period to 16.9, 12.9, and 9.5 µg/L for the Phase I, Phase II, and WY2010 periods, respectively. Likewise, mean TP levels at interior sites within WCA-3 have fallen from 10.2 µg/L during the baseline period to 8.1, 8.3, and 5.4 µg/L for the Phase I, Phase II, and WY2010 periods, respectively (Table 3A-6 and Figures 3A-11 and 3A-12). The continued decreases observed in WCA-2 and WCA-3 likely reflect recovery from the recent climatic extremes, improved treatment of the inflows to these areas (which is supported by similar decreases in inflow concentrations), and improved conditions in the impacted portions of the marsh (including the area downstream of the S-10 structures where the quantity of discharge has been significantly reduced and the quality of the discharge has improved since STA-2 began operation).
The WY2010 geometric mean TP concentrations for interior sites in all areas of the EPA were below the 10.0 µg/L five-year and 11.0 µg/L annual limits for assessing achievement of the TP criterion, with the mean concentrations in the Park and WCA-3 being well below these limits. The geometric mean TP concentrations at interior sites within all portions of the EPA, except for the Refuge, were the lowest among the four monitoring periods. The geometric mean TP concentration in the interior of the Refuge was 9.9 µg/L, which is less than the baseline and Phase II periods but slightly above the Phase I period (9.6 µg/L). For WCA-2, the geometric mean TP concentration of 9.5 µg/L determined for interior sites during WY2010 represents the first time in the WY1979–WY2010 POR, except for WY1993, that the annual mean concentration has been below 10.0 µg/L. During WY1993, only 15 samples were collected at three sites in the interior of WCA-2, which resulted in an annual mean concentration that was well below 10 µg/L; however, that concentration is probably not representative of the overall conditions in WCA-2 during that year due to the limited number of samples collected. The low TP concentrations observed in WCA-2 during WY2010 likely represent continued recovery in one of the areas most highly impacted by historical phosphorus enrichment.

2011 South Florida Environmental Report Chapter 3A
3A-41
Annual geometric mean TP concentrations for individual interior marsh monitoring stations sampled four or more times during WY2010 ranged from less than 3.0 µg/L in some unimpacted portions of the marsh to 57.1 µg/L at a Refuge site, which is highly influenced by canal inputs. Across the entire EPA, 69.7 percent of the interior marsh sites exhibited annual geometric mean TP concentrations of 10.0 µg/L or less, which is comparable to the 69.8 percent observed in WY2009. In comparison, 50.0 percent, 65.1 percent, and 60.5 percent of the interior marsh site/years exhibited geometric mean TP concentrations less than or equal to 10.0 µg/L during baseline, Phase I, and Phase II periods, respectively. Additionally, 85.4 percent of the interior sites in the EPA had annual geometric mean TP concentrations of 15.0 µg/L or below during WY2010 compared to 83.7 percent reported in WY2009. During the three historical periods, 70.7 percent, 79.8 percent, and 77.9 percent of the interior sites, respectively, had annual geometric mean concentrations of 15.0 µg/L or less. The greater percent of sites meeting the 10 µg/L and 15 µg/L limits observed for WY2010 reflects the continued recovery from the recent climatic extremes, improved treatment of the inflows to the EPA, and the overall improvement in phosphorus conditions within the interior marsh due to restoration activities. Given the relatively constant location of interior monitoring sites in recent years, the temporal comparison of statistics from individual sites can be used to distinguish changes in measured concentrations. However, it should be noted that since the existing monitoring network was not designed to allow the results to accurately estimate the percentage of the marsh exceeding a TP concentration of 10.0 µg/L (or other threshold), it is not appropriate to use the results for that purpose.
Spatially, interior marsh TP concentrations measured during WY2010 exhibited the same north-to-south gradient observed during previous periods (Bechtel et al., 1999, 2000; Weaver et al., 2001, 2002, 2003; Payne and Weaver, 2004, Payne et al., 2006, 2007, 2008, 2009, 2010). Typically, the highest TP concentrations obtained during WY2010 were collected from the northern WCAs and declined throughout WCA-3 and the Park. In WY2010, 63.3 percent of the interior stations within the Refuge had annual geometric mean TP concentrations of 10.0 µg/L or less, while 86.7 percent had annual geometric mean TP concentrations of 15.0 µg/L or less. For WCA-2, 50 percent of the interior monitoring sites had an annual geometric mean TP concentration of 10.0 µg/L or less, which is a slight increase from the 48.2 percent observed in WY2009. In WCA-3, 90.0 percent of the interior monitoring sites had annual geometric mean TP concentrations of 10.0 µg/L or less, and 95 percent had annual geometric mean TP concentrations of 15.0 µg/L or less for WY2010. Similar to WY2009, 100 percent of the interior sites in the Park had annual geometric mean TP concentrations of 10.0 µg/L or less during WY2010 (Figure 3A-14). A detailed, site-specific summary of the TP concentrations for WY2010 is provided in Appendix 3A-4 of this volume.
The distribution of TP concentrations in samples collected at inflow, interior, and outflow stations from each EPA region for WY2010 is presented in Figure 3A-15 along with a comparison of the concentrations measured in samples reported for the baseline, Phase I, and Phase II periods. Future SFERs are expected to continue tracking long-term trends in phosphorus levels throughout the EPA.

Chapter 3A Volume I: The South Florida Environment
3A-42
Figure 3A-14. Summary of geometric mean TP concentrations (μg/L) for WY2010 at stations across the EPA. Geometric mean TP concentrations are classified utilizing four levels: ≤ 10 μg/L,
> 10–15 μg/L, > 15–50 μg/L, and > 50 μg/L.

2011 South Florida Environmental Report Chapter 3A
3A-43
Figure 3A-15. Comparison of TP concentrations (µg/L) measured in samples collected in the EPA during the WY1979–WY1993, WY1994–WY2004, WY2005–WY2010, and WY2010 periods. N/A = Not available. Outflow is not
monitored for the Park.

Chapter 3A Volume I: The South Florida Environment
3A-44
Orthophosphate Concentrations in the EPA
Orthophosphate (OP) is an inorganic, soluble form of phosphorus readily utilized by biological organisms and, therefore, has the greatest and most rapid effect on the Everglades ecosystem. During WY2010, geometric mean OP concentrations at all stations (e.g., inflow, interior, rim, and outflow) within the EPA were lower than the levels observed during the baseline, Phase I, and Phase II periods (Table 3A-7). At all stations, the maximum OP concentration measured was lower than the previous three periods. Inflow concentrations ranged from 8.3 µg/L in the Refuge to 1.2 µg/L in the Park.
The greatest decrease in OP concentration (8.7 µg/L) was observed at the Rim Canal sites in the Refuge, which decreased from 11.6 µg/L in the Phase II period to 2.9 µg/ in WY2010. The inflow, interior, and outflow sites of the Refuge and the inflow stations to WCA-2 also showed notable decreases in OP concentrations over the previous three periods. The large decreases observed in the northern portions of the EPA were likely the result of multiple factors, including the continued recovery of the STAs following the damage resulting from the WY2005 and WY2006 active tropical seasons, less inflow from Lake Okeechobee and the EAA, and improved STA performance, especially under low water levels.
Likewise, the OP levels at interior sites during WY2010 were low, with the annual geometric mean concentrations being less than 2.0 µg/L for all areas. The lower OP levels determined for both the inflows and interior sites during WY2010 further show the continued recovery from the recent extreme climatic events, the preferential removal of OP by the STAs, and the effects of restoration activities to improve the overall phosphorus conditions in the interior marsh areas of the EPA.
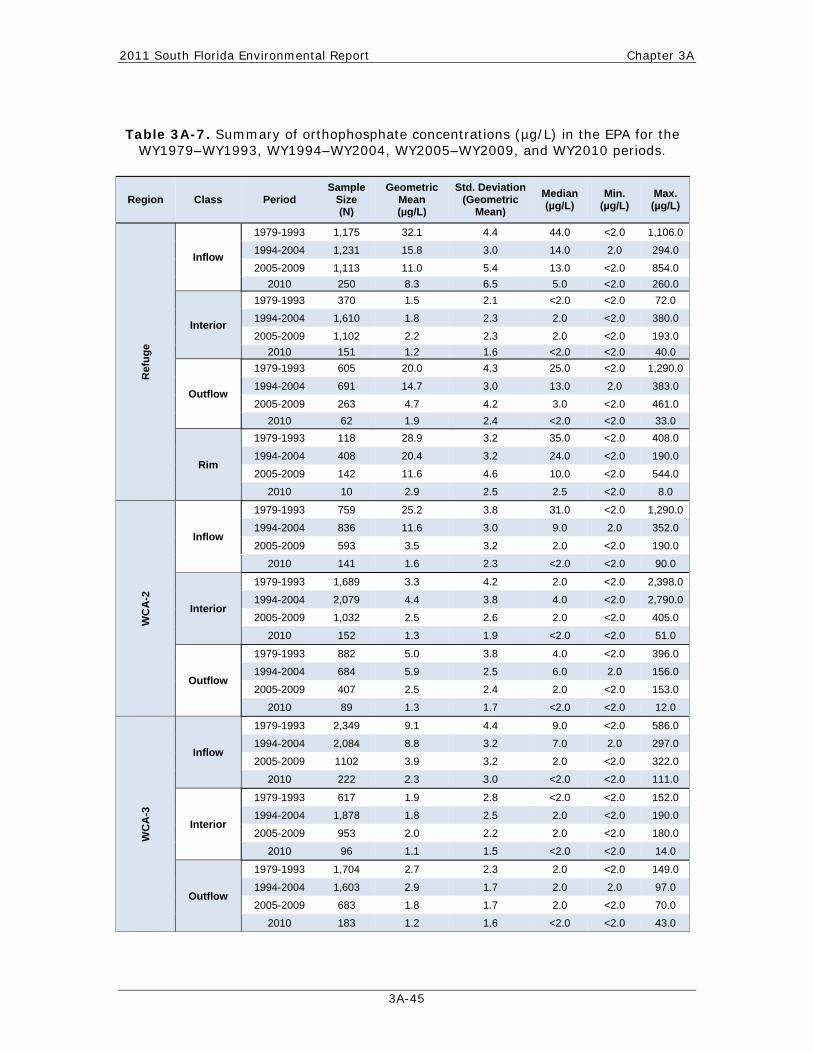
2011 South Florida Environmental Report Chapter 3A
3A-45
Table 3A-7. Summary of orthophosphate concentrations (µg/L) in the EPA for the WY1979–WY1993, WY1994–WY2004, WY2005–WY2009, and WY2010 periods.
Region Class Period Sample
Size (N)
Geometric Mean (µg/L)
Std. Deviation (Geometric
Mean)
Median (µg/L)
Min. (µg/L)
Max. (µg/L)
Ref
ug
e
Inflow
1979-1993 1,175 32.1 4.4 44.0 <2.0 1,106.0
1994-2004 1,231 15.8 3.0 14.0 2.0 294.0
2005-2009 1,113 11.0 5.4 13.0 <2.0 854.0
2010 250 8.3 6.5 5.0 <2.0 260.0
Interior
1979-1993 370 1.5 2.1 <2.0 <2.0 72.0
1994-2004 1,610 1.8 2.3 2.0 <2.0 380.0
2005-2009 1,102 2.2 2.3 2.0 <2.0 193.0
2010 151 1.2 1.6 <2.0 <2.0 40.0
Outflow
1979-1993 605 20.0 4.3 25.0 <2.0 1,290.0
1994-2004 691 14.7 3.0 13.0 2.0 383.0
2005-2009 263 4.7 4.2 3.0 <2.0 461.0
2010 62 1.9 2.4 <2.0 <2.0 33.0
Rim
1979-1993 118 28.9 3.2 35.0 <2.0 408.0
1994-2004 408 20.4 3.2 24.0 <2.0 190.0
2005-2009 142 11.6 4.6 10.0 <2.0 544.0
2010 10 2.9 2.5 2.5 <2.0 8.0
WC
A-2
Inflow
1979-1993 759 25.2 3.8 31.0 <2.0 1,290.0
1994-2004 836 11.6 3.0 9.0 2.0 352.0
2005-2009 593 3.5 3.2 2.0 <2.0 190.0
2010 141 1.6 2.3 <2.0 <2.0 90.0
Interior
1979-1993 1,689 3.3 4.2 2.0 <2.0 2,398.0
1994-2004 2,079 4.4 3.8 4.0 <2.0 2,790.0
2005-2009 1,032 2.5 2.6 2.0 <2.0 405.0
2010 152 1.3 1.9 <2.0 <2.0 51.0
Outflow
1979-1993 882 5.0 3.8 4.0 <2.0 396.0
1994-2004 684 5.9 2.5 6.0 2.0 156.0
2005-2009 407 2.5 2.4 2.0 <2.0 153.0
2010 89 1.3 1.7 <2.0 <2.0 12.0
WC
A-3
Inflow
1979-1993 2,349 9.1 4.4 9.0 <2.0 586.0
1994-2004 2,084 8.8 3.2 7.0 2.0 297.0
2005-2009 1102 3.9 3.2 2.0 <2.0 322.0
2010 222 2.3 3.0 <2.0 <2.0 111.0
Interior
1979-1993 617 1.9 2.8 <2.0 <2.0 152.0
1994-2004 1,878 1.8 2.5 2.0 <2.0 190.0
2005-2009 953 2.0 2.2 2.0 <2.0 180.0
2010 96 1.1 1.5 <2.0 <2.0 14.0
Outflow
1979-1993 1,704 2.7 2.3 2.0 <2.0 149.0
1994-2004 1,603 2.9 1.7 2.0 2.0 97.0
2005-2009 683 1.8 1.7 2.0 <2.0 70.0
2010 183 1.2 1.6 <2.0 <2.0 43.0

Chapter 3A Volume I: The South Florida Environment
3A-46
Total Phosphorus Loads to the EPA
The EPA is a complex system of marsh areas, canals, levees, and inflow and outflow water control structures that covers almost 2.5 million acres (1 acre = 0.405 hectare). In addition to rainfall inputs, surface water inflows regulated by water control structures from agricultural tributaries, such as the EAA and the C-139 Basin, feed the EPA from the northern and western boundaries. The EPA also receives surface water inflows originating from Lake Okeechobee to the north and from predominantly urbanized areas to the east. The timing and distribution of the surface inflows from the tributaries to the EPA are based on a complex set of operational decisions that account for natural and environmental system requirements, water supply for urbanized and natural areas, aquifer recharge, and flood control. It is also recognized that a certain amount of TP loading to the EPA emanates from atmospheric deposition.
The long-term average range of atmospheric deposition of TP is between 107 and 143 metric tons (mt) per year as the total contribution to the WCAs. Atmospheric TP deposition rates are highly variable, very expensive to monitor, and, as such, are not routinely monitored. The range [expressed spatially as 20–35 milligrams per square meter per year (mg/m2/yr)] is based on data obtained from long-term monitoring that was evaluated by the District as reported in Redfield (2002).
Each year, the EPA receives variable amounts of surface water inflows based on the hydrologic variability within the upstream basins. These inflows, regulated according to previously mentioned operational decisions, also contribute a certain amount of TP loading to the EPA system. Table 3A-8 provides estimates of the flow and TP load to each portion of the EPA for WY2010. Flows and TP loads are also provided for the baseline, Phase I, and Phase II periods for comparison.
Detailed estimates of TP loads by structure for WY2010 are presented in Appendix 3A-5 of this volume. This appendix summarizes contributions from all connecting tributaries to the EPA: Lake Okeechobee, the EAA, the C-139 Basin, other agricultural and urbanized areas, and the STAs. In some cases, surface water inflows represent a mixture of water from several sources as the water passes from one area to another before finally arriving in the EPA. For example, water discharged from Lake Okeechobee can pass through the EAA and then through an STA before arriving in the EPA. Similarly, runoff from the C-139 Basin can pass through STA-5 and then into the EAA before ultimately arriving in the EPA.
Table 3A-7. Continued.
Region Class Period Sample
Size (N)
Geometric Mean (µg/L)
Std. Deviation (Geometric
Mean)
Median (µg/L)
Min. (µg/L)
Max. (µg/L)
Par
k
Inflow
1979-1993 1,902 2.6 2.2 2.0 <2.0 77.0
1994-2004 1,913 2.8 1.7 2.0 2.0 97.0
2005-2009 852 1.8 1.6 2.0 <2.0 20.0
2010 204 1.2 1.6 <2.0 <2.0 43.0
Interior
1979-1993 546 2.9 1.9 2.0 2.0 63.0
1994-2004 1,059 2.7 1.6 2.0 2.0 45.0
2005-2009 331 1.9 1.7 2.0 <2.0 19.0
2010 73 1.2 1.4 <2.0 <2.0 4.0

2011 South Florida Environmental Report Chapter 3A
3A-47
As detailed in Appendix 3A-5 of this volume, TP loads from surface sources to the EPA totaled approximately 85.0 mt, with a flow-weighted mean (FWM) TP concentration of 29 µg/L. Another 193 mt of TP is estimated to have entered the EPA through atmospheric deposition. Surface discharges from the EPA account for approximately 9.0 mt of TP. The 85.0 mt TP load in the surface inflows to the EPA represents an increase of approximately 31 percent compared to the previous year (WY2009 = 65.0 mt). The higher TP loads to the EPA observed during WY2010 primarily resulted from reduced flow volumes associated with the drought conditions experienced during much of WY2007, WY2008, and WY2009. The 2,410,298 acre feet (ac-ft) of surface water flow to the EPA determined for WY2010 is approximately 18 percent higher than the 2,037,918 ac-ft reported for WY2009 (Payne et al., 2010).
Figures 3A-16 through 3A-19 provide a summary of the annual flows and TP loads to each portion of the EPA for the period from WY1979 through WY2010 along with the annual averages for the baseline, Phase I, and WY2005–WY2009 (Phase II) periods. The effectiveness of the BMP and STA P removal efforts is demonstrated by the decreased TP loading to WCA-2 and WCA-3 during the WY1994–WY2004 and WY2005–WY2009 periods compared to the
Table 3A-8. Summary of annual average flow, flow-weighted mean TP concentrations, and TP loads in the EPA for the WY1979–WY1993,
WY1994–WY2004, WY2005–WY2009, and WY2010 periods.
Area Period
Average Annual Flow
(1,000 ac-ft*)
Average Annual Flow-Weighted Mean TP (µg/L)
Average Annual Load (kg)
Ref
ug
e
WY1979-1993 506 186 111,436
WY1994-2004 647 100 83,977
WY2005-2009 315 95 36,899
WY2010 310 56 21,292
WC
A-2
WY1979-1993 581 119 78,670
WY1994-2004 704 65 57,391
WY2005-2009 771 32 30,166
WY2010 1,266 27 41,392
WC
A-3
WY1979-1993 1,181 72 108,357
WY1994-2004 1,396 49 84,335
WY2005-2009 1,344 35.3 58,596
WY2010 1,510 24 43,690
Par
k
WY1979-1993 815 12 11,450
WY1994-2004 1,477 9 15,912
WY2005-2009 906 9 10,470
WY2010 1,099 10 12,924
*1 acre-feet (ac-ft) = 0.1233 hectare-meter (ha-m)

Chapter 3A Volume I: The South Florida Environment
3A-48
baseline period despite increased flows (Figures 3A-17 and 3A-18). The effect of the P-removal efforts is less apparent in the Park, where inflow concentrations have remained near background levels and the TP loading responds more directly to changes in flow and climatic conditions (Figure 3A-19).
It should be noted that the average flow and TP loads to the EPA, especially the Refuge, during the recent WY2005–WY2009 and WY2010 periods have been highly influenced by the effects of climatic extremes, including both hurricanes and prolonged drought as previously discussed. For example, the total TP load from all sources to the Refuge was approximately 21.3 mt during WY2010, which represents an approximate 76 percent increase from the previous year (12.1 mt). There was a small decrease (8 percent) in the amount of water discharged to the Refuge from the structures in WY2010 (310,197 ac-ft) compared to WY2009 (335,711 ac-ft). The FWM concentration increased from 29 µg/L in WY2009 to 56 µg/L in WY2010. Additional years of monitoring are needed before the effects of the Phase II BMP/STA optimization projects can be observed.

2011 South Florida Environmental Report Chapter 3A
3A-49
Figure 3A-16. Annual flow (upper graph) and average TP load (lower graph) to the Refuge from WY1979–WY2010. The horizontal lines indicate the average annual
flows and loads for the WY1979–WY1993, WY1994–WY2004, and WY2005–WY2009, and WY2010 periods, respectively.

Chapter 3A Volume I: The South Florida Environment
3A-50
Figure 3A-17. Annual flow (upper graph) and average TP load (lower graph) to WCA-2 from WY1979–WY2010. The horizontal lines indicate the average annual
flows and loads for the WY1979–WY1993, WY1994–WY2004, and WY2005–WY2009, and WY2010 periods, respectively.

2011 South Florida Environmental Report Chapter 3A
3A-51
Figure 3A-18. Annual flow (upper graph) and average TP load (lower graph) to WCA-3 from WY1979–WY2010. The horizontal lines indicate the average annual
flows and loads for the WY1979–WY1993, WY1994–WY2004, WY2005–WY2009, and WY2010 periods, respectively.

Chapter 3A Volume I: The South Florida Environment
3A-52
Figure 3A-19. Annual flow (upper graph) and average TP load (lower graph) to the Park from WY1979–WY2010. The horizontal lines indicate the average annual flows and loads for the WY1979–WY1993, WY1994–WY2004, and WY2005–WY2009,
and WY2010 periods, respectively.

2011 South Florida Environmental Report Chapter 3A
3A-53
EPA Total Phosphorus Criterion Achievement Assessment
The TP criterion rule specifies that while the federal Settlement Agreement (Case No. 88-1886-CIV-MORENO) is in effect, compliance with the criterion in the Park will be assessed in accordance with the methodology specified in Appendix A of the Settlement Agreement using FWM TP concentrations at inflow sites instead of ambient marsh TP concentrations, as done in the other portions of the EPA. The Settlement Agreement assessments for the Park are conducted by the District and reported on a quarterly basis to satisfy other mandates and, therefore, are not replicated here. The quarterly Settlement Agreement reports prepared by the District are available on the District’s website at www.sfwmd.gov/environmentalmonitoring.
In addition to establishing the numeric TP criterion for the EPA, the TP Criterion Rule (Section 62-302.540, F.A.C.) also provides a four-part test to be used to determine achievement of the numeric TP criterion. Each of the four components of the assessment test, as specified in Table 3A-2, must be achieved for a water body to be considered in compliance with the TP criterion. The detailed results of the preliminary evaluation to assess achievement of the TP criterion using available data for the most recent five-year period, WY2005–WY2010, are provided in Appendix 3A-6 of this volume. As described previously, the results of this assessment were affected by data limitations in many parts of the EPA during some years caused in part by the extremely dry conditions that have prevailed throughout the area. Additionally, monitoring at nine new sites (which were added to the existing sites to form the TP criterion monitoring network) was not initiated until January 2007. During WY2010, 56 of the 58 TP criterion monitoring network sites had sufficient data (i.e., ≥ six samples specified by the screening protocol referenced by the TP Criterion Rule, per Section 62-302.540, F.A.C.) to be included in the TP criterion assessment. In contrast, only 30 of the 58 sites had a sufficient number of samples during WY2007, with less than 50 percent of the monitoring sites in the Refuge and WCA-3 having the minimum number of samples required for inclusion in the TP criterion assessment.
The results of the WY2006–WY2010 TP criterion assessment indicate that, even with the data limitations, the unimpacted portions of each WCA passed all four parts of the compliance test (as expected) and are therefore are in compliance with the 10 µg/L TP criterion. Occasionally, individual sites within the unimpacted portions of the conservation areas exhibited an annual site geometric mean TP concentration above 10 µg/L, as expected, but in no case did the values for the individual unimpacted sites cause an exceedance of the annual or long-term network limits. During WY2010, none of the annual geometric mean TP concentrations for the individual sites exceeded the 15 µg/L annual site limit.
In contrast, the impacted (i.e., phosphorus-enriched) portions of each water body failed one or more parts of the test and therefore exceeded the criteria. The impacted portions of the WCAs routinely exceeded the annual and five-year network TP concentration limits of 11 µg/L and 10 µg/L, respectively. Occasionally, selected individual sites within the impacted areas exhibited annual geometric mean TP concentrations below the 15 µg/L annual site limit. During WY2006, a number of sites including LOXA101, LOXA105, LOXA124, LOXA130, LOXA137, LOXA140, CA224, F3, F4, CA314, and CA33 had annual geometric mean TP concentrations below 15 µg/L. In a few instances, the annual mean for individual impacted sites was below 10 µg/L; however, none of the impacted sites were consistently below the 10 µg/L long-term limit. Except for the impacted portion of WCA-3, the annual network geometric mean TP concentrations for WY2010 were the lowest of the five-year assessment period. In the impacted area of WCA-3, only three of the five sites had sufficient data for WY2010 to be included in the assessment.
Future TP criterion achievement assessments conducted with more robust datasets are expected to provide a better understanding of phosphorus concentrations in the EPA.

Chapter 3A Volume I: The South Florida Environment
3A-54
TOTAL NITROGEN CONCENTRATIONS IN THE EPA
The concentration of TN in surface waters is not measured directly but is calculated as the sum of total Kjeldahl nitrogen (TKN; organic N plus ammonia) and nitrite plus nitrate (NO3 + NO2). The TN values for this chapter were calculated only for those samples for which both TKN and NO3 + NO2 results were available. Table 3A-9 provides a summary of the TN concentrations measured in the different portions of the EPA during the baseline, Phase I, and Phase II periods, as well as for WY2010.
As in previous years, TN concentrations during WY2010 exhibited a general north-to-south spatial gradient across the EPA. This gradient likely reflects the higher concentrations associated with discharges to the northern portions of the system from agricultural areas and Lake Okeechobee. A gradual reduction in TN levels results from assimilative processes in the marsh as water flows southward. The highest geometric mean TN concentrations were observed in the inflows to the Refuge (2.68 mg/L) and WCA-2 (1.95 mg/L) and decreased to a minimum concentration at sites within the interior of the Park (1.09 mg/L) and the Refuge (1.10 mg/L).
During WY2010, the geometric mean TN concentrations for the interior sites in the Refuge and WCA-2 were considerably lower than the levels for any of the preceding periods. In addition, the geometric mean TN concentrations for the interior, rim, and outflow stations of the Refuge and all stations in WCA-2 were below those reported for the WY2005–WY2009 period and well below those for the earlier two periods. The lower concentrations observed during WY2010 may be the result of improved nutrient-removal effectiveness of the STAs, especially during low water conditions.
During WY2010, geometric mean TN concentrations at inflow stations ranged from 1.09 mg/L in the Park to 2.68 mg/L in the Refuge, and median TN concentrations ranged from 1.08 mg/L to 2.57 mg/L, respectively. Similarly, mean TN concentrations at the interior marsh stations during WY2010 ranged from 1.09 mg/L in the Park to 1.93 mg/L in WCA-2, with median concentrations ranging from 1.15 mg/L to 1.93 mg/L, respectively, which is a slight increase from the range observed in WY2009 (1.01 mg/L to 1.75 mg/L).
An analysis of the data collected at interior sites from all areas (e.g., Refuge, WCA-2, WCA-3, and the Park) during the Phase II and WY2010 periods indicates a strong correlation between TN and total organic carbon (TOC) (Figure 3A-20). This strong correlation indicates that the primary source of the TN measured within the marsh is the organic material that naturally occurs in abundance in the wetland and enters the marsh from the oxidized sediments in the EPA. This finding, and the low NO3 + NO2 concentrations observed, also indicates that inorganic forms of nitrogen from anthropogenic sources are generally not important sources of N to the EPA.

2011 South Florida Environmental Report Chapter 3A
3A-55
Table 3A-9. Summary of total nitrogen concentrations (mg/L) in the EPA for the WY1979–WY1993, WY1994–WY2004, WY2005–WY2009, and WY2010 periods.
Region Class Period Sample
Size (N)
Geometric Mean (mg/L)
Std. Deviation (Geometric
Mean)
Median (mg/L)
Min. (mg/L)
Max. (mg/L)
Ref
ug
e
Infl
ow
1979-1993 1,206 3.68 1.79 3.83 0.25 18.68
1994-2004 1,601 2.42 1.59 2.33 0.25 48.23
2005-2009 600 2.09 1.40 2.13 0.47 6.75
2010 126 2.68 1.36 2.57 1.43 7.61
Inte
rio
r
1979-1993 359 2.41 1.63 2.32 0.72 36.71
1994-2004 1,887 1.28 1.47 1.22 0.45 9.50
2005-2009 1047 1.23 1.41 1.19 0.56 7.91
2010 156 1.10 1.33 1.07 0.65 2.63
Ou
tflo
w 1979-1993 602 2.65 1.69 2.58 0.25 22.84
1994-2004 696 2.00 1.53 1.89 0.25 7.91
2005-2009 248 1.57 1.44 1.54 0.78 6.33
2010 69 1.53 1.28 1.46 1.03 2.95
Rim
1979-1993 118 2.76 1.65 2.64 0.80 10.91
1994-2004 592 2.38 1.51 2.26 0.68 9.66
2005-2009 152 1.98 1.40 2.09 0.87 5.22
2010 10 1.82 1.27 1.96 1.40 2.41
WC
A-2
Infl
ow
1979-1993 784 2.91 1.66 2.91 0.25 22.84
1994-2004 1,192 2.40 1.49 2.42 0.67 7.91
2005-2009 515 2.08 1.42 2.08 0.70 6.33
2010 125 1.95 1.28 2.03 1.03 3.93
Inte
rio
r
1979-1993 1,669 2.62 1.56 2.50 0.25 37.17
1994-2004 2,914 2.03 1.42 2.10 0.25 37.10
2005-2009 1,019 1.99 1.34 2.00 0.75 10.10
2010 154 1.93 1.21 1.93 1.24 3.75
Ou
tflo
w 1979-1993 894 2.25 1.41 2.18 0.75 7.65
1994-2004 675 1.66 1.35 1.65 0.25 4.44
2005-2009 385 1.75 1.26 1.78 0.91 3.93
2010 88 1.65 1.28 1.73 0.97 3.49
WC
A-3
Infl
ow
1979-1993 2,401 2.02 1.57 1.95 0.25 10.80
1994-2004 2,561 1.67 1.44 1.59 0.54 7.79
2005-2009 1,315 1.61 1.29 1.63 0.75 6.11
2010 284 1.67 1.36 1.63 0.86 12.25
Inte
rio
r
1979-1993 590 1.91 1.55 1.87 0.43 10.01
1994-2004 1,686 1.18 1.39 1.15 0.25 9.00
2005-2009 951 1.33 1.38 1.33 0.49 4.50
2010 180 1.30 1.33 1.31 0.70 2.59
Ou
tflo
w 1979-1993 1,721 1.51 1.47 1.51 0.25 14.86
1994-2004 1,534 1.05 1.44 1.09 0.25 4.10
2005-2009 736 1.17 1.32 1.18 0.52 3.39
2010 187 1.23 1.32 1.27 0.52 3.42

Chapter 3A Volume I: The South Florida Environment
3A-56
Table 3A-9. Continued.
Region Class Period Sample
Size (N)
Geometric Mean (mg/L)
Std. Deviation (Geometric
Mean)
Median (mg/L)
Min. (mg/L)
Max. (mg/L)
Par
k
Infl
ow
1979-1993 1,929 1.37 1.63 1.45 0.25 14.86
1994-2004 1,828 0.88 1.59 0.93 0.25 3.60
2005-2009 938 1.02 1.39 1.03 0.49 3.39
2010 204 1.09 1.39 1.08 0.59 2.13 In
teri
or
1979-1993 565 1.28 1.90 1.37 0.25 40.84
1994-2004 1,007 1.03 1.64 1.06 0.25 5.70
2005-2009 317 1.02 1.66 1.00 0.03 7.68
2010 73 1.09 1.44 1.15 0.56 2.91
Figure 3A-20. Relationship between TN and total organic carbon concentrations at
interior sites from all areas of the EPA during the WY2005-WY2010 period (sample size = 1899).
TOC, mg/L
5 10 15 20 25 30 35 40 45 50 55 60
TN
, m
g/L
0.0
1.0
2.0
3.0
4.0
5.0 Y = 0.0569 x + 0.118R2 = 0.756

2011 South Florida Environmental Report Chapter 3A
3A-57
LITERATURE CITED
APHA. 1995. Standard Methods for the Examination of Water and Wastewater, 19th Edition. A.D. Eaton, L.S. Clesceri and A.E. Greenberg, eds. American Public Health Association, Washington, D.C.
Atkeson, T. and D. Axelrad. 2003. Chapter 2B: Mercury Monitoring, Research and Environmental Assessment. In: 2003 Everglades Consolidated Report, South Florida Water Management District, West Palm Beach, FL.
Atkeson, T. and P. Parks. 2002. Chapter 2B: Mercury Monitoring, Research and Environmental Assessment. In: 2002 Everglades Consolidated Report, South Florida Water Management District, West Palm Beach, FL.
Axelrad, D.M., T.D. Atkeson, C.D. Pollman and T. Lange. 2006. Chapter 2B: Mercury Monitoring, Research and Environmental Assesment in South Florida. In: 2006 South Florida Envirnonmental Report – Volume I, South Florida Water Management District, West Palm Beach, FL.
Axelrad, D.M., T.D. Atkeson, C.D. Pollman, T. Lange, D.G. Rumbold and K. Weaver. 2005. Chapter 2B: Mercury Monitoring, Research and Environmental Assesment in South Florida. In: 2005 South Florida Envirnonmental Report – Volume I, South Florida Water Management District, West Palm Beach, FL.
Bates, A.L., W.H. Orem, J.W. Harvey and E.C. Spiker. 2002. Tracing Sources of Sulfur in the Florida Everglades. Journal of Environmental Quality, 31: 287-299.
Bechtel, T., S. Hill, N. Iricanin, K. Jacobs, C. Mo, V. Mullen, R. Pfeuffer, D. Rudnick and S. Van Horn. 1999. Chapter 4: Status of Water Quality Criteria Compliance in the Everglades Protection Area and Tributary Waters. In: 1999 Everglades Interim Report, South Florida Water Management District, West Palm Beach, FL.
Bechtel, T., S. Hill, N. Iricanin, C. Mo and S. Van Horn. 2000. Chapter 4: Status of Water Quality Criteria Compliance in the Everglades Protection Area and at Non-ECP Structures. In: 2000 Everglades Consolidated Report, South Florida Water Management District, West Palm Beach, FL.
Germain, G.J. 1998. Surface Water Quality Monitoring Network, Technical Memorandum # 356. South Florida Water Management District, West Palm Beach, FL.
Krest, J.M. and J.W. Harvey. 2003. Using Natural Distributions of Short-lived Radium Isotopes to Quantify Groundwater Discharge and Recharge. Limnology and Oceanography, 48(1): 290-298.
Orem, W.H. 2007. Sulfur Contamination in the Florida Eveglades: Initial Examination of Mitigation Strategies. U.S. Geological Survey Open-File Report 2007-1374.
Payne, G., K. Weaver, T. Bennett and F. Nearhoof. 2000. Everglades Phosphorus Criterion Development Support Document, Part 1 Water Conservation Area 2 Everglades Technical Support Section, Division of Water Resource Management, Tallahassee, FL.
Payne, G., T. Bennett, K. Weaver and F. Nearhoof. 2001 Everglades Phosphorus Criterion Development Support Document, Part 2: Water Conservation Area 1. Everglades Technical Support Section, Division of Water Resource Management, Tallahassee, FL.

Chapter 3A Volume I: The South Florida Environment
3A-58
Payne, G. and K. Weaver. 2004. Chapter 2C: Status of Phosphorus and Nitrogen in the Everglades Protection Area. In: 2004 Everglades Consolidated Report, South Florida Water Management District, West Palm Beach, FL.
Payne, G., K. Weaver and S. Xue. 2009. Chapter 3A: Status of Water Quality in the Everglades Protection Area. In: 2009 South Florida Environmental Report – Volume I, South Florida Water Management District, West Palm Beach, FL.
Payne, G., K. Weaver and S. Xue. 2008. Chapter 3C: Status of Phosphorus and Nitrogen in the Everglades Protection Area. In: 2008 South Florida Environmental Report – Volume I, South Florida Water Management District, West Palm Beach, FL.
Payne, G., K. Weaver and S. Xue. 2007. Chapter 3C: Status of Phosphorus and Nitrogen in the Everglades Protection Area. In: 2007 South Florida Environmental Report – Volume I, South Florida Water Management District, West Palm Beach, FL.
Payne, G., K. Weaver and S. Xue. 2006. Chapter 2C: Status of Phosphorus and Nitrogen in the Everglades Protection Area. In: 2006 South Florida Environmental Report – Volume I, South Florida Water Management District, West Palm Beach, FL.
Payne, G., S. Xue, K. Hallas and K. Weaver. 2010. Chapter 3A: Status of Water Quality in the Everglades Protection Area. In: 2010 South Florida Environmental Report – Volume I, South Florida Water Management District, West Palm Beach, FL.
Redfield, G. 2002. Atmospheric Deposition Phosphorus: Concepts, Constraints and Published Depostion Rates for Ecosytem Management. Technical Publication EMA #403, South Florida Water Management District, West Palm Beach, FL.
SFWMD. 2008. Field Sampling Quality Manual. SFWMD-FIELD-QM-001-04. South Florida Water Management District, West Palm Beach, FL.
USEPA. 1997. Guidelines for Preparation of the Comprehensive State Water Quality Assessments. EPA-841-B-97-003A and 002B. U.S. Environmental Protection Agency, Washington, D.C.
USEPA. 2002. Consolidated Assessment and Listing Methodology, First Edition. U.S. Environmental Protection Agency, Washington, D.C.
Weaver, K. 2004. Everglades Marsh Dissolved Oxygen Site-Specific Alternative Criterion Technical Support Document. Water Quality Standards and Special Projects Program, Division of Water Resource Management, Florida Department of Environmental Protection, Tallahassee, FL.
Weaver, K. and G. Payne. 2004. Chapter 2A: Status of Water Quality in the Everglades Protection Area. In: 2004 Everglades Consolidated Report, South Florida Water Management District, West Palm Beach, FL.
Weaver, K. and G. Payne. 2005. Chapter 2A: Status of Water Quality in the Everglades Protection Area. In: 2005 South Florida Envirnonmental Report – Volume I, South Florida Water Management District, West Palm Beach, FL.
Weaver, K. and G. Payne. 2006. Chapter 2A: Status of Water Quality in the Everglades Protection Area. In: 2006 South Florida Envirnonmental Report – Volume I, South Florida Water Management District, West Palm Beach, FL.

2011 South Florida Environmental Report Chapter 3A
3A-59
Weaver, K., G. Payne and T. Bennett. 2003. Chapter 2A: Status of Water Quality Criteria in the Everglades Protection Area. In: 2003 Everglades Consolidated Report, South Florida Water Management District, West Palm Beach, FL.
Weaver, K., G. Payne and S. Xue. 2007. Chapter 3A: Status of Water Quality in the Everglades Protection Area. In: 2007 South Florida Envirnonmental Report – Volume I, South Florida Water Management District, West Palm Beach, FL.
Weaver, K., T. Bennett, G. Payne, G. Germain, S. Hill and N. Iricanin. 2001. Chapter 4: Status of Water Quality Criteria Compliance in the Everglades Protection Area. In: 2001 Everglades Consolidated Report, South Florida Water Management District, West Palm Beach, FL.
Weaver K., T. Bennett, G. Payne, G. Germain, T. Bechtel, S. Hill and N. Iricanin. 2002. Chapter 3A: Status of Water Quality Criteria in the Everglades Protection Area. In: 2002 Everglades Consolidated Report, South Florida Water Management District, West Palm Beach, FL.