Chapter 32: BREAK EVEN. Break Even Point of Production: The level of output at which total costs...
11
Chapter 32: BREAK EVEN
-
Upload
millicent-newman -
Category
Documents
-
view
232 -
download
2
Transcript of Chapter 32: BREAK EVEN. Break Even Point of Production: The level of output at which total costs...
Chapter 32: BREAK EVEN
Break Even Point of Production: The level of output at which total costs equal total revenue
TOTAL COST = TOTAL REVENUE
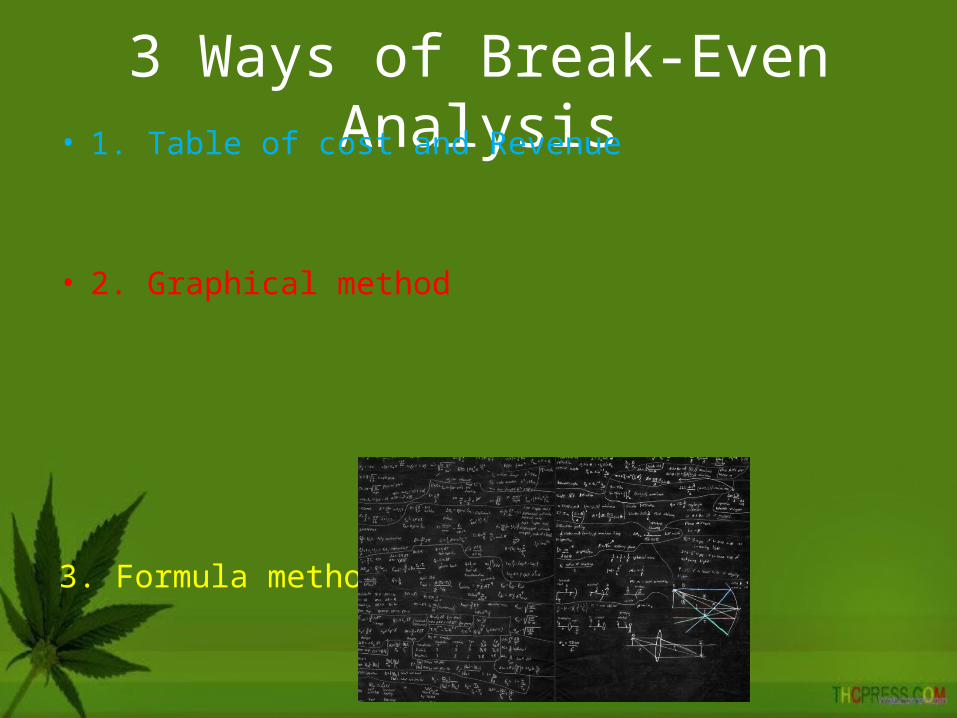
3 Ways of Break-Even Analysis• 1. Table of cost and Revenue
• 2. Graphical method
3. Formula method
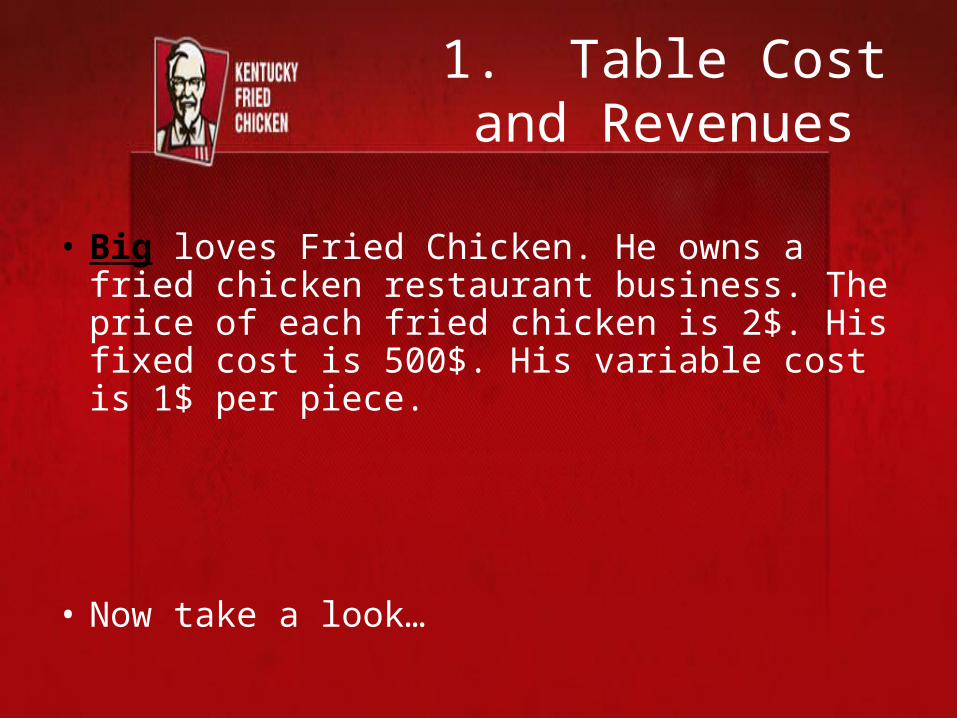
1. Table Cost and Revenues
• Big loves Fried Chicken. He owns a fried chicken restaurant business. The price of each fried chicken is 2$. His fixed cost is 500$. His variable cost is 1$ per piece.
• Now take a look…

1. Table Cost and Revenues
Quantity Fixed Cost Variable Cost Total Costs Revenue Profit/(Loss)
0 500 0 500 0 (500)100 500 100 600 200 (400)200 500 200 700 400 (300)300 500 300 800 600 (200)400 500 400 900 800 (100)500 500 500 1000 1000 0600 500 600 1100 1200 100700 500 700 1200 1400 200
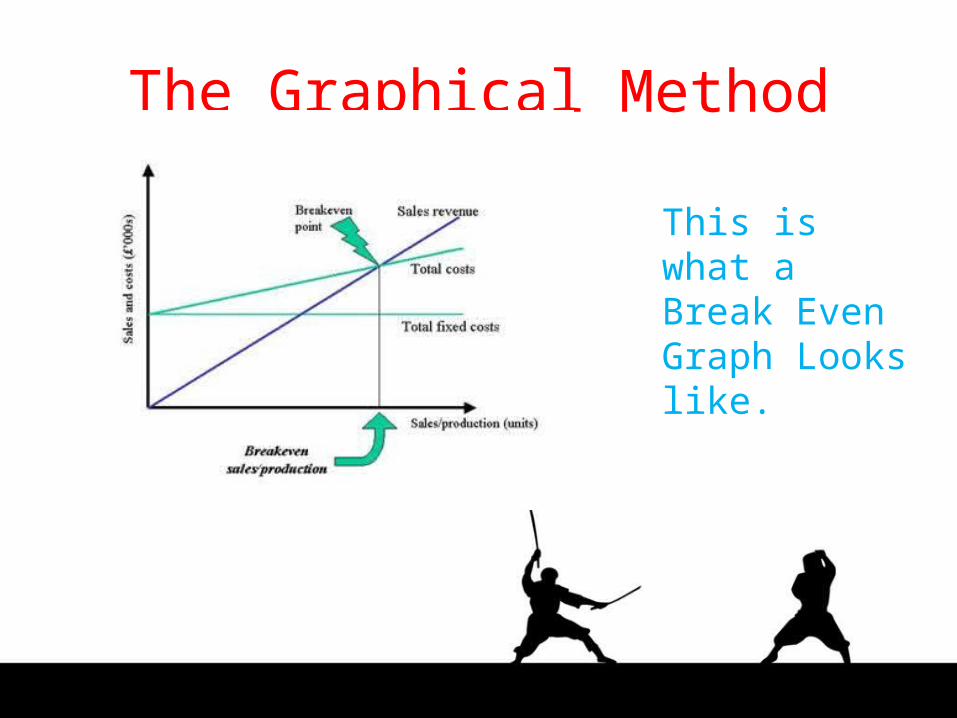
The Graphical Method
This is what a Break Even Graph Looks like.
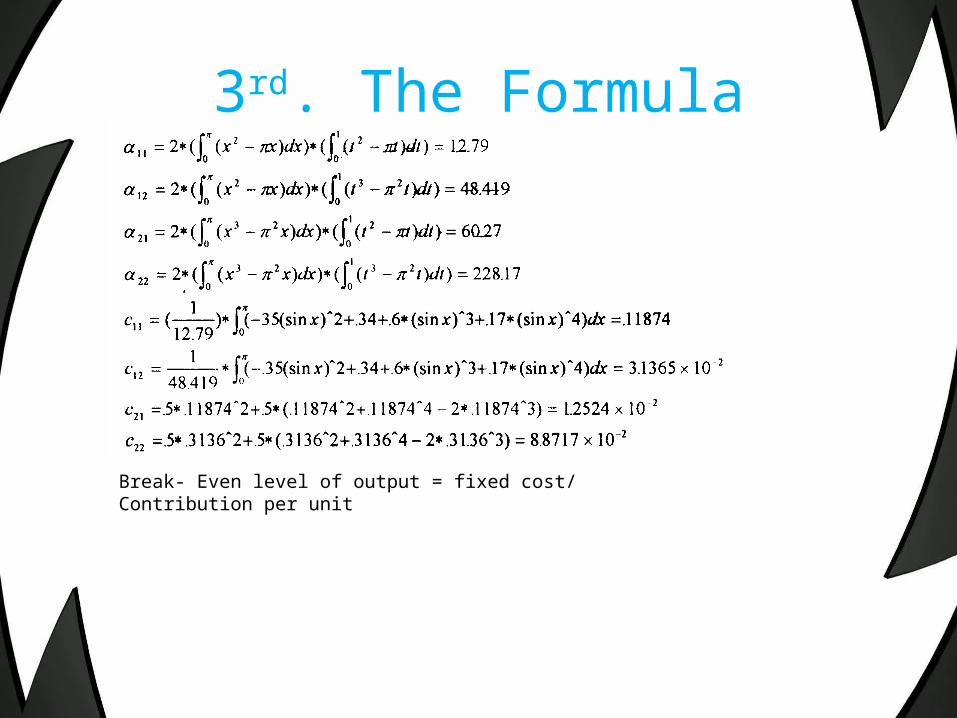
3rd. The Formula
Break- Even level of output = fixed cost/ Contribution per unit
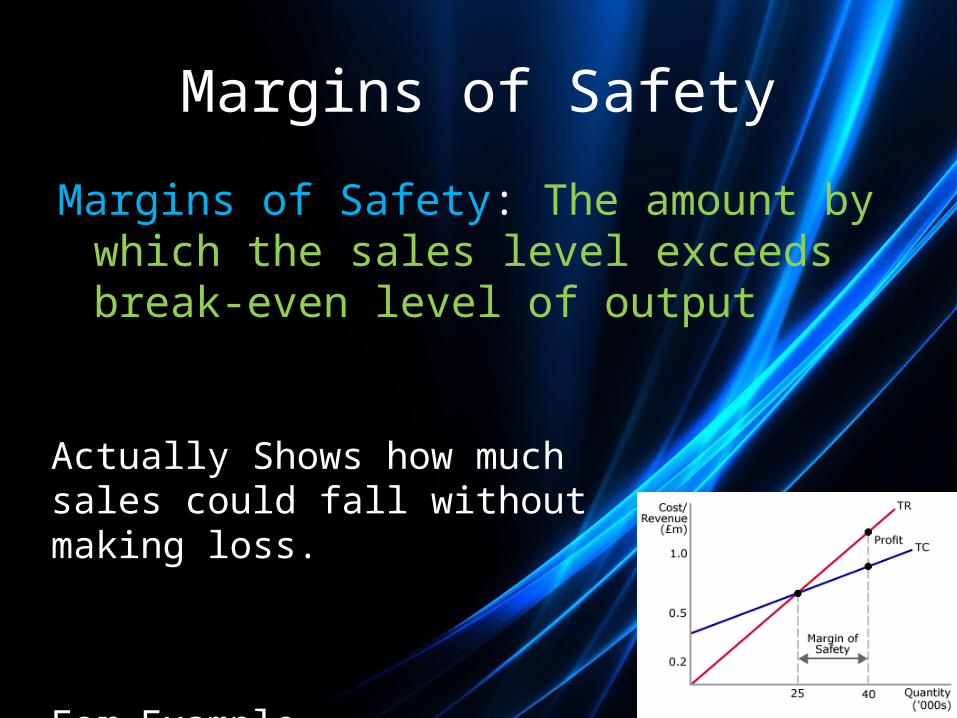
Margins of Safety
Margins of Safety: The amount by which the sales level exceeds break-even level of output
Actually Shows how much sales could fall without making loss.
For Example…
• Chris owns a Camel business. If his break even output is 400 camels, and he has 600 camels,
• Then his margin of Safety is 200 Units.
• Easy eh?
• Contribution per unit:
• Selling price of a product – Variable costs per unit.
HOMEWORK
Page 338 Activity 32.2
Not that much actually.