Chapter 3.10
4
CHAPTER 3.10 Thermodynamic Basis of Electrolysis and Electrochemistry Tetsuji Hirato Department of Energy Science and Technology, Kyoto University, Kyoto, Japan 3.10.1. ZINC ELECTROWINNING The thermodynamic basis of zinc electrowinning can be understood from the potential–pH diagram shown in Figure 1 of Chapter 3.9. In the process, the anode reac- tion is oxygen evolution, which is shown as line b in the potential–pH diagram. The reac- tion proceeds at potentials higher than line b. The cathode reaction is deposition of metal zinc, which is shown as line 1 in the potential–pH diagram because the concentration of Zn 2þ (aq) is relatively high in solutions used in this process. The reaction proceeds at potentials lower than line 1. Since this potential region is lower than line a, it is easily understood that hydrogen evolution cannot be avoided in this process. The voltage required in this process is the difference between lines b and 1. The volt- age increases with decreasing pH value, and at pH 0, a voltage of at least 1.99 V is required for progression of the zinc electrowinning process. Of course, more voltage is required to operate the real process, including overpotential of zinc deposition, and an IR drop in a circuit with an electric current. This diagram can also be used to consider the removal of Zn 2þ from waste solutions as Zn(OH) 2 . In the pH area between lines 4 and 5, the concentration of zinc in the solution can be reduced to less than 10 5 . 3.10.2. COPPER ELECTROWINNING The thermodynamic basis of copper electrorefining can be understood from the potential–pH diagram shown in Figure 3.10.1. In this process, the anode reaction is oxygen evolution, which is shown as line b in the potential–pH diagram. The reaction proceeds at potentials higher than line b. The cathode reaction is deposition of metal cop- per shown as line 1 in Figure 3.10.1. The reaction proceeds at potentials lower than line 1. The potential indicated by line 1 is higher than line a, and thus hydrogen evolution does not need to be considered in this process. The voltage required in this process is the Treatise on Process Metallurgy, Volume 1 © 2014 Elsevier Ltd. http://dx.doi.org/10.1016/B978-0-08-096986-2.00037-0 All rights reserved. 653
-
Upload
jhon-barzola-palomino -
Category
Documents
-
view
213 -
download
0
description
termodinamica basica de elctrolisis
Transcript of Chapter 3.10
CHAPTER 3.10
Thermodynamic Basis of Electrolysisand ElectrochemistryTetsuji HiratoDepartment of Energy Science and Technology, Kyoto University, Kyoto, Japan
3.10.1. ZINC ELECTROWINNING
The thermodynamic basis of zinc electrowinning can be understood from the
potential–pH diagram shown in Figure 1 of Chapter 3.9. In the process, the anode reac-
tion is oxygen evolution, which is shown as line b in the potential–pH diagram. The reac-
tion proceeds at potentials higher than line b. The cathode reaction is deposition of metal
zinc, which is shown as line 1 in the potential–pH diagram because the concentration of
Zn2þ(aq) is relatively high in solutions used in this process.
The reaction proceeds at potentials lower than line 1. Since this potential region is
lower than line a, it is easily understood that hydrogen evolution cannot be avoided
in this process.
The voltage required in this process is the difference between lines b and 1. The volt-
age increases with decreasing pH value, and at pH 0, a voltage of at least 1.99 V is required
for progression of the zinc electrowinning process. Of course, more voltage is required to
operate the real process, including overpotential of zinc deposition, and an IR drop in a
circuit with an electric current.
This diagram can also be used to consider the removal of Zn2þ fromwaste solutions as
Zn(OH)2. In the pH area between lines 4 and 5, the concentration of zinc in the solution
can be reduced to less than 10�5.
3.10.2. COPPER ELECTROWINNING
The thermodynamic basis of copper electrorefining can be understood from the
potential–pH diagram shown in Figure 3.10.1. In this process, the anode reaction is
oxygen evolution, which is shown as line b in the potential–pH diagram. The reaction
proceeds at potentials higher than line b. The cathode reaction is deposition of metal cop-
per shown as line 1 in Figure 3.10.1. The reaction proceeds at potentials lower than line
1. The potential indicated by line 1 is higher than line a, and thus hydrogen evolution
does not need to be considered in this process. The voltage required in this process is the
Treatise on Process Metallurgy, Volume 1 © 2014 Elsevier Ltd.http://dx.doi.org/10.1016/B978-0-08-096986-2.00037-0 All rights reserved. 653

Figure 3.10.1 Potential–pH diagram for the Cu–H2O system at 298 K.
654 Tetsuji Hirato
difference between lines b and 1. The voltage increases with decreasing pH value, and at
pH 0, a voltage of at least 0.899 V is required for progression of the copper electrowin-
ning process, which is much lower than that in zinc electrowinning process.
3.10.3. COPPER ELECTROREFINING
The thermodynamic basis of copper electrorefining can also be understood from
the potential–pH diagram shown in Figure 3.10.1. In this process, anode and cathode
reactions are expressed as follows:
at anode : Cu¼Cu2þþ2e
at cathode : Cu2þþ2e¼Cu
Both reactions are indicated by line 1 in Figure 3.10.1 and the required voltage is
0 from a thermodynamic understanding. More strictly, the activity of anode copper is
less than 1 because of impurities, so the voltage is a little bit more than 0.
3.10.4. ELECTROCHEMISTRY IN LEACHING
The electrochemistry in acid leaching or dissolution of copper oxides and hydrox-
ides can also be understood by the potential–pH diagram shown in Figure 3.10.1. The
dissolution reactions of copper oxides and hydroxides are as follows:
Cu OHð Þ2 sð Þþ2Hþ ¼Cu2þ aqð Þþ2H2O lð Þ ð3:10:1Þ
655Thermodynamic Basis of Electrolysis and Electrochemistry
Cu2O sð Þþ2Hþ aqð Þ¼ 2Cu2þ aqð ÞþH2O lð Þþ2e ð3:10:2ÞReactions (3.10.1) and (3.10.2) are indicated by lines 2 and 3 in the diagram, respec-
tively. Reaction (3.10.2) is a redox reaction as well as an acid–base reaction. For the dis-
solution of Cu2O to proceed, oxidant is required. When powders of Cu2O are put into
an aqueous sulfuric acid solution from which oxygen is purged, the following dispropor-
tionation reaction occurs:
Cu2O sð Þþ2Hþ aqð Þ¼Cu sð ÞþCu2þ aqð ÞþH2O lð Þ ð3:10:3ÞThe thermodynamic properties of sulfide minerals in an aqueous environment can
also be described by means of potential–pH diagrams. Such diagrams are as useful to
hydrometallurgists as are Ellingham diagrams to pyrometallurgists [1]. For example,
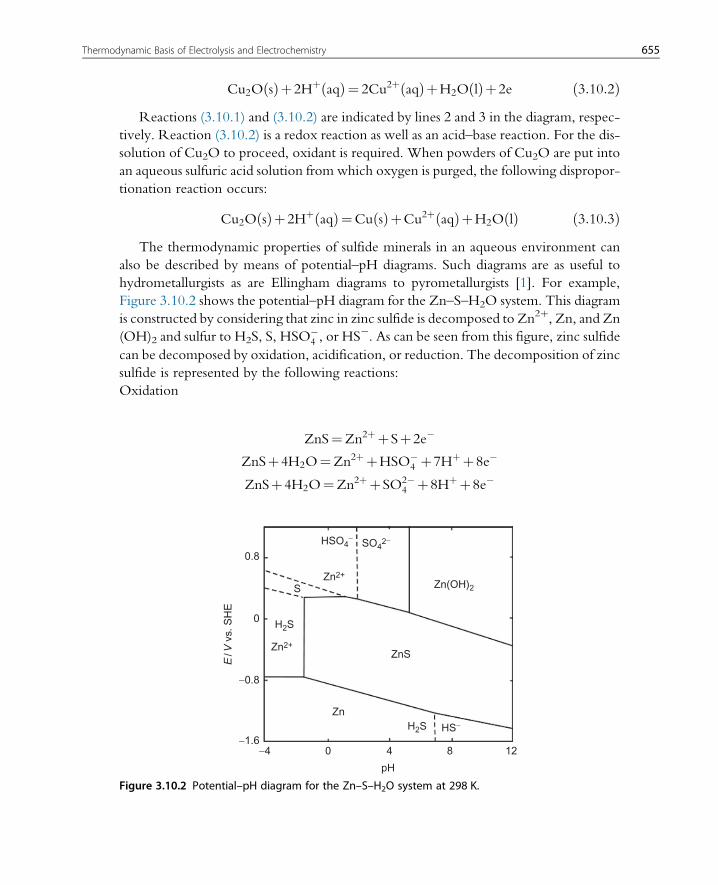
Figure 3.10.2 shows the potential–pH diagram for the Zn–S–H2O system. This diagram
is constructed by considering that zinc in zinc sulfide is decomposed to Zn2þ, Zn, and Zn(OH)2 and sulfur to H2S, S, HSO�
4 , or HS�. As can be seen from this figure, zinc sulfide
can be decomposed by oxidation, acidification, or reduction. The decomposition of zinc
sulfide is represented by the following reactions:
Oxidation
Figu
ZnS¼Zn2þþSþ2e�
ZnSþ4H2O¼Zn2þþHSO�4 þ7Hþþ8e�
ZnSþ4H2O¼Zn2þþSO2�4 þ8Hþþ8e�
ZnS
Zn(OH)2
Zn2+
SO42-HSO4
-
Zn2+
Zn
E/V
vs.
SH
E
S
0.8
0
-0.8
-1.60 4-4 8 12
pH
H2S
H2S
HS-
re 3.10.2 Potential–pH diagram for the Zn–S–H2O system at 298 K.

656 Tetsuji Hirato
Acidification
ZnSþ2Hþ ¼Zn2þþH2S
Reduction
ZnSþ2Hþþ2e� ¼ZnþH2S
ZnSþ2e� ¼ZnþS2�
In oxidative leaching, oxygen or Fe3þ is used as an oxidant. In real oxidative leaching of
sulfides, the stable area of elemental sulfur seems larger than shown in Figure 3.10.2. This
is caused by the slow reaction of oxidation from elemental sulfur to sulfate. This diagram
can also be used to consider the removal of Zn2þ fromwaste solutions as ZnS. In this case,
the activity of Zn2þ(aq) should be set at 10�6.
REFERENCES[1] E. Peters, Metall. Trans. B 7B (1976) 505–517.