CHAPTER 3: STRATEGIC AGENDA AND POLICY GUIDELINE · • Policy and legislative imperatives relevant...
132
Chapter 3: Strategic Agenda and Policy Guideline Tshwane IDP 2006 – 2011 First Revision 42 CHAPTER 3: STRATEGIC AGENDA AND POLICY GUIDELINE 3.1 INTRODUCTION One of the objectives of the Tshwane Integrated Development plan (TIDP) is to align resources and expenditure with community needs. To fulfill this role, the Municipality needs to align itself with National and Provincial directives and draw these down into the spectrum of service delivery. The new political leadership of Tshwane which was elected on 1 March 2006, put forward a Five Year Programme (5YP) to coincide with their term of office. The 5YP sets out the strategic priorities of the Municipality and forms the basis for the Municipal budget. The TIDP is primarily founded on the 5YP and translates the strategic directives emanating from this plan into departmental business plans (Chapter 4), financial plan (Chapter 5), and an operational plan (Chapter 6) for the Municipality. This chapter of the TIDP also provides an overview of the most pertinent National and Provincial Government directives which impact on Local Government service delivery, and indicates how the 5YP is aligned with these provincial and national policy directives. 3.2 KEY DETERMINANTS TO THE 5YP 3.2.1 BACKGROUND The City of Tshwane 5YP should be seen as a vehicle to develop and grow CoT into a successful city through the achievement of the vision contained in the City Development Strategy (CDS). The following pieces of legislation form the basis for the development of this 5YP: • The Constitution of the Republic of South Africa 1996; • The Municipal Systems Act (MSA) 32 of 2000; and • The Municipal Finance Management Act 56 of 2003. The CoT embarked on strategic and developmental processes to ensure that it fulfils its mandate and obligations as per the Constitution of South Africa, to: • Provide services in a sustainable manner; • Promote social and economic development; • Promote a safe and healthy environment;
-
Upload
truongdang -
Category
Documents
-
view
224 -
download
0
Transcript of CHAPTER 3: STRATEGIC AGENDA AND POLICY GUIDELINE · • Policy and legislative imperatives relevant...

Chapter 3: Strategic Agenda and Policy Guideline
Tshwane IDP 2006 – 2011 First Revision 42
CHAPTER 3: STRATEGIC AGENDA AND POLICY GUIDELINE
3.1 INTRODUCTION
One of the objectives of the Tshwane Integrated Development plan (TIDP) is to align
resources and expenditure with community needs. To fulfill this role, the Municipality
needs to align itself with National and Provincial directives and draw these down into the
spectrum of service delivery.
The new political leadership of Tshwane which was elected on 1 March 2006, put forward a
Five Year Programme (5YP) to coincide with their term of office. The 5YP sets out the
strategic priorities of the Municipality and forms the basis for the Municipal budget. The
TIDP is primarily founded on the 5YP and translates the strategic directives emanating from
this plan into departmental business plans (Chapter 4), financial plan (Chapter 5), and an
operational plan (Chapter 6) for the Municipality.
This chapter of the TIDP also provides an overview of the most pertinent National and
Provincial Government directives which impact on Local Government service delivery, and
indicates how the 5YP is aligned with these provincial and national policy directives.
3.2 KEY DETERMINANTS TO THE 5YP
3.2.1 BACKGROUND
The City of Tshwane 5YP should be seen as a vehicle to develop and grow CoT into a
successful city through the achievement of the vision contained in the City Development
Strategy (CDS). The following pieces of legislation form the basis for the development of
this 5YP:
• The Constitution of the Republic of South Africa 1996;
• The Municipal Systems Act (MSA) 32 of 2000; and
• The Municipal Finance Management Act 56 of 2003.
The CoT embarked on strategic and developmental processes to ensure that it fulfils its
mandate and obligations as per the Constitution of South Africa, to:
• Provide services in a sustainable manner;
• Promote social and economic development;
• Promote a safe and healthy environment;

Chapter 3: Strategic Agenda and Policy Guideline
Tshwane IDP 2006 – 2011 First Revision 43
• Give priority to the basic needs of communities; and
• Encourage the involvement of communities in the matters of local government.
In line with the MSA, this plan constitutes the single, inclusive and strategic plan of the
CoT, aligned with the five year term of office of the newly elected political leadership.
Hence, all previous plans and programmes will be accordingly aligned and reviewed, in line
with this 5YP.
As part of the compilation of the 5YP, an assessment was undertaken in which:
• Policy and legislative imperatives relevant to Tshwane were assessed; and
• The social and economic landscape impacting on the City, and the resultant
community needs, were analysed.
Following is a summary of the key environmental issues and directives identified for
consideration in the development of the 5YP for the CoT.
3.2.2 POLICY AND LEGISLATIVE IMPERATIVES
3.2.2.1 NATIONAL 2014 VISION
As part of South Africa’s celebration of 10 years of democracy, National Government
formulated Vision 2014 to guide itself for the next ten years. The vision is to build a society
that is truly united, non-racial, non-sexist and democratic. Central to this is a single and
integrated economy that benefits all.
The combination of some of the most important targets and objectives making up Vision
2014 are as follows:
• Reduce unemployment by half through new jobs, skills development, assistance to
small businesses, opportunities for self-employment and sustainable community
livelihoods.
• Reduce poverty by half through economic development, comprehensive social
security, land reform and improved household and community assets.
• Provide the skills required by the economy, build capacity and provide resources
across society to encourage self-employment with an education system that is geared
for productive work, good citizenship and a caring society.

Chapter 3: Strategic Agenda and Policy Guideline
Tshwane IDP 2006 – 2011 First Revision 44
• Ensure that all South Africans, including especially the poor and those at risk –
children youth, women, the aged and people with disabilities – are fully able to
exercise their constitutional rights and enjoy the full dignity of freedom.
• Compassionate government service to the people: national, provincial and local public
representatives who are accessible; and citizens who know their rights and insist on
fair treatment and efficient service.
• Massively reduce health risks such as tuberculoses, diabetes, malnutrition and
maternal deaths and turn the tide against HIV and AIDS, and, working with the rest
of Southern Africa, strive to eliminate malaria, and improve services to achieve a
better national health profile and reduction of preventable causes of death, including
violent crime and road accidents.
• Significantly reduce the number of serious and priority crimes as well as cases
awaiting trial, with a society that actively challenges crime and corruption, and with
programmes that also address the social roots of criminality.
• Position South Africa strategically as an effective force in global relations, with vibrant
and balanced trade and other relations with countries of the South and the North,
and in an Africa that is growing, prospering and benefiting all Africans, especially the
poor.
Vision 2014 translates into practical steps, with the following specific implications for the
City of Tshwane:
• A growing economy.
• Sustainable livelihoods – inter alia creating job opportunities through the Expanded
Public Works Programme (EPWP).
• Access to services:
o Speed up programmes to provide water and sanitation, electricity and
telephone services.
o Build more subsidised housing.
o Improve services in health facilities.
o Ensure that all children have decent educational facilities and services.
o Realise Batho Pele principles and improve services in government offices.
• Comprehensive Social Security.
• Crime and corruption – enhance visible policing.
• Constitutional rights and governance – improve interaction between government and
the people.

Chapter 3: Strategic Agenda and Policy Guideline
Tshwane IDP 2006 – 2011 First Revision 45
It is imperative for the CoT to direct its strategic objectives and activities towards achieving
this vision.
3.2.2.2 ACCELERATED AND SHARED GROWTH INITIATIVE- SOUTH AFRICA (ASGISA)
ASGISA focuses on growing the economy and creating jobs, and states that growth should
be government-led. National growth since 2004 has averaged 4%; however, the second
economy has been excluded from growth except through remittances and social grants.
ASGISA identifies six key levers for economic growth, namely:
• Macro-eco intervention;
• Infrastructure development;
• Skills development;
• Strengthening public institutions;
• Sectoral investments; and
• Interventions in second economy.
Strategies for growth and development include investment in transport infrastructure,
support to SMME’s and labour intensive projects, prioritizing social and economic
infrastructure and building partnerships.
Targets set by ASGISA include:
• Halving poverty by 2014, to 1/6 of households
• Halving unemployment by 2014 from 30%
• Achieving growth of approximately 6% per annum
• 50% of the total to be spent on infrastructure should be spent by the three spheres
of government.
CoT considerations:
• CoT must know its poverty and unemployment baselines as a matter of urgency in
order to implement relevant strategies that impact on poverty and the second
economy;
• There should be an in-depth understanding of the nature of our economy; including
sectoral and other strengths and the risks and potential for economic vulnerability;

Chapter 3: Strategic Agenda and Policy Guideline
Tshwane IDP 2006 – 2011 First Revision 46
• CoT should be able to identify the key drivers for economic growth, unemployment
reduction and poverty reduction, in line with the function and mandates of local
government (things that we are in control of).
• CoT should develop and implement relevant strategies and programmes to contribute
towards the ASGISA targets that are based on our core business, develops the second
economy and minimizes the risks to our economy (minimizes our vulnerability to
economic shock).
3.2.2.3 THE ANC MANIFESTO
The ANC manifesto emphasises growing the economy, fighting poverty, creating jobs,
building roads, rail networks and dams, building better quality houses closer to economic
opportunities, providing skills required by the economy, being a compassionate government
to the people, improving services for a better national health profile, and reducing
preventable causes of death (violent crime and road accidents).
Similar to ASGISA, the halving of poverty is a critical target in the manifesto.
CoT considerations:
• Identify the skills required for the growth of the Tshwane economy and facilitate the
development of such skills;
• Identify economic opportunities and develop them;
• Re-assess housing provision to ensure innovative solutions that allow for people to be
located close to economic opportunities;
• Ensure accountability to our residents and actively engage them in the affairs of
government. We should be capable of objectively measuring this accountability;
• Identify the various mechanisms through which health services will be provided and
funded, especially where certain aspects of health care provision fall outside the
mandate of local government; and
• Identify and manage the preventable causes of death in line with the mandate of
local government and things that are within our control as CoT. The reduction of the
preventable causes of death should be objectively measurable, and this requires
careful monitoring and tracking of all initiatives.
• Ensure that those things that fall outside of our direct Constitutional mandate are still
delivered through cooperative governance and inter-governmental relations.

Chapter 3: Strategic Agenda and Policy Guideline
Tshwane IDP 2006 – 2011 First Revision 47
3.2.2.4 NATIONAL SPATIAL DEVELOPMENT PERSPECTIVE
Government is committed to economic growth, employment creation, sustainable service
delivery, poverty alleviation programmes and the eradication of historic inequalities. In
order to ensure that infrastructure investment and development programmes are
channelled towards these objectives, the National Spatial Development Perspective (NSDP)
was formulated. The principles enshrined in the NSDP are thus of great importance to local
government investment, through the IDP and capital expenditure.
The National Spatial Development Vision is as follows:
South Africa will become a nation in which investment in infrastructure and development programmes support government’s growth and development objectives:
• By focusing economic growth and employment creation in areas where this is most
effective and sustainable;
• By supporting restructuring where feasible to ensure greater competitiveness;
• By fostering development on the basis of local potential; and
• By ensuring that development institutions are able to provide basic needs throughout
the country.
The following normative principles are put forward as guide for all spheres of government
when making decisions on infrastructure investment and development spending:
• Economic growth is a prerequisite for the achievement of other policy objectives, key
among which would be poverty alleviation.
• Government spending on fixed investment, beyond the constitutional obligation to
provide basic services to all citizens, should therefore be focused on localities of
economic growth and/or economic potential in order to attract private sector
investment, stimulate sustainable economic activities and/or create long-term
employment opportunities.
• Efforts to address past and current social inequalities should focus on people not
places.
• In order to overcome the spatial distortions of apartheid, future settlement and
economic development opportunities should be channelled into activity corridors and
nodes that are adjacent to or link the main growth centres. Infrastructure investment
and development spending should primarily support localities that will become major

Chapter 3: Strategic Agenda and Policy Guideline
Tshwane IDP 2006 – 2011 First Revision 48
growth nodes in South Africa and the Southern African Development community
region to create regional gateways to the global economy.
The NSDP thus seeks to focus the bulk of fixed investment of government on those areas
with the potential for sustainable economic development, as it is in these areas where
government’s objectives of promoting economic growth and alleviating poverty will best be
achieved.
3.2.2.5 GAUTENG GROWTH AND DEVELOPMENT STRATEGY
The GDS is an action-orientated strategy intended to build a sense of provincial unity and
responsibility amongst all sectors of society towards reducing poverty and unemployment,
creating jobs and ensuring socio-economic transformation in the Province. It provides a
practical framework to substantially raise the Province’s growth rate and create substantial
numbers of sustainable jobs over the next decade. It supports the Province’s and the
country’s long term vision of human rights based, just, equitable and fair society in an
established democracy.
The vision of the GDS is to ultimately create a better life for all citizens, including the Continent, through:
• Long term, sustainable growth of the provincial economy;
• Meeting the socio-economic development needs of our people;
• Creating jobs, and
• Reducing unemployment and poverty.
The GDS reflects six strategic objectives towards achieving this vision, namely:
• Provision of social and economic infrastructure and services that will build sustainable
communities and contribute to halving poverty;
• Accelerated labour absorbing economic growth that increases per annum and that will
create long-term sustainable jobs and contribute to halving unemployment;
• Sustainable socio-economic development;
• Enhanced government efficiency and cooperative governance;
• Deepening participatory democracy, provincial and national unity and citizenship; and
• Contributing to the successful achievement of NEPAD’s (New Partnership for African
Development) goals and objectives.

Chapter 3: Strategic Agenda and Policy Guideline
Tshwane IDP 2006 – 2011 First Revision 49
The following are the strategic levers proposed to enact the GDS:
• Provision of an accessible, affordable, reliable, integrated and environmentally
sustainable public transport system;
• Gautrain;
• Provision of housing;
• Public safety and urban information system;
• 2010 Football World Cup;
• Public health services;
• Human resource development;
• Small Medium Micro Enterprise (SMME) Support;
• Broad Based Black Economic Empowerment (BBBEE);
• Social development;
• Government institutional efficiencies; and
• NEPAD.
The following aspects are emphasised in terms of these levers:
• Realigning the manufacturing sector.
• Broadening business activity; and
• Promoting financial and business services.
The following provincial priority areas for setting targets and indicators were
identified, which are specifically important in terms of the IDP process and performance
monitoring:
Table 3.1: Priority Areas for Setting Targets and Indicators
Target Area Current Baseline 10 Year Goal (2014) Economic growth 5% 8% Increase employment 25.7% 12.8% Job creation 1.7 million unemployed
people 800 000
Skills development and capacity building
No baseline figure 100 000 people trained
SMME support No baseline figure 30 000 BBBEE No baseline figure 80% of procurement spent NEPAD No baseline figure • 10 twinning agreements
• 10 exchange visits • 10 partnerships established –
resulting in increased trade volumes

Chapter 3: Strategic Agenda and Policy Guideline
Tshwane IDP 2006 – 2011 First Revision 50
Considering the City of Tshwane constitutes approximately 25% of the provincial
population, the CoT should aim to contribute at least 25% towards these targets.
CoT considerations:
• Identify whether Gauteng’s strategy to re-align the manufacturing sector will impact
on our sector strategies for CoT, and take the necessary steps to address this and
minimize shocks to our economy;
• Identify our current strengths and manage the risks associated with things that may
change as a result of provincial implementation of the growth and development
strategy. For example, should the motor industry be incentivised to re-locate, what
could the state of the Tshwane economy be?
• Identify opportunities and synergies to tap into at a provincial level in terms of
assistance with local economic development, business development and the access to
financial services. It is critical that we do not duplicate what Province does, and that
we access the relevant resources and assistance in implementing complementary
growth and development strategies that work for Tshwane; and
• Identify our levers for growth and set clear targets for the achievement of those
things that are within our control, thereby avoiding the trap of setting growth targets
that cannot be controlled, measured or achieved.
• Identify the risks of too high growth such as in-migration, and the impact it will have
on the demand for social services, economic stability, and sustainable growth, and
managing the risks accordingly.
3.2.2.6 GOVERNMENT’S MEDIUM TERM STRATEGIC FRAMEWORK
The medium term financial strategy of government has two references to growing the
economy and the provision of social security support to all who are eligible. Further, there
is a perspective that the IDP (Integrated Development Plan) of local government should be
the local expression of national development plans. The National Planning framework
establishes timeframes within which local government should conduct its strategic planning
and budgeting.
The government-wide monitoring and evaluation system establishes specific indices for
government. National Government intends to roll-out the government-wide monitoring and
evaluation system to all government bodies from April 2007. At a national level,
infrastructure is collapsed into economic development and social development, and is not

Chapter 3: Strategic Agenda and Policy Guideline
Tshwane IDP 2006 – 2011 First Revision 51
measured separately. This means that infrastructure provision is seen as a means to
achieving social and economic growth and development. Further, there is emphasis on
measuring impact and a government level, and not inputs and outputs as has been the
case previously. The national indicators for 2005-2014 (which are in effect indices)
measure government performance, and are focused on indicators that relate to governance
and institutional quality, social development and poverty alleviation, economic development
and growth, justice, peace and security, and international relations. Some of these cannot
be measured at a local government level, as they do not fall within our mandate.
The national indicators for 2005-2014 are below. These are in addition to the National Key
Performance Indicators (NKPI’s), which are drivers of the achievement of government’s
programmes. The NKPI’s are:
• The percentage of households with access to basic level of water, sanitation,
electricity, solid waste removal;
• The percentage of households earning less than R1100 per month with access to free
basic services, water, sanitation, electricity and solid waster removal;
• The percentage of a municipality’s capital budget actually spent on capital project
identified for a particular financial year in terms of the municipality’s integrated
development plan;
• The number of jobs created through the municipality’s local economic development
initiatives including capital projects;
• The number of people from the employment equity target groups employed in the
three highest levels of management in compliance with the municipality’s approved
employment equity plan, short term employment, and long term employment.
• The percentage of the municipality’s budget actually spent on implementing the
workplace skills plan; and
• Financial viability, bank balances, investments, outstanding debtors to revenue,
creditor payments, credit rating, external loans, aggregate for bad debts.

Chapter 3: Strategic Agenda and Policy Guideline
Tshwane IDP 2006 – 2011 First Revision 52
Table 3.2: National indicators for 2005-20141 Area Indicators/indices
Governance
indicators
• The process by which those in authority are selected, affirmed and replaced (voice and
accountability, political stability and absence of violence)
• The capacity of government to formulate and implement policies (government
effectiveness, regulatory quality and the predictability of policy making)
• The respect of residents and state for institutions that govern interactions among them
(Rule of law, control of corruption/severity of corruption; bureaucratic efficiency).
Economic
indicators
• Current growth (how well the economy is currently growing)
• Sustainable growth (the likelihood that the growth will be sustained or even accelerated)
• Economic stability (vulnerability to economic problems)
• Economic governance
• Future competitiveness (future potential of the economy to grow and spread its benefits)
• Employment and unemployment
Social
indicators
• Health and food security (efforts to maintain and improve the nutritional health of the
population)
• Housing and basic services (access to housing/shelter, water, sanitation, electricity)
• Human resource development (from the education system of indicators point of view)
• Social Cohesion (includes groups and networks, trust and solidarity, collective action and
cooperation, information and communication, inclusivity, empowerment and political
action)
• Poverty and inequality (includes Gini-coefficient and human poverty index)
• Human development (as measured by the human development index)
Justice, crime
prevention
and security
indicators
• Public safety (internal safety and security and covers broad based policy indicators such
as reducing the levels of crime, reducing public fear of crime and increased access to
justice)
• National security (the external thread and security of the state, and includes increased
territorial integrity and increased stability and good governance within the region and
Africa)
International
relations
indicators
• Bilateral political and economic relations
• International organisations and multi-lateralism
• Peace, security and stability
• Global economic integration
• African renaissance
3.2.2.7 NATIONAL GOVERNMENT’S PROGRAMME FOR DEVELOPMENT
This initiative highlights critical areas of work that directly impact on the CoT core business,
and the City’s interpretation of national imperatives. It is critical that the CoT gets to
know the details of the initiatives and tap into the opportunities that present themselves
either through funds, investment incentives and locational quotient. There are risks that
may surface, and the only way to manage that is to know the details of the initiatives.
1 In addition to the NKPI’s

Chapter 3: Strategic Agenda and Policy Guideline
Tshwane IDP 2006 – 2011 First Revision 53
CoT considerations: • National government expects there to be enhanced capacity within the Mayoral office
to play an oversight role in terms of the implementation of the government-wide
monitoring and evaluation system;
• CoT will have to work within the guidelines and recommendations of the national
planning framework;
• Manage the risks around the IDP being viewed as a plan that is the local expression
of national plans. Explore the opportunities for engagement and for accessing
resources of the national and provincial spheres in order to deliver on the local
developmental agenda expressed in the IDP;
• Focus on measuring the impact of our engagement with our residents at a CoT level
(measuring the achievement of the customer value proposition/strategic priorities).
This requires a clear understanding of the drivers of outcomes and impact. Input
measures (such as amount of capital budget spent) should be measured at the
operational levels of the organisation. At a CoT the impact of expenditure on the
community should be measured.
• Establish integrated systems that link the City strategic plan to programmes, projects,
human resources and the budget. This requires a fundamental transformation of the
way in which we budget (according to function/department) towards budgeting by
strategic objectives, strategies and indicators.
• In order to measure value for money the city will have to investigate whether the
manner in which it delivers services is optimal, and to measure the human resources
cost towards delivering a service to the community (efficiency).
• This will mean a change in the way we use our human resources. The drive should
be away from permanent structures towards fluid structures that make the relevant
skills and competencies available for the implementation of the CoT priorities over
time.
3.2.2.8 ENVIRONMENTAL FISCAL REFORM POLICY PAPER
Even though this currently forms a list of proposals that are promise to be investigated
further, this paper which was released by the National Treasury proposes the following:
• Higher taxes on coal-derived electricity;
• Higher taxes on dirty transport fuels;

Chapter 3: Strategic Agenda and Policy Guideline
Tshwane IDP 2006 – 2011 First Revision 54
• New taxes on waste water discharge. This is based on progressive rates for pollution
loads exceeding certain water quality management targets;
• Taxes on products such as batteries, tyres and fluorescent lights;
• Higher license fees for vehicles without catalytic converters;
• Providing incentives to businesses for using certain preferred disposal methods;
• Deeper investigation of the electricity taxes to recoup the R1.4 billion surplus
generated by municipalities that act as electricity distributors, by either:
o Formalising and restructuring this tax on electricity distribution at national level
and including the 130 large industrial users (supplied directly by ESKOM); or
o Imposing a fuel input tax on the use of coal to generate electricity (exclude
energy forms such as solar or wind)
CoT considerations: • CoT should identify the risks and benefits for the institution should the green taxes be
implemented, and take the necessary steps to mitigate the risks. For example, a fuel
input tax could raise the cost of electricity, and hence the costs of distribution to the
consumer. This could impact on incentives offered to business, as well as the
provision of basic services to communities.
• Actively develop non-conventional forms of energy generation, such as solar and wind
generated energy.
• Ensure that CoT waste water discharges meet all national and provincial water quality
standards and targets.
• Prepare the CoT fleet to meet cleaner fuel targets, and investigate alternate fleet
options.
• Develop alternate waste disposal opportunities in CoT as an incentive to business
investment in the city.
3.2.2.9 SYNTHESIS: POLICY IMPERATIVES
The National 2014 Vision, National Spatial Development Perspective and Gauteng Growth
and Development Strategy have the following collective objectives, namely a commitment
towards economic growth, employment creation, sustainable service delivery, poverty alleviation programmes and the eradication of historic inequalities.

Chapter 3: Strategic Agenda and Policy Guideline
Tshwane IDP 2006 – 2011 First Revision 55
The City of Tshwane should focus its efforts to support National and Provincial Government
to accomplish the above. The Strategic Levers emanating from these initiatives should
reflect in the CoT’s activities and expenditure and the CoT should actively work towards
achieving the targets set out at national and provincial level.
3.2.3 ECONOMIC ISSUES
In 2003 the economically active population (EAP2) totalled 48 % of the total population of
Tshwane. The EAP grew by 220 000 between 1996 and 2002, with only a 180 000
increase in job opportunities. This is an indication that not all employment seekers could
be absorbed despite the growth in opportunities. In the same period informal sector
employment doubled from 43000 to 98 000.
Unemployment in 2002 was estimated to be 18.93%3, with unemployment rate amongst
the youth (20-24 years) at 53.2%. Further, unemployment was spatially referenced, with
the larger proportion of the unemployed from areas in the North of Tshwane, such as
Soshanguve and Temba.
Since 2000, the average monthly income of people who are employed is estimated to have
increased, however, with the warning that the gap between the highest paid person and
the lowest paid (Gini Co-efficient) was projected to increase.
In-migration to Tshwane was at 256 239 for 2001, and was largely from North West,
Limpopo and Mpumalanga. This has implications for demand on services and the ability of
the growing economy to absorb growing pools of labour.
The city has a spatially and sectorally diverse economy. The tertiary sector contributes
more than 80% to the local economy. The community and financial services sectors are
the largest contributors to value added in Tshwane, followed by the transport,
manufacturing and retail trade sectors.
Backlogs:
• Trade licenses: none
• Informal trade stalls: 1200
2 People who are working and/ or actively looking for work 3 Strict unemployment. In terms of the expanded definition of unemployment, Tshwane sits close to 30% unemployment.

Chapter 3: Strategic Agenda and Policy Guideline
Tshwane IDP 2006 – 2011 First Revision 56
CoT considerations: • Identify other sectors that have potential and implement strategies to develop such
potential, to minimize risks from reliance on 1 or 2 sectors as currently. This for
example might mean implementing strategies to increase tourist volumes and spend
in CoT.
• Know the rate of in-migration and ensure that service delivery strategies take the
additional growth into consideration. The long term financial strategy should ensure
viability of the City to sustainably provide services.
• Implement economic development strategies that are target group specific such as
the youth
• Implement strategies that aim at increasing the monthly income of households, and
hence the affordability of services
• Implement job creation strategies with partners to ensure sustainable job creation
• Identify and build the relevant skills with partners that are required by the economy
3.2.4 SOCIAL ISSUES 4
The population of Tshwane was estimated to be 2 193 596 in 2004. This totalled
approximately 593 652 households. Of this approximately 73% is Black, 51% female and
3.4% disabled. The percentage of HIV+ people was estimated to grow to 15,3 % of the
population by 2010 (based on a worst case scenario with no interventions). Based on this,
there were projections that there would be approximately 64 000 maternal AIDS orphans5
under the age of 15 in Tshwane by 2010.
15.3% of households had no income in 2001, as compared to 6.7% in 1996. The
percentage of female headed households was 35.8% (2001) as opposed to 29.9% in 1996.
29.1% of the population of Tshwane lived in poverty in 2001. By 2004, the average
monthly account for municipal services was approximately R400. This means that the
household income should have averaged R2300 for the municipal services to be affordable.
The Human Development Index (HDI) is a combination of three important measures;
namely, life expectancy, adult literacy and standard of living. By 2002, the HDI6 of
Tshwane was at 0.757 .
4 Tshwane metropolitan profile 2004 5 A person under 18 years of age whose mother has died of AIDS 6 HDI of 1 indicates the highest level of human development, with 0 indicating the lowest. 7 SACN State of the Cities Report 2004

Chapter 3: Strategic Agenda and Policy Guideline
Tshwane IDP 2006 – 2011 First Revision 57
In the northern areas of Tshwane, 33% of people live in informal dwellings, 58% have
access to sanitation and 68% have access to electricity. In 2002, 20.77% of households
were without formal shelter, 15.58% without on-site water. In 2004 24.81% of
households did not have adequate accommodation.
Backlogs:
• 240 969 informal dwelling units that should be formalized where possible.
• National housing backlog eradication target 2014
• Annual shortfall of R10.5M in maintaining public transport facilities
• R350m backlog in the construction of public transport facilities.
• Approximately 50% of roads in CoT require stormwater drainage systems, most of
which fall in the Northern areas.
• 25.6% of the total bulk water purchased is unaccounted for.
• 28 869 households without access to basic water8
• 96 426 households without access to basic sanitation9 level of service.
• Provincial target is to eradicate bucket system by 2007.
• National target: eradication of water backlogs by 2008 and sanitation backlogs by
2010
• All houses to have access to electricity by 2012
• 2340KM of road to be tarred
• Infrastructure maintenance backlogs of R440M- should be 10-12% of the operating
budget
• % of collections of revenue as against amount billed should be 95-97%- in 2002
Tshwane was at 97%
• National treasury target of CAPEX spending to reach 99% of budget
• While increasing service delivery CoT has to reduce its personnel costs to 28% of the
operating budget in 3 years.
CoT considerations: • A critical risk to the achievement of the reduction of backlogs and achievement of
development in Tshwane is the limitations on revenue. This in addition with the
reduced equitable share increases the burden on CoT to deliver on increasing
8 Communal standpipe less than 200m walking distance 9 Ventilated improved pit latrine

Chapter 3: Strategic Agenda and Policy Guideline
Tshwane IDP 2006 – 2011 First Revision 58
backlogs and service needs. Revenue growth strategies will have to be implemented
urgently (within the confines of the MFMA). Further, strategic partnerships should be
embarked upon to access assistance without necessarily the transfer of funds, as well
as a re-assessment of the investment instruments and strategies of the CoT.
• In terms of electricity, the mandate of Local Government is reticulation. Currently
Tshwane generates, transmits, distributes and reticulates. There might be financial
implications for us only delivering on the mandate, and this needs to fully costed.
• Implement strategies that improve gender equality to improve our state of human
development
• Eradicate all service delivery backlogs within national targets.
• Ensure that residents receive value for money: quality, affordable, functional
services. This means increasing our internal efficiencies, to reduce the internal costs
to deliver a service.
• Implement strategies that address the issue of HIV in the community, especially the
cost of HIV on the household budget.
• Implement community development strategies that improve access to social facilities
and amenities.
• Implement strategies that improve community safety and cohesion.
• Engage with the residents to ensure that we are responsive to their needs, and allow
for citizen participation in assessing the effectiveness of the CoT.
3.2.5 CITY OF TSHWANE 5YP
This section comprises the City of Tshwane 5YP which was compiled in response to the
community needs as reflected in section 2.2 and the key determinants highlighted in
section 3.2.2 above.
Vision and Mission
Mission
To enhance the quality of life of all the people in the City of Tshwane through a
developmental system of local government and by rendering efficient, effective and
affordable services.
Vision
To establish Tshwane as the leading African capital city of excellence that empowers the
community to prosper in a safe and healthy environment.

Chapter 3: Strategic Agenda and Policy Guideline
Tshwane IDP 2006 – 2011 First Revision 59
Core Values and Operating Principles
• Deliver on the mandate of the people of Tshwane;
• Ensure continuity and make changes by reviewing and aligning where necessary to
achieve delivery;
• Achieve state- led development through an effective intergovernmental relations
system (IGR);
• Drive integrated development;
• Ensure transparency and accountability;
• Provide quality service delivery and implement Batho Pele;
• Build institutional capacity and achieve transformation;
• Develop strategic partnerships;
• Achieve people-centred development; and
• Use e-governance as a means to make government accessible to the people.
The strategic priorities of the CoT are expressed in detail below. The prioritised strategic
objectives replaced the previous city priorities & city scorecard, and drive departmental
delivery as reflected in the departmental business plans contained in chapter 4 of the IDP.
Certain KPAs as indicated below will be directly measured on a departmental level.
Strategic Objectives, Key Performance Areas and Departmental Targets
The table below highlights the detailed City Business Plan. It consists of 34 key targets
and indicators. KPAs are listed together with departmental indicators and targets.

Chapter 3: Strategic Agenda and Policy Guideline
Tshwane IDP 2006 – 2011 First Revision 60
Detailed City Business Plan
Strategic Objectives and KPA’s
Strategic Objective KPA KPI Targets
1.1 Eradication/ reduction of
infrastructure backlogs
The percentage of households with access to basic
levels of (water, sanitation, electricity, solid waste
removal), roads, Storm-water and housing
Eradicate basic services backlogs equal to or earlier than
national targets
1.2 Provide quality infrastructure
for growth
Provision of infrastructure per type as a proportion
to new demand/ need (growth)
Provide infrastructure that meets growth demands and
prevent the creation of new backlogs
1.3 Ensure maintenance of
existing infrastructure
% expenditure on infrastructure (R) Expenditure on infrastructure maintenance is in line with
national norms and standards by 2011
1
Provide quality basic
services and
infrastructure
1.4
Prevent resource losses
% unaccounted for water and electricity % unaccounted for water and electricity losses to be in
line with internationally accepted benchmarks by 2011
2
Accelerate higher and
shared economic
growth and
development
2.1Leverage growing and
strategic sectors in the City in a
way that optimises investment
opportunities and focus on
establishing an integrated
economy
i) the nr or COT LED initiatives (incl. capital
projects) that focus on strategic and growing
sectors as a proportion of the total
ii) % growth of GVA per annum of the City
iii) Decrease in the Gini co-efficient
i) All COT LED initiatives should focus on growing and
strategic sectors by 2008
ii) 6% growth in the COT GVA
iii) Decrease in the Gini co-efficient by 0.1 pa
2.2 Invest in economic
infrastructure and a transport
system that promotes greater
efficiency regarding logistics, and
Hrs in the day travelled between home and work
Reduce time to travel between homes and work in line
with Gauteng province targets and in partnership with
key roleplayers

Chapter 3: Strategic Agenda and Policy Guideline
Tshwane IDP 2006 – 2011 First Revision 61
Strategic Objective KPA KPI Targets
optimise productivity of human
capital by reducing travelling time
between home and work
2
Accelerate higher and
shared economic
growth and
development
2.3 Regeneration and
development of potentially viable
economic nodes focusing on the
inner city and targeted areas
based on efficient land use
% of inner city regeneration compared to the total
need in terms of:
a) businesses
b) open space
c) social infrastructure
d) economic infrastructure
e) historical buildings
80% of needs in terms of regeneration of the inner city
achieved by 2011, in terms of:
a) businesses,
b) open space
c) social infrastructure
d) economic infrastructure
e) historical buildings10
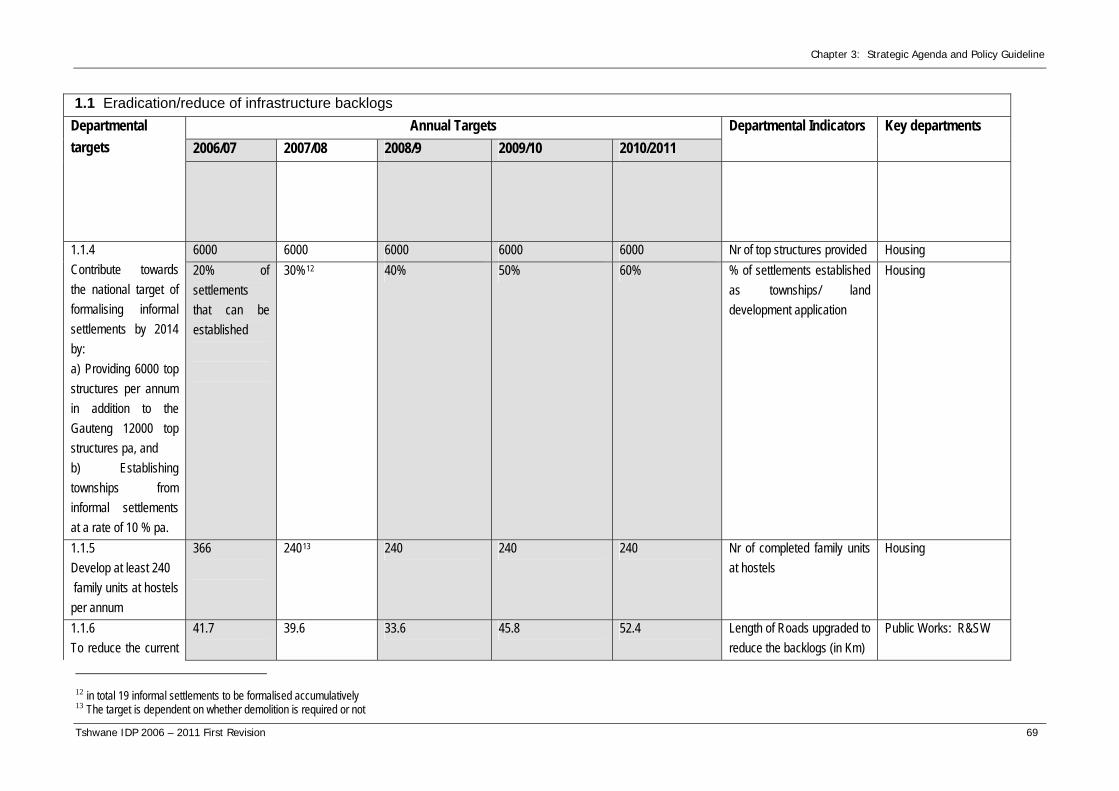
2.5
Increase participation and
broaden the contribution in
growing the city’s economy
through the development of
SMME’s, cooperatives, the
informal sector and the role of
black people, women and youth
Nr of SMME’s and/or cooperatives that empower
black people, women and youth, supported and
developed
At least 8000 SMME’s and/or cooperatives by 2011, of
which 75% are to be black person/women/youth owned
2
Accelerate higher and
shared economic
growth and
2.7
Establish strategic partnerships to
ensure a focussed common vision
and good economic governance
i) Rand value of investment in Tshwane as a direct
result of strategic partnerships
ii) % of businesses in Tshwane that indicates the
COT’s efforts to create an enabling business
i) Achieve at least R300M of investment in Tshwane as a
result of strategic partnerships
ii) 80% of businesses indicates satisfaction with the
COT’s efforts to create an enabling business environment
10 Capital Theatre, Palace of Justice (Mandela holding cell), Synagogue Rivonia Trial

Chapter 3: Strategic Agenda and Policy Guideline
Tshwane IDP 2006 – 2011 First Revision 62
Strategic Objective KPA KPI Targets
value system environment have improved over the past year by 2009. development
2.8 Implement job creation
initiatives
The Nr of jobs created through a municipality’s
(LED) initiatives, incl capital projects (NKPI)
Create at least 53000 short term jobs and 5000
permanent jobs with strategic partners by 2011 from
LED initiatives, incl capital projects
3.1 Intercept the cycle of poverty
by investing in a human resource
development programme that
optimises the wellness and
potential of our people from birth
throughout life
Nr of essential skills development initiatives
implemented in communities in partnership with
key role-players such as the SETA’s and in line
with the sector skills plans
Implement at least 1 community skills development
initiative per community per annum
3
To fight poverty, build
clean, healthy, safe and
sustainable
communities
3.2 Reduce the burden of
poverty through an effective
indigent policy that
enhances the access for all
those who qualify and link
indigent families to targeted
poverty alleviation
programmes that would
improve household income
% of households earning less than R1700/m with
access to free basic services (NKPI)
100% of h/h earning less than R1700/m have access to
free basic services (NKPI)
3
To fight poverty, build
clean, healthy, safe and
sustainable
communities
3.3 Promote viable communities
by establishing mixed human
settlements closer to economic
opportunities with social, cultural
and economic development
% of settlements close to economic opportunities 70% of settlements close to economic opportunities

Chapter 3: Strategic Agenda and Policy Guideline
Tshwane IDP 2006 – 2011 First Revision 63
Strategic Objective KPA KPI Targets
programmes that enable
celebration of diversity and foster
social inclusion
3
To fight poverty, build
clean, healthy, safe and
sustainable
communities
3.4 Decrease the vulnerability of
targeted groups at risk through
mainstreamed programmes for
children, youth, women, disabled
and elderly
Nr of initiatives implemented that benefit
vulnerable groups
Implement a minimum of 100 initiatives that benefit
vulnerable groups by 2011
3.5 promote a culture of
competitive and professional
sports activities and prepare the
city to host the Africa and World
Soccer cups in 2009 and 2010
respectively
Nr of world class sports events taking place in
Tshwane
10 world class sports events by 2011
3.6 Ensure the safety of our
communities, businesses and
roads through fostering a culture
of respect for the rights of all, the
laws that govern us all and a high
moral and ethical standard
% of residents in Tshwane that indicated that the
municipality’s efforts to promote a safe
environment by enforcing laws have improved
over the past year
95% of residents surveyed by 2009 indicated that the
municipality’s efforts to promote a safe environment by
enforcing laws have improved over the past year
3
To fight poverty, build
3.7 Decrease the crime levels
working with the National
% below the Gauteng average decrease in crimes
identified as a priority in Tshwane
Achieve a decrease of 1% below the Gauteng crime
levels for crimes identified as a priority in Tshwane

Chapter 3: Strategic Agenda and Policy Guideline
Tshwane IDP 2006 – 2011 First Revision 64
Strategic Objective KPA KPI Targets
clean, healthy, safe and
sustainable
communities
Criminal Justice System, the
SAPS, business and communities
ensuring visible policing and
strengthening the municipal court
system
3.8 Promote a clean, healthy and
sustainable environment and
reduce the burden of preventable
diseases on our people and our
economy including Chronic
illnesses, TB, HIV and AIDS
a) % of population who have access to municipal
health services
b) % of uninsured population with access to
personal PHC services
a) 100% of population have access to municipal health
services
b) 100% of uninsured population have access to
personal PHC services
3.9a. Ensure that the City has a
Fire Brigade Service and optimal
capacity to respond to
emergencies
% preparedness of the COT to respond to
emergencies in terms of the master plan
COT is 70% prepared for emergencies in terms of the
emergency management master plan
3.9b. Coordinate capacity within
Tshwane to reduce the risk of
disasters
Nr of levels of the disaster risk management plan
developed in accordance with legislation
CoT has documented a Disaster Risk Management Plan
(on 3 levels) with responsibilities identified and
contingency planning implemented by all departments
and entities
4
Foster participatory
democracy and Batho
Pele principles through
4.5 Entrench a customer focused
approach to citizenry and
business by setting standards that
we achieve guided by the Batho
Nr of service delivery areas that comply with Batho
Pele norms and standards
All areas of service delivery comply by 2010

Chapter 3: Strategic Agenda and Policy Guideline
Tshwane IDP 2006 – 2011 First Revision 65
Strategic Objective KPA KPI Targets
a caring, accessible and
accountable service
pele principles
4.6 Establish effective
stakeholder forums that are
inclusive and foster a non-racial,
non-sexist, democratic, caring
and prosperous society, focused
on achieving the city’s socio-
economic goals
Nr of essential stakeholder forums that are
working effectively
All essential forums are effective in their functioning by
2011
5
To ensure good
governance, financial
viability and optimal
institutional
transformation with
capacity to execute its
mandate
5.1 Good governance The % of residents of Tshwane who have
indicated annually that COT governs well
95% of COT residents surveyed annually indicated that
COT governs well
5.2 Sustainability management a) % of municipal debt over 90 days
b) Efficiency gains in Rand value due to the
implementation of alternate service delivery
mechanisms
a) Reduce municipal debt over 90 days from 78% to
70% by 2011
b) Comparison of expenditure prior to and after
implementation of alternate service delivery mechanisms
shows savings by 2011.
5.3 Prudent financial
management
a) Financial viability as expressed by:
i) A=(B-C)/D
ii) A=B/C
a) the financial viability is to be achieved in terms of the
RG targets

Chapter 3: Strategic Agenda and Policy Guideline
Tshwane IDP 2006 – 2011 First Revision 66
Strategic Objective KPA KPI Targets
iii) A=(B+C)/D
b) % of a municipality’s capital budget actually
spent on capital projects identified for a particular
year as per the IDP (NKPI)
b) The % of budget spent is in line with the RG
conditions with 99% achieved by 2009.
5.4 Local government
responsiveness to its residents
% of residents surveyed who indicated satisfaction
with COT responsiveness
80% of residents surveyed annually indicate they are
satisfied with COT responsiveness.
5.5 Performance monitoring and
evaluation
The degree to which COT programmes, projects
and initiatives respond to the needs and priorities
of its communities
Improve service delivery such that all programmes,
projects and initiatives make a positive impact on the
communities as per their identified needs and priorities
5.6 Ensure cooperative
governance (IGR)
Degree of integration between COT and other
spheres of government in the delivery of critical
programmes or initiatives
Achieve full integration of the delivery of critical
programmes by 2011
5
To ensure good
governance, financial
viability and optimal
institutional
transformation with
capacity to execute its
mandate 5.7 Perform risk management The degree to which COT risk management
practices reflect international best practices, norms
and stds.
All COT risk management practices in line with
international best practice and norms and Stds by end
2008/09
5.8 Sound human resource
management
a) % of human resource practices that reflect best
practice and compliance with legislation
b) % of rare and essential skills retained per job
category
c) % of a municipality’s budget spent on
implementing its workplace skills plan (NKPI)
a) 75% of all COT human resource practices are in line
with international best practice, norms and standards,
and 100% comply with legislation.
b) Ensure that 70% essential and rare skills per job
category are retained by 2011
c) Achieve national norms and standards by 2011 in
terms of the % of the budget to be spent on
implementing the workplace skills plan.

Chapter 3: Strategic Agenda and Policy Guideline
Tshwane IDP 2006 – 2011 First Revision 67
Strategic Objective KPA KPI Targets
5.9 E-governance Degree of response of ICT to organisational
service delivery needs
Ensure integrated systems that support service delivery
needs and ensure accountability by 2008.
5.12 Review and align the
organisational structure to the
strategic objectives
The level to which the organisational structure
supports the achievement of the 5 yr programme
The organisational structure is 100% aligned to deliver
on the COT strategic objectives by 2009
5.13 Promote a new
organisational culture
The degree to which the culture of the COT
achieves good governance and service delivery (Nr
of critical bottlenecks to service delivery)
All critical bottlenecks in service delivery are removed by
2008
5.14 Review current performance
management system and re-align
to new priorities
% alignment and integration between individual,
organisational and financial management
Achievement of 100% integrated and aligned
performance management system in COT by 2008
5
To ensure good
governance, financial
viability and optimal
institutional
transformation with
capacity to execute its
mandate
5.16 Ensure employment equity The nr of people from employment equity groups
employed per organisational level in compliance
with the municipality’s EE Plan (NKPI)
Annually achieve the targets set out in the municipality’s
EE plan thereby achieving 100% of the EE plan by 2011.

Chapter 3: Strategic Agenda and Policy Guideline
Tshwane IDP 2006 – 2011 First Revision 68
Strategic Objective 1: Provide quality basic services and infrastructure KPI: The percentage of households with access to basic levels of (water, sanitation, electricity, solid waste removal), roads,
Storm-water and housing
Target: Eradicate basic services backlogs equal to or earlier than national targets
1.1 Eradication/reduce of infrastructure backlogs Annual Targets Departmental
targets 2006/07 2007/08 2008/9 2009/10 2010/2011 Departmental Indicators Key departments
6000 12000 12000 12000 12000 Nr of completed and occupied houses electrified
Public works: Electricity 1.1.1 Electrify 112 000 of 136000 houses by 201111
6941 in Winterveld
7 200 10585 Nr of completed and occupied houses in Winterveld electrified
Public works: Electricity
10000 12000 12000 12000 12000 Nr of residential stands provided with water connection
Housing
1430 7535 7908 9151 2450 Nr of household stands
provided with water connection per year
Public works: W&S
1.1.2 Universal basic water by 2008
100% 100% 100% 100% 100% % of informal settlements receiving water
Housing
12000 12000 12000 12000 12000 Nr of residential stands provided with sewer connection
Housing 1.1.3 Contribute towards the national target of universal basic sanitation by 2010
963 1500
7530 9916 9670 Nr of households provided with basic service (sanitation)
Public Works: W&S LED to identify provision needs for econ infra
11 This includes houses electrified by other partners through service level agreements
Chapter 3: Strategic Agenda and Policy Guideline
Tshwane IDP 2006 – 2011 First Revision 69
1.1 Eradication/reduce of infrastructure backlogs Annual Targets Departmental
targets 2006/07 2007/08 2008/9 2009/10 2010/2011 Departmental Indicators Key departments
6000 6000 6000 6000 6000 Nr of top structures provided Housing 1.1.4 Contribute towards the national target of formalising informal settlements by 2014 by: a) Providing 6000 top structures per annum in addition to the Gauteng 12000 top structures pa, and b) Establishing townships from informal settlements at a rate of 10 % pa.
20% of settlements that can be established
30%12 40% 50% 60% % of settlements established as townships/ land development application
Housing
1.1.5 Develop at least 240 family units at hostels per annum
366
24013 240 240 240 Nr of completed family units at hostels
Housing
1.1.6 To reduce the current
41.7 39.6 33.6 45.8 52.4 Length of Roads upgraded to reduce the backlogs (in Km)
Public Works: R&SW
12 in total 19 informal settlements to be formalised accumulatively 13 The target is dependent on whether demolition is required or not

Chapter 3: Strategic Agenda and Policy Guideline
Tshwane IDP 2006 – 2011 First Revision 70
1.1 Eradication/reduce of infrastructure backlogs Annual Targets Departmental
targets 2006/07 2007/08 2008/9 2009/10 2010/2011 Departmental Indicators Key departments
backlogs with 14% by 2011, with 25% by 2016 and by 60% by 2020 6000 stands
per annum (6km of roads and Stormwater)
4000 stands (20 km of roads and Stormwater
4000 stands (20 km of roads and stormwater
4000 stands (20 km of roads and stormwater
4000 stands (20 km of roads and stormwater
Nr of residential stands provided with roads and Stormwater drainage
Housing
1.1.6 To reduce the current backlogs with 14% by 2011, with 25% by 2016 and by 60% by 2020
25.7
38.1 32.9 44.4 37.6 Length of Stormwater Drainage Systems Constructed to reduce backlogs (in Km)
Public Works: R&SW
1.1.6 (b) To eradicate the current backlogs of informal Transport Facilities by 2011
4 4 4 4 4 Number of new and informal facilities formalized to basic level of service per annum
Transport Development
12
12
12 12 12 NR of new parks in areas of backlog
A&EM
1.1.7 Provide a minimum of 12 parks in areas of current backlog.
10000 10000 10000 10000 10000 Nr of trees planted A&EM

Chapter 3: Strategic Agenda and Policy Guideline
Tshwane IDP 2006 – 2011 First Revision 71
1.1 Eradication/reduce of infrastructure backlogs Annual Targets Departmental
targets 2006/07 2007/08 2008/9 2009/10 2010/2011 Departmental Indicators Key departments
1.1.8 Universal access to solid waste removal (72000 over the next 5 years)
10000 18000 18000 18000 18000 Nr of households provided with waste removal services
A&EM

Chapter 3: Strategic Agenda and Policy Guideline
Tshwane IDP 2006 – 2011 First Revision 72
Strategic Objective 1: Provide quality basic services and infrastructure KPI Provision of infrastructure per type as a proportion to new demand/need (growth) Target Provide infrastructure that meets growth demands and prevent the creation of new backlogs
KPA 1.2 Provide quality infrastructure for growth Annual Targets Departmental
targets 2006/07 2007/08 2008/9 2009/10 2010/2011 Departmental Indicators Key departments
1.2.1 Provide 11 131 new electricity infrastructure developments as per projected annual growth.
2132
2100 1050 1050 2000
Nr of new infrastructure developments added to network
Electricity
1.2.2 Removed 1.2.3 Provide 54000 new waste service points over the next 5 years
16000 16000 16000 12000 10000 Nr of new waste removal service points
A&EM
1.2.4 Removed 1.2.5 1000 km of water pipes provided for growth14
100km
a. 35990 b. 143120 c. 0ML
a. 18552 b. 176200 c. 18ML
a. 16193 b. 114360 c. 66ML
a. 4400 b. 70500 c. 60ML
a. Installation of bulk water 15pipelines (m) b. Installation of internal water network pipelines (m) c. Increase reservoir capacity (megalitres)
Public works: W&S
14

Chapter 3: Strategic Agenda and Policy Guideline
Tshwane IDP 2006 – 2011 First Revision 73
KPA 1.2 Provide quality infrastructure for growth Annual Targets Departmental
targets 2006/07 2007/08 2008/9 2009/10 2010/2011 Departmental Indicators Key departments
1.2.6 Removed 1.2.7 Provide 70km of new road for growth.
13.5 12.4 12.8 16.4 14.9
Length (km) of new Roads Provided for growth
Public works: R&SW Housing
1.2.8 Provide 28km of new Stormwater drainage systems
3.2
4.4 4.4 7.9 7.9
Length (km) of new Stormwater drainage systems Provided to cater for growth
Public Works: R&SW
1.2.9 Increase sewer infrastructure from 2007/08 - 2012 to: 17501m Bulk Sewer pipelines 74400m Internal Sewer Network pipelines 111Ml waste water
45km
a. 3916 b. 13710 c. 20
a. 2600 b. 24410 c. 0
a. 3400 b. 15760 c. 0
a. 4485 b. 10260 c. 71
a. Length (m) of bulk sewer pipelines b. Length (m) of internal sewer network pipelines (m) c. Increase waste water treatment capacity (megalitres)
Public works: W&S
12.10. Removed

Chapter 3: Strategic Agenda and Policy Guideline
Tshwane IDP 2006 – 2011 First Revision 74
KPI % expenditure on infrastructure maintenance (R)
Target Expenditure on infrastructure maintenance is in line with national norms and standards by 2011
KPA 1.3 Ensure maintenance of existing infrastructure Departmental targets
Annual Targets Departmental Indicators Key departments
2006/07 2007/08 2008/9 2009/10 2010/2011 1.3.1 Removed 1.3.2 Maintain a minimum of 2018.1 km of roads by 2011including the blading of roads)
336.61 345.5 318 491 527 Length of Roads maintained (in Km)
Public works: R&SW
1.3.2(b) Maintain 51 existing transport facilities
51 55 59 63 67 Number of formal & informal transport facilities maintained per annum
Transport Development
1.3.3 Maintain 34.33 km of Stormwater drainage systems
6.873 6.952 6.858 6.825 Elements of the Stormwater drainage systems maintained (in KM)
Public works: R&SW
1.3.4 Maintain and upgrade 18 348 traffic signals
4038
3853 3663 3483 3311 Number of Traffic Signals upgraded and maintained
Public works: R&SW
1.3.5 Moved to 3.6.6 1.3.6 Maintain 63 bridges
12 12 13 13 13 Number of bridges rehabilitated and maintained
Public works: R&SW

Chapter 3: Strategic Agenda and Policy Guideline
Tshwane IDP 2006 – 2011 First Revision 75
KPI % unaccounted for water and electricity
Target % unaccounted for water and electricity losses to be in line with internationally accepted benchmarks by 2011
KPA 1.4 Prevent resource losses (previously called ensure optimal resource utilisation) Departmental targets
Annual Targets Key departments
2006/07 2007/08 2008/9 2009/10 2010/2011 Departmental Indicators
1.4.1 Reduce unaccounted for water to 26% in 2011 (Approximately 1% reduction per year)
23% 27%16 27% 26%
26% % of unaccounted for water Public works: W&S
1.4.2 Reduce unaccounted for electricity in line with internationally accepted benchmarks
9% 9% 9% 9% 9% % of unaccounted for electricity
Public works: Electricity
KPA 1.5 Formalisation of informal settlements Addressed in KPA 1.1 above
16 The baseline for 05/06 was reviewed due to late statistics, and this affected the outer year targets

Chapter 3: Strategic Agenda and Policy Guideline
Tshwane IDP 2006 – 2011 First Revision 76
KPA 1.6 Explore alternative sources of energy (non-conventional)
Annual Targets Key departments
Departmental targets
2006/07 2007/08 2008/09 2009/10 2010/2011
Departmental Indicators
1.6.1
At least 1% of households using non-conventional energy per type by 2011
0
5000 h/holds 8000 h/holds Nr of non-electrified households supplied with free alternative energy equivalent to 50kw monthly by type
Public works: Electricity
KPI: Nr of service delivery initiatives with local labour content as a proportion of the total
Target: By 2011 all labour intensive initiatives with local labour content as a proportion of the total
KPA 1.7 Optimise labour intensity and community involvement Annual Targets Departmental
targets 2006/07 2007/08 2008/9 2009/10 2010/2011 Indicators Key departments
1.7.1 Use a minimum of 50 SMME contractors/Co-operatives in environmental management
50
50 Electricity: 10
50 50 50 Nr of SMME contractors appointed
A&EM to lead ED

Chapter 3: Strategic Agenda and Policy Guideline
Tshwane IDP 2006 – 2011 First Revision 77
KPA 1.7 Optimise labour intensity and community involvement Annual Targets Departmental
targets 2006/07 2007/08 2008/9 2009/10 2010/2011 Indicators Key departments
initiatives and operations per annum17 1.7.2 By 2011 all labour intensive initiatives of COT should have 90% local labour18
20%
PW&ID: 40% W&S: 30% Electricity: 40% No targets provided by other departments
PW&ID: 50% Electricity: 50% W&S: 40% CSES (EMS): 50% No targets provided by other departments
PW&ID: 70% Electricity: 70% W&S: 50% CSES (EMS): 50% No targets provided by other departments
PW&ID: 90% Electricity: 90% W&S: 50% CSES (EMS): 50%
% of local labour in labour intensive initiatives of COT Housing, CPD, A&EM do not contribute to EPWP projects. EMS can only report in terms of infrastructure projects due to specialised nature of equipment/needs
All Departments that implement capital projects to achieve, in addition to PW&ID, which already has General Conditions of Contract requirements to ensure this is achieved.
17 Identify environmental projects with potential for developing co-operatives 18 Ensuring 100 % compliance with the EPWP policy

Chapter 3: Strategic Agenda and Policy Guideline
Tshwane IDP 2006 – 2011 First Revision 78
Strategic Objective 2: Accelerate higher and shared economic growth and development KPI: i) The number of COT LED initiatives (incl. capital projects) that focus on strategic and growing sectors as a proportion of the total
ii) % growth of GVA19 per annum of the City;
iii) Decrease in the Gini coefficient
Target: i) All COT local economic initiatives should focus on growing and strategic sectors by 2008 ii)6% growth in the COT GVA20;
iii) Decrease Gini coefficient by 0.1 p/a (baseline (0.75) 21
KPA 2.1 Leverage growing and strategic sectors in the City in a way that optimizes investment opportunities and focus on establishing an integrated economy Annual Targets Departmental
targets 2006/07 2007/08 2008/9 2009/10 2010/2011 Departmental Indicators Key departments
2.1.1 Provide 6.4 km Roads Infrastructure in local economic nodes
2.0
2.4 22 1.0 1.0 0.0 Length of roads provided and upgraded in local economic clusters (in Km) Included in targets for KPI 1.1.6
Public Works: R&SW
2.1.2 Achieve 4,5% growth per annum in the tourism market of
4.5%
4.5% 4.5% 4.5% 4.5% % Growth in the COT tourism market of overnight visitors in the Gauteng region
Economic Development23
19 GVA = GDP- taxes on products + subsidies on products. Therefore GVA =(C+I+G+(X-M)) - Tc+ TPc. 20 Page 180 of cities network 2004- The % growth of GVA (gross value added) in Tshwane (2002) was 5%, but its contribution to National GVA for 2002 was 10%. These are 2 separate measures. 21 As measured by the Cities Network 22 Linked to funding for 2010 FIFA WC Projects

Chapter 3: Strategic Agenda and Policy Guideline
Tshwane IDP 2006 – 2011 First Revision 79
KPA 2.1 Leverage growing and strategic sectors in the City in a way that optimizes investment opportunities and focus on establishing an integrated economy Annual Targets Departmental
targets 2006/07 2007/08 2008/9 2009/10 2010/2011 Departmental Indicators Key departments
overnight visitors, 2.1.3 Investment in at least 2 strategic sectors per annum facilitated by COT.
2 Feasibility studies
1 1 1 1 Nr of strategic sectors invested in as a result of initiatives facilitated by COT.
Economic dev to lead
2.1.4 Implementation of 5 implementation Programmes identified in the Tshwane Tourism Master plan
Tourism Events, CSF, Training and skills dev, location based tourism implementation programmes struggle history product development.
Programmes of the Tshwane tourism master plan implemented.
Economic Dev (tourism)
2.1.5 Establishment and management of Tshwane Regional Tourism Organisation(Municipal Entity) through a
Establishment of RTO
Economic Dev (tourism)
23 SLA’s to be negotiated with, Marketing – Branding, exhibitions & promotional material, Roads & stormwater – see 2.1.1, City Planning – revisiting all tourism related by-laws (e.g. rezoning, streetscape), Housing – sector plans e.g. Mamelodi master plan, Social Development -2010 fan parks, museums, monuments & city events, Metro Police – resources and strategy for tourism/visitor safety e.g. 2010, tourist routes (prevention & handling of incidents/trauma

Chapter 3: Strategic Agenda and Policy Guideline
Tshwane IDP 2006 – 2011 First Revision 80
KPA 2.1 Leverage growing and strategic sectors in the City in a way that optimizes investment opportunities and focus on establishing an integrated economy Annual Targets Departmental
targets 2006/07 2007/08 2008/9 2009/10 2010/2011 Departmental Indicators Key departments
SLA
KPA 2.2 Invest in economic infrastructure and a transport system that promotes greater efficiency regarding logistics, and optimize productivity of human capital by reducing travelling time between home and work
Annual Targets Departmental targets 2006/07 2007/08 2008/9 2009/10 2010/2011
Departmental Indicators Key departments
2.2.1 Facilitate the provision of 300 new buses for the public transport system by 201124
100
100 75 75 50 Nr of new buses provided for the public transport system
Economic development (Transport)25
2.2.2 Maintain and cleanse 51 public transport facilities per annum by 2011
48 according to Occupational Health and Safety standards and regulations (Base line : 47)
47+1 48+1 49+1
50+1
Nr of public transport facilities maintained and cleansed per annum.
Public Works: Transport Development
2.2.3 Reduce time to travel between homes and
30% improvement by June 2007
Review COT policy
Review COT policy
Review COT policy
Review COT policy Commence with
Hrs in the day travelled between home and work
Public Works: Transport Development
25 SLA required between Transport & Tourism (RTO)

Chapter 3: Strategic Agenda and Policy Guideline
Tshwane IDP 2006 – 2011 First Revision 81
KPA 2.2 Invest in economic infrastructure and a transport system that promotes greater efficiency regarding logistics, and optimize productivity of human capital by reducing travelling time between home and work
Annual Targets Departmental targets 2006/07 2007/08 2008/9 2009/10 2010/2011
Departmental Indicators Key departments
work in line with Gauteng province targets, and in partnership with key role-players.
Electronic Ticketing
Commence with BRT (Phase 1A)
Commence with BRT (Phase 1A)
BRT (Phase 1B – Completion by 2013)
(Policy guidelines to reduce time travelled to be reviewed annually)
2.2.4 Construct 47 public transport facilities by 2011
18 (Base line: 27)
27+ 5 32+ 5 37+ 5 42+ 5 Nr of public transport facilities constructed
Economic development (transport)26
26 SLA between Transport & Tourism Division (Gauteng Portal link)

Chapter 3: Strategic Agenda and Policy Guideline
Tshwane IDP 2006 – 2011 First Revision 82
KPAs 2.3 Regeneration and development of potentially viable economic nodes focusing on the inner city and targeted areas based on efficient land use Annual Targets Departmental
targets 2006/07 2007/08 2008/9 2009/10 2010/2011 Departmental Indicators Key departments
2.3.1 Implement 269 contracts through the EPWP
36
55 R&SW 54 R&SW 59 R&SW 65
Number of contracts implemented through the Extended Public Works Programme as per the Tshwane EPWP policy.
Public works: R&SW W&S Electricity Econ Development, A&EM H&SD Interaction required with national between national Public Works
2.3.2 Four stagnant nodes with potential revived by 2011
Establish baseline
1 (Babelegi/ GaRankuwa)
1 1 1 Number of stagnant economic nodes with potential revived in existing townships.
Economic Development
2.3.3 All bad buildings are eradicated in COT by 2011
95%
CP&D: Audit to be done to determine how many buildings need attention
2% reduction 2% reduction 2% reduction % reduction in bad buildings in the COT
CP&D27
2.3.4 80% of needs in terms of
Determine baseline
3 streetscape design / open space projects
% of inner city regeneration compared to the total need in terms of:
A & EM to lead ED (Tourism)29
27 SLA between CPD and ED 28 Capital Theatre, Palace of Justice (Mandela holding cell), Synagogue Rivonia Trial 29 SLA with City Planning, Public Works & Economic Development

Chapter 3: Strategic Agenda and Policy Guideline
Tshwane IDP 2006 – 2011 First Revision 83
KPAs 2.3 Regeneration and development of potentially viable economic nodes focusing on the inner city and targeted areas based on efficient land use Annual Targets Departmental
targets 2006/07 2007/08 2008/9 2009/10 2010/2011 Departmental Indicators Key departments
regeneration of the inner city achieved by 2011, in terms of: a) businesses, b) open space c) social infrastructure d) economic infrastructure e) historical buildings28
a) businesses b) open space c) social infrastructure d) economic infrastructure e) historical buildings
KPA 2.4 Optimise city-wide Tourism opportunities from a Cultural, Business and Capital City status. (linked to KPA 2.1) A strategic initiative of KPA 2.1 therefore dealt with in KPA 2.1
KPI: Nr of SMME’s and/or cooperatives that empower black people, women and youth, supported and developed
Target: At least 8000 SMME’s and/ or cooperatives by 2011, of which 75% are to be black person/women/youth owned.
KPA 2.5 Increase participation and broaden the contribution in growing the city’s economy through the development of SMME’s, co-operatives, the informal sector and the role of black people, women and youth Annual Targets Key departments Strategic target 2006/07 2007/08 2008/9 2009/10 2010/2011
Departmental Indicators
2.5.1 By 2010 80% of total
PW&ID: 78% Fin: 70%
PW&ID: 79% CSES (EMS): 22%
PW&ID: 80% Fin: 78%
PW&ID: 80% Electricity: 80%
Percentage of local vendors used by the department for
All departments

Chapter 3: Strategic Agenda and Policy Guideline
Tshwane IDP 2006 – 2011 First Revision 84
KPA 2.5 Increase participation and broaden the contribution in growing the city’s economy through the development of SMME’s, co-operatives, the informal sector and the role of black people, women and youth Annual Targets Key departments Strategic target 2006/07 2007/08 2008/9 2009/10 2010/2011
Departmental Indicators
vendors used by the municipality are local.
Electricity: 40% CSES (EMS): 22% Housing: 75% W&S: 50% CP&D: 75% A&EM: 75% ED: 80% CS: 65%
Fin; 74% Electricity: 55% Housing: 75% W&S 60% CP&D 75% A&EM: 75% ED: 80%
Electricity: 70% CP&D: 80% A&EM: 80% ED: 80% W&S 70% CSES (EMS): 22% Housing 80%
Fin: 80% W&S 80% A&EM: 80% ED: 80% CSES (EMS): 22% Housing 80% CP&D: 80%
non specialised services.
10
10
10
10
10
Electricity 2.5.2 Develop and support at least 8000 SMME’s and/or cooperatives by 201130
1500
1600 1500 1500 2000
Nr of SMME's developed and supported (that empower black people, women and youth) Economic Development
(LED) to lead
2.5.3 Alienate 60% of councils immovable property to BEE for commercial purposes by 2011
45% 45% 50% 55% 60% % of council's immovable property alienated to BEE for commercial purposes
Legal and secretarial
2.5.4 Alienate 45% of
60%
45%
45%
45%
45%
% of council's immovable property alienated to BEE
Legal and secretarial
30 Contribute to 2010 legacy projects through establishment of Fan Parks with broadcasting rights, Tshwane Tourist memorabilia opportunities, Apply for selling rights & sponsorship rights from FIFA,
Alternative transport opportunities e.g. Rickshaws (Tourism contribution)
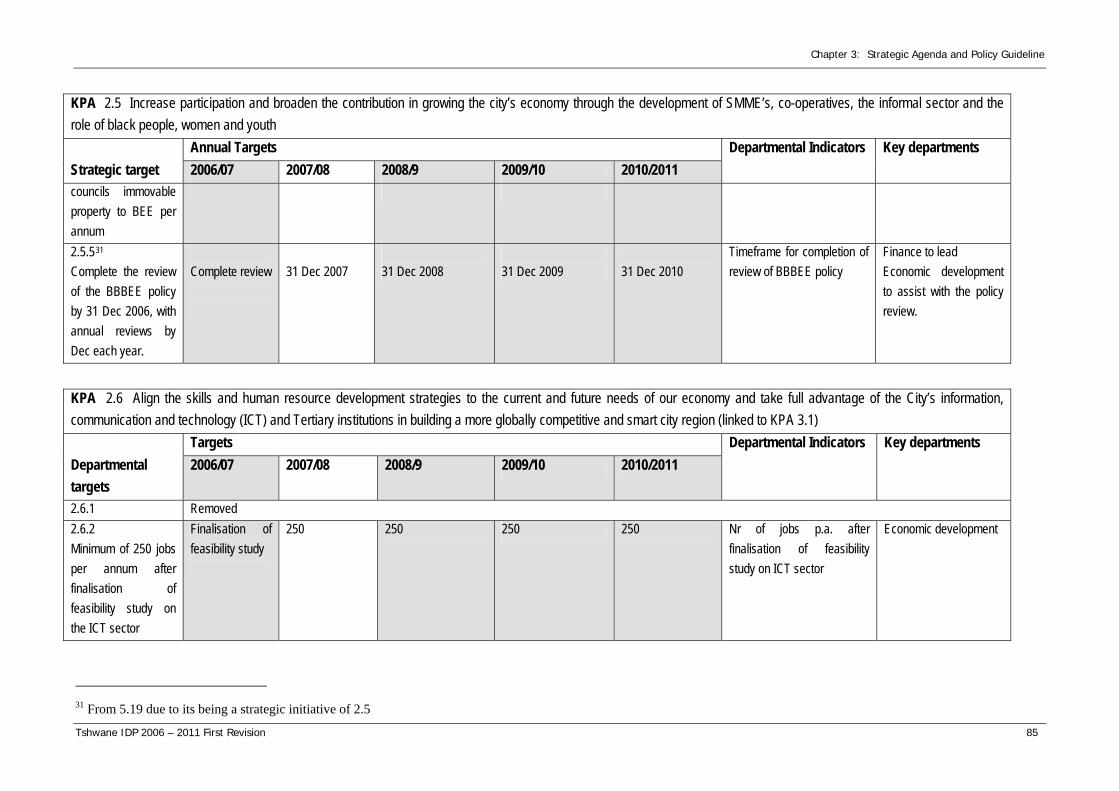
Chapter 3: Strategic Agenda and Policy Guideline
Tshwane IDP 2006 – 2011 First Revision 85
KPA 2.5 Increase participation and broaden the contribution in growing the city’s economy through the development of SMME’s, co-operatives, the informal sector and the role of black people, women and youth Annual Targets Key departments Strategic target 2006/07 2007/08 2008/9 2009/10 2010/2011
Departmental Indicators
councils immovable property to BEE per annum
2.5.531 Complete the review of the BBBEE policy by 31 Dec 2006, with annual reviews by Dec each year.
Complete review
31 Dec 2007
31 Dec 2008
31 Dec 2009
31 Dec 2010
Timeframe for completion of review of BBBEE policy
Finance to lead Economic development to assist with the policy review.
KPA 2.6 Align the skills and human resource development strategies to the current and future needs of our economy and take full advantage of the City’s information, communication and technology (ICT) and Tertiary institutions in building a more globally competitive and smart city region (linked to KPA 3.1) Targets Key departments Departmental targets
2006/07 2007/08 2008/9 2009/10 2010/2011 Departmental Indicators
2.6.1 Removed 2.6.2 Minimum of 250 jobs per annum after finalisation of feasibility study on the ICT sector
Finalisation of feasibility study
250 250 250 250 Nr of jobs p.a. after finalisation of feasibility study on ICT sector
Economic development
31 From 5.19 due to its being a strategic initiative of 2.5

Chapter 3: Strategic Agenda and Policy Guideline
Tshwane IDP 2006 – 2011 First Revision 86
KPI: i)Rand value of investment in Tshwane as a direct result of strategic partnerships;
ii) % of business in Tshwane that indicates the COT’s efforts to create an enabling business environment have improved
over the past year
Target: i) Achieve at least R300M of investment in Tshwane as a result of strategic partnerships.
ii) 80% of business indicates satisfaction with COT’s efforts to create an enabling business environment by 2009.
KPA 2.7 Establish strategic partnerships to ensure a focused common vision and good economic governance value system Annual Targets Departmental
target 2006/07 2007/08 2008/9 2009/10 2010/2011 Departmental Indicators Key departments
2.7.1 Utilise a variety of mechanisms to provide opportunities to the private sector
Lease agreements, and cooperative agreements at parks, nature reserves, resorts and swimming pools
Lease agreements and cooperative agreements at parks, nature reserves, resorts and swimming pools
Lease agreements and cooperative agreements at parks, nature reserves, resorts and swimming pools
Lease agreements and cooperative agreements at parks, nature reserves, resorts and swimming pools
Lease agreements and cooperative agreements at parks, nature reserves, resorts and swimming pools
Type of mechanisms for the provision of private sector opportunities made available in open space resources and facilities and environmental management initiatives
A&EM
2.7.2 Achieve direct Rand value investment from 90% of strategic partnerships, and a minimum of R300M by 2011.
R100M
R150M 90%: R200M 90%: R250M 90%- R300M % of strategic partnerships that result in Rand value investment in Tshwane
Economic Development OMM

Chapter 3: Strategic Agenda and Policy Guideline
Tshwane IDP 2006 – 2011 First Revision 87
KPI: The number of jobs created through a municipality’s (local economic development) initiatives, including capital projects
(NKPI)
Target: Create at least 53000 short term jobs and 5000 permanent jobs with strategic partners by 2011 from initiatives
(LED),including capital projects
KPA 2.8 Implement job creation initiatives. Annual Targets Departmental
targets 2006/07 2007/08 2008/9 2009/10 2010/2011 Departmental Indicators Key departments
2.8.1 Facilitate the creation of , at least 53000 short term jobs and 5000 permanent jobs with strategic partners by 2011 from local economic development initiatives, including capital projects. Specific contributions per departments include:
5000
5000 1000 1000 1000 Driven by economic development with relevant departments
• 3064 short term jobs in the execution of Roads and Stormwater projects
502
552 607 668 735 Roads and stormwater
• 1956 short term 668 509 362 428 424
Nr of permanent jobs created per annum
(Number of short term jobs created in the execution of
projects (COT Standard is 1 Job = 240 man days)
Water and Sanitation

Chapter 3: Strategic Agenda and Policy Guideline
Tshwane IDP 2006 – 2011 First Revision 88
KPA 2.8 Implement job creation initiatives. Annual Targets Departmental
targets 2006/07 2007/08 2008/9 2009/10 2010/2011 Departmental Indicators Key departments
jobs in the execution of water and sanitation projects
• 90 short term jobs in the execution of transport projects
50
10 10 10
10 Transport
• 3183 short term jobs in the execution of electricity projects
583 600 600 600 800 Electricity

Chapter 3: Strategic Agenda and Policy Guideline
Tshwane IDP 2006 – 2011 First Revision 89
Strategic Objective 3: To fight poverty, build clean, healthy, safe and sustainable communities
KPA: 3.1 Intercept the cycle of poverty by investing in a Human Resource Development programme that optimizes the wellness and potential of our people from birth throughout life Departmental targets
Annual Targets Departmental Indicators Key departments
2006/07 2007/08 2008/9 2009/10 2010/2011 3.1.1 By 2011 there should be 1 library facility per 42000 people per area.
1/50000
1/48000
1/46000
1/44000
1/42000
Nr of library facilities per population per area
SRAC
3.1.2 Implement at least 1 community skills development initiative per community per annum
1
2 (CS) 2 H&SD
1 (CS) 2 H&SD
1 (CS) 2 H&SD
1 (CS) 2 H&SD
Nr of essential skills development initiatives implemented in communities in partnership with key role-players such as the SETA’s, and in line with sector skills plans.
Social development to drive Corporate Services (HRD) to assist

Chapter 3: Strategic Agenda and Policy Guideline
Tshwane IDP 2006 – 2011 First Revision 90
KPI: % of households earning less than R1700 per month with access to free basic services (NKPI)
Target: 100 % of households earning less than R1700 per month have access to free basic services (NKPI)
KPA: 3.2 Reduce the burden of poverty through an effective indigent policy that enhances the access for all those who qualify and link indigent families to targeted poverty alleviation programmes that would improve household income Departmental targets
Annual Targets Key departments
2006/07 2007/08 2008/9 2009/10 2010/2011
Departmental Indicators
100%32
100% in Tshwane Area of Supply
100% of electrically connected households receive FBE
100% of electrically connected households receive FBE
100% of electrically connected households receive FBE
% of h/holds earning less than R1700 per month with access to Free Basic Electricity
Electricity
Identify baseline vis-a vis the indigent register
100%
100% 100% % of households that earn less than R1700 per month that receive free basic services :- - electricity - water - solid waste removal - sanitation
Electricity W&S A&EM
3.2.1 All households in COT that earn less than R1700 receive free basic services
1000 1500 2000 2500 % of household applicants that earn less than R1700 per month verified
H&SD (lead) Finance
32 This does not match with the targets set or indicate the number of households serviced.

Chapter 3: Strategic Agenda and Policy Guideline
Tshwane IDP 2006 – 2011 First Revision 91
KPA: 3.2 Reduce the burden of poverty through an effective indigent policy that enhances the access for all those who qualify and link indigent families to targeted poverty alleviation programmes that would improve household income Departmental targets
Annual Targets Key departments
2006/07 2007/08 2008/9 2009/10 2010/2011
Departmental Indicators
Deleted, part of KPA 1.6
Deleted, reflected in 1.6.1
3.2.2 Change at least 6000 residences to pre-paid meters
2000
1000 1000 1000
Nr of residences changed to pre-paid meters
Electricity
500
100 150 200 250 Nr of indigent households evaluated
H&SD 3.2.3 The number of households that exit indigent status should be in line with national targets of halving poverty by 2014
100
150
200
300
400
Nr of indigent households linked to exit programmes
H&SD
3.2.4 Removed: addressed in 3.4.1

Chapter 3: Strategic Agenda and Policy Guideline
Tshwane IDP 2006 – 2011 First Revision 92
KPI: % of settlements close to economic opportunities
Target: 20% of settlements close to economic opportunities
KPA 3.3 Promote viable communities by establishing mixed human settlements closer to economic opportunities with social, cultural and economic development programmes that enable celebration of diversity and foster social inclusion. Departmental targets
Annual Targets Key departments
2006/07 2007/08 2008/9 2009/10 2010/2011
Departmental Indicators
3.3.1 20% of all new settlements to be developed close to economic opportunities by 2011
1%
3% 3%
5%
8% % of new settlements that are developed close to economic opportunities. 33 .
Housing
3.3.2 At least 1 expanded opportunity per economically deprived settlements, per annum.
ED: 1 economic opportunity expanded per identified deprived settlement
ED: 1 economic opportunity expanded per identified deprived settlement
ED: 1 economic opportunity expanded per identified deprived settlement
ED: 1 economic opportunity expanded per identified deprived settlement
ED: 1 economic opportunity expanded per identified deprived settlement
Nr of economic opportunities that have been expanded and developed for the benefit of the local community in existing settlements.
HCPEM Economic development
3.3.3 Upgrade, construct or extend 24 arts and culture facilities.
4
1 1 1 1 Nr of arts, heritage and culture facilities upgraded, extended or constructed per (social development) region
SRAC
3.3.4 Nr of arts, heritage and SRAC
33 Define this indicator in terms of distance from a defined economic opportunity, or travel time from an economic opportunity

Chapter 3: Strategic Agenda and Policy Guideline
Tshwane IDP 2006 – 2011 First Revision 93
KPA 3.3 Promote viable communities by establishing mixed human settlements closer to economic opportunities with social, cultural and economic development programmes that enable celebration of diversity and foster social inclusion. Departmental targets
Annual Targets Key departments
2006/07 2007/08 2008/9 2009/10 2010/2011
Departmental Indicators
Maintain arts, heritage and culture facilities in all regions.
9
9 11 11 12 culture facilities maintained per region.
3.3.5 Implement at least 5 arts, culture and heritage programmes pa.
5
5 5 5 5 Nr of arts, culture and heritage programmes implemented in Tshwane
SRAC
KPAs: 3.4 Decrease the vulnerability of targeted groups at risk through mainstreamed programmes for children, youth, women, disabled and elderly Departmental targets
Targets Key departments
2006/07 2007/08 2008/9 2009/10 2010/2011
Departmental Indicators
3.4.1 Implement a minimum of 100 initiatives that benefit vulnerable groups by 2011
15
20
20
20
35
Nr of initiatives implemented that benefit vulnerable groups
H&SD
3.4.2 Removed 3.4.3 Removed

Chapter 3: Strategic Agenda and Policy Guideline
Tshwane IDP 2006 – 2011 First Revision 94
KPI: Nr of world class sports events taking place in Tshwane
Target: 10 World class sports events by 2011
KPA: 3.5 Promote a culture of competitive and professional sports activities and prepare the city to host the Africa and World Soccer cups in 2009 and 2010 respectively Departmental targets
Annual Targets Key departments
2006/07 2007/08 2008/9 2009/10 2010/2011
Departmental Indicators
3.5.1 Provide at least 1 sports facility per 7100 population by 2011
1/7300
1/7250
1/7200
1/7150
1/7100
Nr of sports facilities provided per number of population
SRAC
3.5.2 Maintain at least 305 sports facilities by 2011
300
301
301
303
305
Nr of sports facilities maintained
SRAC
3.5.3 Present at least 12 annual sports development programmes
12
12
12
12
12
Nr of sports events/development programmes presented
SRAC
3.5.4 Hold at least 2 events per annum
2
2
2
2
2
Nr of world class sports events held leading up to 2009 and 2010
SRAC

Chapter 3: Strategic Agenda and Policy Guideline
Tshwane IDP 2006 – 2011 First Revision 95
KPI: % of residents in Tshwane that indicated that the municipality’s efforts to promote a safe environment by enforcing laws have
improved over the past year.
Target: 95% of residents surveyed by 2009 indicated that the municipality’s efforts to promote a safe environment by
enforcing laws have improved over the past year
KPA: 3.6 Ensure the safety of our communities, businesses and roads through fostering a culture of respect for the rights of all, the laws that govern us all and a high moral and ethical standard Strategic target Targets Key departments 2006/07 2007/08 2008/9 2009/10 2010/2011
Indicators
3.6.1 8% reduction in fatalities per 10000 registered vehicles per annum
5%
8% 8% 8% 8% % reduction in fatalities per 10000 registered vehicles per annum
CSES(TMPS)
3.6.2 90% increase in the number of notices issued for by law transgressions
90% increase
80% reduction in by law transgressions by 2011
80% reduction in
by law
transgressions by
2011
80% reduction in
by law
transgressions by
2011
Achieve 80% reduction
Number of operations to result in a reduction of by-law transgressions
CSES(TMPS)
3.6.3 Construct 7.3 km of stormwater drainage systems and elements to ensure safety in local communities
2.3 km
2.3 km 1.6 km 0.5 km 0.5 km Length of stormwater drainage systems and elements constructed to ensure safe roads in local communities
Public works: R&SW
3.6.4 Maintain or replace 81 841 traffic signs
16 406
16 024
16 240
16 466
16 705
Nr of traffic signs replaced or maintained
Public works: R&SW

Chapter 3: Strategic Agenda and Policy Guideline
Tshwane IDP 2006 – 2011 First Revision 96
KPA: 3.6 Ensure the safety of our communities, businesses and roads through fostering a culture of respect for the rights of all, the laws that govern us all and a high moral and ethical standard Strategic target Targets Key departments 2006/07 2007/08 2008/9 2009/10 2010/2011
Indicators
by 30 June 2010 3.6.5 Provide 551 speedhumps, raised pedestrian crossings and related safety devices by 30 June 2010
87
103
8
160
193
Nr of speedhumps, raised pedestrian crossings and related safety devices provided
Public works: R&SW
3.6.634 Improve 56 intersections
8
8 9 15 16
Number of intersections improved
Public works: R&SW
KPI: % below the Gauteng average decrease in crimes identified as a priority in Tshwane
Target: Achieve a decrease of 1% below the Gauteng crime levels for crimes identified as a priority for Tshwane
KPAs: 3.7 Decrease the crime levels working with the National Criminal Justice System, the South African Police Services, Business and communities, ensuring visible policing and strengthening the municipal court system (linked to KPA 3.6)
Annual Targets Departmental targets 2006/07 2007/08 2008/9 2009/10 2010/2011
Departmental Indicators Key departments
34 Moved from 1.Move to 3.5 6 due to the emphasis on community safety
Chapter 3: Strategic Agenda and Policy Guideline
Tshwane IDP 2006 – 2011 First Revision 97
KPAs: 3.7 Decrease the crime levels working with the National Criminal Justice System, the South African Police Services, Business and communities, ensuring visible policing and strengthening the municipal court system (linked to KPA 3.6)
Annual Targets Departmental targets 2006/07 2007/08 2008/9 2009/10 2010/2011
Departmental Indicators Key departments
3.7.1 2% decrease per annum
2%
2% 2%
2%
2%
% decrease in the number of incidents (by-law transgressions) at parks, nature reserves, resorts and swimming pools
A&EM
3.7.2 Achieve an 80% success rate for prosecutions by 2010
70%
80% 80% 80% 80% % Number of cases on the Court roll successfully prosecuted
Legal and secretarial (Municipal Courts)
3.7.3 At least 300 joint operations embarked upon in partnership with key strategic partners such as SAPS and the business communities to fight crime
1
300
300
350
400
Number of joint operations embarked upon in partnership with key strategic partners such as SAPS and the business communities to fight crime
CSES(TMPS)
3.7.4 Achieve a 75% decrease of the Nr of cases withdrawn from the court roll.
80%
80% 80% 80% 80% % decrease in nr of cases withdrawn from the court roll
Legal and secretarial

Chapter 3: Strategic Agenda and Policy Guideline
Tshwane IDP 2006 – 2011 First Revision 98
KPAs: 3.7 Decrease the crime levels working with the National Criminal Justice System, the South African Police Services, Business and communities, ensuring visible policing and strengthening the municipal court system (linked to KPA 3.6)
Annual Targets Departmental targets 2006/07 2007/08 2008/9 2009/10 2010/2011
Departmental Indicators Key departments
3.7.5 Achieve a decrease of 1% below the Gauteng crime levels for crimes identified as priority in Tshwane.
10% below Gauteng
To be determined
To be determined
To be determined
To be determined
Number of joint operations embarked upon in partnership with key strategic partners such as SAPS and the business communities to fight crime Number of internal policing operations executed to contribute to the 1% decrease in reported crime levels per type of crime Number of social crime prevention interventions (e.g. projects/ programs) performed/ executed to contribute to the 1% decrease in reported crime levels per type of crime Number of environmental design and re-design interventions performed to contribute to the 1% decrease in reported crime levels per type of crime
CSES(TMPS)

Chapter 3: Strategic Agenda and Policy Guideline
Tshwane IDP 2006 – 2011 First Revision 99
KPI: (a) % of population who have access to municipal health services
(b) % of uninsured population with access to personal PHC services
Target: (a) 100% of population have access to municipal health services
(b) 100% of uninsured population have access to personal PHC services
KPA: 3.8 Promote a clean, healthy and sustainable environment and reduce the burden of preventable diseases on our people and our economy including Chronic illnesses, TB, HIV and AIDS. Departmental targets
Targets Key departments
2006/07 2007/08 2008/9 2009/10 2010/2011
Departmental Indicators
3.8.1 80% of h/holds with access to PHC within a radius of 5km
80%
98%
98%
98%
98%
% of households with access to PHC within a radius of 5km
H&SD
3.8.2 Maintain the number of clinic users per annum as 1 033 861.
1 007 280
1 033 861 1 033 861 1 033 861 1 033 861 Nr of clinic users per annum.35
H&SD
3.8.3 90% of EDL medicine made available to PHC clinics at all
90%
90%
90%
90%
90%
% of EDL medicine available to PHC clinics at all time
H&SD
35 CTMM responsibility in terms of SLA with Province is to maintain the current CTMM

Chapter 3: Strategic Agenda and Policy Guideline
Tshwane IDP 2006 – 2011 First Revision 100
KPA: 3.8 Promote a clean, healthy and sustainable environment and reduce the burden of preventable diseases on our people and our economy including Chronic illnesses, TB, HIV and AIDS. Departmental targets
Targets Key departments
2006/07 2007/08 2008/9 2009/10 2010/2011
Departmental Indicators
time 3.8.4 Removed 3.8.5 Increase nr of NGO’s funded to render HIV/AIDS services in the community by 2011
2
2
3
5
6
Nr of programmes initiated and implemented by funded NGOs to render HIV/Aids services in the community
H&SD
3.8.6 Deliver at least 10 HIV campaigns at district health level.
10
10 10 10 10 Nr of HIV capacity building programmes delivered per annum
H&SD
3.8.7 Implement at least 5 health awareness campaigns per annum
5
5
5
5
5
Nr of health awareness campaigns implemented per annum
H&SD
3.8.8 Implement 50% of identified Environmental Health functions as per NHA for Municipal Health
35%
27% 34% 40% 50% % implementation of identified Environmental Health functions prescribed by the National Health Act for municipal health services
H&SD

Chapter 3: Strategic Agenda and Policy Guideline
Tshwane IDP 2006 – 2011 First Revision 101
KPA: 3.8 Promote a clean, healthy and sustainable environment and reduce the burden of preventable diseases on our people and our economy including Chronic illnesses, TB, HIV and AIDS. Departmental targets
Targets Key departments
2006/07 2007/08 2008/9 2009/10 2010/2011
Departmental Indicators
services by 2011 3.8.9 Ensure that there is 0.5 Environmental Health Practitioners per 15 000 of population in 2011
0.31 per 15000 0.32 per 15000 0.34 per 15000 0.40 per 15000 0.50 per 15000 Nr of environmental health practitioners per 15000 of population
H&SD
KPI: N of levels of the disaster risk management plan developed in accordance with legislation Target: CoT has documented a Disaster Risk Management Plan (on 3 levels) with responsibilities identified and contingency planning implemented by all departments and entities INDEX: Coordinate capacity within Tshwane to reduce the risk of disasters
KPAs: 3.9 (a) Coordinate capacity within Tshwane to reduce the risk of disasters Departmental targets
Annual Targets Key departments
2006/07 2007/08 2008/9 2009/10 2010/2011
Departmental Indicators
3.9.1 36 Develop and maintain 3 levels of a disaster risk
1 (level 2) 1 (level 3) - - Nr of levels of a plan submitted on status of Disaster Risk Management Plan
CSES (EMS)
36 KPI 3.9.1 and 3.9.2 removed/deleted and are replaced with new KPIS 3.9.1 ABOVE

Chapter 3: Strategic Agenda and Policy Guideline
Tshwane IDP 2006 – 2011 First Revision 102
KPAs: 3.9 (a) Coordinate capacity within Tshwane to reduce the risk of disasters Departmental targets
Annual Targets Key departments
2006/07 2007/08 2008/9 2009/10 2010/2011
Departmental Indicators
management plan for CoT (including departmental contingency plans – responsibility of departments)
KPI: % preparedness of the COT to respond to emergencies in terms of the master plan
Target: COT is 70% prepared for emergencies in terms of the emergency management master plan
INDEX: To provide Fire and Rescue services
KPAs: 3.9 Ensure that the City has a Fire Brigade Service and optimal capacity to respond to emergencies 3.9. 3 Attend to a minimum of 90% of all fire requests
87%
88%
89%
90%
90%
% of fire incidents attended to on request
CSES (EMS)
3.9.4 Attend to 90% of specialised and humanitarian requests by 2009/10
85%
87%
89%
90%
90%
% of specialised and humanitarian incidents attended to on request
CSES
3.9.5 Conduct 8300 urban development control
8000
8200
8250
8300
8300
Nr of Urban development control activities concluded.
CSES

Chapter 3: Strategic Agenda and Policy Guideline
Tshwane IDP 2006 – 2011 First Revision 103
KPAs: 3.9 Ensure that the City has a Fire Brigade Service and optimal capacity to respond to emergencies activities per annum by 2011
3.9.6 Conduct 2750 hazardous substance activities per annum by 2011.
2650
2700
2720
2750
2750
Nr of hazardous substance activities concluded
CSES
Emergency Medical And Ambulance Services Needs A Separate Index, KPA, KPI And Target 3.9.7 Attend to 48000 patients per annum by 2011, in line with provincial norms and standards.
38000
42000
45000
47000
48000
Nr of patients attended to per year, on request in accordance with provincial norms and standards.
Health & social dev
3.9.8 Ensure standby services at major National events as requested
12
12
12
15
15
Nr of, selective, special standby services attended to, on request, per year
H&SD

Chapter 3: Strategic Agenda and Policy Guideline
Tshwane IDP 2006 – 2011 First Revision 104
Strategic Objective 4: Foster participatory democracy and Batho Pele principles through a caring, accessible and accountable service
KPA: 4.1 Optimise effective community participation in the ward committee system by strengthening the capacity and effectiveness of the ward committee to support the ward councillors’ capacity to engage in sectoral activities. Departmental targets
Targets Key departments
2006/07 2007/08 2008/9 2009/10 2010/2011
Departmental Indicators
4.1.1 The number of initiatives implemented is in line with needs identified.
1 induction session, 2 training, 1 conference
Complete implementation of initiatives
Nr of initiatives implemented to strengthen ward committees
Office of Speaker Office of Executive Mayor
KPA: 4.2 Strengthen ward committees capacity to engage in sectoral activities linked to the national, provincial and city-side programs through amongst others the support of the involvement of the Community Development Workers (CDW) programme. Departmental targets
Annual Targets Key departments
2006/07 2007/08 2008/9 2009/10 2010/2011
Departmental Indicators
4.2.1 100% of ward committees functioning actively performing the functions of ward committees in the system of participatory
100%
100% operational
100% operational
100% operational
% of ward committees functioning actively performing the functions of ward committees in the system of participatory democracy
Office of Speaker Office of Executive Mayor

Chapter 3: Strategic Agenda and Policy Guideline
Tshwane IDP 2006 – 2011 First Revision 105
KPA: 4.2 Strengthen ward committees capacity to engage in sectoral activities linked to the national, provincial and city-side programs through amongst others the support of the involvement of the Community Development Workers (CDW) programme. Departmental targets
Annual Targets Key departments
2006/07 2007/08 2008/9 2009/10 2010/2011
Departmental Indicators
democracy
KPAs: 4.3 Ensure access by communities and stakeholders to the system of petitions and ensure its responsiveness and efficiency. Departmental targets
Targets Key departments
2006/07 2007/08 2008/9 2009/10 2010/2011
Departmental Indicators
4.3.1 Achieve 100% consultation per key issue.
100%
100% (all key issues
100% (all key issues
100% (all key issues)
100% (all key issues
% key issues consulted on with community members in formal participatory processes prior to key decisions, including: The approval or any changes to the MTIEF, The development of a 5 year IDP, the approval or any changes to a 5 year IDP, major projects funded by the municipality, the approval of alteration in zoning, and the approval of or changes in tariffs
EMMM to lead Office of the speaker
KPAs: 4.4 Decentralise service delivery closer to communities that provides one-stop comprehensive municipal services and integrated government information and communication centers Strategic Targets Departmental Indicators Key departments

Chapter 3: Strategic Agenda and Policy Guideline
Tshwane IDP 2006 – 2011 First Revision 106
2006/07 2007/08 2008/9 2009/10 2010/2011 4.4.1 Provide integrated multipurpose centres in line with needs and with key partners by 2010
Identify needs and baseline
CP&D: 2 city37 planning information desks to be established
2 2 2 (Depending on budget availability- SRAC)
Nr of one stop and/or multipurpose centres provided in communities
SRAC to lead38 City Planning and regions to contribute.
KPI: Nr of service delivery areas that comply with Batho Pele norms and standards
Target: All areas of service delivery comply by 2010
KPA: 4.5 Entrench a customer focused approach to citizenry and business by setting standards that we achieve guided by the Batho Pele principles. (linked to KPA 5.4) Departmental targets
Annual Targets Key departments
2006/07 2007/08 2008/9 2009/10 2010/2011
Departmental Indicators
4.5.1 Implementation of norms, standards, guidelines and operating procedures in line with Batho Pele principles for all areas of service
Establish norms for responsiveness
Establish norms and procedures for service delivery areas
Partial implementation
Full implementation Review Degree of compliance of COT service delivery to Batho Pele norms and standards
EMMM (CC)
37 Establish city planning information desks in existing centres 38 SRAC targets depend on availability of budget
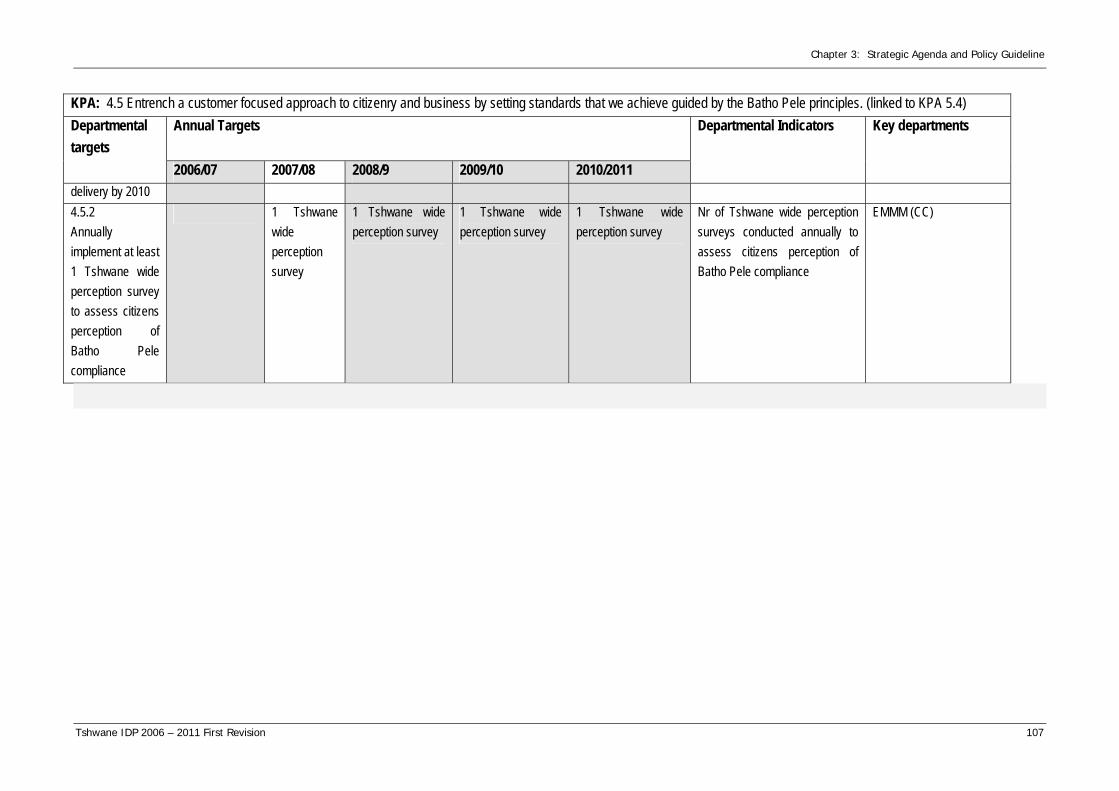
Chapter 3: Strategic Agenda and Policy Guideline
Tshwane IDP 2006 – 2011 First Revision 107
KPA: 4.5 Entrench a customer focused approach to citizenry and business by setting standards that we achieve guided by the Batho Pele principles. (linked to KPA 5.4) Departmental targets
Annual Targets Key departments
2006/07 2007/08 2008/9 2009/10 2010/2011
Departmental Indicators
delivery by 2010 4.5.2 Annually implement at least 1 Tshwane wide perception survey to assess citizens perception of Batho Pele compliance
1 Tshwane wide perception survey
1 Tshwane wide perception survey
1 Tshwane wide perception survey
1 Tshwane wide perception survey
Nr of Tshwane wide perception surveys conducted annually to assess citizens perception of Batho Pele compliance
EMMM (CC)

Chapter 3: Strategic Agenda and Policy Guideline
Tshwane IDP 2006 – 2011 First Revision 108
KPI: Nr of essential stakeholder forums that are working effectively
Targets All essential forums are effective in their functioning by 2011
KPA: 4.6 Establish effective stakeholder forums that are inclusive and foster a non-racial, non-sexist, democratic, caring and prosperous society, focused on achieving the city’s socio-economic goals. (this links with KPA 5.4) Departmental targets
Targets Key departments
2006/07 2007/08 2008/9 2009/10 2010/2011
Departmental Indicators
4.6.1 All established essential forums to have at least 1 meeting per financial year
Implementation of KPI is dependant on the submission to and approval by Council of the stakeholders management strategy
1 CP&D Maintain OMM forum
1 CP&D Maintain OMM forum
1 CP&D Maintain OMM forum
1 CP&D Planning) Maintain OMM forum
Number of meetings scheduled to take place with essential forums per annum
CP&D EMMM
4.6.2 Removed 4.6.3 Removed

Chapter 3: Strategic Agenda and Policy Guideline
Tshwane IDP 2006 – 2011 First Revision 109
Strategic Objective 5: To ensure good governance, financial viability and optimal institutional transformation with capacity to
execute its mandate
KPI: The % of residents of Tshwane who have indicated annually that COT governs well
Target: 95% of COT residents surveyed annually indicated that COT governs well
KPA 5.1 Good governance (please refer to the table on the linkages to this KPA in the beginning of this document) Annual Targets Departmental
targets 2006/07 2007/08 2008/9 2009/10 2010/2011 Departmental Indicators Key departments
5.1.1 Senior Management39 performs all key functions necessary to run the COT
All snr management
CSES (EMS): 1st 2 Departmental management levels Housing, CSS, CPD, A&EM, EMMM, ED, Fin, all snr management W&S: 9 R&SW: 8
CSES (EMS): 1st 2 Departmental management levels W&S: 9 R&SW: 8 Housing, CSS, CPD, A&EM, EMMM, ED, Fin, CSES (EMS: all snr management
CSES (EMS): 1st 2 Departmental management levels W&S: 9 R&SW: 8 Housing, CSS, CPD, A&EM, EMMM, ED, Fin, all snr management
CSES (EMS): 1st 2 Departmental management levels W&S: 9 R&SW: 8 Housing, CSS, CPD, A&EM, EMMM, ED, Fin: all snr management
Nr of senior managers that directly perform the list of key management functions as determined by the EM (including business planning, performance management, risk management, and financial management)40
All departments
5.1.2 The COT complies with all relevant
100%
CSES (EMS): 100%
CSES (EMS): 100%
CSES (EMS): 100% 100% :CP&D
CSES (EMS): 100% 100% :CP&D
% compliance to all relevant legislation, policies and procedures41
EMMM (IA) to conduct compliance reviews annually.
39 Manager upwards (R&SW) 40 List of key functions to be standardised and circulated 41 The list of policies and legislation to be defined for each department

Chapter 3: Strategic Agenda and Policy Guideline
Tshwane IDP 2006 – 2011 First Revision 110
KPA 5.1 Good governance (please refer to the table on the linkages to this KPA in the beginning of this document) Annual Targets Departmental
targets 2006/07 2007/08 2008/9 2009/10 2010/2011 Departmental Indicators Key departments
legislation, and where it cannot comply obtains permission from the relevant authority.
100% : fin 100% CS 100% housing 100% :CP&D 100%: A&EM 100%: W&S 100%: ED R&SW: 100% Other departments no targets
100% :CP&D 100% CS 100% housing 100%: A&EM 100%: W&S 100%: R&SW 100%: ED 100% : fin Other departments no targets
100% CS 100% housing 100%: A&EM 100%: W&S 100%: R&SW 100%: ED 100% : fin Other departments no targets
100% CS 100% housing 100%: A&EM 100%: W&S 100%: R&SW 100%: ED 100% : fin
All departments to comply
5.1.3 COT achieves unqualified audits annually
No qualifications
Zero: R&SW Zero: Fin Zero : CS Zero: CSES (CSES(TMPS)) Zero: ED < 3 housing < 3 : CP&D <3: A&EM: W&S 100%
Zero: R&SW Zero: ED Zero: Fin Zero: CSES (CSES(TMPS)) Zero : CS Zero housing Zero: CP&D Zero: A&EM W&S 100%
Zero: R&SW Zero : CS Zero: Fin Zero: ED Zero: CSES (CSES(TMPS)) Zero: CP&D Zero housing Zero: A&EM W&S 100%
Zero housing Zero: CP&D Zero: Fin Zero: CSES (CSES(TMPS)) Zero: ED Zero: A&EM W&S 100%
Number of Qualifications to the annual audit report
All departments

Chapter 3: Strategic Agenda and Policy Guideline
Tshwane IDP 2006 – 2011 First Revision 111
KPI: a) % of municipal debt over 90 days
b) Efficiency gains in Rand value due to the implementation of alternate service delivery mechanisms
Target: a) Reduce municipal debt over 90 days from 78% to 70% by 2011.
b) Comparison of expenditure prior to and after implementation of alternate service delivery mechanisms shows savings by
2011.
KPAs 5.2 Sustainability management Annual Targets Departmental
targets 2006/07 2007/08 2008/9 2009/10 2010/2011 Departmental Indicators Key departments
Metro RED
Establish the Metro Red
Electricity
Tshwane Economic Development Agency (TEDA)
Establish TEDA
Rand value efficiency gains
Rand value efficiency gains
Rand value efficiency gains
Economic development
Tshwane Transport Authority (TTA)
Establish TTA Rand value efficiency gains
Rand value efficiency gains
Rand value efficiency gains
Economic development
5.2.1 Establish all municipal entities to ensure smooth service delivery
Tshwane Bus Services Entity
Establish TBSE Complete Sec
Complete Sec 78(3) Investigation
Rand value efficiency gains
Rand value efficiency gains
a) Type of municipal entities established42 and once established: b) Decrease (R) in operational costs of entity vs COT function operational cost Establishment of TBSE will be in line with NLTTA Sec 49 and Council Resolution 28 Sept 06
Economic development
42 RED established in line with National govt restructuring – not Municipal entity but a possible public entity
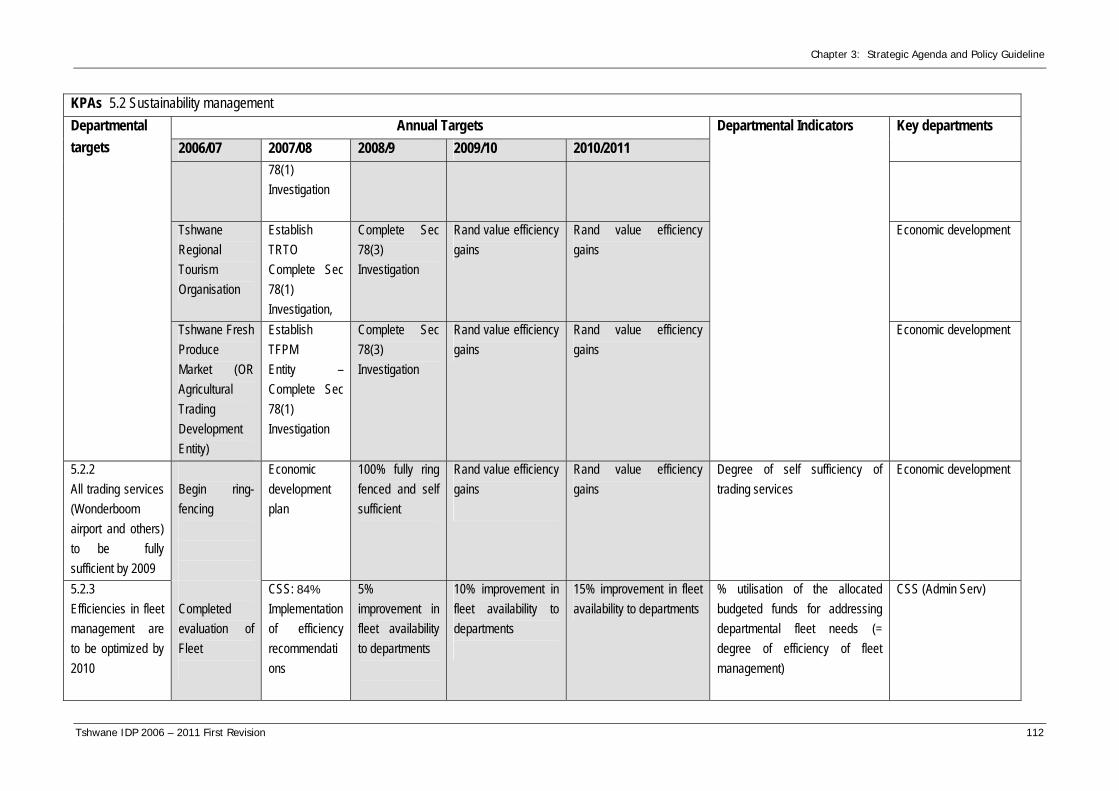
Chapter 3: Strategic Agenda and Policy Guideline
Tshwane IDP 2006 – 2011 First Revision 112
KPAs 5.2 Sustainability management Annual Targets Departmental
targets 2006/07 2007/08 2008/9 2009/10 2010/2011 Departmental Indicators Key departments
78(1) Investigation
Tshwane Regional Tourism Organisation
Establish TRTO Complete Sec 78(1) Investigation,
Complete Sec 78(3) Investigation
Rand value efficiency gains
Rand value efficiency gains
Economic development
Tshwane Fresh Produce Market (OR Agricultural Trading Development Entity)
Establish TFPM Entity – Complete Sec 78(1) Investigation
Complete Sec 78(3) Investigation
Rand value efficiency gains
Rand value efficiency gains
Economic development
5.2.2 All trading services (Wonderboom airport and others) to be fully sufficient by 2009
Begin ring-fencing
Economic development plan
100% fully ring fenced and self sufficient
Rand value efficiency gains
Rand value efficiency gains
Degree of self sufficiency of trading services
Economic development
5.2.3 Efficiencies in fleet management are to be optimized by 2010
Completed evaluation of Fleet
CSS: 84% Implementation of efficiency recommendations
5% improvement in fleet availability to departments
10% improvement in fleet availability to departments
15% improvement in fleet availability to departments
% utilisation of the allocated budgeted funds for addressing departmental fleet needs (= degree of efficiency of fleet management)
CSS (Admin Serv)

Chapter 3: Strategic Agenda and Policy Guideline
Tshwane IDP 2006 – 2011 First Revision 113
KPAs 5.2 Sustainability management Annual Targets Departmental
targets 2006/07 2007/08 2008/9 2009/10 2010/2011 Departmental Indicators Key departments
5.2.4 All council buildings are compliant to the OCHSA and COT building regulations by 2011
Completed sss and second phase of the structural analysis of Council buildings
All council properties structurally analysed
Council owned buildings managed by admin services are compliant
All council owned buildings are compliant
Degree of compliance of Council buildings to the requirements of the Occupational Health and Safety Act and to COT building regulations
Corporate Services (Admin Serv)
5.2.5 The COT billing system reflects the entire tax base of COT including new RDP developments.
All business ratepayers
All private and new business, including RDP developments
Update annually
Update annually
Update annually
Nr of rates payers of the COT captured on the billing system as a proportion of the total COT tax base
CSES Finance to lead
5.2.6 Reduce municipal debt over 90 days from 78% to 68% by 2011.
76% over 90 days
74% over 90 days
74% 72% 70% % municipal debt over 90 days Finance
5.2.7 i)5% increase in expected amounts vs accounts billed ii) take no more than 30 days to
100% correct bills
i) 84% ii) 30days
i) 89% ii) 30days
i) 94% ii)30days
i) 99% ii) 30days
i) % expected vs. actual accounts billed ii) improve response times to customer enquiries
Finance

Chapter 3: Strategic Agenda and Policy Guideline
Tshwane IDP 2006 – 2011 First Revision 114
KPAs 5.2 Sustainability management Annual Targets Departmental
targets 2006/07 2007/08 2008/9 2009/10 2010/2011 Departmental Indicators Key departments
respond to customer queries 5.2.8 All revenue generation targets are realized by departments that generate revenue
90%
95% CS 100% EMMM 100% CSES (R805 000- EMS) 55% housing 90% SRAC 98% CP&D 95% A&EM 100% Fin W&S 90% 90%: electr. 95%: ED
90% CS 100% EMMM 92% Fin 90% SRAC 90%: electr 60% housing 98% CP&D 97% A&EM W&S 90% 95%: ED 100% CSES (R845 250 –EMS)
95% CS 100% EMMM 90% SRAC 95%: electr 65% housing 98% CP&D 98% A&EM W&S 90% 95%: ED 100% CSES (R887 513- EMS) 94% Fin
96% Fin 100% EMMM 70% housing 98% CP&D 98% A&EM 90% CSES 95%: ED 90% SRAC (R931 888- EMS) W&S 90%
% of planned revenue targets realised43
Finance to lead. All departments incl. finance to achieve
5.2.9 Revenue collection via the courts/legal processes should increase by 5% pa
5%
5%
5%
5%
5%
% increase in revenue collection through legal processes
Legal and secretarial
5.2.10 Formulate and implement environmental
10
20 20 20 20 Number of projects to be implemented
Agriculture and environmental management
43 This target be translated into R amounts by each department

Chapter 3: Strategic Agenda and Policy Guideline
Tshwane IDP 2006 – 2011 First Revision 115
KPAs 5.2 Sustainability management Annual Targets Departmental
targets 2006/07 2007/08 2008/9 2009/10 2010/2011 Departmental Indicators Key departments
resource management, strategies, systems and projects to promote corporate environmental compliance 5.2.11 Increase meter reading by 2% per annum.
80%
82% 84% 86% 88% % of total meters read Finance
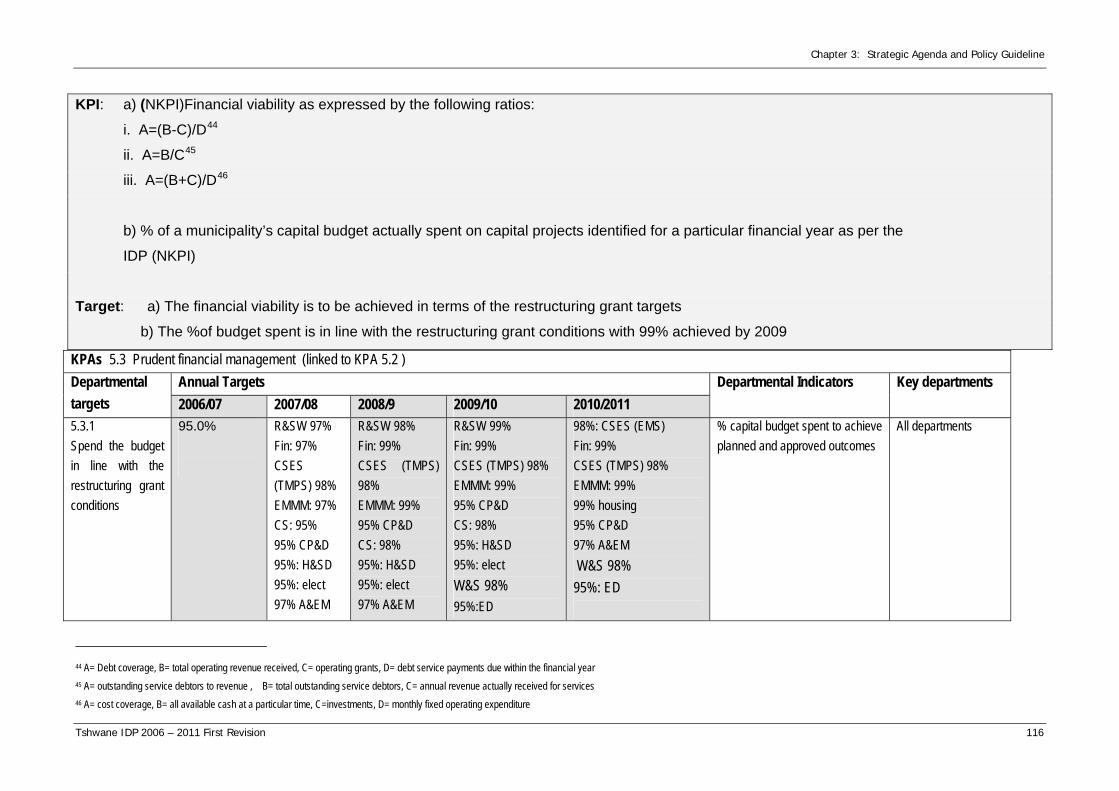
Chapter 3: Strategic Agenda and Policy Guideline
Tshwane IDP 2006 – 2011 First Revision 116
KPI: a) (NKPI)Financial viability as expressed by the following ratios:
i. A=(B-C)/D44
ii. A=B/C45
iii. A=(B+C)/D46
b) % of a municipality’s capital budget actually spent on capital projects identified for a particular financial year as per the
IDP (NKPI)
Target: a) The financial viability is to be achieved in terms of the restructuring grant targets
b) The %of budget spent is in line with the restructuring grant conditions with 99% achieved by 2009
KPAs 5.3 Prudent financial management (linked to KPA 5.2 ) Annual Targets Departmental
targets 2006/07 2007/08 2008/9 2009/10 2010/2011 Departmental Indicators Key departments
5.3.1 Spend the budget in line with the restructuring grant conditions
95.0%
R&SW 97% Fin: 97% CSES (TMPS) 98% EMMM: 97% CS: 95% 95% CP&D 95%: H&SD 95%: elect 97% A&EM
R&SW 98% Fin: 99% CSES (TMPS) 98% EMMM: 99% 95% CP&D CS: 98% 95%: H&SD 95%: elect 97% A&EM
R&SW 99% Fin: 99% CSES (TMPS) 98% EMMM: 99% 95% CP&D CS: 98% 95%: H&SD 95%: elect W&S 98% 95%:ED
98%: CSES (EMS) Fin: 99% CSES (TMPS) 98% EMMM: 99% 99% housing 95% CP&D 97% A&EM W&S 98% 95%: ED
% capital budget spent to achieve planned and approved outcomes
All departments
44 A= Debt coverage, B= total operating revenue received, C= operating grants, D= debt service payments due within the financial year 45 A= outstanding service debtors to revenue , B= total outstanding service debtors, C= annual revenue actually received for services 46 A= cost coverage, B= all available cash at a particular time, C=investments, D= monthly fixed operating expenditure
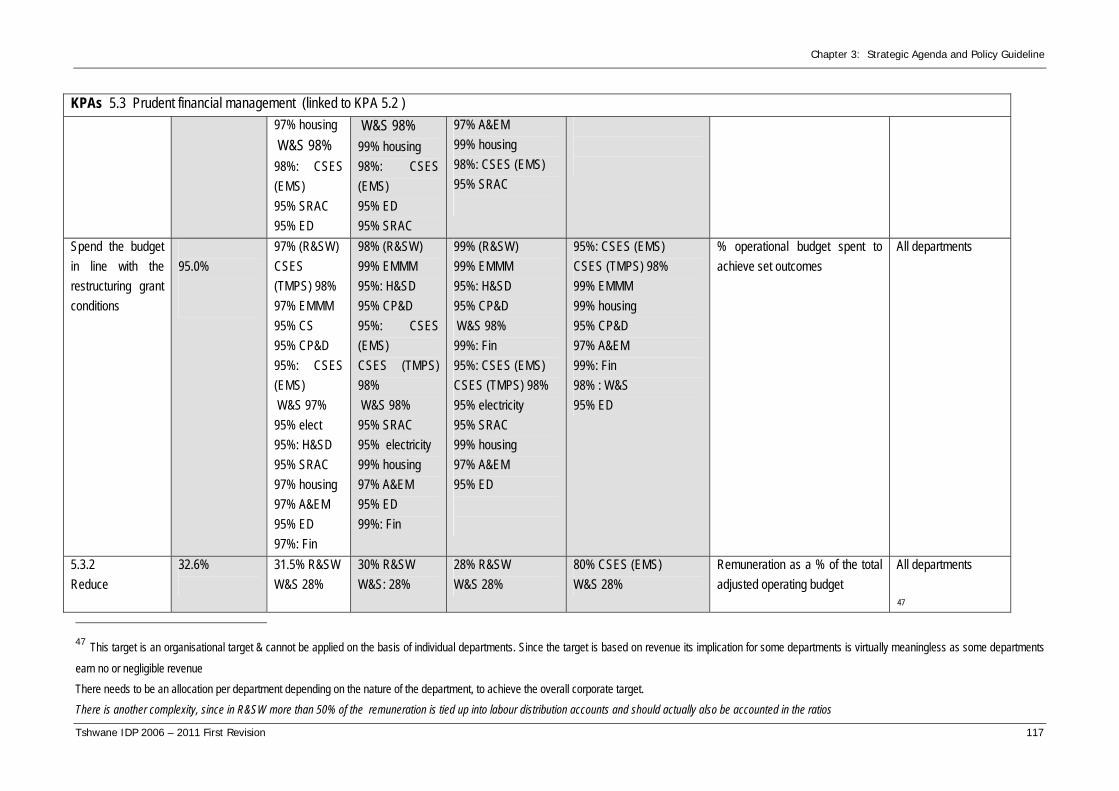
Chapter 3: Strategic Agenda and Policy Guideline
Tshwane IDP 2006 – 2011 First Revision 117
KPAs 5.3 Prudent financial management (linked to KPA 5.2 ) 97% housing W&S 98% 98%: CSES (EMS) 95% SRAC 95% ED
W&S 98% 99% housing 98%: CSES (EMS) 95% ED 95% SRAC
97% A&EM 99% housing 98%: CSES (EMS) 95% SRAC
Spend the budget in line with the restructuring grant conditions
95.0%
97% (R&SW) CSES (TMPS) 98% 97% EMMM 95% CS 95% CP&D 95%: CSES (EMS) W&S 97% 95% elect 95%: H&SD 95% SRAC 97% housing 97% A&EM 95% ED 97%: Fin
98% (R&SW) 99% EMMM 95%: H&SD 95% CP&D 95%: CSES (EMS) CSES (TMPS) 98% W&S 98% 95% SRAC 95% electricity 99% housing 97% A&EM 95% ED 99%: Fin
99% (R&SW) 99% EMMM 95%: H&SD 95% CP&D W&S 98% 99%: Fin 95%: CSES (EMS) CSES (TMPS) 98% 95% electricity 95% SRAC 99% housing 97% A&EM 95% ED
95%: CSES (EMS) CSES (TMPS) 98% 99% EMMM 99% housing 95% CP&D 97% A&EM 99%: Fin 98% : W&S 95% ED
% operational budget spent to achieve set outcomes
All departments
5.3.2 Reduce
32.6%
31.5% R&SW W&S 28%
30% R&SW W&S: 28%
28% R&SW W&S 28%
80% CSES (EMS) W&S 28%
Remuneration as a % of the total adjusted operating budget
All departments 47
47 This target is an organisational target & cannot be applied on the basis of individual departments. Since the target is based on revenue its implication for some departments is virtually meaningless as some departments
earn no or negligible revenue There needs to be an allocation per department depending on the nature of the department, to achieve the overall corporate target. There is another complexity, since in R&SW more than 50% of the remuneration is tied up into labour distribution accounts and should actually also be accounted in the ratios

Chapter 3: Strategic Agenda and Policy Guideline
Tshwane IDP 2006 – 2011 First Revision 118
KPAs 5.3 Prudent financial management (linked to KPA 5.2 ) remuneration as a % of the total adjusted operating revenue in line with the restructuring grant conditions
28% elec 31% CS 31 % Fin 80% CSES (EMS) 22% housing 81% CP&D 38% A&EM 47% ED
28% electricity 28% fin 80% CSES (EMS) 22% housing 80% CP&D 37% A&EM 47% ED
28% electricity 80% CSES (EMS) 22% housing 79% CP&D 36% A&EM 47% ED
22% housing 78% CP&D 35% A&EM 47% ED
(CSES) TMPS removed since its operations driven, there will never be a decrease
5.3.3 Achieve a credit rating as follows: Short term: A1
Long term : A+
To maintain
To maintain To maintain To maintain To maintain Municipal credit rating Finance
5.3.4 Ensure that 99% of all creditors are paid within 30 days by 2010.
98%
98%
98%
99%
99%
% of creditors paid within 30 days in relation to total creditors
Finance
KPI: % of residents surveyed who indicated satisfaction with COT responsiveness

Chapter 3: Strategic Agenda and Policy Guideline
Tshwane IDP 2006 – 2011 First Revision 119
Target: 80% of residents surveyed annually indicate they are satisfied with COT responsiveness
KPAs 5.4 Local government responsiveness to its residents (linked to KPA 5.5) Annual Targets Departmental
targets 2006/07 2007/08 2008/9 2009/10 2010/2011 Departmental indicators Key departments
5.4.1 Address 87.6% of calls on time
83.60%
75% (R&SW) EMMM: 84.6% Water: 75% in 48 hrs Sanitation: 80% in 8 hrs ED: 75% Establish baseline: CP&D, housing and A&EM
88.3% (R&SW EMMM: 85.6% Water: 75% in 48 hrs Sanitation: 80% in 8 hrs ED: 80% 10% improvement on baseline: CP&D, housing and A&EM
89.2% (R&SW) EMMM: 86.6% Water: 75% in 48 hrs Sanitation: 80% in 8 hrs ED: 85% 10% escalation: CP&D, housing and A&EM
EMMM: 87.6% Water: 75% in 48 hrs Sanitation: 80% in 8 hrs ED: 85% 10% escalation: CP&D, housing and A&EM
% of telephone calls addressed on time
Customer care to ensure customer surveys All departments

Chapter 3: Strategic Agenda and Policy Guideline
Tshwane IDP 2006 – 2011 First Revision 120
KPAs 5.4 Local government responsiveness to its residents (linked to KPA 5.5) Annual Targets Departmental
targets 2006/07 2007/08 2008/9 2009/10 2010/2011 Departmental indicators Key departments
5.4.2 Provide the right information to callers on their first call.
83.60%
Establish baseline; CP&D, A&EM, Housing 85%; ED
10% improvement on baseline: CP&D, housing and A&EM 85%: ED All other departments no direct targets
10% escalation; CP&D, housing and A&EM 85%: ED All other departments no direct targets
10% escalation: CP&D, housing and A&EM 85%: ED All other departments no direct targets
% of callers that receive the right information with the first call48
Customer care to ensure surveys All departments that have call centres.
5.4.3 Completion of norms, standards and operating procedures for all urgent complaints and calls within 6 months of 06/07 and full implementation by end 06/07
Completion And full implementation
Annual review and implementation
Annual review and implementation
Annual review and implementation
Annual review and implementation
Timeframe for completion and implementation of customer care/response norms and standards
OMM (customer care)
48 To measure this indicator consistently and reliably, one would need a call logging system such as can be provided for by a call centre. The suggestion is therefore to limit this indicator to those departments that have call centres (electricity, EMS, CC etc

Chapter 3: Strategic Agenda and Policy Guideline
Tshwane IDP 2006 – 2011 First Revision 121
KPI: The degree to which COT programmes, projects and initiatives respond to the needs and priorities of its
communities
Target: Improve service delivery such that all programmes, projects and initiatives make a positive impact on the communities as per their
identified needs and priorities
KPAs 5.5 Performance monitoring and evaluation (linked to KPA 5.1) Departmental targets
Annual Targets
2006/07 2007/08 2008/9 2009/10 2010/2011
Departmental Indicators Key departments
5.5.1 Removed 5.5.2 All programmes, projects and initiatives must be planned for developmental impact
1 cross cutting and high impact programme
50% of programmes
All initiatives
All programmes
All projects
Nr of projects /programmes/ initiatives that are planned for developmental impact (incorporates developmental targets)
EMMM (Strategy and operations)

Chapter 3: Strategic Agenda and Policy Guideline
Tshwane IDP 2006 – 2011 First Revision 122
(incorporates developmental targets

Chapter 3: Strategic Agenda and Policy Guideline
Tshwane IDP 2006 – 2011 First Revision 123
KPI: degree of integration between the COT and other spheres of government in the delivery of critical programmes or
initiatives
Target: achieve full integration of the delivery of critical programmes by 2011
KPAs 5.6 Ensure cooperative governance (IGR) Departmental targets
Annual Targets
2006/07 2007/08 2008/09 2009/10 2010/2011
Departmental Indicators Key departments
5.6.1 Ensure that all critical national and provincial programmes are integrated into the IDP
New IDP
Annual review
Annual review
Annual review
Annual review Nr of national and provincial programmes that directly impact on COT incorporated into the IDP.
EMMM
5.6.2 All initiatives that are identified as critical to the COT
All critical as identified
All critical as identified
All critical as identified
All critical as identified
All critical as identified
Nr of new critical COT programmes/ projects or initiatives that are implemented in partnership with other spheres of government.
EMMM (Strategy and operations )
5.6.3 Develop and implement participatory governance procedures in COT that are in line with the best practices of other
Implementation of provincial sectoral forums, inter-municipal forums with adjoining municipalities, Forum for
Implementation of provincial sectoral forums, inter-municipal forums with adjoining municipalities, Forum for
Implementation of provincial sectoral forums, inter-municipal forums with adjoining municipalities, Forum for diplomatic community, centralised IGR agenda and agreements, IGR
Implementation of provincial sectoral forums, inter-municipal forums with adjoining municipalities, Forum for diplomatic community, centralised IGR agenda and agreements, IGR
Types of participatory governance procedures implemented.
EMMM (marketing and communications

Chapter 3: Strategic Agenda and Policy Guideline
Tshwane IDP 2006 – 2011 First Revision 124
KPAs 5.6 Ensure cooperative governance (IGR) government institutions
diplomatic community, centralised IGR agenda and agreements, IGR strategy and conflict resolution procedures.
diplomatic community, centralised IGR agenda and agreements, IGR strategy and conflict resolution procedures
strategy and conflict resolution procedures
strategy and conflict resolution procedures
KPI: The degree to which COT risk management practices reflect international best practice, norms and standards
Target; All COT risk management practices in line with international best practice and norms and standards by end 2008/09
KPA 5.7 Perform risk management Departmental targets
Annual Targets
2006/07 2007/08 2008/9 2009/10 2010/2011
Departmental Indicators Key departments
5.7.1 Decrease the legal claims against the municipality by 1.5% per annum
1.5%
25% 1.5%
1.5%
1.5%
% decrease in legal claims against the municipality
Legal and secretarial
5.7.2 Reduce labour claims by 10% per annum
10%
15%
10%
10%
10%
% reduction in labour claims Legal and secretarial

Chapter 3: Strategic Agenda and Policy Guideline
Tshwane IDP 2006 – 2011 First Revision 125
KPA 5.7 Perform risk management Departmental targets
Annual Targets
2006/07 2007/08 2008/9 2009/10 2010/2011
Departmental Indicators Key departments
5.7.3 Reduce controllable insurance claims by 2% per annum
2%
5%: R&SW 10%: CSES(TMPS)) 2%: A&EM 2% housing 2%: CP&D 2% ;CS 2% H&SD 2% W&S 2%: ED 2%: Fin CSES (EMS): 2%
5% R&SW 2%: A&EM 2% housing 15% CSES(TMPS) 2%: CP&D 2% CS 2% H&SD 2% W&S 2%: ED 2%: Fin CSES (EMS): 2%
5% R&SW 2%: A&EM 20%: (CSES(TMPS)) 2% housing 2% CS 2% H&SD 2%: CP&D 2% W&S 2%: ED 2%: in CSES (EMS): 2%
2% housing 2%: CP&D 30% : CSES (CSES(TMPS)) 2%: A&EM 2% W&S 2%: ED 2%: Fin CSES (EMS): 2%
% decrease in insurance claims due to controllable events49 Proposed 07/08 cycle:
Finance to drive All departments to achieve Finance to lead. All departments to contribute
5.7.4 Implement Risk management practices such that by end 06/07 the city practices reflect international norms, standards and best practice
Full roll out of COT risk management at all service delivery levels
40% CSES (EMS): 100% of corporate target
60% CSES (EMS): 100% of corporate target
75% CSES (EMS): 100% of corporate target
75% CSES (EMS): 100% of corporate target
% compliance to principles of Gap ANALYSIS by departments
Finance to lead All departments (incl Finance) to comply through take up in business plans.
49 A limit be set, as certain departments may be functioning well. For example, CSES (EMS): Manage claims to remain on FY 06/07 status quo

Chapter 3: Strategic Agenda and Policy Guideline
Tshwane IDP 2006 – 2011 First Revision 126
KPA 5.7 Perform risk management Departmental targets
Annual Targets
2006/07 2007/08 2008/9 2009/10 2010/2011
Departmental Indicators Key departments
5.7.5 Reduce the cost of insurance by 0.005% per annum
0.005%
0.005%
0.005%
0.005%
0.005%
% reduction in cost of insurance per annum
Finance
KPI: a)% of human resource practices that reflect best practice and compliance with legislation
b) % of rare and essential skills retained per job category
c) % of municipality’s budget spent on implementing its workplace skills plan (NKPI)
Target; a) 75% of all COT human resource practices are in line with international best practice, norms and standards, and 100% comply with
legislation.
b) Ensure that 70% essential and rare skills per job category are retained by 2011
c) Achieve national norms and standards by 2011 in terms of the % of the budget to be spent on implementing the workplace skills plan.
KPAs 5.8 Sound human resource management (linked to KPA 5.12, 5.15, 5.17) Departmental targets
Annual Targets
2006/07 2007/08 2008/9 2009/10 2010/2011
Departmental Indicators Key departments
5.8.1 100%
40%
60% CS
30%
100% by end 2009
Annual review and update
%implementation of HR transformation plan in line with legislation and best practice
Corporate Services (HR)

Chapter 3: Strategic Agenda and Policy Guideline
Tshwane IDP 2006 – 2011 First Revision 127
implementation of HR transformation plan by 2009
5.8.2 (a) 50% decrease in Grievances by 2011
10% decrease in grievances
20% CS and Other relevant departments CSES (EMS): 12%
15% CS and Other relevant departments CSES (EMS): 12%
10% CS and Other relevant departments CSES (EMS): 12%
5% CS and Other relevant departments CSES (EMS): 14%
% decrease in grievances Corporate Services (HR) to lead. Including all departments reducing grievances within own departments (up to step 2 of the grievance procedure)
5.8.2 (b) Design Interventions to assist org. to manage grievances
Annual Report To be determined To be determined To be determined Monitor & Report Corporate Services (HR)
5.8.350 An average of 20 learners per department complete learnership programmes with the relevant SETA’s by 2011
80
100 citywide Electr: 1 CS: 100
Electr: 2 Electr: 1
Nr of learners per department completing learnership programmes with the relevant SETA’s
Corporate services (HR)
5.8.4 RPL at least 1000
200
Electricity: 200 CS: 200 p.a.
Electricity: 200
Electricity: 200
Nr of employees that have been taken through the RPL process
Corporate services (HR) to lead with
50 Was originally in KPA 5.15

Chapter 3: Strategic Agenda and Policy Guideline
Tshwane IDP 2006 – 2011 First Revision 128
employees in the COT
CS: Subject to SETA accreditation
other departments:
5.8.5 Improve organisational skills capacity by at least 5% per annum
5%
5%51 5% 5%
5%
% improvement in organisational skills capacity per annum
Corporate Services (HR)
KPI: Degree of response of ICT to organisational service delivery needs
Target Ensure integrated systems that support service delivery and ensure accountability by 2008
KPAs 5.9 e-governance (ICT and digital Hub) 5.9.1 Implement at least 10 IT related initiatives that take government closer to the people by 2011
3 2 (H&SD) 3 (CS)
1-Indigent Register 1-Indigent Register
1-Indigent Register Nr of IT related initiatives implemented that take government closer to the people
H&SD CS
5.9.2 SAP system to ensure support for integrated planning, budgeting, delivery and performance management
Integration of planning and budgeting aspects into the system
95% (of org service delivery needs met)
Degree of integration of the SAP system
Corporate services (IMD)
5.9.3 As per service level As per service level As per service level As per service As per service level Timeframe for provision Corporate Services
51 This is an increase on the baseline each year

Chapter 3: Strategic Agenda and Policy Guideline
Tshwane IDP 2006 – 2011 First Revision 129
All operational ICT support is provided in line with service level agreements.
agreements
agreements agreements level agreements agreements of internal support/maintenance to departments
(IMD)
5.9.4 The Infrastructure services framework should be fully aligned to the COT service delivery targets by end 06/07 and fully implemented by end 7/08 financial year.
Alignment with COT service delivery targets
Implementation of ICT strategy
Timeframe for alignment and implementation of the infrastructure services framework
Corporate services (IMD)
KPAs 5.10 Establishment of Public Accounts Committee (a strategic initiative linked to KPA 5.1) Strategic targets Targets 2006/07 2007/08 2008/9 2009/10 2010/2011
Indicators Key departments
5.10.1 The public accounts committee should be established by end of 06/07
Full establishment
Conduct audit reviews
Conduct audit reviews
Conduct audit reviews
Conduct audit reviews
Timeframe for the establishment of a public accounts committee
Office of the EM/MM

Chapter 3: Strategic Agenda and Policy Guideline
Tshwane IDP 2006 – 2011 First Revision 130
KPI: % of residents surveyed who indicated satisfaction with COT responsiveness
Target: 80% of customers surveyed annually indicate that they are satisfied with COT responsiveness
KPAs 5.11 Customer relations management/Batho pele principles (a strategic initiative linked to KPA 5.4) Targets Departmental
targets 2006/07 2007/08 2008/9 2009/10 2010/2011 Indicators Key departments
5.11.1 60% of employees trained on CRM by 2011
2% 10% 30% 18%52
% of COT employees trained on customer relations management
OMM (customer care) Corporate services (HR)
5.11.2 95% of complaints responded to within 14 days by 2011
Establish a baseline
CSES (EMS) 95% 5% W&S A&EM, CPD, Housing : Determine baseline
CSES (EMS) 95% Housing -5% CP&D; -5% A&EM: -5% 5% W&S
CSES (EMS) 95% Housing -5% CPD: -5% A&EM: -5% 5% W&S
CSES (EMS) 95% Housing -5% CPD: -5% A&EM: -5% 5% W&S
% of complaints (telephonic and written responded to within 14
OMM (customer care) to lead. All departments.
KPI: The level to which the organisational structure supports the achievement of the 5 yr programme
Target: The organisational structure is 100% aligned to deliver on the COT strategic objectives by 2009
KPAs 5.12 review and align the organisational structure to the strategic objectives (linked to KPA 5.8 and 5.14) Targets Departmental
targets 2006/07 2007/08 2008/9 2009/10 2010/2011 Indicators Key departments
5.12.2 The new structure should be fully
Begin implementation
100% Implementation by year 2
Timeframe for the implementation of new organisational structure
CSS (HR) EMMM
52 projected

Chapter 3: Strategic Agenda and Policy Guideline
Tshwane IDP 2006 – 2011 First Revision 131
KPAs 5.12 review and align the organisational structure to the strategic objectives (linked to KPA 5.8 and 5.14) Targets Departmental
targets 2006/07 2007/08 2008/9 2009/10 2010/2011 Indicators Key departments
implemented within 1 financial year
KPI: The degree to which the culture of the COT achieves good governance and service delivery (Nr of critical bottlenecks to service delivery)
Target: All critical bottlenecks in service delivery are removed by 2008
KPAs 5.13 promote a new organisational culture (linked to KPA 5.1 and 5.14) Annual Targets Key departments Departmental
targets 2006/07 2007/08 2008/9 2009/10 2010/2011 Indicators
5.13.1 Achieve a change in culture that addresses critical bottlenecks in service delivery
Systems and processes
a report proposing an organisational culture change.
Knowledge management
Culture, management, leadership
Culture, management, leadership
Aspects of culture change achieved
OMM Corporate services (HR)

Chapter 3: Strategic Agenda and Policy Guideline
Tshwane IDP 2006 – 2011 First Revision 132
KPI: % alignment and integration between individual, organisational and financial management
Target Achievement of a 100% integrated and aligned performance management system in COT by 2008
KPAs 5.14 Review current performance management system and re-align to new priorities ((a strategic initiative linked to KPA 5.1) Strategic targets Targets 2006/07 2007/08 2008/9 2009/10 2010/2011
Departmental indicators Key departments
5.14.1 Review current performance management system within 6 months of 06/07 financial year and conduct annual reviews.
Performance management system reviewed by December 2006
Annual review Annual review Annual review Annual review Timeframe for the review of the performance management system.
OMM responsible for Automated PMS CSS (HR)
5.14.2 Cascade the performance management system to all levels of the organisation by 2010
4
4 R&SW 4:ED 4: Public works: W&S 6 CS 5 housing 5 CP&D 5 A&M 5 EMMM 5 CSES (EMS)
5 R&SW 5:ED 5: Public works: W&S 6 housing 6 CP&D 6 A&EM 6 CSES (EMS) 6 EMMM
6 R&SW 6:ED 6: Public works: W&S All housing All CP&D ALL A&EM All EMMM All CSES (EMS)
7 CS 7:ED All housing 7: Public works: W&S All CP&D All A&EM All CSES (EMS) All EMMM
Levels to which the individual performance management system is cascaded
All departments (Led by HR in CSS )
5.14.3 Individual and organisation performance
Automated PMS
Implementation of IT system for organization performance
Degree of systems integration between organisational performance monitoring and individual performance
CSS (IMD)

Chapter 3: Strategic Agenda and Policy Guideline
Tshwane IDP 2006 – 2011 First Revision 133
KPAs 5.14 Review current performance management system and re-align to new priorities ((a strategic initiative linked to KPA 5.1) Strategic targets Targets 2006/07 2007/08 2008/9 2009/10 2010/2011
Departmental indicators Key departments
monitoring and individual performance
monitoring monitoring must be fully integrated and supported by IT systems by 2009 95%. % of SAP systems up &
running CSS(IMD)
KPA 5.15 Skills audit: recruitment, retention and succession planning ( a strategic city initiative which forms part of KPA 5.8) Therefore dealt with in 5.8
KPI: The number of people from employment equity target groups employed per organisational level in compliance with the municipality’s EE plan.
(NKPI)
Target: Annually achieve the targets set out in the municipality’s EE plan thereby achieving 100% of the EE plan by 2011
KPAs 5.16 Ensure employment equity Departmental targets
Annual Targets Key departments
2006/07 2007/08 2008/9 2009/10 2010/2011
Indicators
5.16.1 Achieve 90% representation of designated groups in the institution by 2011
22,5% incrementally over the next five years
97% (R&SW)/ or 4 ppl from ass. Man upwards 75% housing 80% CSES (EMS) 100% CSES (CSES(TMPS)) 75% CP&D
96% (R&SW) 80% housing R&SW: 4 ppl from ass. Man upwards 85% CSES (EMS) 100% CSES (CSES(TMPS))
97% (R&SW)or 4 ppl from ass. Man upwards 85% housing 85%: ED 85.6%: Fin 90% CSES (EMS)
90% CSES (EMS) 90% housing 90% CP&D 90%: Public works: W&S 90%: ED 86.1%: Fin 100% CSES
% of newly appointed employees from EE target groups
Lead department; C&SS All departments

Chapter 3: Strategic Agenda and Policy Guideline
Tshwane IDP 2006 – 2011 First Revision 134
KPAs 5.16 Ensure employment equity Departmental targets
Annual Targets Key departments
2006/07 2007/08 2008/9 2009/10 2010/2011
Indicators
75%: A&EM
75%: ED 80%: Public works: W&S 85.1%: Fin 70% CS
80% CP&D 80%: ED 85.1%: Fin 80%: A&EM 82%: Public works: W&S
100% CSES (CSES(TMPS)) 85% CP&D 85%: A&EM 85%: Public works: W&S
(CSES(TMPS))
KPAs 5.17 Human resource development plan (This is a city strategic initiative linked to KPA 5.8.) Moved to 5.8.5 due to it being a strategic initiative of 5.8
KPA 5.18 Enhance Capital City status Targets Departmental
targets 2006/07 2007/08 2008/9 2009/10 2010/2011 Departmental Indicators
Key departments
5.18.1 Increase the nr of publicity incidents after launching the FIA.
Establish baseline
4 advertisements EMMM
4 advertisements (EMMM)
4 advertisements (EMMM)
4 advertisements (EMMM)
Nr of publicity incidents generated after launching FIA.
OMM

Chapter 3: Strategic Agenda and Policy Guideline
Tshwane IDP 2006 – 2011 First Revision 135
3.2.6 STRATEGIC DIRECTIVES AND INITIATIVES COMPLEMENTARY TO THE 5YP
The 5YP is the principal strategic plan in the City of Tshwane and is the vehicle to develop
and grow the CoT into a successful city. It is complemented and supported by the
following sectoral strategies or initiatives.
3.2.6.1 THE CITY DEVELOPMENT STRATEGY
The City Development Strategy expresses the long term vision for the development of the
City of Tshwane. Due to changes in the development arena, as well as the absence of
clear 5, 10, 15, and 20 year end state targets for the achievement of the CDS, the
following should occur:
• The CDS should be reviewed against national and provincial imperatives, and aligned
where necessary;
• The targets and programmes of the 5YP should form the first five year
implementation plan of the CDS; and
• An implementation programme should be developed for the CDS which sets out the
key targets for the outer years in five year intervals.
As part of the City Development Strategy, 15 strategic projects were identified for
implementation in the City of Tshwane. The details pertaining to the projects and the
progression status of each of the projects are reflected in a document titled: “Initial Terms
of Reference for progression on the 15 Tshwane Projects” and was prepared in cooperation
with the CDS Project Management Office. The 15 projects identified are as follows:
1. Re Kgabisa Tshwane
2. Munitoria
3. Tshwane Kopanong
4. Urban Renewal and City living
5. Exploring Africaness: Urban arts and culture initiative
6. Tsosoloso
7. Top 20 Townships initiative
8. Establishing a Transport Authority
9. Building the Western Bypass: G 9
10. Metro bus recapitalisation of rolling stock

Chapter 3: Strategic Agenda and Policy Guideline
Tshwane IDP 2006 – 2011 First Revision 136
11. Connecting Tshwane to the Knowledge Economy: The Digital Hub Initiative
12. General development of the Zone of Choice
13. Logistics Cluster and TIFA
14. Working infrastructure
15. 2010 Initiatives
3.2.6.2 ORGANISATIONAL PERFORMANCE MANAGEMENT
This plan will form the basis of performance management for the next five years. The
continuum of performance management must be addressed through processes and
systems, to ensure that there is integration of efforts and integrity of results. This means
that the performance management process will take into consideration the CoT five year
objectives and KPAs, departmental business plans, programmes and projects, and be
cascaded into individual performance management parameters.
3.2.6.3 METROPOLITAN SPATIAL DEVELOPMENT FRAMEWORK (MSDF)
The Metropolitan Spatial Development Framework (MSDF), which is a statutory input into
the IDP, has been approved by the Council on 23 November 2005 (see figure 2.5). The
complete MSDF as approved by Council is hereby acknowledged within the IDP, together
with the eight Regional Spatial Development Frameworks which were compiled as more
detailed annexures to the MSDF. The following provides a short summary of the principles,
objectives and spatial concepts of the MSDF.
The purpose of the MSDF for the city is to provide a spatial representation of the City
Vision and the City Strategy and to be a tool to integrate all aspects of spatial planning
(such as land use planning; planning of pedestrian, vehicular and other movement
patterns; planning regarding buildings and built-up areas; planning of open space systems;
planning of roads and other service infrastructure) as well as to guide all decision-making
processes regarding spatial (physical) development.

Chapter 3: Strategic Agenda and Policy Guideline
Tshwane IDP 2006 – 2011 First Revision 137
Map 3.1: Tshwane SDF

Chapter 3: Strategic Agenda and Policy Guideline
Tshwane IDP 2006 – 2011 First Revision 138
The MSDF for Tshwane has two main focus areas:
• Restructuring the city:
The restructuring focus is to address the structural imbalances created by past
apartheid policies, resulting in a major part of the city and its people being
marginalised and excluded from urban opportunities.
• Economic development and growth:
These are crucial components of the spatial framework, in order to generate means
to support and enhance urban development.
There are various interventions that may be utilised to support the focus areas of the
MSDF, which are based on a number of considerations, which include:
• the importance of linking the people in the city to opportunities;
• directing investments to places where it will have the most effect;
• protecting and enhancing our natural and cultural resources for sustainability and to
enrich our experience of the city, and
• tying the growth of the city strongly into the economic fabric of the larger Gauteng
region.
MSDF Spatial Concept and Proposals
The MSDF has the overall objectives of efficiency, sustainability, equity and liveability,
and image. These overall objectives are supported by specific objectives which are:
• To stimulate development and growth;
• To use future growth and development to restructure Tshwane and to improve urban
performance;
• To ensure sustainable use of environmental resources, their enhancement and
replenishment;
• To use the valuable role of environmental resources to enhance the uniqueness,
ecological sustainability and liveability of the metropolitan area;
Chapter 3: Strategic Agenda and Policy Guideline
Tshwane IDP 2006 – 2011 First Revision 139
• To meet community needs and promote community values and aspirations;
• To ensure that the urban structure has timeless qualities and that it does not short-
sightedly respond to the mere current needs, circumstances and fashion;
• To create new social and economic opportunities and to improve access to the
existing ones;
• To promote the viability of public transport;
• To promote all aspects of spatial integration;
• To enrich people's lives, as well as to enhance the uniqueness and identity of
Tshwane, by means of an interesting urban form and inspiring urban environments;
• To enhance the functionality of the city and its elements;
• To create healthy, comfortable and safe living and working environments for all; and
• To instil business confidence in the metropolitan area as a whole by providing an
enabling spatial framework that supports development.
The spatial restructuring of the Tshwane metropolitan area is the most important aspect of
the total restructuring of the City of Tshwane Metropolitan Municipality. It is the purpose
of the Spatial Development Concept to provide a context for the restructuring by using
five interrelated structuring concepts which include:
• Smart Growth;
• A System of Metropolitan Activity Areas;
• Movement System;
• Urban Lattice; and
• Environmental Linkages.
Smart Growth focuses on intensification and densification of the urban environment to
create a more equitable, efficient, environmentally and financially sustainable urban
dispensation. In terms of the MSDF a number of Metropolitan Activity Areas, Corridors and
Activity Spines are identified. Densification should specifically be focused around these
structuring concepts as first priorities of intervention. Intensification goes hand-in-hand
with this approach to densification and is also structured around the Metropolitan Activity
Areas, Corridors and Activity Spines. The purpose of such higher density residential
development is to provide residential opportunities in environments that are high-intensity,
mixed use, pedestrian friendly and primarily public transport orientated where a number of
economic and social opportunities are available within a relatively compact geographical

Chapter 3: Strategic Agenda and Policy Guideline
Tshwane IDP 2006 – 2011 First Revision 140
area. These areas should also be linked to the Tshwane Open Space System to support
their viability.
The management of urban growth and the importance of protecting and enhancing our
valuable natural resources are also considered in terms of the Smart Growth approach.
The Metropolitan Activity Areas consist of a Capital Core, Urban Cores and Metropolitan
Cores, Specialised Activity Areas, complemented by linear activity areas in the form of
Activity Spines. The configuration of the Metropolitan Activity Areas is therefore a
combination of nodal and linear, linked to the movement system. These Metropolitan
Activity Areas are furthermore in different phases of development – some have already
reached maturity or may even be declining, while others are only seeds of potential.
Residential densification around the Metropolitan Activity Areas is one of the strategies to
ensure the viability of these areas and promote a public transport system.
The Movement System, based on road, rail and air, is proposed as a structuring concept
to:
• Support public transport;
• Promote accessibility of communities to employment, recreation and social
opportunities;
• Protect the mobility function of major arterials and roads;
• Ensure economic competitiveness; and
• Ensure that the movement system directly links with, and is supported by, strong
high intensity nodes and higher density residential developments.
Proposals are made for improving the inter- and intra-city movement, both in terms of road
and rail networks.
The Environmental Structuring Concept relates to:
• Creating a network of open spaces;
• Protecting important environmental areas; and
• Support sustainable urban development practices.

Chapter 3: Strategic Agenda and Policy Guideline
Tshwane IDP 2006 – 2011 First Revision 141
Tshwane’s urban form and identity is closely linked to the influence of its natural and
cultural elements. The developed areas are intimately intertwined with open spaces,
creating a city with a unique character. The spatial development of the city should continue
to value the role and prominence of the natural environment that sustains and informs the
city.
This concept supports the identification and linkage of metropolitan open spaces and
provides a framework for the integration and enhancement of our cultural heritage. The
vision and concepts from the Tshwane Open Space Framework, currently being finalised, is
integrated into this concept.
The Urban Lattice Concept contributes to city structuring by:
• Creating various opportunities for development and growth around the movement
system and urban nodes;
• Supporting efficient service provision;
• Integrating the city by creating linkages between areas; and
• Support public transport.
3.2.6.4 DRAFT CITY OF TSHWANE SPATIAL DEVELOPMENT STRATEGY
The purpose of the Draft Tshwane Spatial Development Strategy is to provide a spatial
strategy that gives effect to the City of Tshwane’s 5YP.
This draft Strategy is therefore primarily a short term investment management tool for the
municipality. However, the document intentionally places the short term investment
framework within the context of a long term spatial restructuring and development horizon,
so as to ensure that any investment that takes place in the short term also subscribe to the
ultimate long term vision of the municipal area. Hence the name, draft Tshwane Spatial
Development Strategy: 2010 and Beyond.
The draft Strategy analysed the municipality’s 5YP, and based on that devised certain
Strategic Development Focus Areas for municipal investment in the city. Although the
focus is primarily on the municipality’s investment, it has a definite impact on private sector
development, as it clearly sets out a development direction for the city, to which all private
development must also adhere. To this effect, the draft Strategy informs the formulation
Chapter 3: Strategic Agenda and Policy Guideline
Tshwane IDP 2006 – 2011 First Revision 142
of the Regional Spatial Development Frameworks, which are the municipality’s foremost
development management tools.
The strategic development focus areas are:
• Housing Densification
• Sustainable Human Settlements
• Accessibility and mobility
• Economic Development Areas
• The Capital Core
• Infrastructure investment
For the purpose of kick-starting the spatial restructuring of the municipal area, the draft
Strategy identified a Densification and Infill Edge, which demarcates the priority investment
area in the city. This Edge differs from the Provincial Urban Edge as it is not a divide
between areas where development may and may not go, but clearly shows where the
municipality will be focusing their investment in the next 5 years.
The Densification and Infill Edge demarcates two investment zones, namely the Area of
Consolidation to the north and the Strategic Priority Area to the south of this line.
In short, the focus on the Area of Consolidation will be on upgrading of infrastructure, in-
situ upgrading of housing projects and basic services and facilities. This is necessary both
to ensure that the people living in these areas can enjoy decent living standards, and to
ensure that the city meets the 2014 targets for the eradication of backlogs. No large scale
investment in infrastructure or facilities should however take place in these areas.
The Strategic Priority Area will be the main focus area for economic development, large
scale infrastructure investment and new, higher density housing developments for the
poor. Specific intervention programmes have been identified for the Strategic Priority Area
that should be the focus of municipal investment for the next four years.

Chapter 3: Strategic Agenda and Policy Guideline
Tshwane IDP 2006 – 2011 First Revision 143
Lastly, the draft Strategy identified key catalytic interventions in which the municipality
should invest over the next 5 years. This includes investment in affordable higher density
housing in central locations, the inner city, a public transport system, the digital network
and the education and research industry.
Map 3.2: Redirecting Growth: Balanced Development in favour of Optimal Location

Chapter 3: Strategic Agenda and Policy Guideline
Tshwane IDP 2006 – 2011 First Revision 144
The draft Strategy is not a spatial development framework, but a strategic tool that
addresses specific development needs in the city. The draft Strategy will not replace the
CDS or the MSDF (although it may inform the revision of the MSDF). However, it is
possible that, over time, the CDS, the MSDF and the draft Strategy can be merged into a
single strategic development framework for the city.
3.2.6.5 GROWTH AND DEVELOPMENT STRATEGY
The Tshwane Growth and Development Strategy (TGDS) was developed during 2006 as
part of a national initiative to put in motion localized plans of action to promote economic
development and job creation. The Tshwane Growth and Development Strategy (TGDS) is
not intended to cover all elements of a comprehensive development plan for the City, but
rather comprise a limited set of high-impact, fast-track interventions that can act as
catalysts for accelerated and shared growth. Thus, the 5-Year Strategic Programme and
the various departmental business plans function in tandem with the TGDS.
The document commences with a short statement on the rationale and importance of
developing a Growth and Development Strategy for the City of Tshwane, then sets out the
Vision and Mission adopted for the City, and concludes with a discussion of the scope,
purpose and objectives of the TGDS as well as the benefits that its successful
implementation will bring.
It then provides an overview of the global, national, provincial and local context within
which the TGDS has to be developed, followed by a discussion on the key strategic levers
at the disposal of the CoT, which could be used to unlock a prosperous future for all
citizens of the city. Both levers for accelerated economic growth and levers for economic
empowerment that will ensure a more equitable sharing of the benefits of shared growth
are discussed. The transformational agenda that is required to promote social inclusion
and the strategies that will be required to mitigate against risk are also highlighted.
The TGDS then sets out specific high-impact interventions for each of the key strategic
levers which will have to be implemented to achieve the accelerated, shared and
sustainable growth the city is seeking. These are listed below:

Chapter 3: Strategic Agenda and Policy Guideline
Tshwane IDP 2006 – 2011 First Revision 145
Key Strategic Interventions, Key Performance Indicators, Associated Budgets and Risk Management Indicators
Time frames
Stra
tegi
c O
bjec
tive
Stra
tegi
c A
gen
da
Stra
tegi
c L
ever
#
Major Interventions (Key project
(descriptions / objectives)
Key Performance Indicators
Desired Outcomes
Indicators/ Targets Risks Mitigation Strategies Budget
20
07
-09
20
10
-12
20
13
-15
Responsi- bilities
(Partners)
Monitor/ Evaluate
#0 Establish TEDA as a SPV to promote local economic development in the CoT
1. Fully operationalise the Tshwane Economic Development Agency.
Effective SPV for promoting local economic development.
Increased awareness of CoT as an investment destination and an exporter of goods and services
R2 bn investment
in the next 5 years and increased exports by 1%.
1. Ineffective economic development support and slow economic growth
1. Fully operationalise and adequately resource TEDA
Period 2007-09: An additional R 10m over already approved TEDA budget, Subject to TEDA Board Submission
ED/LED Quarterly reports
D
evel
op a
com
mon
Str
ateg
y on
ach
ievi
ng a
sha
red
acce
lera
ted
econ
omy
Econ
omic
Gro
wth
Age
nda
Trad
e, I
ndus
try,
Fin
ance
and
Inv
estm
ent
#1 Initiate, provide operational support and facilitate Trade and Industrial Promotion at the local level (TEDA)
1. Establish three specialist desks (Europe & North America, Africa, and Eastern Block & Domestic) at TEDA 2. Develop a comprehensive Trade Facilitation Programme 3. Re-establish an Electronic Trade Point 4. Revive and provide administrative support for a Tshwane Exporters Club 5. Provide training for prospective exporters 6. Organise 3 overseas trade missions per year 7. Participate at 2 Overseas and 2 South African Trade Exhibitions/Shows
Accelerated and shared industrial and trade growth
• 8% economic growth
1 .Lost opportunities to expand exports of Tshwane goods and services 2.Increased threat of cheap imports from China and India to local manufacturers 3. Lost opportunities to create jobs
Fully operationalise the various trade and industrial KPI’s Mobilise resources widely
Ongoing. Included in TEDA budget
TEDA Included in TEDA quarterly reports to Council

Chapter 3: Strategic Agenda and Policy Guideline
Tshwane IDP 2006 – 2011 First Revision 146
Time frames
Stra
tegi
c O
bjec
tive
Stra
tegi
c A
gen
da
Stra
tegi
c L
ever
#
Major Interventions (Key project
(descriptions / objectives)
Key Performance Indicators
Desired Outcomes
Indicators/ Targets Risks Mitigation Strategies Budget
20
07
-09
20
10
-12
20
13
-15
Responsi- bilities
(Partners)
Monitor/ Evaluate
Dev
elop
a c
omm
on S
trat
egy
on a
chie
ving
a s
hare
d ac
cele
rate
d ec
onom
y
Econ
omic
Gro
wth
Age
nda
#2 Initiate, provide operational support and facilitate Investment Promotion at the local level (TEDA)
1. Establish and Investment Promotion Office at TEDA 2. Initiate, develop and implement investment-targeting development projects 3. Develop a Guide to Sectoral Business Costs for Tshwane 4. Market investment in Sectors with competitive advantages 5. Establish an multi-stakeholder Investment Promotion team that could meet with prospective investors and conduct investment seeking missions 6. Provide assistance to investors setting up in Tshwane 7. Participate at 2 Overseas and 2 South African Trade Exhibitions/Shows 8. Promote CoT as an alternative investment destination in Africa
Attraction of at least R 1 billion of FDI
• Increased awareness of CoT as an investment destination and an exporter of goods and services
• R2 bn investment in the next 5 years and increased exports by 1%.
Ineffective support for prospective investors. Loss of investors to the competition.
Fully operationaise an Investment Promotion Office at TEDA Mobilise resources widely
Ongoing. Included in TEDA budget
TEDA Included in TEDA quarterly reports to Council
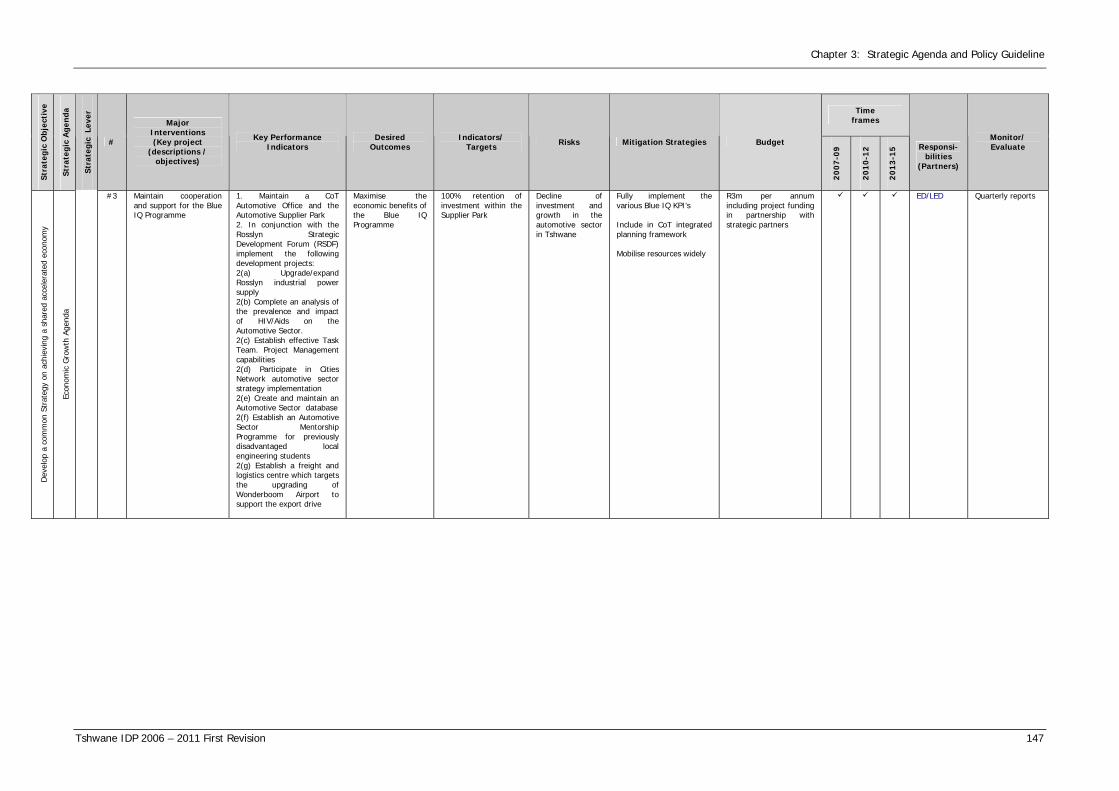
Chapter 3: Strategic Agenda and Policy Guideline
Tshwane IDP 2006 – 2011 First Revision 147
Time frames
Stra
tegi
c O
bjec
tive
Stra
tegi
c A
gen
da
Stra
tegi
c L
ever
#
Major Interventions (Key project
(descriptions / objectives)
Key Performance Indicators
Desired Outcomes
Indicators/ Targets Risks Mitigation Strategies Budget
20
07
-09
20
10
-12
20
13
-15
Responsi- bilities
(Partners)
Monitor/ Evaluate
Dev
elop
a c
omm
on S
trat
egy
on a
chie
ving
a s
hare
d ac
cele
rate
d ec
onom
y
Econ
omic
Gro
wth
Age
nda
#3 Maintain cooperation and support for the Blue IQ Programme
1. Maintain a CoT Automotive Office and the Automotive Supplier Park 2. In conjunction with the Rosslyn Strategic Development Forum (RSDF) implement the following development projects: 2(a) Upgrade/expand Rosslyn industrial power supply 2(b) Complete an analysis of the prevalence and impact of HIV/Aids on the Automotive Sector. 2(c) Establish effective Task Team. Project Management capabilities 2(d) Participate in Cities Network automotive sector strategy implementation 2(e) Create and maintain an Automotive Sector database 2(f) Establish an Automotive Sector Mentorship Programme for previously disadvantaged local engineering students 2(g) Establish a freight and logistics centre which targets the upgrading of Wonderboom Airport to support the export drive
Maximise the economic benefits of the Blue IQ Programme
100% retention of investment within the Supplier Park
Decline of investment and growth in the automotive sector in Tshwane
Fully implement the various Blue IQ KPI’s Include in CoT integrated planning framework Mobilise resources widely
R3m per annum including project funding in partnership with strategic partners
ED/LED
Quarterly reports

Chapter 3: Strategic Agenda and Policy Guideline
Tshwane IDP 2006 – 2011 First Revision 148
Time frames
Stra
tegi
c O
bjec
tive
Stra
tegi
c A
gen
da
Stra
tegi
c L
ever
#
Major Interventions (Key project
(descriptions / objectives)
Key Performance Indicators
Desired Outcomes
Indicators/ Targets Risks Mitigation Strategies Budget
20
07
-09
20
10
-12
20
13
-15
Responsi- bilities
(Partners)
Monitor/ Evaluate
Info
rmat
ion
and
Com
mun
icat
ion
Tech
nolo
gy, a
nd e
-G
over
nmen
t
#4 Fully implement e-Governance
1. Fully implement the CoT’s e-Government plan as set out in the draft IT Strategy. 2. Maximise the use of ICT technology to increase the quality of CoT support services. 3. Ensure equal ICT intranet access, functionality and training for all CoT members and staff. 4.Maximise access and connectivity to the CoT e-Governance system for customers using web based technology 5. Establish broadband infrastructure in the North 6. Operationalise the Digital Hub programme city-wide
Efficient and effective service delivery and acceptability of information
Implement within 24 months to end of 2008
Inadequate existing infrastructure and IT systems Failure to comply with National Government requirements
Fully implement the CoT’s e-Governance strategy
Included in Departmental budgets. Subsequent years to be budgeted for according to needs.
Corporate Services
Quarterly reports
D
evel
op a
com
mon
Str
ateg
y on
ach
ievi
ng a
sha
red
acce
lera
ted
econ
omy
Econ
omic
Gro
wth
Age
nda
Scie
nce,
Tec
hnol
ogy
and
Inno
vatio
n
#5 Promote and facilitate advancement on Science, Technology and Innovation
1. Initiate and support emerging R&D networks of firms, universities, research institutions and agencies. 2. Commission a Study on the status of Science and Technology in the CoT, with specific focus on the economic setting; human resources development; and the status of R&D institutions in Tshwane. 3. Access funding from the Dept of Science, Technology, Arts and Culture to establish a Tshwane-based Innovation Fund 4. Partner with the Blue IQ Innovation Hub Programme 5. Establish separate Women and youth Innovation Weeks to coincide with National Youth and Women Months.
Maximise human capital in the fields of science, technology and innovation in Tshwane
Establish R&D SLA’s with other stakeholders by April 2007 Complete R&D study by June 2007 Establish Innovation Fund by August 2007
Insufficient resources and funding to support scientific and technological advances in Tshwane
Fully implement the CoT’s science, technology and innovation KPI’s Mobilise resources widely
Departmental budgets to enhance the programme. Subsequent years to be budgeted for according to needs.
ED/LED Quarterly reports

Chapter 3: Strategic Agenda and Policy Guideline
Tshwane IDP 2006 – 2011 First Revision 149
Time frames
Stra
tegi
c O
bjec
tive
Stra
tegi
c A
gen
da
Stra
tegi
c L
ever
#
Major Interventions (Key project
(descriptions / objectives)
Key Performance Indicators
Desired Outcomes
Indicators/ Targets Risks Mitigation Strategies Budget
20
07
-09
20
10
-12
20
13
-15
Responsi- bilities
(Partners)
Monitor/ Evaluate
Spac
e Te
chno
logi
es
#6 Utilise the CSIR’s space technologies to improve CoT planning and management of economic growth; and land-use, infrastructure, transport and service delivery planning.
1. Establish a working partnership with the Satellite Applications Centre of the CSIR and private sector-based organisations to develop and implement multi-layer special planning tools for urban economic development, integrated transport networks, infrastructure and service delivery
Development of multi-layer spatial and economic planning tools
Conclusion of an SLA with the Satellite Applications Centre of the CSIR and private sector-based organisations by April/May 2007
Inadequate existing infrastructure and IT systems Failure to establish a working relationship with the CSIR
Fully implement the CoT’s e-Governance strategy Establishment of a SLA with the CSIR
R10m Subsequent years to be budgeted for according to needs.
ED/LED May 2007 report and quarterly reports thereafter
Econ
omic
Int
ellig
ence
#7 Develop a comprehensive updatable socio- economic database.
1. Utilising the economic data available in the RSC Database, construct an updatable sectoral database for the CoT. 2. Commission research on international benchmarking information for major city regions and construct an updatable socio-economic benchmarking database for the CoT
Development of detailed and usable socio-economic and international bench-marking data for the CoT
Establishment of databases by June 2007
Flawed developmental planning based on outdated and inadequate data
Timely establishment of the databases
R2m for feasibility study and system development. Annual R1,5m for maintenance budget
Corporate Services
June 2007 report and quarterly reports thereafter
Econ
omic
Gro
wth
Age
nda
Loca
l Eco
nom
ic D
evel
opm
ent
#8 Review and align Local Economic Development Strategy
1. Revise/review the LED Strategy to be in line with the City’s CDS; 5-Year Programme and the TGDS within the Strategy development processes.
An updated and re-aligned LED Strategy for the CoT
Complete by June 2007
Failure to implement on target
Full implementation R1,.5m ED/LED June 2007 report

Chapter 3: Strategic Agenda and Policy Guideline
Tshwane IDP 2006 – 2011 First Revision 150
Time frames
Stra
tegi
c O
bjec
tive
Stra
tegi
c A
gen
da
Stra
tegi
c L
ever
#
Major Interventions (Key project
(descriptions / objectives)
Key Performance Indicators
Desired Outcomes
Indicators/ Targets Risks Mitigation Strategies Budget
20
07
-09
20
10
-12
20
13
-15
Responsi- bilities
(Partners)
Monitor/ Evaluate
Dev
elop
a c
omm
on S
trat
egy
on a
chie
ving
a s
hare
d ac
cele
rate
d ec
onom
y
Econ
omic
Gro
wth
Age
nda
The
Smar
t Ci
ty P
roje
ct
#9 Implement the Smart City Project
• Mega Projects within the CDS included in the TDGS.: • Establishment of the
Tshwane International Convention Centre in Centurion
• Establishment of an International Logistics Cluster (discussed in 3.1.2)
• Implementation of the Vibrant Capital Programme – Re Kgabisa Tshwane; Inner City Housing Development; and Tshwane Kopanong Square.
• Implementation of the Tsosoloso Programme.
• Continued support for the Innovation Hub (discussed in 3.1.3)
• Establish a Support Office at the Innovation Hub
• Implementation of the Blue Ambrella project
Successful facilitation of the execution of the mega projects comprising the Smart City Project
Successful completion of the various mega projects witin time, quality and budget
Lack of resources Funding and support for the mega project already obtained previously Mobilise resources widely
Included in Departmental budgets
Office of the COO; Corporate Services; and ED/LED
Quarterly reports

Chapter 3: Strategic Agenda and Policy Guideline
Tshwane IDP 2006 – 2011 First Revision 151
Time frames
Stra
tegi
c O
bjec
tive
Stra
tegi
c A
gen
da
Stra
tegi
c L
ever
#
Major Interventions (Key project
(descriptions / objectives)
Key Performance Indicators
Desired Outcomes
Indicators/ Targets Risks Mitigation Strategies Budget
20
07
-09
20
10
-12
20
13
-15
Responsi- bilities
(Partners)
Monitor/ Evaluate
Econ
omic
Em
pow
erm
ent
Agen
da
Loca
l Eco
nom
ic D
evel
opm
ent
#10 Develop and implement a SMME Development, Empowerment and Growth Programme
1. Establish incubation programmes for 5 sectors:
• Manufacturing • Construction • Trade • Hotels &
Restaurants • Transport,
Storage & Communication
2. Establish an SMME Development Fund 3. Establish a SMME Mentorship and Coaching Programme 4. Establish a Technical Assistance Programme 5. Establish a Secondment and Exchange Programme 6. Establish an “Adopt a SMME” Programme 7. Establish sectoral Business Linkages Programmes 8. Facilitate Research and Development for SMMEs 9. Further resource and partner existing Enterprise Development Centres 10. Commission a Skills Audit for SMMEs
Established incubator programmes for the said sectors;
Funding for SMME tender guarantees;
Increased conversion rate from start-ups to viable enterprises;
Increase in the number of SMME’s and jobs.
Enterprise Development Centres
Conduct a Skills Audit for SMMEs
In place within the next 5 years
Contribution to
the number of new SMMEs and new jobs created 67,000 per annum
• Completed by
April 2007
Lack of resources Adequate funding of SMME empowerment5 and growth PKI’s Include in CoT integrated planning framework Mobilise resources widely
R50m over a 5-year period, i.e., R10m per annum. Subject to future programme adjustments the budget may be adjusted.
ED/LED and TEDA
Quarterly reports
Econ
omic
Em
pow
erm
ent
Agen
da
Loca
l Eco
nom
ic D
evel
opm
ent
#11 Develop and implement an Industrial Development Programme
1. Focus new industrial expansion on the following areas:
• Babelegi • Garankuwa • Soshanguve • Mamelodi • Waltloo • Pretoria-West
(Light Industries)
2.Develop a marketing strategy for a marketing campaign for Tshwane-based/products and services to Government Departments and institutions
Increased awareness of CoT as a producer/ exporter of quality goods and services
Develop marketing strategies by Sept 2007
Failure to maximise international awareness of Tshwane-produced products and services
Finalise and implement programme
R2m for Feasibility Study and R3m operational budget in current year. Subsequent years to be budgeted for according to needs.
TEDA Included in TEDA quarterly reports to Council
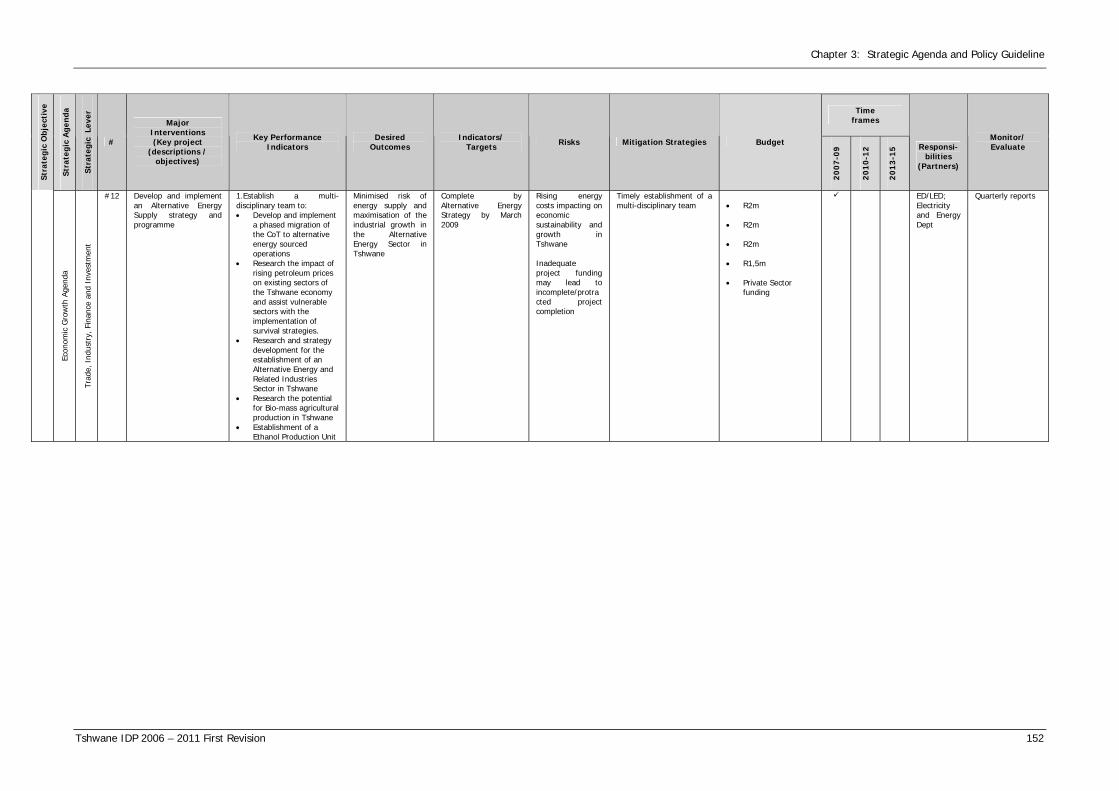
Chapter 3: Strategic Agenda and Policy Guideline
Tshwane IDP 2006 – 2011 First Revision 152
Time frames
Stra
tegi
c O
bjec
tive
Stra
tegi
c A
gen
da
Stra
tegi
c L
ever
#
Major Interventions (Key project
(descriptions / objectives)
Key Performance Indicators
Desired Outcomes
Indicators/ Targets Risks Mitigation Strategies Budget
20
07
-09
20
10
-12
20
13
-15
Responsi- bilities
(Partners)
Monitor/ Evaluate
Econ
omic
Gro
wth
Age
nda
Trad
e, I
ndus
try,
Fin
ance
and
Inv
estm
ent
#12 Develop and implement an Alternative Energy Supply strategy and programme
1.Establish a multi-disciplinary team to: • Develop and implement
a phased migration of the CoT to alternative energy sourced operations
• Research the impact of rising petroleum prices on existing sectors of the Tshwane economy and assist vulnerable sectors with the implementation of survival strategies.
• Research and strategy development for the establishment of an Alternative Energy and Related Industries Sector in Tshwane
• Research the potential for Bio-mass agricultural production in Tshwane
• Establishment of a Ethanol Production Unit
Minimised risk of energy supply and maximisation of the industrial growth in the Alternative Energy Sector in Tshwane
Complete by Alternative Energy Strategy by March 2009
Rising energy costs impacting on economic sustainability and growth in Tshwane Inadequate project funding may lead to incomplete/protracted project completion
Timely establishment of a multi-disciplinary team
• R2m • R2m • R2m • R1,5m • Private Sector
funding
ED/LED; Electricity and Energy Dept
Quarterly reports

Chapter 3: Strategic Agenda and Policy Guideline
Tshwane IDP 2006 – 2011 First Revision 153
Time frames
Stra
tegi
c O
bjec
tive
Stra
tegi
c A
gen
da
Stra
tegi
c L
ever
#
Major Interventions (Key project
(descriptions / objectives)
Key Performance Indicators
Desired Outcomes
Indicators/ Targets Risks Mitigation Strategies Budget
20
07
-09
20
10
-12
20
13
-15
Responsi- bilities
(Partners)
Monitor/ Evaluate
Det
erm
ine
the
City
’s c
ontr
ibut
ion
to t
he P
rovi
ncia
l eco
nom
ic g
row
th o
f 8%
Econ
omic
Em
pow
erm
ent
Agen
da
Infr
astr
uctu
re D
evel
opm
ent
#13 Infrastructure development in the North
1. Maintenance an improvement to road network 2. Build new storm water drainage systems in areas where growth and development are restrained by lack of same 3. Investigate solar heating systems as an alternative source of energy for citizens who cannot afford electricity rates. 4. Provide high-mast street and security lighting in high-crime areas 5. Provide demand-driven serviced land for housing 6. Provide sate assisted housing in selected areas 7. Build multi-purpose one-stop facilities that include recreational, sports, pension-payout points, health and CoT Customer Care services in selected areas 8. Establish an integrated cluster of road, rail and air freight facilities in the Zone of Choice 9. Complete the metropolitan mobility ring by completing the Western Bypass highway.
Steer development towards the Zone of Choice and priority areas
Already targeted in the CoT 5-year Plan
Failure to implement as per approved plans
Already included in CoT integrated planning framework
Ongoing. Allocated in Infrastructure Department budgets
All Infrastructure Departments
Quarterly reports
yco
ntrib
utio
n to
the
Pr
ovin
cial
eco
nom
ic
Econ
omic
Em
pow
erm
ent
Agen
da
Infr
astr
uctu
re
Dev
elop
men
t
#14 Infrastructure development in the South-East
1. General maintenance and upgrading of roads and storm water network 2.Selective introduction of further traffic calming structures 3. Improvement of road signage.
Maintenance of infrastructural quality standards
Already targeted in the CoT 5-year Plan
Failure to implement as per approved plans
Already included in CoT integrated planning framework
Allocated in Infrastructure Department budgets
All Infrastructure Departments
Quarterly reports

Chapter 3: Strategic Agenda and Policy Guideline
Tshwane IDP 2006 – 2011 First Revision 154
Time frames
Stra
tegi
c O
bjec
tive
Stra
tegi
c A
gen
da
Stra
tegi
c L
ever
#
Major Interventions (Key project
(descriptions / objectives)
Key Performance Indicators
Desired Outcomes
Indicators/ Targets Risks Mitigation Strategies Budget
20
07
-09
20
10
-12
20
13
-15
Responsi- bilities
(Partners)
Monitor/ Evaluate
#15 Promotion of Agricultural Sector
1. Complete an Integrated Agricultural Development & Support Strategy within the TGDS processes: • Develop agricultural
hubs in areas with moderate to high potential agricultural land
• Establishment of a Programme for the transfer of high-potential agricultural land to targeted communities
• Establish a Programme to promote/establish urban agriculture in poor communities
2. Promote local food production for local consumption
Acquisition of an Agricultural Strategy in time for the Agricultural Summit in March 2007
Complete by end Feb 2007
Failure to implement
Include in CoT integrated planning framework Mobilise resources widely
R15m in current year. Subsequent years to be budgeted for according to needs.
ED/LED later to be transferred to new Agriculture Department
Quarterly reports
#16 Support for the Gauteng City Region Project
1. Continued support and collaboration with other stakeholders. 2. Establish a task team to participate and represent the CoT at the GCR
Establishment of Gauteng as an internationally competitive city-region
Establish the task team by July 2007
Appointing over-committed members to the task team
Appointment of dedicated team members to the project
COO budget Office of the COO
Quarterly reports
Spac
ial D
evel
opm
ent
#17 Development of economic development areas and corridors.
1. Develop metropolitan activity nodes in the following areas:
• Soshanguve • Mabopane • Hammanskraal • Atteridgeville • Mamelodi • Garankuwa
2. Development of three metropolitan corridors: • N1/Ben Schoeman
Highway between Tshwane and Midrand
• R21 between Tshwane and O.R. Tambo International Airport
• Bakwena/Platinum Highway Corridor
Endogenous growth within the target areas.
Feasibility study completed by Dec 2007
Failure to maximise endogeous growth in the target areas Insufficient funding for economic infrastructure in the selected areas
Include in CoT integrated planning framework Mobilise resources widely
City Planning budget City Planning, Infrastructure Departments, ED/LED
Quarterly reports

Chapter 3: Strategic Agenda and Policy Guideline
Tshwane IDP 2006 – 2011 First Revision 155
Time frames
Stra
tegi
c O
bjec
tive
Stra
tegi
c A
gen
da
Stra
tegi
c L
ever
#
Major Interventions (Key project
(descriptions / objectives)
Key Performance Indicators
Desired Outcomes
Indicators/ Targets Risks Mitigation Strategies Budget
20
07
-09
20
10
-12
20
13
-15
Responsi- bilities
(Partners)
Monitor/ Evaluate
2010
and
Bey
ond
#18 Exploit economic potential of 2010 and beyond
1. Establish and staff a 2010 Project Management Office 2. Secure rights for public viewing sites for SMMEs 3. Facilitate partnerships between SMMEs and large 2010 sponsors and contractors 4. Redesign the metropolitan corporate identity and brand imagery to reflect a 2010 host city status
Full participation of SMME’s;
Skills transfer and inclusion of SMME’s;
To take advantage of the international profiling of the city;
Minimise project opportunity costs and avoid wastages;
Fully functional PMO by March 2007;
o New CoT
Corporate image by July 2007
Delayed appointment of 2010 Project Management Team
Full implementation COO budget Office of the COO; Corporate Services and Sport & Recreation
Quarterly reports
Redu
ce u
nem
ploy
men
t by
50%
by
year
201
4
Hum
an R
esou
rce
Dev
elop
men
t
#19 Maximise human resource development
1. Conduct research into, and promote the matching of skills development with market demand 2. Optimise utilisation of JIPSA opportunities 3. Engage volunteer organisations in developmental programmes 4. Implement a Mentorship Programme for technical skills transfer and support for SMMEs
Matching skills development with Sectoral labour demands;
Improved labour absorption, productivity and profitability of city enterprises.
Promote skills transfer.
Market demand survey to be completed by Apr 2007.
Develop an integrated Skills development programme for the City commence by July 2007.
Failure to implement on target
Full implementation All Department budgets Corporate Services and all Departments
Quarterly reports by Corporate Services
Ensu
re a
mor
e ba
lanc
ed s
harin
g of
be
nefit
s be
twee
n 1st
and
2nd
eco
nom
ies
Econ
omic
Em
pow
erm
ent
Agen
da
Tran
sitio
nal P
rogr
amm
e be
twee
n 2nd
an
d1st
Econ
omie
s
#20 Improve the Regulatory Framework
1. Investigate the further streamlining of business applications, building approvals and procurement processes 2. Identify and reduce restrictive land-use regulatory conditions particularly for 2nd economy businesses
Improved support for SMME’s, especially 2nd economy businesses
Ongoing Failure to execute continuous review and improve regulatory processes
Agreed scheduling for periodic reviews
Departmental budgets Legal services and City Planning
Quarterly reports

Chapter 3: Strategic Agenda and Policy Guideline
Tshwane IDP 2006 – 2011 First Revision 156
Time frames
Stra
tegi
c O
bjec
tive
Stra
tegi
c A
gen
da
Stra
tegi
c L
ever
#
Major Interventions (Key project
(descriptions / objectives)
Key Performance Indicators
Desired Outcomes
Indicators/ Targets Risks Mitigation Strategies Budget
20
07
-09
20
10
-12
20
13
-15
Responsi- bilities
(Partners)
Monitor/ Evaluate
#21 Promotion of Rural Economic Development and Empowerment
1.Commission research to establish the unique competitive economic strengths and advantages of each rural area in Tshwane and develop specialist strategies to exploit these advantages 2.Establish a network of enterprise facilitators to assist rural communities to achieve indigenous economic growth and entrepreneurial and leadership capacity building 3. Promote the development of the following sectors in rural communities: • Hospitality and
Tourism Sector • Arts and Crafts
Manufacturing • Production of
speciality agricultural products and agri-foods for local market
Establishment of a comprehensive rural economic development programme for the CoT
To be completed by Oct 2007
Failure to dedicate support programmes and resources for rural economies
Establishment of an office to drive Rural Economic Development
R2m in current year and Departmental budgets. Subsequent years to be budgeted for according to needs.
LED and City Planning
Quarterly reports
#22 Establishment of Co-operative Clusters in selected sectors and targeting Women, Youth and SMMEs
1. Arrange Roadshows to rural and urban communities 2. Establish 30 Co-operative Clusters per annum from 2007 in the following sectors: • Housing • Tourism & Creative
Industries • Agriculture • Environmental
Management 3. Establish a database of co-operatives and potential co-operatives as well as service providers.
Accelerated inclusion in the mainstream economy.
30 cooperatives per annum from 2007.
Under-resourcing and restrictive regulatory framework
Establish a supportive regulatory framework for new initiatives
R5m per annum operational budget. R10m for infrastructure support over first 3 years. Subsequent years to be budgeted for according to needs.
ED/LED Quarterly reports

Chapter 3: Strategic Agenda and Policy Guideline
Tshwane IDP 2006 – 2011 First Revision 157
Time frames
Stra
tegi
c O
bjec
tive
Stra
tegi
c A
gen
da
Stra
tegi
c L
ever
#
Major Interventions (Key project
(descriptions / objectives)
Key Performance Indicators
Desired Outcomes
Indicators/ Targets Risks Mitigation Strategies Budget
20
07
-09
20
10
-12
20
13
-15
Responsi- bilities
(Partners)
Monitor/ Evaluate
#23a
Promotion of Tourism 1. Establish a Programme to promote business tourism 2. Implement the Tourism Master Plan (20 year plan) 3. Facilitate and participate in bidding for the of hosting major events 4. Compile a profile of Inner City heritage sites 5. Launch tourism marketing campaigns for major sporting events
Increase city’s attractiveness to visitors;
Improved city profile;
Increase tourism capacity;
Improved domestic tourism;
Double number of conferences by 2008;
5 new attractions in the inner city.
Under-resourcing tourism initiatives
Full implementation of the Tourism Master Plan
R280m over the next five years
Tourism
Quarterly reports
#23b
Promotion of Creative Industries
1. Establish a Programme to promote the film, music and entertainment sectors (Moretele Park) 2. Establish a Craft Centre in the North linked to the South 3. Promote Tshwane as a home for Jazz in the country 4. Develop indicative business plan for all sun-sectors identified in the Creative Industry cluster 5. Establish an annual Tshwane International Indoor Jazz Festival 6. Continue support for Vukani Fashion & Designers Programme, Fashion in Africa Projects 7. Establish a Talent Search Programme
Boost trade; New jobs;
Increase retail trade by 20%;
Insufficient focus on the potential of the Creative Industries sector in CoT
Urgent attention to the development of a Creative Industries business plan
R2m in current year. Subsequent years to be budgeted for according to needs.
ED/LED Quarterly reports
#24 Promotion of Broad-Based Black Economic Empowerment
1. Fully implement the Tshwane BBBEE Strategy
Equitable sharing of economic growth and prosperity
Full implementation of the BBBEE Strategy
Failure to implement on target
Full implementation Included in Dept budgets
Corporate Services; Finance; and Governance
Quarterly reports
Ensu
re a
mor
e ba
lanc
ed s
harin
g of
ben
efits
be
twee
n 1st
and
2nd
eco
nom
ies
Tran
sfor
mat
iona
l Age
nda
(Pro
mot
ion
of S
ocia
l In
clus
ion)
BBBE
E
#25 Promotion of job creation by means of the Tshwane Expanded Public Works Programme
1. Full implement the Tshwane Expanded Public Works Programme. 2. Establish a Project Management Unit
Effective skills development and job creation
Creation of 650 jobs per annum
Failure to implement on target
Full implementation R2m in current year for establishment of PMU. Ongoing - included in Dept budgets
ED/LED and Infrastructure Depts
Quarterly reports

Chapter 3: Strategic Agenda and Policy Guideline
Tshwane IDP 2006 – 2011 First Revision 158
Time frames
Stra
tegi
c O
bjec
tive
Stra
tegi
c A
gen
da
Stra
tegi
c L
ever
#
Major Interventions (Key project
(descriptions / objectives)
Key Performance Indicators
Desired Outcomes
Indicators/ Targets Risks Mitigation Strategies Budget
20
07
-09
20
10
-12
20
13
-15
Responsi- bilities
(Partners)
Monitor/ Evaluate
#26 Implementation of Employment Equity
1. Full implementation of the CoT’s Employment Equity Strategy
Equitable employment and promotion practices in the CoT
Full implementation by end of current financial year
Failure to implement on target
Full implementation Included in Dept budgets
Corporate Services and all Depts
Quarterly reports
#27 Implementation of Preferential Procurement
o Critical issues requiring attention: • Improved
coord ina t ion be tween the CoT ’ s SMME deve lopmen t i n i t i a t i ves and i t s p re fe ren t i a l p rocu remen t ac t i v i t i e s .
• Qu icke r paymen t tu rn a round f o r SMME ’s ;
• Review the time given to prepare and submit tenders
Streamlined and fully supportive SMME procurement practices
Failure to implement on target
Full implementation Included in Dept budgets
Corporate Services; Finance; Governance and ED/LED
Quarterly reports
Wom
en E
cono
mic
Em
pow
erm
ent
#28 Promotion of Women Economic Empowerment
1. Fully implement the Tshwane Women Economic Empowerment Policy, Strategy and Implementation Plan. 2. Establish linkages with national womens’ initiatives
Women economic empowerment
Full implementation by March 2007
Failure to implement on target
Full implementation R5m in current year Ongoing – subsequent years included in Dept budgets
LED and Social Development
Quarterly reports
Mai
nstr
eam
ing
Gen
der
and
Equi
ty
Econ
omic
Em
pow
erm
ent
Agen
da
Yout
h Ec
onom
ic
Empo
wer
men
t
#29 Promotion of Youth Economic Empowerment
1. Establish a locally-focussed Youth Economic Empowerment Policy, Strategy and Implementation Plan with targeted programmes aligned with the City Development Strategy 2. Establish linkages with national youth initiatives
Youth economic empowerment
Full implementation by March 2007
Failure to implement on target
Full implementation R1m in current year. Partnership with Provincial and National Programmes
ED/LED and Social Development
Quarterly reports
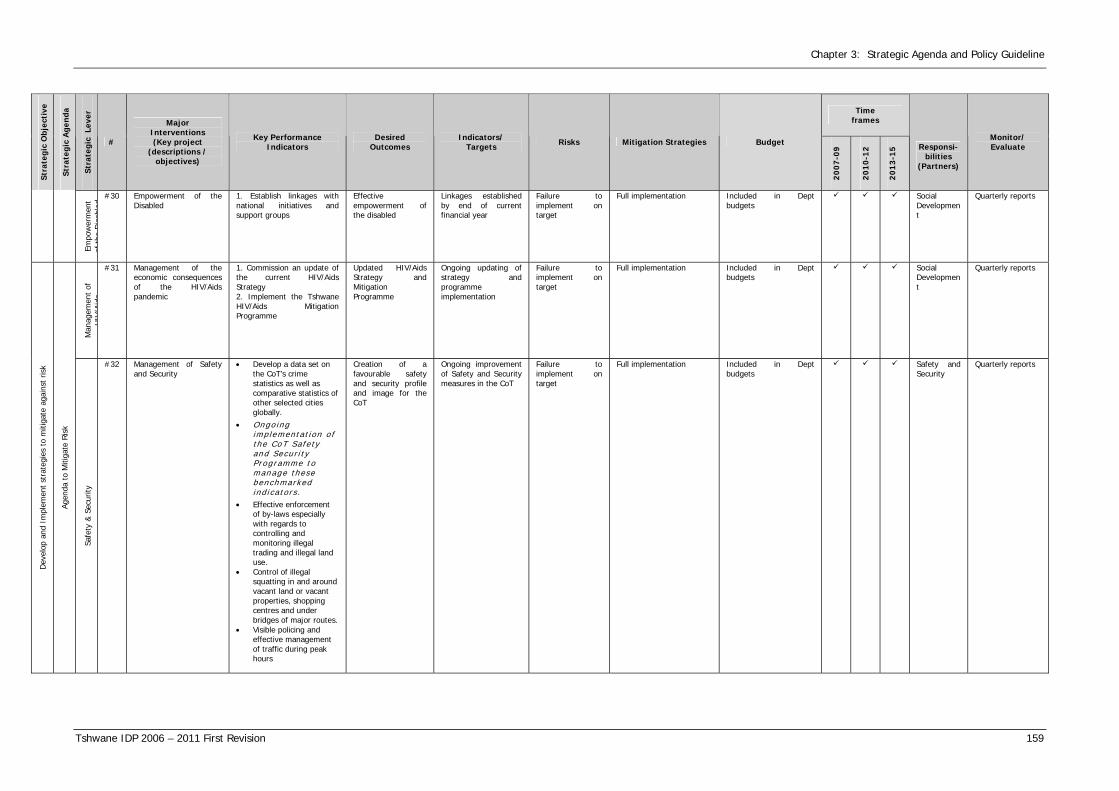
Chapter 3: Strategic Agenda and Policy Guideline
Tshwane IDP 2006 – 2011 First Revision 159
Time frames
Stra
tegi
c O
bjec
tive
Stra
tegi
c A
gen
da
Stra
tegi
c L
ever
#
Major Interventions (Key project
(descriptions / objectives)
Key Performance Indicators
Desired Outcomes
Indicators/ Targets Risks Mitigation Strategies Budget
20
07
-09
20
10
-12
20
13
-15
Responsi- bilities
(Partners)
Monitor/ Evaluate
Empo
wer
men
t of
the
Dis
able
d
#30 Empowerment of the Disabled
1. Establish linkages with national initiatives and support groups
Effective empowerment of the disabled
Linkages established by end of current financial year
Failure to implement on target
Full implementation Included in Dept budgets
Social Development
Quarterly reports
Man
agem
ent
of
HIV
/Aid
s
#31 Management of the economic consequences of the HIV/Aids pandemic
1. Commission an update of the current HIV/Aids Strategy 2. Implement the Tshwane HIV/Aids Mitigation Programme
Updated HIV/Aids Strategy and Mitigation Programme
Ongoing updating of strategy and programme implementation
Failure to implement on target
Full implementation Included in Dept budgets
Social Development
Quarterly reports
Dev
elop
and
Im
plem
ent
stra
tegi
es t
o m
itiga
te a
gain
st r
isk
Agen
da t
o M
itiga
te R
isk
Safe
ty &
Sec
urity
#32 Management of Safety and Security
• Develop a data set on the CoT’s crime statistics as well as comparative statistics of other selected cities globally.
• Ongo ing imp lementa t i on o f the CoT Sa fe ty and Secu r i t y P rogramme to manage these benchmarked ind i ca to r s .
• Effective enforcement of by-laws especially with regards to controlling and monitoring illegal trading and illegal land use.
• Control of illegal squatting in and around vacant land or vacant properties, shopping centres and under bridges of major routes.
• Visible policing and effective management of traffic during peak hours
Creation of a favourable safety and security profile and image for the CoT
Ongoing improvement of Safety and Security measures in the CoT
Failure to implement on target
Full implementation Included in Dept budgets
Safety and Security
Quarterly reports

Chapter 3: Strategic Agenda and Policy Guideline
Tshwane IDP 2006 – 2011 First Revision 160
Time frames
Stra
tegi
c O
bjec
tive
Stra
tegi
c A
gen
da
Stra
tegi
c L
ever
#
Major Interventions (Key project
(descriptions / objectives)
Key Performance Indicators
Desired Outcomes
Indicators/ Targets Risks Mitigation Strategies Budget
20
07
-09
20
10
-12
20
13
-15
Responsi- bilities
(Partners)
Monitor/ Evaluate
Goo
d G
over
nanc
e
#33 Good Governance 1. Develop a Tshwane-based Good-Governance Manual that will apply to all participants in the TDGS
Good governance practice in the CoT
Manual completed by March 2008
Failure to obtain buy-in by all
Political leadership R2m in current year. Subsequent years to be budgeted for according to needs.
Corporate Services and Governance
Quarterly reports
Envi
ronm
enta
l Hea
lth #34 Manage Environmental
Health Fully implement the CoT Environmental Health Strategy and Business Plan and incorporate into applicable interventions proposed in the TGDS
Sustainable Development
Ongoing Failure to obtain buy-in and commitment
Political leadership Included in Dept budgets
Environment and Agriculture
Quarterly reports
TGD
S im
plem
enta
tion
#35 Establish a TGDS Forum and Task Team
Complete by June 2007 Oversee implementation of the TGDS
Complete by June 2007
Inadequate programme management
Full implementation R500,000 per annum Office of the Municipal Manager
Semi-annual reports

Chapter 3: Strategic Agenda and Policy Guideline
Tshwane IDP 2006 – 2011 First Revision 161
The TGDS also deals with the clarification of the roles that the CoT and its partners will
have to play in implementing the Strategy and it focuses on a finance mechanism, and an
approach to be followed to implement the TGDS, which also includes aspects such as
monitoring, evaluation and reporting.
3.2.6.6 THE HUMAN DEVELOPMENT POLICY (HDP)
The impetus for designing a Human Development Policy for Tshwane arose from the need
to give effect to the CDS and the City’s vision as it relates to human development.
A process was embarked upon to confirm the issues and challenges identified, introducing
policy options to address the identified issues and their implications; accountability was
determined; overlaps in mandates and areas of cooperation among the different spheres of
government were identified; and a consolidated planning and implementation framework
was developed. Each CoT Department defined its role regarding each policy
recommendation.
The final draft HDP was presented to the Municipal Manager in June 2005. The policy
states that a number of major human development issues need to be addressed to improve
the quality of life of the people of Tshwane, as reflected in the CDS.
The policy is designed to provide a framework in which a common approach will be used to
implement the human development commitments made by the various departments in the
form of different strategies, plans, programmes or projects. It recognizes human wellbeing
as the product of development and emphasises that human development required
multisectoral interventions. Consistent with national and international views on
development, and adhering to the objectives set for local government, Tshwane has placed
people at the centre of its development strategies.
The CoT has committed itself to resolving human development concerns in a
comprehensive manner within the framework of its overall development strategies as
contained in the CDS and, guided by and vested in a broader provincial, national and
international framework. The vision of this policy is to contribute towards the
establishment of a sustainable environment in which the people of Tshwane are able to
develop and achieve their full potential and lead productive lives in an inclusive manner.
The policy aims to bring about changes in the determinants of the City’s development

Chapter 3: Strategic Agenda and Policy Guideline
Tshwane IDP 2006 – 2011 First Revision 162
trends to ensure that these trends are in step with sustainable human development
pursuits in a stable environment.
The Executive Mayor oversees the implementation of the human development policy and
progress made with its implementation is reported as part of an annual development
report. The Mayoral Committee’s role is to ensure political commitment regarding the
human development policy at the highest political level, while the Municipal Manager
coordinates integration of human development concerns, as part of the CDS and TIDP.
The Social Development Department supports all functional departments and facilitates
interdepartmental collaboration to ensure the implementation of the policy at all levels of
the municipality.
3.2.6.7 POLICY ALIGNMENT FRAMEWORK (PAF)
The CoT has developed a PAF to guide and regulate congruency in the broader context of
the municipality’s strategic direction and to ensure that the focus of all policies are strategy
led, goal directed and targeted towards enhancing effective service delivery.
The purpose of the PAF is to outline the relationships within, and between, the policy
environment, the accountability environment, and the contract environment in a way that
will facilitate a harmonious and stable operational policy environment.
The Tshwane PAF not only seeks to ensure that all policy prerogatives are congruent and
aligned at all levels of the Municipality, but also to assist policy-shapers and decision-
makers in the CoT administration and political leadership to be able to put future policy
amendments and proposals within the National, Provincial and Tshwane City Strategic
Direction context.
The main objective of the Tshwane PAF is to introduce a certain, clear and robust
framework wherein all internal and external policy directives informing and driving the
functioning of the municipality can relate to each other.

Chapter 3: Strategic Agenda and Policy Guideline
Tshwane IDP 2006 – 2011 First Revision 163
To this end the Tshwane Policy Alignment Framework targets:
• Incongruent departmental and divisional objectives;
• Inherent internal contradictions to municipal functioning;
• Contradictory provincial and national objectives; and
• Counter-productive principles, practices and procedures in the accountability and
contract environment resulting from approved policy documents, given the chosen
City Direction.
The Tshwane PAF furthermore seeks to standardize the following in order to assist in the
practical implementation of its goals and objectives:
• The Municipality’s approach to all actionable and enforceable policy and procedures
within the CoT’s policy environment;
• The activity of drafting municipal policy by introducing standard report formats that
ensure that all policy amendments and proposals respond to the appropriate stimuli
and directives in the City;
• The terms used to refer to policy documents and frameworks by defining these terms
and basic criteria for each; and
• The reference system used for archiving, referring and relating to other policies that
are in effect in any part of the spheres of government in South Africa.
The PAF thus, serves as a firm foundation for the municipality to position itself to meet the
national and provincial obligations in the creation of a better life for all.
An audit of the existing Tshwane Policies was conducted during 2006 and a report was
submitted during September 2006. The audit concluded as follows:
“By engaging in a formal review of the current policies of the CoT a number of
inconsistencies were uncovered. These inconsistencies ranged from duplicate policies to
policies that have not been signed thus no confirmation if the policies have been
implemented. By utilising the content of this report as well as the information contained in
Annexure A (Operational Policies) and Annexure B (Strategic Policies) CoT will be able to
address the inconsistencies and create more synergy in the policy environment.”

Chapter 3: Strategic Agenda and Policy Guideline
Tshwane IDP 2006 – 2011 First Revision 164
Following from the initial audit report proposals were submitted during October 2006
regarding Policy Alignment and Policy Database Development.
3.2.6.8 THE HUMAN RESOURCE DEVELOPMENT STRATEGY (HRD)
The CoT has embarked on the development of critical development strategies that will
ensure sustainable institutional growth and compositeness, one of the strategies being the
City Development Strategy. It was thus critical that an HRD Strategy be developed to
ensure that the relevant competencies are developed and monitored so as to enable the
CoT human resource continent to not only respond to the undertaking of the CDS, but also
enhance the implementation thereof.
The HRD take into account the following:
• Customer and financial perspectives;
• Sector skills plan;
• National capacity-building strategy for local government; and
• Provision of guidance on public-private partnerships in terms of service providers.
The purpose of this HRD Strategy is therefore to provide a framework that ensures
integrated HRD planning and implementation, monitored institutional-wide and at
departmental level, with progress measured against predefined indicators.
Section 68 of the Municipal Systems Act (Act 32 of 2000) states that a municipality must
develop its human resource capacity to a level that enables it to perform its functions and
exercise its powers in an economical, effective, efficient and accountable way, and for its
purpose must comply with the Skills Development Act (Act 97 of 1998) and the Skills
Development Levies Act (Act 9 of 1999). The HRD was designed and developed in the
spirit of the abovementioned legislation.
The connection between the CDS and the HRD Strategy has been derived from the
following COT Strategic thrusts, as listed in the CDS: “Building our Institution and
governing well”.

Chapter 3: Strategic Agenda and Policy Guideline
Tshwane IDP 2006 – 2011 First Revision 165
The Gauteng Growth and the Development Strategy (GDS) for the planning for 2014
document gives a provincial strategic context for the CoT to operate within. The field of
HRD in the public sector is also regulated and guided by varying national and provincial
legislation and directives. The abovementioned national, provincial legislation and
directives alongside the CoT’s CDS, collectively form the development agenda for the City.
Therefore, the HRD strategy development initiative, dovetails with the City’s development
agenda to form an institution-wide strategic context for the development of the CoT’s
human asset.
The CoT Human Resources Development Strategy is addressed through five priorities.
The HRD strategic priorities are the following:
Priority I: To develop the employees of the CoT to perform optimally, thus ensuring
service delivery.
Priority II: To implement the appropriate governance structures to effectively control,
monitor and manage the learning experience within the CoT.
Priority III: To support learning and development within the CoT through industry-based
competency development, innovation, research and development.
Priority IV: To ensuring that the skills and competencies of the Tshwane youth within
manufacturing, government and business services are developed and
enhanced.
Priority V: To ensure effective and sound financial management.
The relationship between the HRD key priorities and its strategic intents is depicted in the
following diagram:

Chapter 3: Strategic Agenda and Policy Guideline
Tshwane IDP 2006 – 2011 First Revision 166
Table 3.3: HRD Strategic Directives
HRD Strategic Directives HRD Priority Areas: Priority I: To develop the employees of the CoT to perform optimally, thus ensuring service delivery. Priority II: To implement the appropriate governance structures to effectively control, monitor and manage the learning experience within the CoT. Priority III: To support learning and development within the CoT through industry-based competency development, innovation, research and development. Priority IV: To ensuring that the skills and competencies of the Tshwane youth within manufacturing, government and business services are developed and enhanced. Priority V: To ensure effective and sound financial management.
HRD Strategic Intents: Learning and Growth: Empower and enable the CoT staff with skills and competencies to effectively deliver to their customers. Internal Business Processes: Ensure that the internal processes are simple, cost effective and manageable, whilst constantly looking for innovative ways of working. Customer/Stakeholder: Provide suitable, cost effective training and development solutions that meet both internal and external customer requirements. Financial Perspective: Optimise cost structure and cost recovery.
City of Tshwane Metropolitan Municipality HRD Strategy 2005
3.2.6.9 ALTERNATIVE SERVICE DELIVERY INSTITUTIONAL MODEL (ASD)
The CoT comprises of the amalgamation of thirteen previously independent local
authorities. The combination of staff contingents and the different institutional
arrangements have resulted in duplication of functions which in turn resulted in inefficient
utilization and wastage of resources. The ability of the municipality to deliver its
developmental mandate and provide effective service delivery is consequently constrained.
(The existing Tshwane Macro Structure is reflected in Diagram 3.1).

Chapter 3: Strategic Agenda and Policy Guideline
Tshwane IDP 2006 – 2011 First Revision 167
MUNICIPAL MANAGER
OPERATIONAL UNITCOUNCIL OPERATIONS
Chief Operating Officer
DEPARTMENT FINANCE
Chief FinancialOfficer
Executive Secretary
EXECUTIVE ASSISTANT
MACRO STRUCTURECITY OF TSHWANE METRO MUNICIPALITY
UNITRisk Assurance Management &
Internal Audit
Manager
3 x General Manager
GovernanceServicesSpecialProgrammesExecutiveSupport &InternationalRelations
1 x Specialist (City DevelopmentStrategies, IDP & OrganisationalPerformance)1 x Specialist (Business &Corporate Planning)1 x Specialist (Strategic &Generic Support)1 X General Manager (TshwaneCommunications)1 x Project Specialist ( PPP /Project Management)
GOVERNANCEOPERATIONAL
SUPPORT
CHIEF OF STAFF
3 x Deputy Chief ofPolice
Pro activePoliceOperationsRe activePoliceOperationPoliceAdministration
5 x General Manager
AccountingServiceFinancialManagementTreasuryManagementDebtorManagementSupply ChainManagement
TSHWANEMETROPOLITAN
POLICE
CHIEF OF POLICE
CORPORATESERVICES
EMERGENCYMANAGEMENT
SERVICES
HOUSING, CITYPLANNING &
ENVIRONMENTALMANAGEMENT
ECONOMICDEVELOPMENT
LEGAL &SECRETARIAL
SERVICE
STRATEGICEXECUTIVE OFFICER
STRATEGICEXECUTIVE OFFICER
HEAD LEGAL &SECRETARIAL OFFICER
STRATEGICEXECUTIVE OFFICER
STRATEGICEXECUTIVE OFFICER
3 x General Manager
HousingCity PlanningEnvironmentalManagement
2 x General Manage1 x Chief Fire
Officer1 x Head: Disaster
ManagementCentre
EmergencyMedical &AmbulanceServicesEmergencyManagementOperationalSupport &SupportServicesFire BrigadeDisasterManagementService
4 x General Manager
HumanResourcesInformationmanagementAdministrativeServicesCustomer care
4 x General Manager
TransportDevelopmentLocalEconomicDevelopmentAgriculturalTradingDevelopmentTourism
3 x General Manager
Legal ServicesSecretarial &SecretariatServiceMunicipalCourts
SOCIALDEVELOPMENT
STRATEGICEXECUTIVE OFFICER
3 x General Manager
EducationalServiceIntegratedCommunityDevelopmentHealth Care
SERVICEDELIVERY
STRATEGICEXECUTIVE OFFICER
2 x General Manager
Water &SanitationRoads &Stormwater
TSHWANEELECTRICITY
STRATEGICEXECUTIVE OFFICER
2 x General Manager
DistributionOperationsElectricityDevelopment &Energy Business
INTERIM(Marketing)
1 x General Manager
Diagram 3.1: Tshwane Macro Structure
Chapter 3: Strategic Agenda and Policy Guideline
Tshwane IDP 2006 – 2011 First Revision 168
The CoT has subsequently commissioned a process to investigate Alternative Service
Delivery (ASD) models that would improve its delivery mandate. The objective of the
investigation was to, amongst other, arrive at an optimal institutional structure for
Tshwane.
This initiative identified a number of areas where the municipality’s structure could be
changed to realise service delivery efficiencies. These areas were translated into a macro
structure. Principles of this macro structure included:
• Enhancing the monitoring and evaluation capability of the political offices;
• Strengthening participation between the communities and the administration; and
• Promoting good governance and accountability.
To support the above principles, it was agreed that this new structure would need to:
• Ensure synergies, and remove wastage, fragmentation and duplications;
• Identify and address capacity requirements;
• Remove silos;
• Improve management efficiencies and where necessary reduce management layers;
• Identify services best provided through alternative forms of service delivery;
• Promote knowledge sharing, collaboration, and improved decision-making;
• Incorporate appropriate spans of control;
• Clarify roles and responsibilities, accountabilities and authorities;
• Capitalise on economies of scale; and
• Enhance needs-responsive service delivery.
In August 2006, the CoT embarked upon a micro design process, applying the above macro
design principles. The process aimed at ensuring alignment of the macro structure and
business processes to a relevant micro structure of the municipality. As a result of initial
work done on the micro design, it became evident that in order to realise the ASD
initiatives, the approved macro structure required review and alignment to the
organisational strategic goals and objectives. A number of suggestions were made.
Council adopted the proposed amendments to the macro structure on the 2nd of November
2006, and work continued with the micro design. (Refer to Diagram 3.2 for the revised
macro structure).

Chapter 3: Strategic Agenda and Policy Guideline
Tshwane IDP 2006 – 2011 First Revision 169
Diagram 3.2: Tshwane Revised Macro Structure

Chapter 3: Strategic Agenda and Policy Guideline
Tshwane IDP 2006 – 2011 First Revision 170
The Way Forward
Organisational design must be seen as a dynamic process. In order for organisations to
survive and grow, a certain amount of fluidity must be allowed in this process. Structure
changes as strategy emerges. The City of Tshwane must, therefore, be prepared to
anticipate changes to this structure, to enable sound delivery and facilitate adaptability to
the needs of the citizens it serves.
In line with this, it is recommended that the effectiveness of the structures be reviewed
following a six month period of implementation, to allow for any minor adjustments that
may be required to ensure service delivery effectiveness.
3.2.6.10 ESTABLISHMENT OF PROGRAMME AND PROJECT MANAGEMENT CAPABILITY
IN TSHWANE
The CoT acknowledges that more and more complex challenges are faced in achieving
more with less money in shorter time frames. The eradication of backlogs targets have
been set, the millennium goals communicated and local government is required to perform
their infrastructure delivery in the face of increased administrative and legislative controls.
Also, additional developmental deliverables over and above the infrastructure construction
norm, such as the EPWP targets, as one of many examples are to be catered for as well.
The CoT in its endeavor to provide service excellence in managing and developing
infrastructure, and building sustainable and integrated communities, decided that a
structured, logical, systematic and organized project management approach is required.
No longer can costly mistakes be made, project components accidentally be left out,
necessary interactions between stakeholders be overlooked, delays incurred and legislative
requirements not be met through insufficient planning.
This establishment of the needed project management capacity emerged as an initiative
from the Office of the Chief Operating Officer to build the CoT’s project and programme
delivery capacity. The Prince 2 project management methodology was identified as the
most appropriate for Tshwane, due to the following:

Chapter 3: Strategic Agenda and Policy Guideline
Tshwane IDP 2006 – 2011 First Revision 171
• It emphasized skills development at the various levels of the organization, rather than
being focused purely at a project manager level;
• It is flexible and can therefore be tailored to an organisation’s needs;
• It can be adapted to be used for large complex projects or for small projects;
• It can be used to manage projects of different natures, such as pure infrastructure
projects or capacity development projects, and this has been tested specifically for
the public sector environment;
• Prince 2 practitioners are recognized worldwide as meeting international best practice
requirements in project management; and
• An organization with a Project Management Maturity Model, maturity rating and
roadmap for improvement, is recognized internationally as an organization that is
striving towards being a best practice, project management-centered organization.
Prince 2 is a management methodology that focuses on processes. It emphasises the
correct project management structures, clear definition of roles and responsibilities
between the various strategic and operational project management structures, clear and
standardized project initiation processes and documentation, quality assurance and risk
management.
This three-year programme aims to develop a way of managing projects in Tshwane based
on the Prince 2 methodology, which includes:
• Training people in the Prince 2 methodology;
• Training people in programme management;
• Benchmarking the CoT against international best practice project management
organizations (including both the private and public sectors);
• Implementing a roadmap to achieve desired project maturity status;
• Developing knowledge and resource partnerships with other best practice project
management institutions; and
• Coaching officials in managing projects using Prince 2.

Chapter 3: Strategic Agenda and Policy Guideline
Tshwane IDP 2006 – 2011 First Revision 172
3.2.6.11 MUNICIPAL SUPPLY CHAIN MANAGEMENT POLICY (SCMP)
The Minister of Finance has on 31st May 2 005 tabled in Parliament new regulations on
supply chain management processes for all the municipalities and their entities. These
were published in the Government Gazette No 27636 dated 30 May 2005 titled “Local
Government: Municipal Finance Management Act (56 of 2003): Municipal Supply Chain
Management Regulations”. These Regulations became effective on 1 July 2005.
The CoT drafted a SCMP which were approved by Council in July 2005. Furthermore, new
delegations in terms of the MFMA were drafted in order to align the organization with the
requirements of the three committee bid system prescribed by the new regulations.
The CoT timeously implemented the new SCMP from the promulgated compliance date of
1 October 2005 onwards.
3.2.6.12 TSHWANE ECONOMIC DEVELOPMENT AGENCY (TEDA)
It is critical that the economy of this city grows faster if we are to remain socially and
economically sustainable. The CoT has therefore investigated the feasibility of an economic
development agency. It will facilitate and promote local economic development in the
Municipal area of the City of Tshwane Metropolitan Municipality through initiating,
facilitating and implementing projects designed to further the economic development
objectives of the municipality. The TEDA will assume operational responsibility for business
support and trade promotion and project research and development. They will also drive
and implement special projects designed to meet Tshwane's strategic economic and social
objectives.
The TEDA will be a small, flexible and highly effective organisation. It will consist of a core
of highly skilled and motivated individuals and will leverage itself through inputs from the
City and private sector on different projects. The structure is designed to facilitate and
implement large development projects while at the same time accommodate SMME
development.
Chapter 3: Strategic Agenda and Policy Guideline
Tshwane IDP 2006 – 2011 First Revision 173
3.2.6.13 CUSTOMER CARE POLICY
It is the aim of the CoT to provide excellent quality of service to customers through the
following:
• Reliability – consistency of performance and dependability;
• Responsiveness – willingness and readiness to provide the service in good time;
• Competence – development/attainment of skills and knowledge required to perform
the service;
• Access – approachability of staff and ease of contact with the municipality;
• Courtesy – politeness, respect, consideration, and clean and neat appearance;
• Effective communication – educating and informing customers in a language they
understand and listening to them;
• Credibility – trustworthiness, reliability and honesty of the service provider;
• Security and confidentiality – freedom from danger, risk or doubt;
• Understanding and knowledge of the municipality and its customers – making an
effort to understand costumers’’ needs, learning the specific requirements and
providing individualized attention;
• Caring for and maintaining all tangibles – ensuring cleanliness, safety and
convenience of all physical assets, eg building and the municipality’s vehicle fleet, a
swell as the appearance of staff; and
• The creation of a one-stop integrated customer care system.
The CoT Customer Care Policy is based on the Batho Pele principals.