Chapter 3 Properties of Pure Substances (Property...
78
Chapter 3 Properties of Pure Substances (Property Tables)
Transcript of Chapter 3 Properties of Pure Substances (Property...

Chapter 3
Properties of Pure Substances(Property Tables)

2
We now turn our attention to the concept of pure substances and the presentation of their data.
Simple System
A simple system is one in which the effects of motion, viscosity, fluid shear, capillarity, anisotropic stress, and external forcefields are absent.
Homogeneous Substance
A substance that has uniform thermodynamic properties throughout is said to be homogeneous.

3
Pure Substance
A pure substance has a homogeneous chemical composition but it could exist in more than one phase (or state).
Examples:
1. Water (solid, liquid, and vapor phases) 2. A Mixture of a liquid and a vapor 3. A gas like Carbon dioxide (CO2) or Nitrogen (N2) 4. Mixtures of gases, such as: O2, N2 and CO2 to
make something uniform like air, as long as there is no change of phase.

4
State Postulate (Extremely Important)
The state postulate for a pure substance says that the equilibrium state of a pure substance is completely determined by specifying any two independent intensive properties.
The P-v-T Surface for a Real Substance
The properties of these substances may be illustrated by the functional relation
F(P,v,T) = 0,
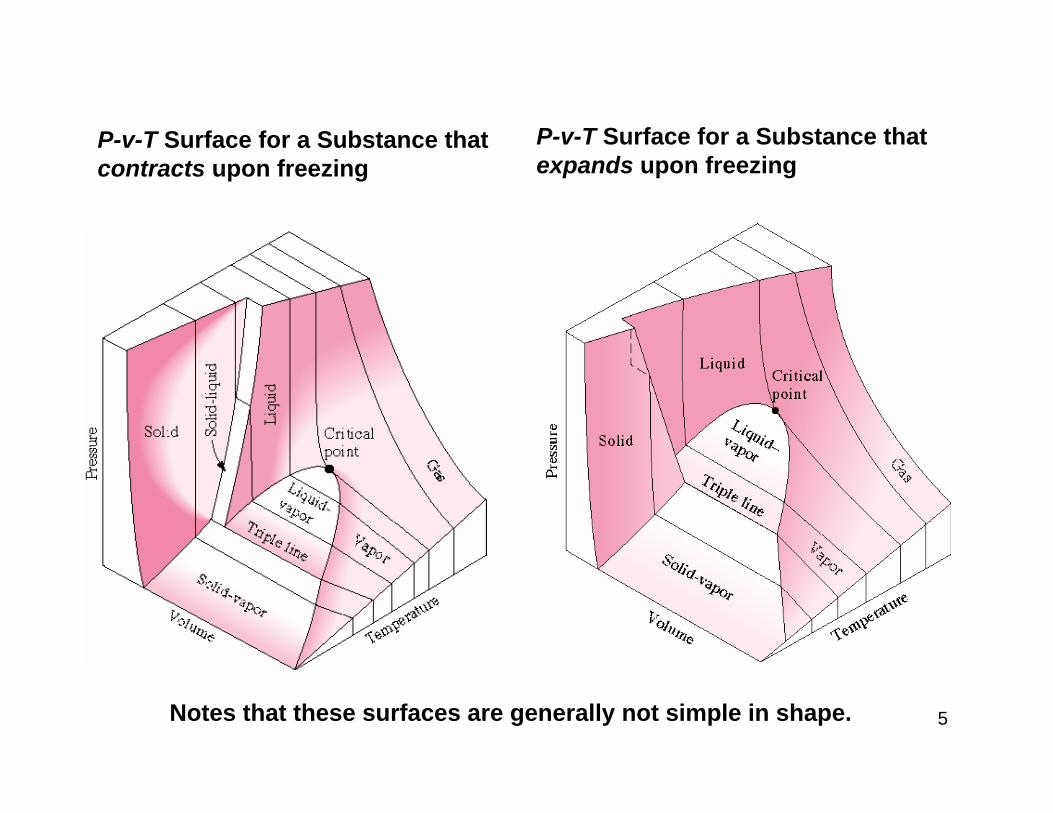
called an equation of state. This represents a surface in some P-v-T space. The next two figures illustrate typical shapes of these surfaces for substances that contract on freezing and for substances that expand on freezing.
5
P-v-T Surface for a Substance thatcontracts upon freezing
P-v-T Surface for a Substance that expands upon freezing
Notes that these surfaces are generally not simple in shape.
6
Real substances that readily change phase from solid to liquid to gas such as water and refrigerant-134a cannot be treated as ideal gases (discussed later) in general. The P-v-T relation, or equation of state for these substances is generally very complicated and cannot be represented in a simple algebraic form. Instead these thermodynamic properties are given in tabular form.
The previous figures show three regions where a substance like water may exist as a solid, liquid or gas (or vapor).
Also these figures show that a substance may coexist as a mixture of two phases during a phase change, solid-vapor, solid-liquid, and liquid-vapor.
Water may exist in: (i) the compressed liquid region, (ii) a region where saturated liquid water and saturated water vapor are in equilibrium (called the saturation region), and (iii) the superheated vapor region. The solid or ice region is not shown and we will not be concerned with this region in this course.
7
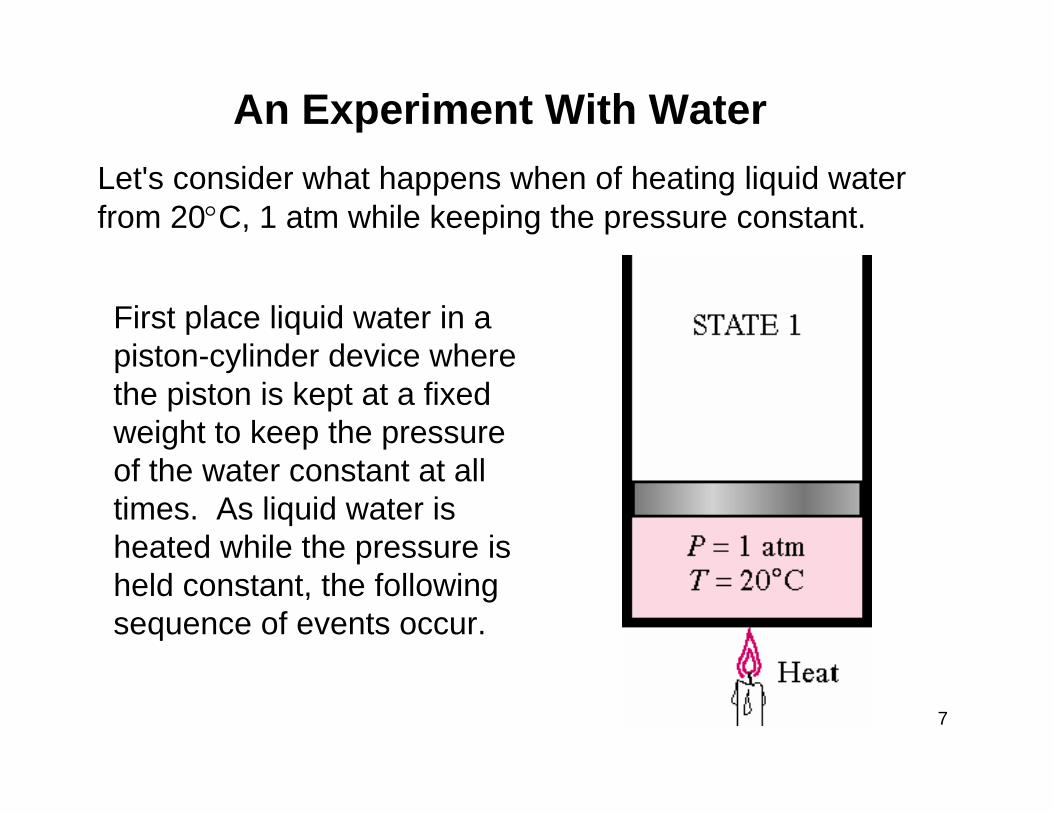
First place liquid water in a piston-cylinder device where the piston is kept at a fixed weight to keep the pressure of the water constant at all times. As liquid water is heated while the pressure is held constant, the following sequence of events occur.
Let's consider what happens when of heating liquid water from 20°C, 1 atm while keeping the pressure constant.
An Experiment With Water
8
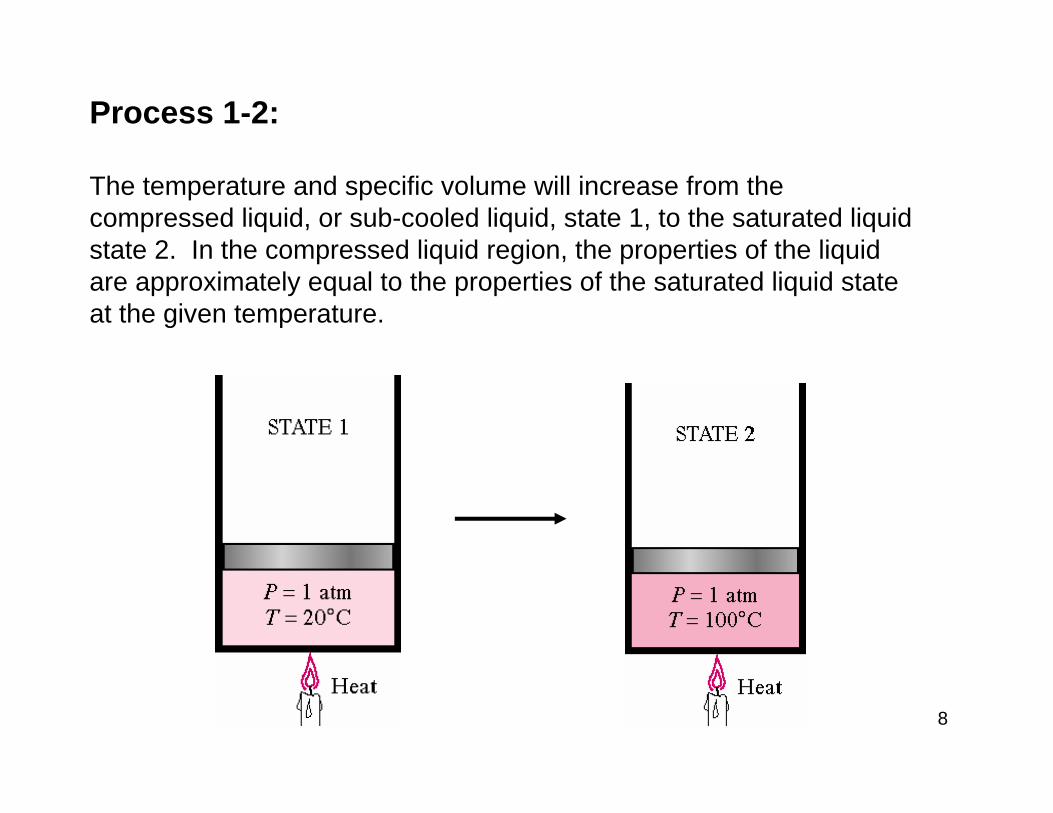
Process 1-2:
The temperature and specific volume will increase from the compressed liquid, or sub-cooled liquid, state 1, to the saturated liquid state 2. In the compressed liquid region, the properties of the liquid are approximately equal to the properties of the saturated liquid state at the given temperature.

9
Process 2-3:
At state 2 the liquid has reached the temperature at which it just begins to vaporize (boil), called the saturation temperature, and is said to exist as a saturated liquid. Properties at the saturated liquid state are noted by the subscript f and v2 = vf. During this phase change (from liquid to vapor) both the temperature and pressure remain constant. At state 3 the liquid and vapor phase coexist in equilibrium and any point on the line between states 2 and 3 has the same temperature and pressure.
10
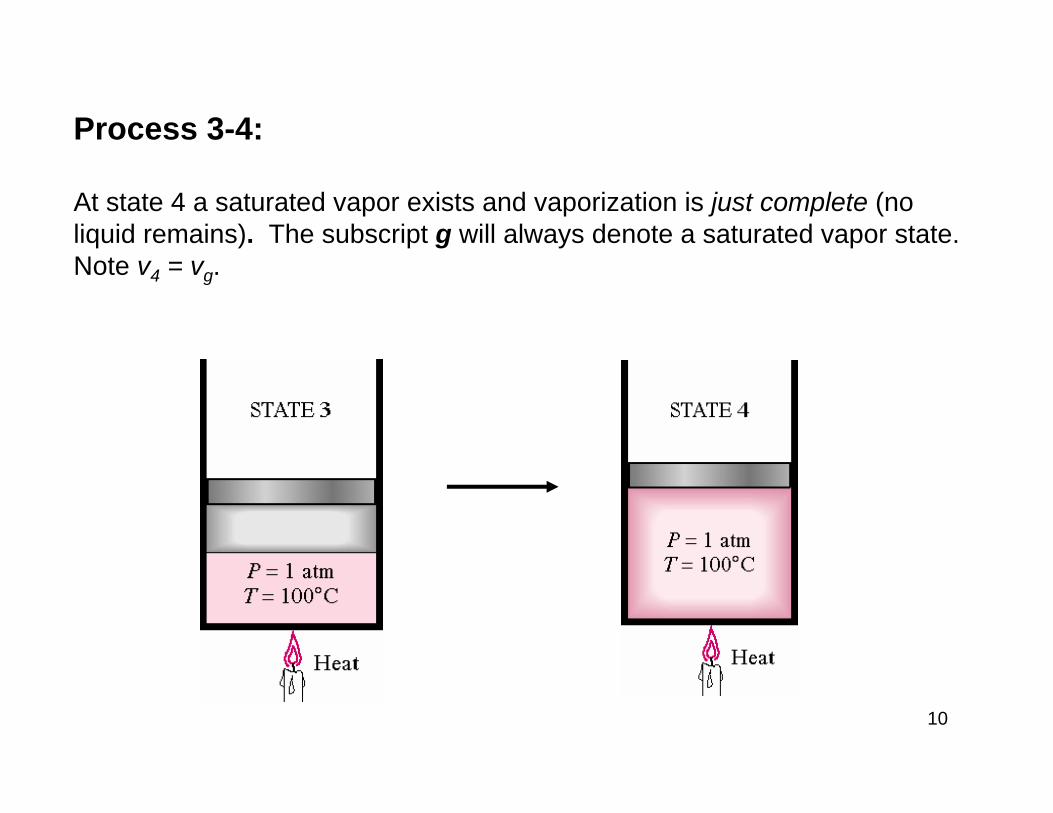
Process 3-4:
At state 4 a saturated vapor exists and vaporization is just complete (no liquid remains). The subscript g will always denote a saturated vapor state. Note v4 = vg.

11
Process 4-5:
If the constant pressure heating is continued, the temperature will begin to increase above the saturation temperature, 100 °C in this example, and the volume also increases. State 5 is called a superheated state because T5 is greater than the saturation temperature for the pressure and the vapor is not about to condense.

12
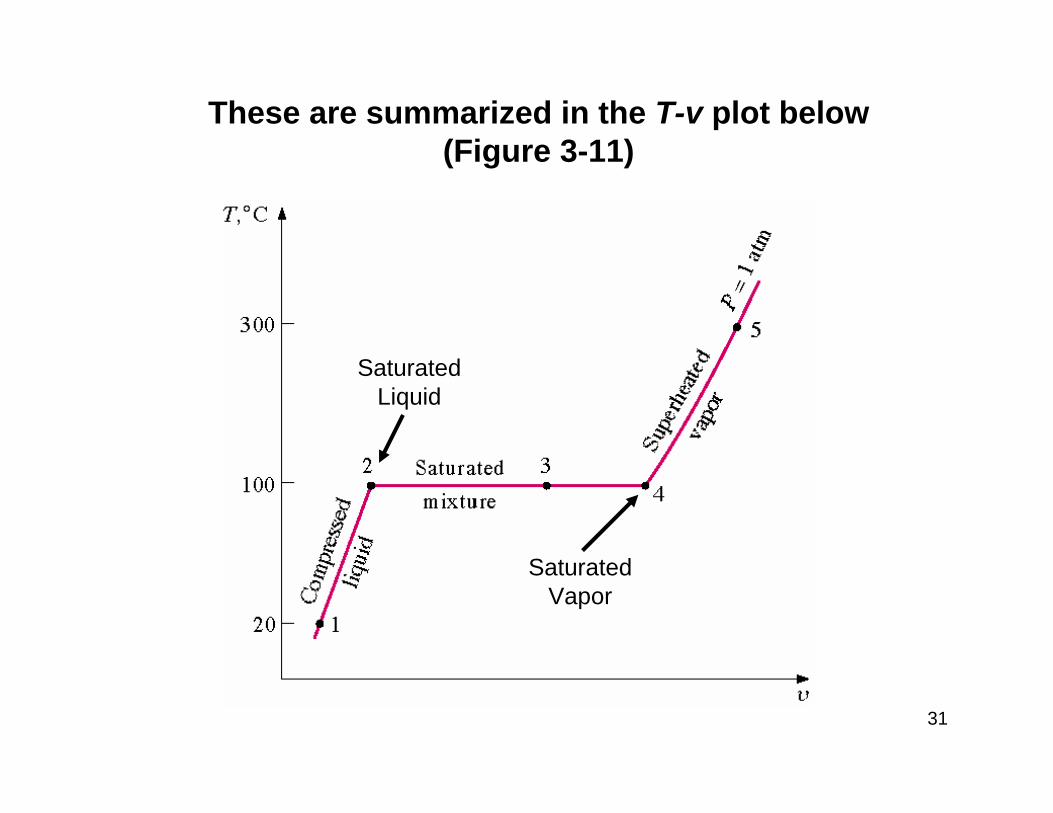
These are summarized in the T-v plot below (Figure 3-11)
SaturatedLiquid
SaturatedVapor

13
Repeating this process for other constant pressure lines (curves) are shown below.

14
Thermodynamic properties at the saturated liquid state and saturated vapor state are given in Tables A-4 (for water) and A-11 (for R-134a) as the saturated temperature table and Tables A-5 (for water) and A-12 (for R-134a) as the saturated pressure table. In Tables A-4 and A-11 the saturation temperature is the independent property, and in Tables A-5 and A-12 the saturation pressure is the independent property.
The saturation pressure (temperature) is the pressure (temperature) at which phase change just starts to occur for a given temperature (pressure). In the saturation region the temperature and pressure are dependent properties; if one is known, then the other is automatically known.
Thermodynamic properties in the superheated region are found in the superheated tables, Tables A-6 (for water) and A-13 (for R-134a). Here temperature and pressure are independent properties. Knowledge of one does not give the other.
Tables A-4, A-5, A-6, A-11, A-12, A-13

15
A Small Portion of Table A-4

16
A Small Portion of Table A-5

17
A Small Portion of Table A-6

18
If all of the saturated liquid states are connected, the saturated liquid curve is established.
If all of the saturated vapor states are connected, the saturated vapor curve is established.
These two lines intersect at the critical point and form what is often called the “steam dome.”
The region to the left of the saturated liquid line and below the critical temperature is called the compressed liquid region.
The region between the saturated liquid line and the saturated vapor line is called by these terms: saturated liquid-vapor mixture region, wet region (i.e., a mixture of saturated liquid and saturated vapor), two-phase region, or just the saturation region.
The region to the right of the saturated vapor line or above the critical temperature is called the superheated vapor region.

19
The steam dome for T versus v

20
The steam dome for P versus v

21
Notice that the trend of the temperature following a constant pressure curveis to increase with increasing volume and the trend of the pressure following a constant temperature curve is to decrease with increasing volume. See Table A-1 for the critical point data for selected substances.
T versus v P versus v

22
A Small Portion of Table A-1

23
The student should review the P-v diagrams for substances that contract on freezing and those that expand on freezing given in Figure 3-21 and Figure 3-22 of the text.
At temperatures and pressures above the critical point, the phase transition from liquid to vapor is no longer discrete.
24
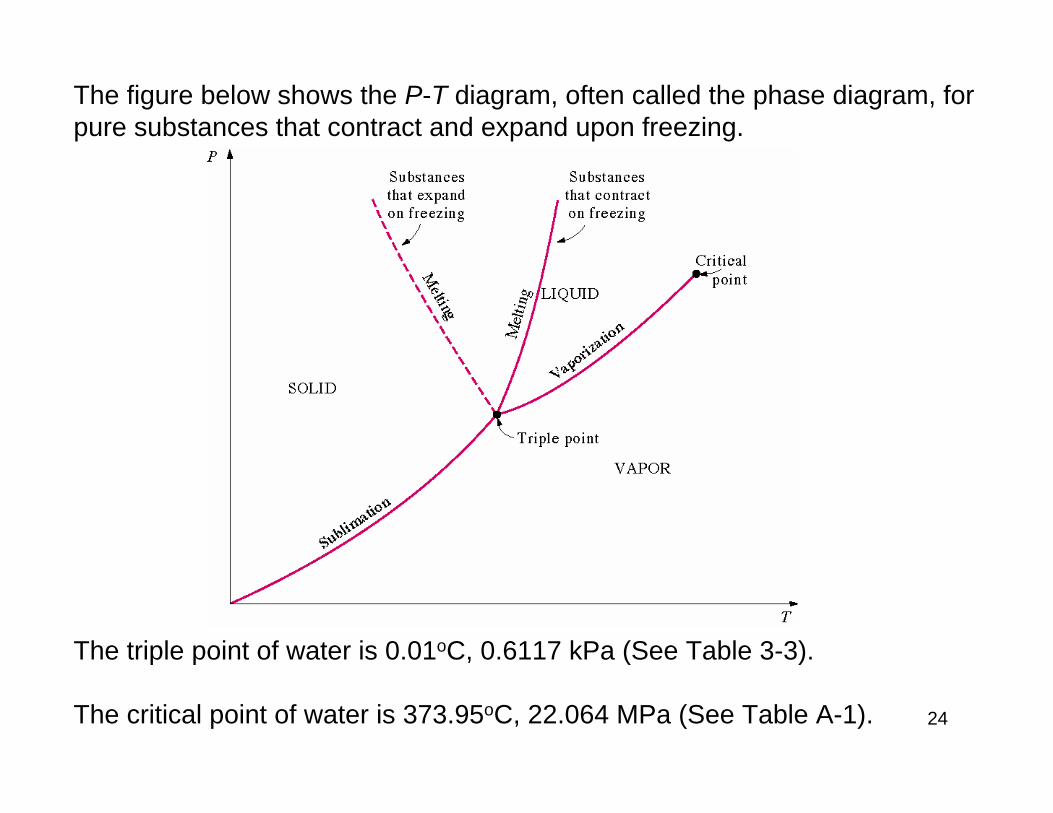
The figure below shows the P-T diagram, often called the phase diagram, for pure substances that contract and expand upon freezing.
The triple point of water is 0.01oC, 0.6117 kPa (See Table 3-3).
The critical point of water is 373.95oC, 22.064 MPa (See Table A-1).
25
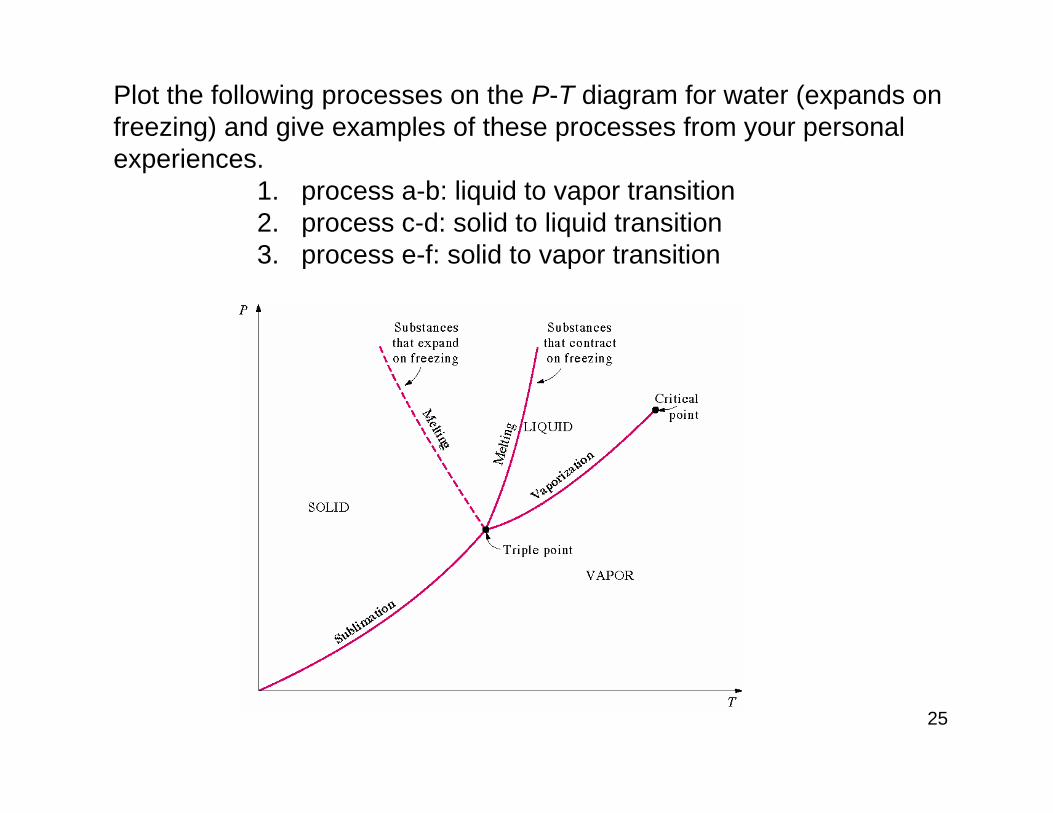
Plot the following processes on the P-T diagram for water (expands on freezing) and give examples of these processes from your personal experiences.
1. process a-b: liquid to vapor transition 2. process c-d: solid to liquid transition 3. process e-f: solid to vapor transition

26
Property Tables
In addition to the temperature, pressure, and volume data, Tables A-4 through A-6 and A-11 through A-13 contain the data for the specific internal energy u the specific enthalpy h and the specific entropy s. The enthalpy is a convenient grouping of the internal energy, pressure, and volume and is given by
H U PV= +The enthalpy per unit mass is h = u + Pv.
We will find that the enthalpy h is quite useful in calculating the energy of mass streams flowing into and out of control volumes. The enthalpy is also useful in the energy balance during a constant pressure process for a substance contained in a closed piston-cylinder device. The enthalpy has units of energy per unit mass, kJ/kg. The entropy s is a property defined by the second law of thermodynamics and is related to the heat transfer to a system divided by the system temperature; thus, the entropy has units of energy divided by temperature. The concept of entropy is explained in Chapters 6 and 7.

27
Saturated Liquid-Vapor Tables
Since temperature and pressure are dependent properties under the phase change, two tables are given for the saturation liquid-vapor region.
Table A-4 (for water) and Table A-11 (for R-134a) has temperature as the independent property.
Table A-5 (for water) and Table A-12 (for R-134a) has pressure as the independent property.
These two tables contain the same information and portions of these are given in the next two slides.

28
A Small Portion of Table A-4

29
A Small Portion of Table A-5

30
Saturation pressure is the pressure at which the liquid and vapor phases are in equilibrium at a given temperature.
Saturation temperature is the temperature at which the liquid and vapor phases are in equilibrium at a given pressure.
In Figure 3-11, states 2, 3, and 4 are saturation states.
The subscript fg used in Tables A-4 and A-5 refers to the difference between the saturated vapor value and the saturated liquid value region. That is,
u u uh h hs s s
fg g f
fg g f
fg g f
= −
= −
= −
The quantity hfg is called the enthalpy of vaporization (or latent heat of vaporization). It represents the amount of energy needed to vaporize a unit of mass of saturated liquid at a given temperature or pressure. It decreases as the temperature or pressure increases, and becomes zero at the critical point.
31
These are summarized in the T-v plot below (Figure 3-11)
SaturatedLiquid
SaturatedVapor

32
Saturated Liquid-Vapor mixture
A substance is said to be saturated mixture if the given temperature equals the saturation temperature at the given pressure, or if the given pressure equals the saturation pressure at the given temperature.
State 3 in Figure 3-11 is a saturated mixture.
In the saturated mixture Tables A-4 and A-5, T and P are the dependent properties.
Conditions for Saturated Liquid-Vapor mixture (Given either T, P or y):
P = Psat@T or T = Tsat@P
yf@(T or P) < y < yg@(T or P) (for y = v, u, h, or s)
33
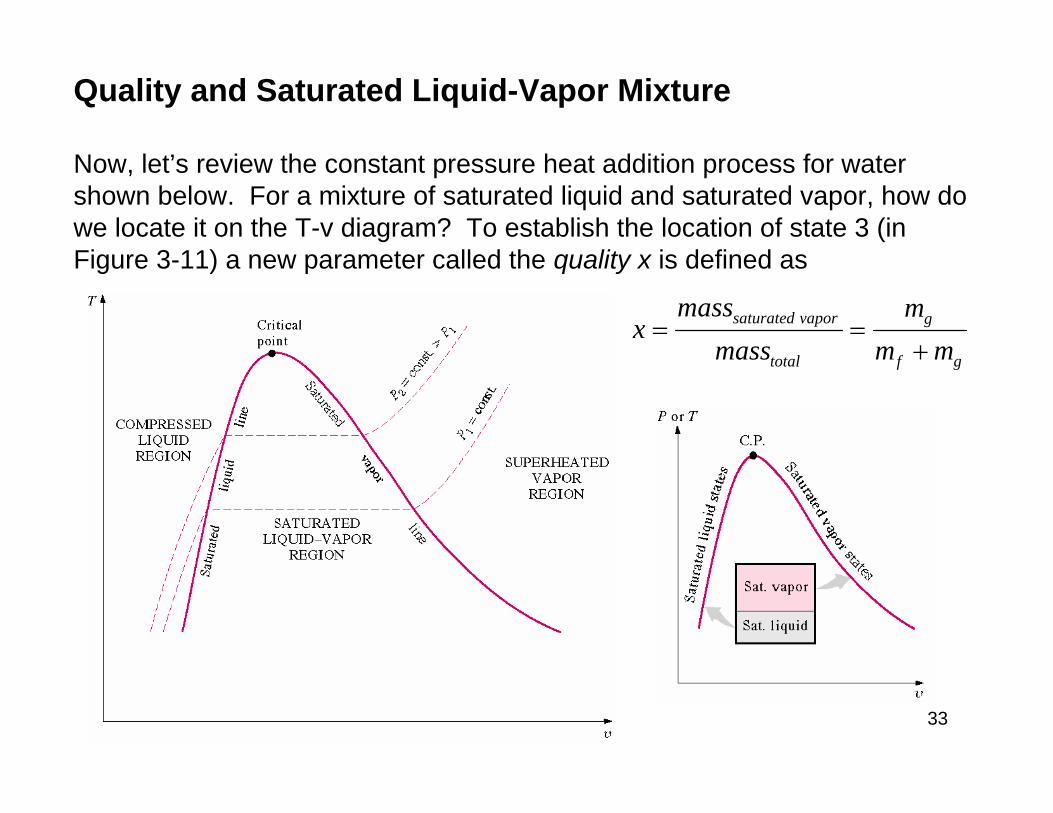
Quality and Saturated Liquid-Vapor Mixture
Now, let’s review the constant pressure heat addition process for water shown below. For a mixture of saturated liquid and saturated vapor, how do we locate it on the T-v diagram? To establish the location of state 3 (in Figure 3-11) a new parameter called the quality x is defined as
xmass
massm
m msaturated vapor
total
g
f g
= =+

34
The quality is 0 for the saturated liquid and 1 for the saturated vapor (0 ≤ x ≤1). The average specific volume at any state 3 is given in terms of the quality as shown below. Consider a mixture of saturated liquid and saturated vapor. The liquid has a mass mf and occupies a volume Vf. The vapor has a mass mg and occupies a volume Vg.
v x v xvf g= − +( )1
The Lever Rule

35
We note
V V Vm m mV mv V m v V m v
f g
f g
f f f g g g
= +
= +
= = =, ,
mv m v m v
vm v
mm v
m
f f g g
f f g g
= +
= +
Recall the definition of quality x
xmm
mm m
g g
f g
= =+
so that mm
m mm
xf g=−
= −1
Note, quantity 1- x is often given the name moisture. The specific volume of the saturated mixture becomes
v x v xvf g= − +( )1
and so

36
The form that we use most often is
v v x v vf g f= + −( )
It is noted that the value of any extensive property per unit mass in the saturation region is calculated from an equation having a form similar to that of the above equation. Let Y be any extensive property and let y be the corresponding intensive property, y = Y/m, then
y Ym
y x y y
y x ywhere y y y
f g f
f fg
fg g f
= = + −
= +
= −
( )
The term yfg is the difference between the saturated vapor and the saturated liquid values of the property y; y may be replaced by any of the variables v, u, h, or s.
We often use the lever rule to determine the quality x of a saturated liquid-vapor state.
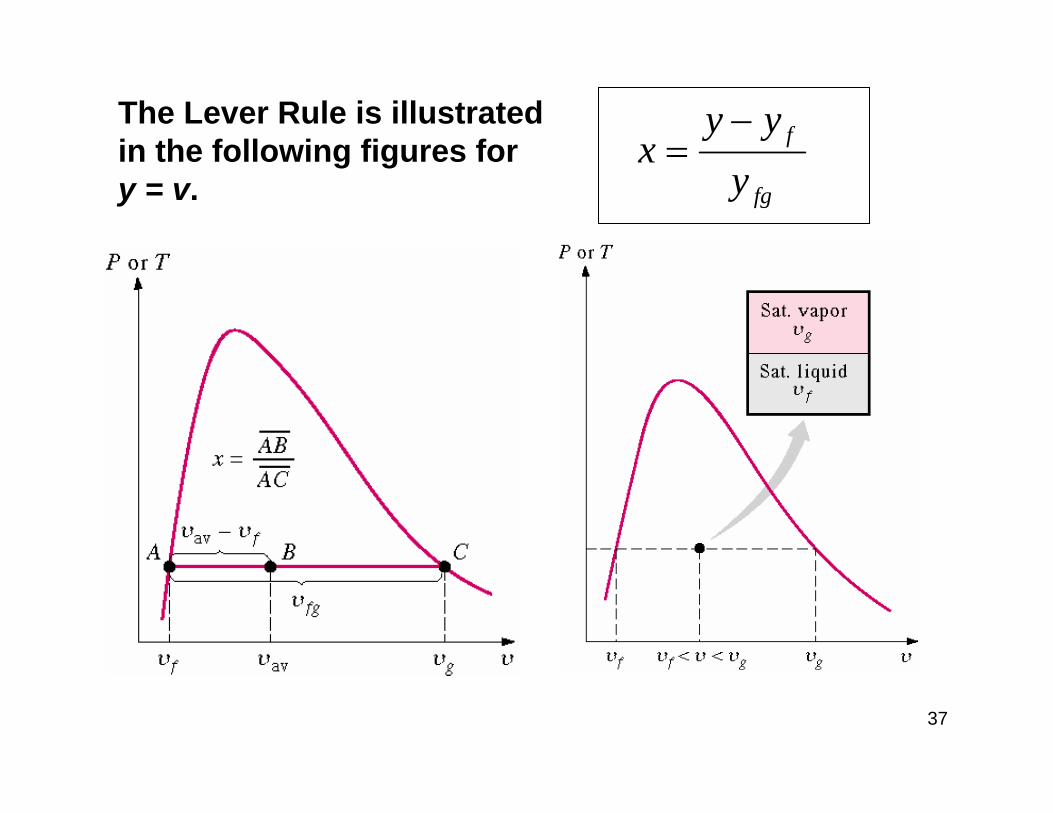
37
xy y
yf
fg
=−The Lever Rule is illustrated
in the following figures fory = v.
38
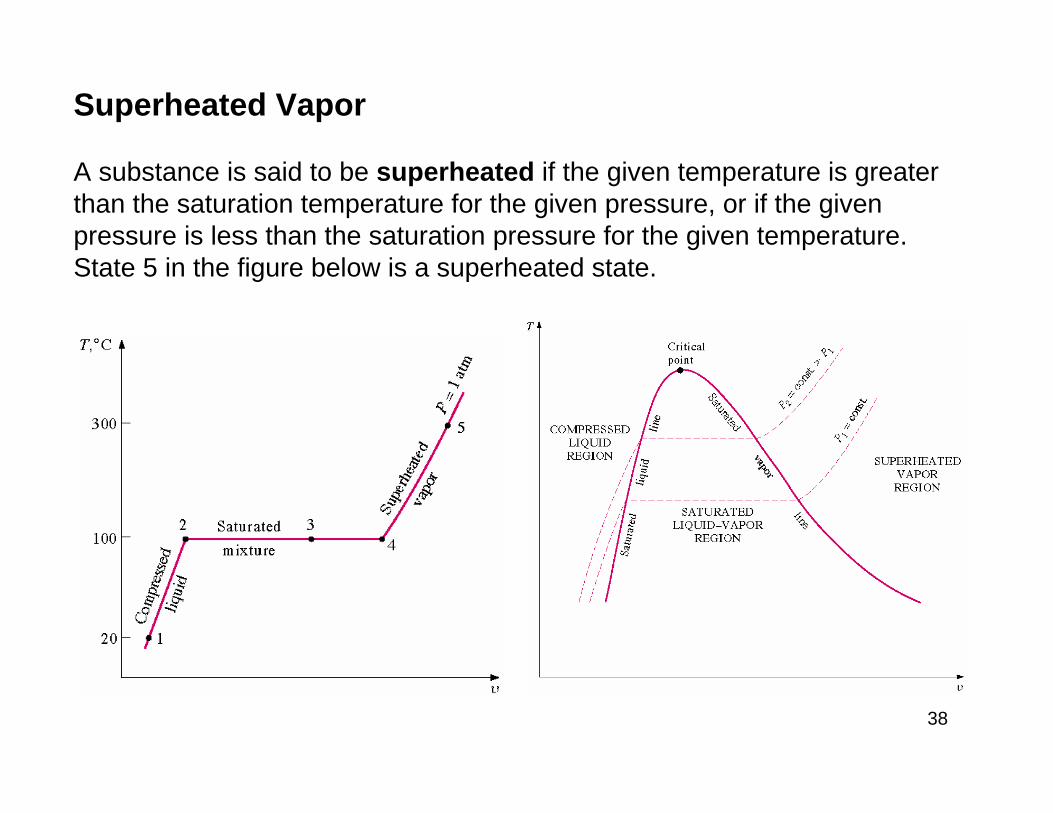
Superheated Vapor
A substance is said to be superheated if the given temperature is greater than the saturation temperature for the given pressure, or if the given pressure is less than the saturation pressure for the given temperature. State 5 in the figure below is a superheated state.

39
Superheated Vapor
In the superheated water Table A-6, T and P are the independent properties. The value of temperature to the right of the pressure is the saturation temperature for the pressure.
The first entry in the next table is the saturated vapor state at the given pressure.
Conditions for Superheated Vapor (Given either T, P, or y):
P < Psat@T or T > Tsat@P
y > yg@(T or P) (for y = v, u, h, or s)

40
A Small Portion of Table A-6
41
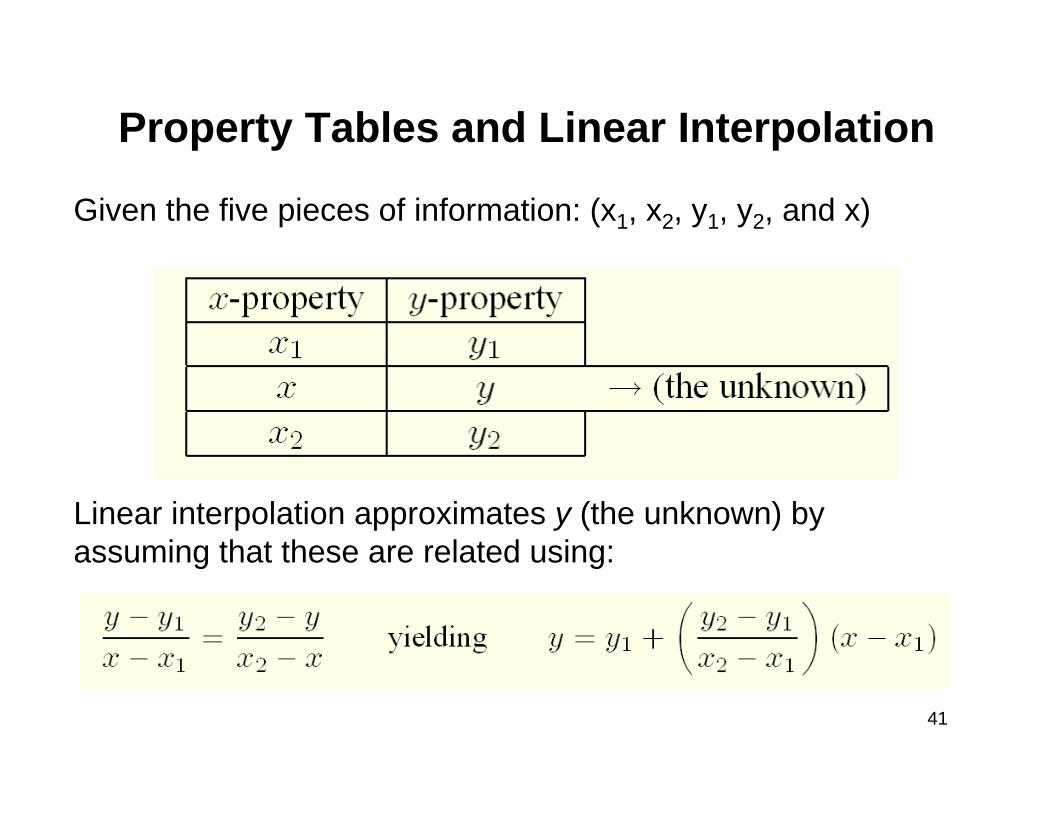
Property Tables and Linear Interpolation
Given the five pieces of information: (x1, x2, y1, y2, and x)
Linear interpolation approximates y (the unknown) by assuming that these are related using:

42
Example Problem:Determine the specific volume of water when T = 220 0C and P = 0.1 MPa.Solution:

43
Example Problem:Determine the saturation pressure for water at T = 18 0C.Solution:

44
Compressed Liquid
A substance is said to be a compressed liquid when the pressure is greater than the saturation pressure for the given temperature or when the temperature is less than the saturation temperature for the given pressure.
It is now noted that state 1 in the figure below is called a compressed liquid state because the saturation pressure for the temperature T1 is less than the saturation temperature at P1

45
Compressed Liquid
Data for water compressed liquid states are found in the compressed liquid tables, Table A-7. Table A-7 is arranged like Table A-6, except the saturation states are the saturated liquid states. Note that the data in Table A-7 begins at 5 MPa or 50 times atmospheric pressure.
Conditions for Compressed Liquid (Given either T, P, or y):
P > Psat@T or T < Tsat@P
y < yf@(T or P) (for y = v, u, h, or s)

46
A Small Portion of Table A-7

47
The Compressed-Liquid Approximation
At pressures below 5 MPa for water, the data are approximately equal to the saturated liquid data at the given temperature. We approximate intensive parameter y, when y equals either of v, u and s data as
The enthalpy (h) is more sensitive to variations in pressure; therefore, at high pressures the enthalpy is approximated by

48
Eight Quantities of Interest
• Pressure (kPa): P• Temperature (0C or K): T• Specific Volume (m3/kg): v• Specific Internal Energy (kJ/kg): u• Specific Enthalpy (kJ/kg): h• Specific Entropy (kJ/(kg . K)): s• Quality: x (for liquid-vapor mixture only)• Phase: Liquid, Mixture, Vapor, etc.

49
Choosing the right table
For any given information, use the saturation tables to firstdetermine:
(a) Tsat@P or Psat@T as well as (b) yf@(T or P) and (c) yg@(T or P)
for y = v, u, h and s. Then use the conditions summarized on the next few slides.
Study Example 3-9 in the text very carefully andDo Problems 3-23 through 3-30, inclusive.
This is Extremely Important and will be discussed more in the recitations.

50
Given: y (either v, u, h, s) and TLook Up yf@T and yg@T
yf@T yg@T
Compressed Saturated Saturated Saturated SuperheatedLiquid Liquid Mixture Vapor Vapor
The y (v, u, h, s) - T Number LineLook Where The Given Value of y Falls
Table A-6 (Water)Table A-13 (R-134a)
Table A-4 (Water)Table A-11 (R-134a)
Table A-4 (Water)Table A-11 (R-134a)Compressed Liquid
Approximation
51
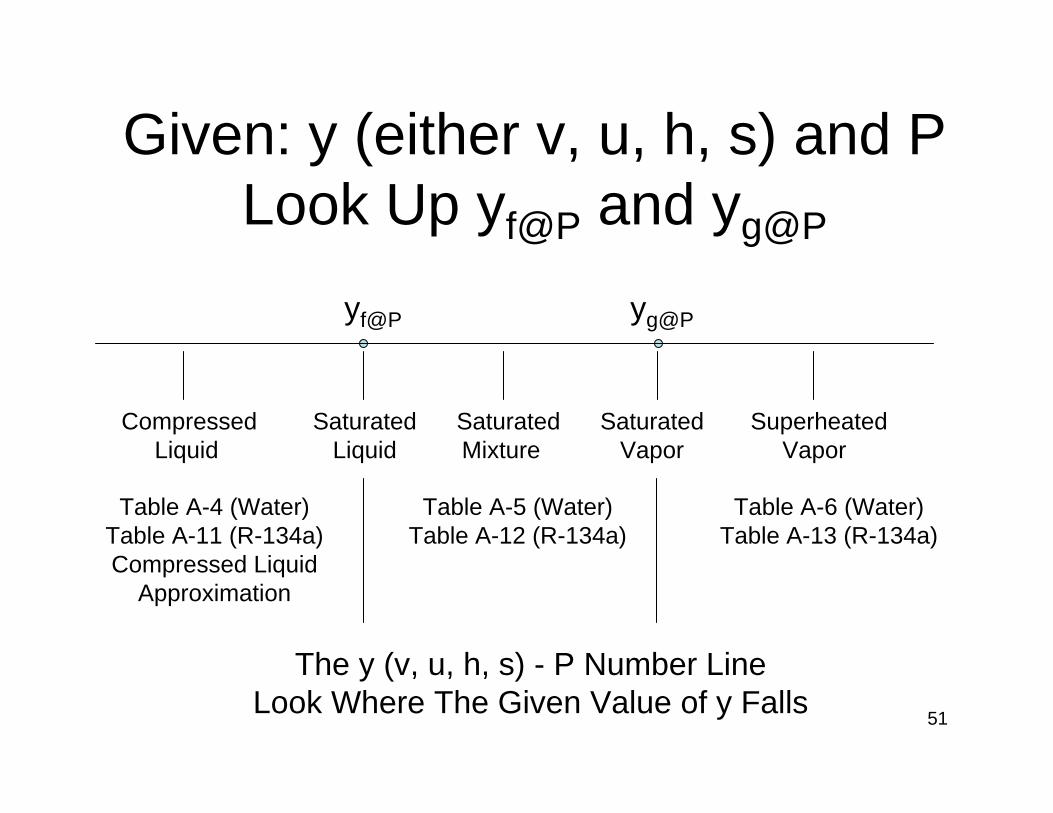
Given: y (either v, u, h, s) and PLook Up yf@P and yg@P
yf@P yg@P
Compressed Saturated Saturated Saturated SuperheatedLiquid Liquid Mixture Vapor Vapor
The y (v, u, h, s) - P Number LineLook Where The Given Value of y Falls
Table A-6 (Water)Table A-13 (R-134a)
Table A-5 (Water)Table A-12 (R-134a)
Table A-4 (Water)Table A-11 (R-134a)Compressed Liquid
Approximation

52
Given: P and TLook Up Tsat@P
Tsat@P
Compressed Saturated Saturated Saturated SuperheatedLiquid Liquid Mixture Vapor Vapor
The P - T Number LineLook Where The Given Value of T Falls
Table A-4 (Water)Table A-11 (R-134a)Compressed Liquid
Approximation
Table A-6 (Water)Table A-13 (R-134a)
Table A-5 (Water)Table A-12 (R-134a)

53
Given: P and TLook Up Psat@T
Psat@T
The P - T Number LineLook Where The Given Value of T Falls
Table A-4 (Water)Table A-11 (R-134a)Compressed Liquid
Approximation
Table A-6 (Water)Table A-13 (R-134a)
Table A-4 (Water)Table A-11 (R-134a)
Superheated Saturated Saturated Saturated CompressedVapor Vapor Mixture Liquid Liquid
Chapter 3
Properties of Pure Substances(Equations of State)

55
Equations of State
The relationship among the state variables, temperature, pressure, and specific volume is called the equation of state. We now consider the equation of state for the vapor or gaseous phase of simple compressible substances.

56
Ideal Gas Equation of State
Based on our experience in chemistry and physics we recall that the combination of Boyle’s and Charles’ laws for gases at low pressure result in the equation of state for the ideal gas as
F(P,T,v) = Pv - RT = 0
where R is the constant of proportionality and is called the gas constant and takes on a different value for each gas (see Table A-1). If a gas obeys this relation, it is called an ideal gas. We often write this equation as
Pv = RT or PV = mRT

57
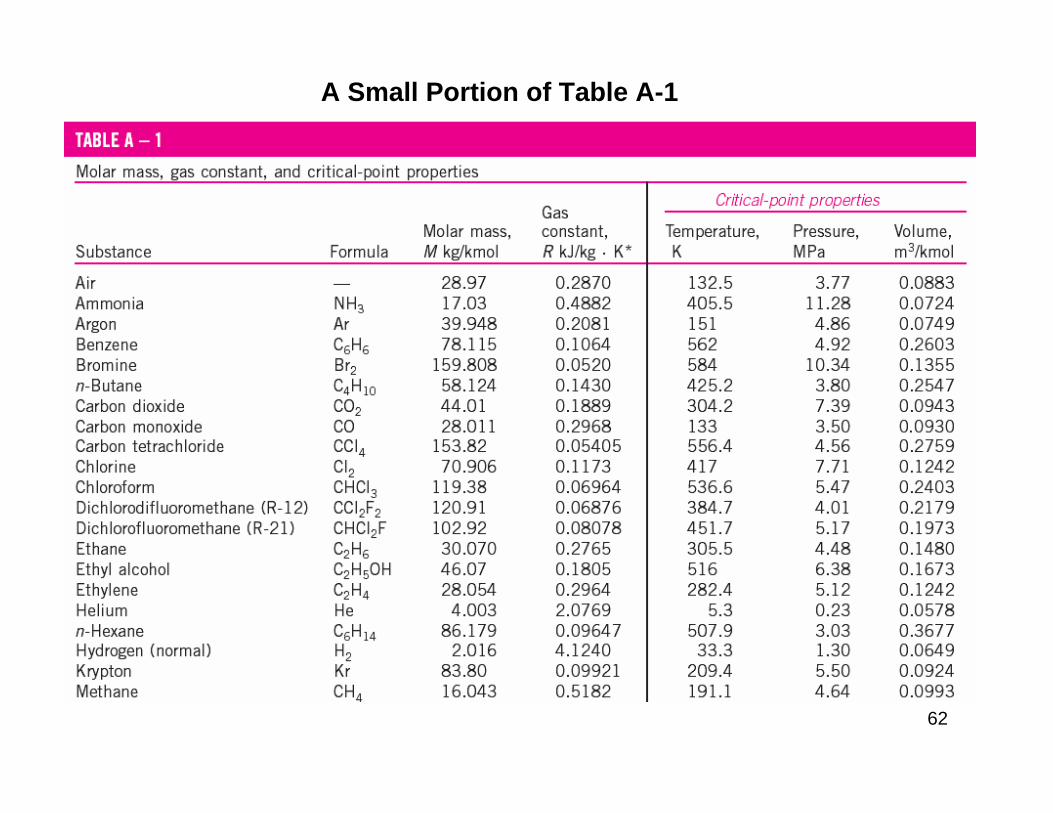
A Small Portion of Table A-1

58
The gas constant for ideal gases is related to the universal gas constant valid for all substances through the molar mass (or molecular weight). Let Ru be the universal gas constant. Then,
Ru = MR = 8.31447 kJ/(kmol . K).The mass, m, is related to the moles, N, of substance through the molecular weight or molar mass, M, see Table A-1. The molar mass is the ratio of mass to moles and has the same value regardless of the system of units. For example,
M ggmol
kgkmol
lbmlbmolair = = =28 97 28 97 28 97. . .
Since 1 kmol = 1000 gmol (1000 gram-mole) and 1 kg = 1000 g, 1 kmol of air has a mass of 28.97 kg or 28,970 grams.
m = NM
59
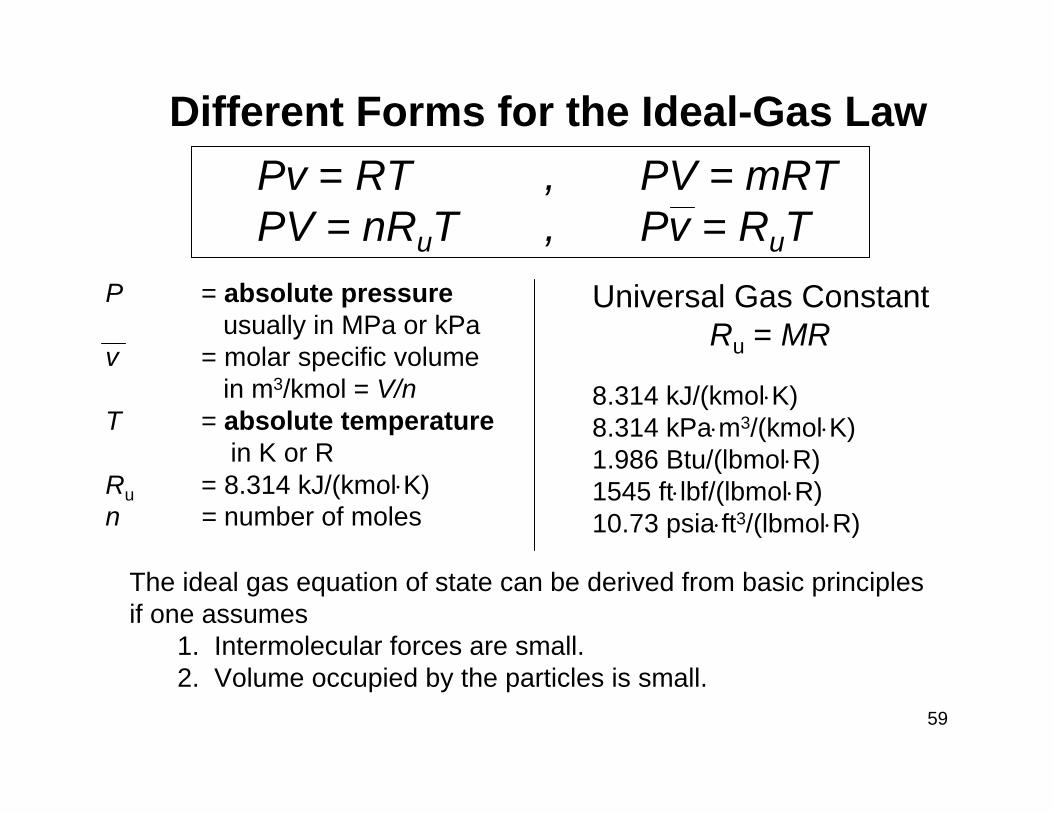
Pv = RT , PV = mRTPV = nRuT , Pv = RuT
P = absolute pressureusually in MPa or kPa
v = molar specific volume in m3/kmol = V/n
T = absolute temperaturein K or R
Ru = 8.314 kJ/(kmol⋅K)n = number of moles
Different Forms for the Ideal-Gas Law
Universal Gas ConstantRu = MR
8.314 kJ/(kmol⋅K)8.314 kPa⋅m3/(kmol⋅K)1.986 Btu/(lbmol⋅R)1545 ft⋅lbf/(lbmol⋅R)10.73 psia⋅ft3/(lbmol⋅R)
The ideal gas equation of state can be derived from basic principles if one assumes
1. Intermolecular forces are small.2. Volume occupied by the particles is small.

60
Example Problem
Determine the particular gas constant for air and hydrogen.
R RM
R
kJkmol K
kgkmol
kJkg K
u
air
=
= − =−
8 314
28 970 287
.
..
R
kJkmol K
kgkmol
kJkg Khydrogen =
− =−
8 314
2 0164 124
.
..
61
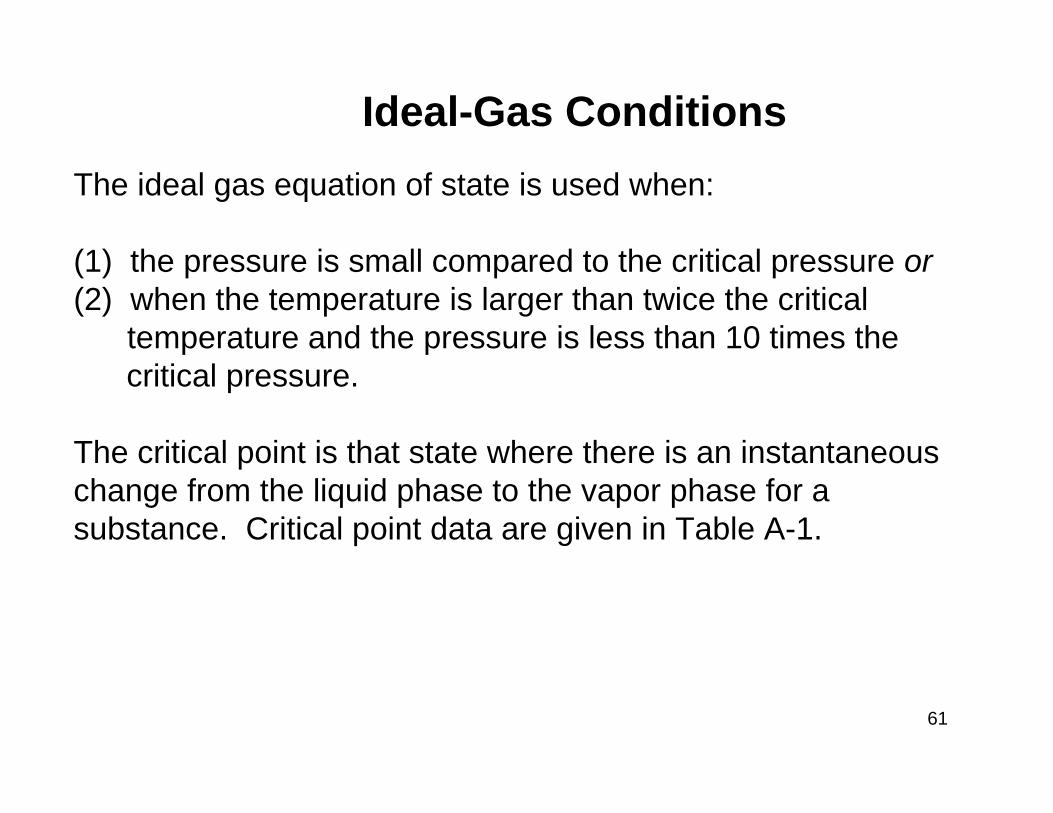
The ideal gas equation of state is used when:
(1) the pressure is small compared to the critical pressure or(2) when the temperature is larger than twice the critical
temperature and the pressure is less than 10 times the critical pressure.
The critical point is that state where there is an instantaneouschange from the liquid phase to the vapor phase for a substance. Critical point data are given in Table A-1.
Ideal-Gas Conditions
62
A Small Portion of Table A-1

63
T TT
P PPR
crR
cr
= = and
where Pcr and Tcr are the critical pressure and temperature, respectively. The critical constant data for various substances are given in Table A-1. This is known as the principle of corresponding states.
Compressibility Factor
To determine how much the ideal gas equation of state deviates from the actual gas behavior, we introduce the compressibility factor Z as follows.
Pv = ZRT or Z = Pv/RTFor an ideal gas, Z = 1, and the deviation of Z from unity measures the deviation of the actual P-v-T relation from the ideal gas equation of state. The compressibility factor is expressed as a function of the reduced pressure and the reduced temperature and the Z factor is approximately the same for all gases at the same reduced temperature and reduced pressure, which are defined as

64
The figure below gives a comparison of Z factors for various gases and supports the principle of corresponding states. Figure A-15 presents the generalized compressibility chart based on data for a large number of gases.

65
Figure A-5a

66
Figure A-5b

67
When either P or T is unknown, Z can be determined from the compressibility chart with the help of the pseudo-reduced specific volume, defined as
v vRTP
Ractual
cr
cr
=
Figure A-15 presents the generalized compressibility chart based on data for a large number of gases. Uses of this will be shown in recitation.
These charts show the conditions for which Z = 1 and the gas behaves as an ideal gas:
1. PR < 10 and TR > 2 or P < 10Pcr and T > 2Tcr2. PR << 1 or P << Pcr
Note: When PR is small, we must make sure that the state is not in the compressed liquid region for the given temperature. A compressed liquid state is certainly not an ideal gas state.

68
The critical pressure and temperature for air are 3.77 MPa and 132.5 K, respectively. For temperatures greater than 265 K and pressures less than 37.7 MPa (1 atmosphere pressure is 0.10135 MPa) air is considered to be an ideal gas. Thus under normal room temperature air can be treated as an ideal gas.

69
Example Problem
Calculate the specific volume of nitrogen at 300 K and 8.0 MPa and compare the result with the value given in a nitrogen table as v = 0.011133 m3/kg. From Table A.1 for nitrogen
Tcr = 126.2 K, Pcr = 3.39 MPa R = 0.2968 kJ/kg-K
T TT
KK
P PP
MPaMPa
Rcr
Rcr
= = =
= = =
300126 2
2 38
8 03 39
2 36
..
..
.
Since TR > 2 and PR < 10, we may use the ideal gas equation of state

70
Pv RT
v RTP
kJkg K
K
MPam MPa
kJmkg
=
= = −
=
0 2968 300
8 0 10
0 01113
3
3
3
. ( )
.
.
Nitrogen is clearly an ideal gas at this state since v = 0.011133 m3/kg.
Example Problem (Continued)

71
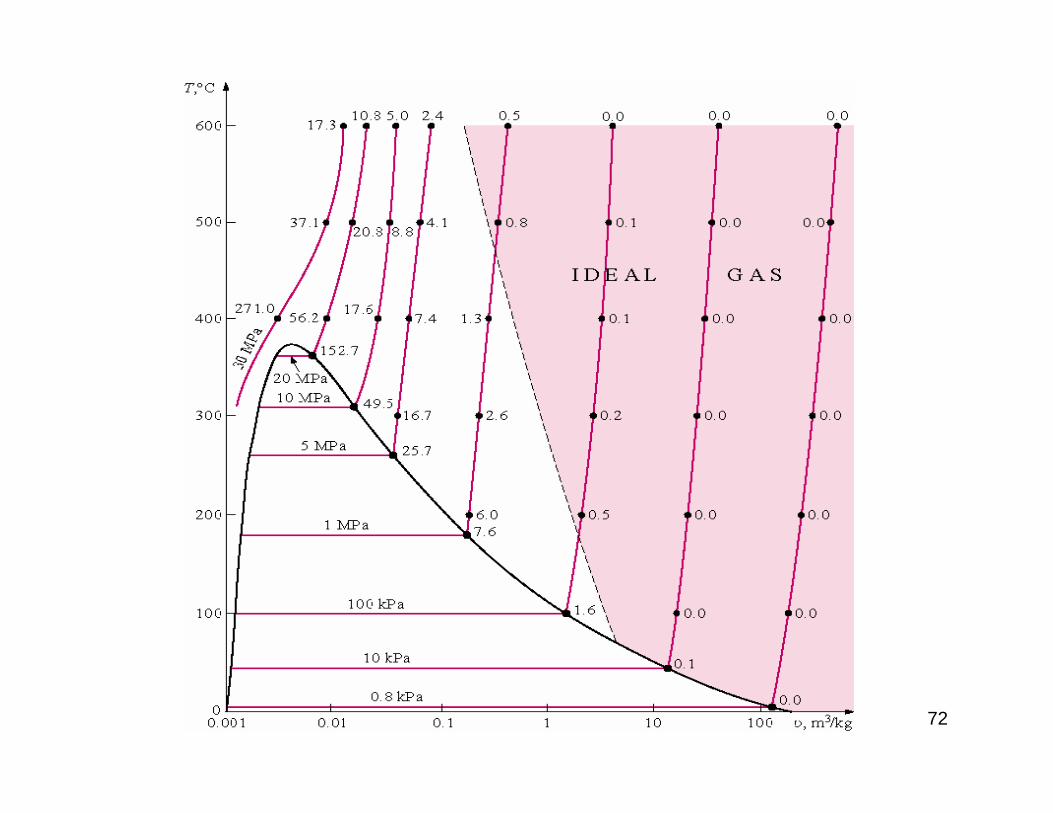
If the system pressure is low enough and the temperature high enough (P and T are compared to the critical values), gases will behave as ideal gases. Consider the T-v diagram for water. The figure in the next slide shows the percentage of error for the volume
100|vtable – videal|/vtable
for assuming water (superheated steam) to be an ideal gas.
From this, we see that the region for which water behaves as an ideal gas is in the superheated region and depends on both Tand P. We must be cautioned that in this course, when water is the working fluid, the ideal gas assumption may not be used to solve problems. We must use the real gas relations, i.e., the property tables.
72
73
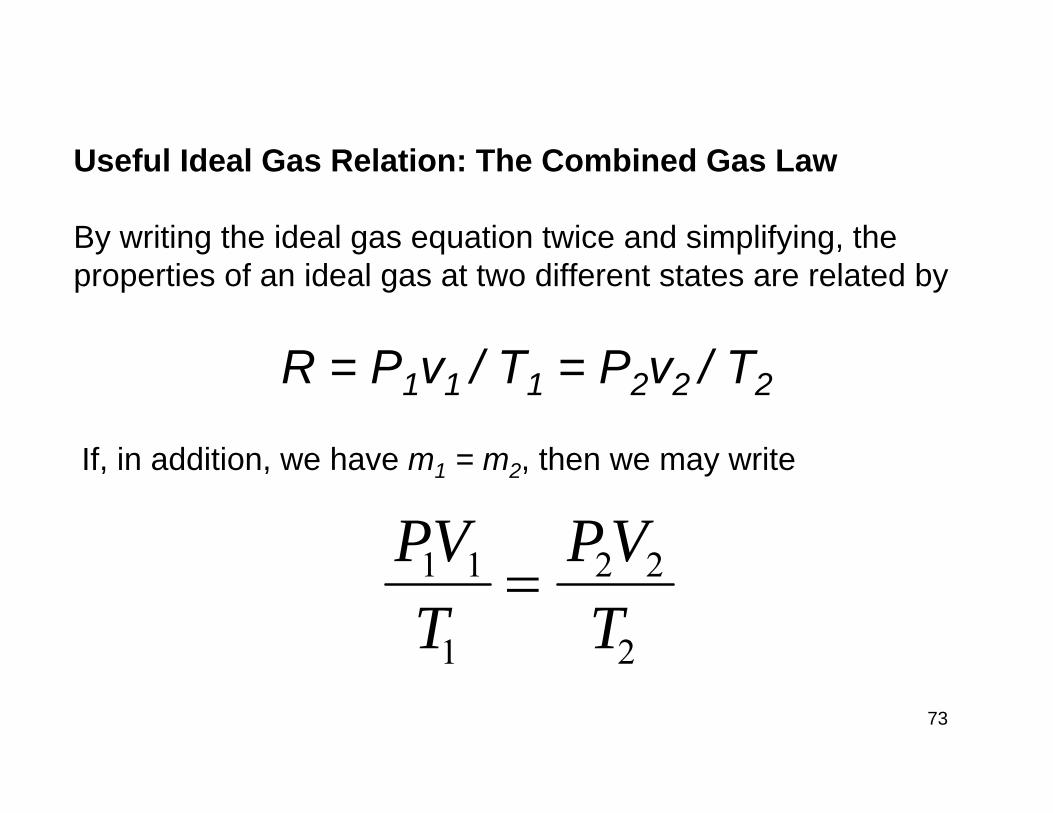
Useful Ideal Gas Relation: The Combined Gas Law
By writing the ideal gas equation twice and simplifying, the properties of an ideal gas at two different states are related by
R = P1v1 / T1 = P2v2 / T2
If, in addition, we have m1 = m2, then we may write
PVT
PVT
1 1
1
2 2
2
=

74
Example ProblemAn ideal gas having an initial temperature of 25°C undergoes the two processes described below. Determine the final temperature of the gas. Process 1-2: The volume is held constant while the pressure
doubles.Process 2-3: The pressure is held constant while the volume
is reduced to one-third of the original volume.
Ideal Gas
3T2
1T1
V
T3
P
2

75
Process 1-3:
m m1 3= so thatPVT
PVT
1 1
1
3 3
3
=
but V3 = V1/3 and P3 = P2 = 2P1
Therefore,
3 33 1
1 1
1 13 1 1
1 1
3
2 / 3 23
2 (25 273) 198.7 74.33
P VT TP VP VT T TP V
T K K C
=
= =
= + = = − °
Example Problem (Continued)
76
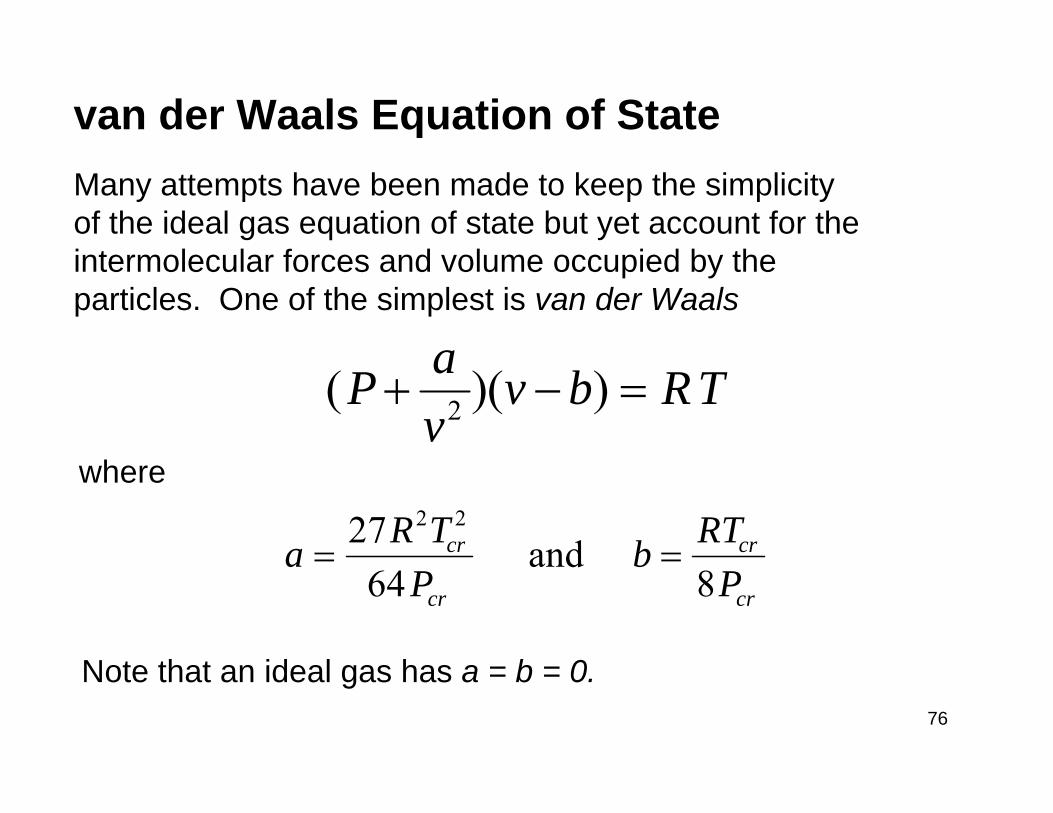
( )( )P av
v b RT+ − =2
where
a R TP
b RTP
cr
cr
cr
cr
= =2764 8
2 2
and
Note that an ideal gas has a = b = 0.
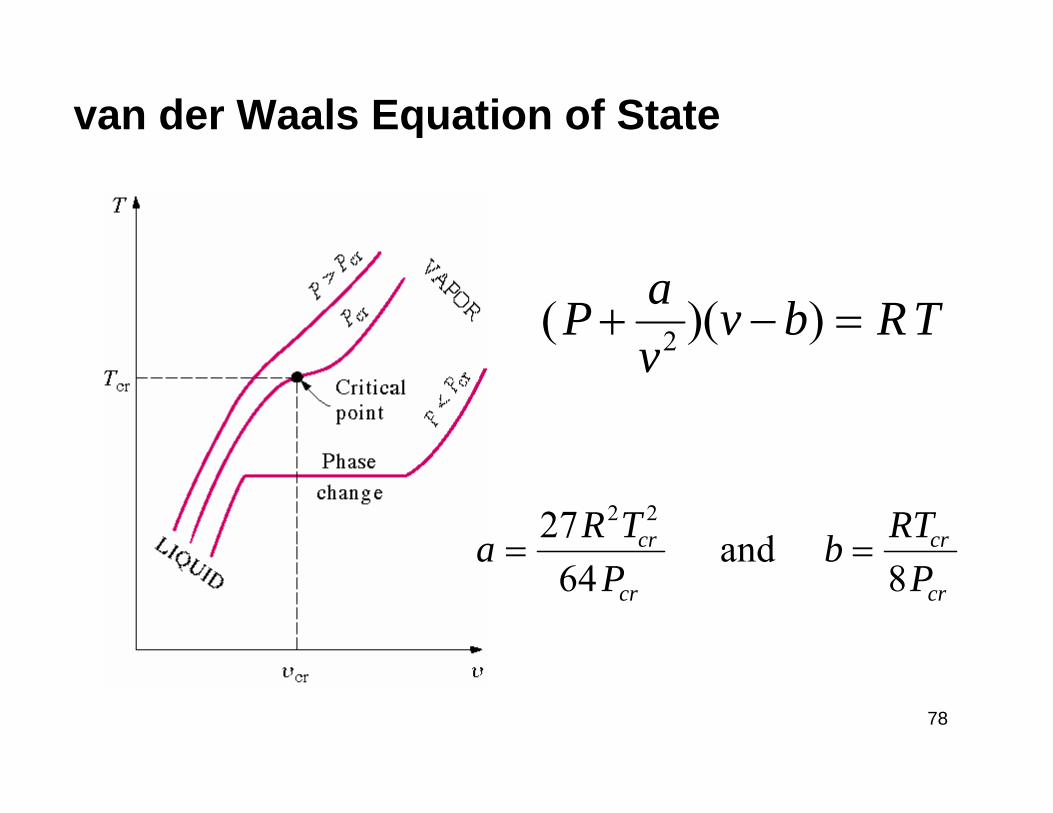
Many attempts have been made to keep the simplicity of the ideal gas equation of state but yet account for the intermolecular forces and volume occupied by the particles. One of the simplest is van der Waals
van der Waals Equation of State

77
Extra Assignment
When plotted on the P-v diagram, the critical isotherm has a point of inflection at the critical point. Use this information to verify the equations for van der Waals’ constants a and b. See the next slide.
The text discusses other equations of state which are not covered in this course.
78
( )( )P av
v b RT+ − =2
a R TP
b RTP
cr
cr
cr
cr
= =2764 8
2 2
and
van der Waals Equation of State