Level II Answer Book - PKL SoftwareLevel II Answer Book - PKL Software ... June 16
Upload
vuongkhuongCategory
view
236download
0
Final Report The Study on Arterial Road Network Development Plan for Sulawesi Island and Feasibility Study on Priority Arterial Road Development for South Sulawesi Province March 2008
3-1
CHAPTER 3 PRESENT TRANSPORT SITUATION OF SULAWESI
3.1 Existing Transport Development Studies and Projects
3.1.1 Studies
(1) National Transport Development Strategies
The national strategy for the transport sector is to support the development goals stipulated in the National Long-Term Development Plan 2005-2025 (BAPPENAS 2007) and National Mid-Term Development Plan 2005-2009 (BAPPENAS 2004). Their focuses are on: (1) accessibility, (2) environmental friendliness, (3) sustainability, (4) multi-modality, (5) consistency with regional development, (6) maintenance, and (7) cooperation among related parties. Other important studies are:
A. Heavy Loaded Road Improvement Project-II; Master Plan Review Study for National Network of Roads, Ministry of Settlement and Regional Infrastructure, JBIC, 2001
B. Land Transportation Master Plan (Masterplan Transportasi Darat), Ministry of Communications, 2005
1) Heavy Loaded Road Improvement Project-II; Master Plan Review Study for National Network of Roads
This is an update of the preceding study entitled “The Heavy Loaded Road Improvement Project (HLRIP)” which was undertaken in 1992 by Bina Marga and financed by JBIC. This study aimed to strengthen the national and provincial roads to accommodate increasing heavy traffic, provide more reliable services to road users, and promote socio-economic development. Its target year was set at 2020.
The HLRIP-MP selected its master plan network according to the following criteria:
Strategic access to main ports, existing container routes and Asian highways. Routes connecting PKN-PKN and PKN-PKW. Routes connecting PKW-PKW and PKW-PKL. Arterial and collector roads of MST-10 ton standard (maximum axle load). Arterial and collector roads of MST-8 ton standard that directly support the development
of special development areas (kawasan andalan). Arterial and collector roads with an estimated heavy traffic volume of 3,000 PCUs per
day by 2020. Road sections to ensure the continuity of heavy-loaded roads selected above.
The proposed road network is shown in Figure 3.1.1. This is a subset of the road network proposed in the Sulawesi Spatial Plan.

Final Report The Study on Arterial Road Network Development Plan for Sulawesi Island and Feasibility Study on Priority Arterial Road Development for South Sulawesi Province March 2008
3-2
Figure 3.1.1 Road Network Master Plan Proposed in HLRIP-Master Plan
2) Land Transportation Master Plan (Masterplan Transportasi Darat)
This study was commissioned in 2005 by the Directorate General of Land Transportation, Ministry of Transportation (Directorat Genderal Perhubungan Darat, Departemen Perhubungan). It focused on the interrelationship between road transport and other modes particularly ferry and coastal shipping. Based on various analyses and reviews of past studies and existing plans, this study proposed a road development program and budget allocations needed to implement the plan up to the year 2020. This, however, remains to be a rather macroscopic and policy-oriented study.
(2) Regional Transport Development Strategies

Final Report The Study on Arterial Road Network Development Plan for Sulawesi Island and Feasibility Study on Priority Arterial Road Development for South Sulawesi Province March 2008
3-3
There are several existing studies regarding the transport system of Sulawesi. The following three studies were reviewed:
1) Sulawesi Island Integrated Transportation Development Study (Studi Pemgembangan Keterpaduan Transportasi di Pulau Sulawesi)
This is a recently completed study on multimodal transport commissioned by the Research and Development Agency of the Ministry of Communication. The final report was submitted in November 2006. Its target year is 2022.
This study emphasized the role of ferry and air transportation. Several new ferry/shipping routes (Bitung-Mindanao, Kendari-Ambon, etc.) and new airports (Mamasa, Palopo, Pasangkay, etc.) were proposed, although road planning focused on the improvement and the strengthening of existing roads. Development programs were shown separately for the periods 2007-2012, 2013-2017, and 2018-2022.
2) Planning Study of Arterial Road Network in Sulawesi Island (Studi Rencana Umum Jaringan Transportasi Jalan Primer Pulau Sulawesi)
This study, financed by the Ministry of Communication (MOC), was completed in 2003 by a consultant group of the Bandung Institute of Technology. Its target year is 2023. The study aimed to strengthen coordination in planning and implementation of road projects among concerned agencies which were facing difficulties after the decentralization.
The study constructed a road database, estimated future traffic volume, and evaluated the needs of road improvement section by section. Judging from the final report, the emphasis seemed to be placed on the development of an applicable transport model that can be used by various parties. Based on the developed methodology and a set of evaluation criteria, the study listed all road sections together with the level of needed improvement in terms of number of lanes.
3) Sulawesi Island Road Network System Development Study (Studi Pengembangan Sistem Jaringan Jalan di Pulau Sulawesi)
This study, commissioned by the Ministry of Settlement and Regional Infrastructure, was completed in 2001. Its target year was set in 2020. This study covered a wide range of related aspects such as regional development policies and existing spatial plans in addition to road network planning. A limited road inventory survey was also carried out.
The methodology used in this study is similar to that of the MOC study mentioned earlier. The study proposed a detailed road improvement plan for 5-year periods between 2001 and 2020. The construction of 3 minor roads with a total length of 130km was also proposed.
4) Sulawesi Island Freeway and Toll Road Development Program Compilation (Pekerjaan Penyusunan Program Pengembangan Jaringan Jalan Bebas Hambatan dan Jalan Tol di Pulau Sulawesi)

Final Report The Study on Arterial Road Network Development Plan for Sulawesi Island and Feasibility Study on Priority Arterial Road Development for South Sulawesi Province March 2008
3-4
This report was submitted in December 2006 by an independent unit of Bina Marga. The study covers four (4) provinces of Sulawesi; South Sulawesi, Central Sulawesi, Gorontalo and North Sulawesi. It aimed to propose a development program of freeways and toll roads using the PPP scheme based mainly on technical and economic assessment of selected road sections.
The analyses were conducted for 35 candidate road sections of major transport corridors. The analysis revealed that only five (5) sections were economically feasible if the road would be open for service in 2010. They are:
* Manado – Tomohon
* Maros – Mandai – Makassar
* Makassar – Sungguminasa
* Sungguminasa – Takalar
* Limboto – Gorontalo
For these priority sections, a rough financial framework was prepared. Note that the Manado – Bitung section was excluded from the analysis as it was ongoing already.
5) Road Network Study in Central and Southeast Sulawesi
This study was conducted to prepare a master plan targeted 2018 for the road network system consisting of primary, arterial, and collector roads in the provinces of Central Sulawesi and Southeast Sulawesi. The study was financed by JICA, and was completed in 1998. The following two road routes were subjected to feasibility study of tunnel construction.
For the road section from Tawaeli to Toboli, a 620m long tunnel was planned. The Study Team reviewed and concluded that:
・ The tunnel route will shorten more than 3km from the existing route and it can save 3-5 minutes of the traveling time of the vehicles. The existing route has many small sharp curves but the gradient of the route is relatively gentle. It is not much critical situation because of the low traffic volume on the route. Therefore, the tunnel construction is not urgently required though many unstable slopes and collapse are seen along the existing route.
・ However, as this road connects the east and west coasts of the Central Sulawesi, tunnel will be required if the traffic volume of heavy vehicle is increased in the future.
There are 4 planned tunnels which are located between the station of 62 km +380 and 65km +740 on Trans-Sulawesi East Corridor. The Study Team reviewed and concluded that:
・ As the traffic volume on this route is very small, tunnel construction would not be cost effective. However, the road alignment is situated along the coastline which tends to generate disaster such as slope failures and scouring of shore. In order to make disaster free road, the

Final Report The Study on Arterial Road Network Development Plan for Sulawesi Island and Feasibility Study on Priority Arterial Road Development for South Sulawesi Province March 2008
3-5
construction of the road tunnel will be one of the options in future.
There are many candidate routes appropriate for the road tunnel construction because the mountainous terrains dominate in Sulawesi and generate difficult and critical condition for the traffic. The Study Team has conducted road survey and identified many routes for which tunnel construction will be necessary for application of the new road standard (PP34/2006) and the heavy loaded road. However, most of them are premature because of low traffic volume. Among those, the most advantageous tunnel would be for the Maros-Watampone road in South Sulawesi Province to meet future traffic volume, ADT of heavy vehicles and road function (Arterial and Heavy Loaded Road). Refer to Appendix 8 in this report as to details.
However, the demand of the tunnel construction will be raised in accordance with the growth of the traffic volume and economy. Besides, the tunnel construction would not be avoided for protection of environment and disaster. Therefore, as other South East Asian countries did or are doing, it is recommended to introduce the tunneling technology and plan the route with tunnels as a long term vision.
3.1.2 Projects
In Sulawesi, a number of proposed and ongoing road projects are mostly improvements of existing roads.
(1) Road Improvement
At present, road improvement works, including rehabilitation and maintenance, are vigorously pursued in Sulawesi with the assistance of international donors such as the World Bank, Asian Development Bank, and AusAID. Figure 3.1.3 illustrates these recently completed or ongoing road improvement projects. Three ongoing projects are as follows:
A. Eastern Indonesia Region Transport Project (EIRTP I and II) – World Bank
B. Road Rehabilitation Sector Project (RRSP) – Asian Development Bank
C. Eastern Indonesia National Road Improvement Project (EINRIP) – AusAID
Since 2007, however, the ADB project has shifted its focus to Sumatera and Kalimantan. The major task of road improvement in Sulawesi is shouldered mainly by WB and AusAID at present.
EIRTP and EINRIP have improved a number of national road sections in Sulawesi, and the national road network is relatively well maintained.

Final Report The Study on Arterial Road Network Development Plan for Sulawesi Island and Feasibility Study on Priority Arterial Road Development for South Sulawesi Province March 2008
3-6
Figure 3.1.2 Current Donor Assistance for Road Network Improvement in Sulawesi

Final Report The Study on Arterial Road Network Development Plan for Sulawesi Island and Feasibility Study on Priority Arterial Road Development for South Sulawesi Province March 2008
3-7
(2) Road Construction
Proposals for the construction of new roads in Sulawesi are few. This is due to the fact that its coastlines and flat areas are already linked by existing roads, that is if the levels of service are not considered. Of course, there are a small number of new routes proposed by different agencies and local governments as seen in the Sulawesi Island Road Network System Development Study (Studi Pengembangan Sistem Jaringan Jalan di Pulau Sulawesi). Of these, the Manado-Bitung Toll Road Project requires a careful review. This is a new road construction project for which the feasibility study was conducted by the Ministry of Public Works (Penyusunan Feasibility Study & Amdal Pembangunan Jalan Tol Ruas Manado-Bitung, 2006). It is a full access-controlled highway costing about Rp.2 trillion. Peak hour traffic volume by 2010 was estimated at about 1,500 PCUs near Manado. The diversion rate from the existing highway was calculated at about 50% when the toll rate was set at Rp.400/km. The EIRR was reported at 16%. Financial analysis was not conducted.
3.2 Road Transport Network
3.2.1 Road Planning Framework
(1) Functional Classification of Roads
The cities in Indonesia are classified into national activity center (PKN), regional activity center (PKW), local activity center (PKL), and other smaller cities according to the spatial plans (Rencana Tata Ruang Wilayah Nasional).
In January 2006, the Ministry of Public Works, Bina Marga and Bina Program prepared a draft guideline on the functional classification of roads (Klasifikasi Jaringan Jalan Menurut Fungsi/Peranan dan Status [Wewenang Pengaturan]), as shown in tables 3.2.1 and 3.2.2, as well as in Figure 3.2.1.
Road Hierarchy vs. Hierarchy of Activity Centers
Table 3.2.1 summarizes the interrelation between road hierarchy and various activity centers. Between national activity centers or between a national activity center and a regional activity center, the connecting road shall be an arterial, and as the connection level lowers the road becomes collector, local, then district.
Functional Classification vs. Administrative Classification
Table 3.2.2 presents the interrelationship between the functional and the administrative classifications of roads. Collector roads range from national, provincial to district (kabupaten) roads according to their subfunctional classification of K-1 to K-4.

Final Report The Study on Arterial Road Network Development Plan for Sulawesi Island and Feasibility Study on Priority Arterial Road Development for South Sulawesi Province March 2008
3-8
Example of Primary Road Network
Figure 3.2.1 illustrates schematically the interrelationship of the primary road network system with the hierarchy of activity centers.
Table 3.2.1 Hierarchy of Roads and Activity Centers
Activity Center National ActivityCenter (PKN)
Regional ActivityCenter (PKW)
Local ActivityCenter (PKL)
District Center(PK-Ling)
Sub-DistrictActivity Center
(Persil)National ActivityCenter (PKN) Arterial Arterial Collector Local District/Rural
Regional ActivityCenter (PKW) Arterial Collector Collector Local District/Rural
Local Activity Center(PKL) Collector Collector Local Local District/Rural
District Center(PK-Ling) Local Local Local Local District/Rural
Subdistrict ActivityCenter (Persil) District/Rural District/Rural District/Rural District/Rural District/Rural
Note: PKN and PKW are designated in RTRWN Source: Klasifikasi Jaringan Jalan Menurut Fungsi (Peranan) dan Status (Wewenang Pengaturan), 2006, Ministry of Public Works-Bina Marga- Bina Program
Table 3.2.2 Functional Classification of Roads
Arterial Toll RoadsCollector 1 National RoadsCollector 2Collector 3Collector 4LocalArterialCollectorLocal
Source: DGH
SecondaryRoad NetworkSystem
Minister ofPublic Works
Provincial Roads
Function / Role Status(Road Management Authority)
Urban Roads Mayor
Primary RoadNetworkSystem
Governor
District Roads &Rural Roads
Chief of Regencyand District
Decree by Ministerof Public Works
Decree byGovernor

Final Report The Study on Arterial Road Network Development Plan for Sulawesi Island and Feasibility Study on Priority Arterial Road Development for South Sulawesi Province March 2008
3-9
Primary collector road (JKP)
Local Activity Center (PKL)
Primary local road (JLP)
Primary sub district road (JLingP)
Primary local road
(JLP)
Primary local road
(JLP)
Primary collector road (JLP)
Primary local road (JLP)
Primary collector road (JKP)
Primary collector road (JKP)
Primary arterial road (JAP)
Primary arterial road (JAP)
Primary arterial road (JAP)
Regional Activity Center (PKW)
Regional Activity
Center (PKW)
National activity
center(PKN)
Sub District Center (Persil)
District Center (PK
Lingkungan)
Local Activity Center (PKL)
National Activity Center
(PKN)
Primary collector road (JKP)
District center (PK
Lingkungan)
Sub district center (Persil)
Primary sub district road (JLP)
Primary local road
Notes: National Activity Center (PKN)
Regional Activity Center (PKW) Local Activity Center (PKL) Primary Arterial (AP) Primary Collector (KP) Primary Local (LP) District Activity Center (PK Ling) Subdistrict Center (Persil)
Source: Law No. 38 of 2004 & Governmental Regulation Figure 3.2.1 Diagram of the Primary Road Network System
(2) Design Standard
Geometric Design
The Indonesian geometric design standards for highways are established and the standards have been enhanced based on practical examination in Indonesia. Highway classification consisting of highway function, type and class are defined related closely to characteristics of connectivity, traffic condition and land use in Indonesia and selection of the highway classification shall be carefully examined to meet roll of the highways. Following Indonesian geometric standards as well as manual for highway capacity has been applied to planning and design of Indonesian

Final Report The Study on Arterial Road Network Development Plan for Sulawesi Island and Feasibility Study on Priority Arterial Road Development for South Sulawesi Province March 2008
3-10
highways;
i) Standard Specifications for Geometric Design of Urban Roads, MPW, Indonesia, 1992
ii) Tata Cara Perencanaan Geometrik Jalan Antar Kota, Direktorat Jenderal Bina Marga, 1997
iii) Indonesian Highway Capacity Manual, MPW, Indonesia, 1993
The standards are established for inter and intra urban highways and “Standard Specifications for Geometric Design of Urban Roads” provides geometric standard to urban highways in accordance with highway classification as shown in Table 3.2.3.
Table 3.2.3 Geometric Design Standards (Inter Urban Road Section) Type-I Type-II Road Classification
Class-I Class-II Class-I Class-II Class-III Design Speed (km/h) 100 or 80 100 or 60 60 60 or 50 40 or 30
Carriageway Width
3.5m 3.5m 3.5m 3.25m 3.25m, 3.0m
Median 2.5m 2.0m 2.0m (1.0m)
1.5m (1.0m)
1.5m (1.0m)
Shoulder Width (Right)
1.0m 0.75m 0.5m 0.5m 0.5m
Shoulder Width (Left without Side Walk)
2.0m (1.75m)
2.0m (1.75m)
2.0m (1.5m)
2.0m (1.5m)
2.0m (0.5m)
Cross-section
Sidewalk Width - - 3.0m (1.5m)
3.0m (1.5m)
1.5m (1.0m)
Min. Radius 230m 120m 150m 100m 30m Min. Curve Length a; intersection angle (degree)
1,000/a (140m)
700/a (100m)
700/a (100m)
600/a (80m)
350/a (50m)
Horizontal Alignment
Omission of Transition
>1,000m >600m >600m >400m >150m
Max. Grade 4.0% 5.0% 5.0% 6.0% 8.0% Min. Vertical Curve (crest)
3,000m 1,400m 1,400m 800m 250m Vertical Alignment
Min. Vertical Curve (sag)
2,000m 1,000m 1,000m 700m 250m
Note: ( ); Exceptional case

Final Report The Study on Arterial Road Network Development Plan for Sulawesi Island and Feasibility Study on Priority Arterial Road Development for South Sulawesi Province March 2008
3-11
“Tata Cara Perencanaan Geometrik Jalan Antar Kota” is established to provide geometric standard to inter urban highways. Geometric design standards for inter urban highways are shown in Table 3.2.4 to Table 3.2.5.
Table 3.2.4 Geometric Design Standards (Inter Urban Road Section) 1/2 Arterial Collector Road Classification
Class-I Class-II Class-IIIA Class-IIIA Class-IIIB Max. Axle Load >10t 10t 8t 8t <8t
Flat 70-120 60-90
Rolling 60-80 50-60
Design Speed (km/h)
Mountainous 40-70 30-50
Table 3.2.5 Standard Minimum Width (Inter Urban Road Section) 2/2 Arterial Collector
Standard Exceptional Standard Exceptional
ADT Lane
Width(m) Shoulder Width(m)
Lane Width(m)
Shoulder Width(m)
Lane Width(m)
Shoulder Width(m)
Lane Width(m)
Shoulder Width(m)
<3,000 6.0 1.5 4.5 1.0 6.0 1.5 4.5 1.0 3,000 – 10,000
7.0 2.0 6.0 1.5 7.0 1.5 6.0 1.5
10,001 – 25,000
7.0 2.0 7.0 2.0 7.0 2.0 - -
>25,000 2n×3.5 2.5 2×7.0 2.0 2n×3.5 2.0 - -
In 2006, government regulations concerning of roads, PP No. 34 Year 2006 under Act No. 38 Year 2004, was issued by Department of Public Works, Directorate General of Highways and standard minimum width of lane and shoulder of inter urban highway was revised to wider. Directorate General of Highways issued decree No. 42/KPTS/Db/2007 corresponding to the PP No. 34 Year 2006 as shown in Table 3.2.6.
Table 3.2.6 Standard Minimum Width in 42/KPTS/Db/2007 Standard Minimum Width (m)
42/KPTS/Db/2007 Standard Transition Period Classification
Left Shoulder
Lane Right Shoulder
Left Shoulder
Lane Right Shoulder
Remarks
2.5 6.0 2.5 ARTERIAL 2.0 7.0 2.0 2.0 6.0 2.0
2.0 5.0 2.0 COLLECTOR 1.5 6.0 1.5 2.5 4.5 2.5
1.5 4.5 1.5 LOCAL 1.0 5.5 1.0 2.0 3.5 2.0
Ongoing projects as well as designing projects may be applied standard width shown in “Transition Period” column in consideration of traffic volume and Tata Cara Perencanaan Geometrik Jalan Antar Kota.
In comparison with “Tata Cara Perencanaan Geometrik Jalan Antar Kota”, the standard minimum lane width of the arterial and the collector highways are revised from 4.5m to 6.0m, 7.0m. The M/P basically comply with existing geometric design standards for inter and intra urban highways as well as the decree No. 42/KPTS/Db/2007. However, the study team proposes application of

Final Report The Study on Arterial Road Network Development Plan for Sulawesi Island and Feasibility Study on Priority Arterial Road Development for South Sulawesi Province March 2008
3-12
exceptional minimum lane width of 4.5m for a part of provincial collector road because of most of the provincial collector roads are given poor road geometry and huge investment amount in case complying with the decree No. 42/KPTS/Db/2007. Detailed examination results of the exceptional minimum lane application are stated in Appendix 7.
The proposed typical cross sections are shown in Figure 3.2.2 through 3.2.4.
Figure 3.2.2 Typical Cross Sections for Intra Urban Roads
3.50 3.50 2.005.50
2.005.50
11.00
Figure 3.2.3 Typical Cross-sections for Inter-Urban Roads (1)
3.00 3.00 1.501.50
9.004.50 4.50
1.002.75 2.751.00
7.503.75 3.75
Figure 3.2.4 Typical Cross-sections for Inter-Urban Roads (2)
3.003.0024.00
8.00 2.00 8.00
3.00 3.50 3.50 3.50 3.50 3.000.50 0.50 0.50 0.50
Sidewal Sidewal
ExistingP t
Median
AC Overlay AC Overlay

Final Report The Study on Arterial Road Network Development Plan for Sulawesi Island and Feasibility Study on Priority Arterial Road Development for South Sulawesi Province March 2008
3-13
Pavement Design
Directorate General of Highways established the Road Design System developed based on the Road Note 31, TRL as follows.
- PtT-01-2002-B (For New Construction) - PdT-05-2005-B (For Overlay)
Pavement design of the M/P follows the Road Design System. The summary of pavement design standards is as follows: Item Design Criteria Design Life 10 years Design Reference AASHTO Guide for Design of Pavement Structures
Manual Pemeriksaan Perkerasan Jalan dengan Alat Benkelman, No. 01/MN/B/1983, Bina Marga (overlay)
Asphalt Concrete Pavement Wearing Course Asphalt Concrete Wearing Course (ACW) Binder Course Asphalt Concrete Binder Course (ACB) Maximum Axle Load MST 10 ton (Class I, II), MST 8 ton (Class III A, III B) Design Serviceability Loss ∆ PSI = 4.2- 2.5 = 1.7 Reliability Factor (R) R= 0.90 Standard Deviation (So) So = 0.35 Vehicle Damage Factor WIM data Design CBR 6.0% (If applied, the subgrade strengthens at less than 6%)
Bridge Design
Following bridge design standards are referred to for examination of bridge type selection in the M/P.
- BMS Bridge Design Code, 1992 - BMS Bridge Design Manual, 1992

Final Report The Study on Arterial Road Network Development Plan for Sulawesi Island and Feasibility Study on Priority Arterial Road Development for South Sulawesi Province March 2008
3-14
3.2.2 Existing Road Network System
(1) General
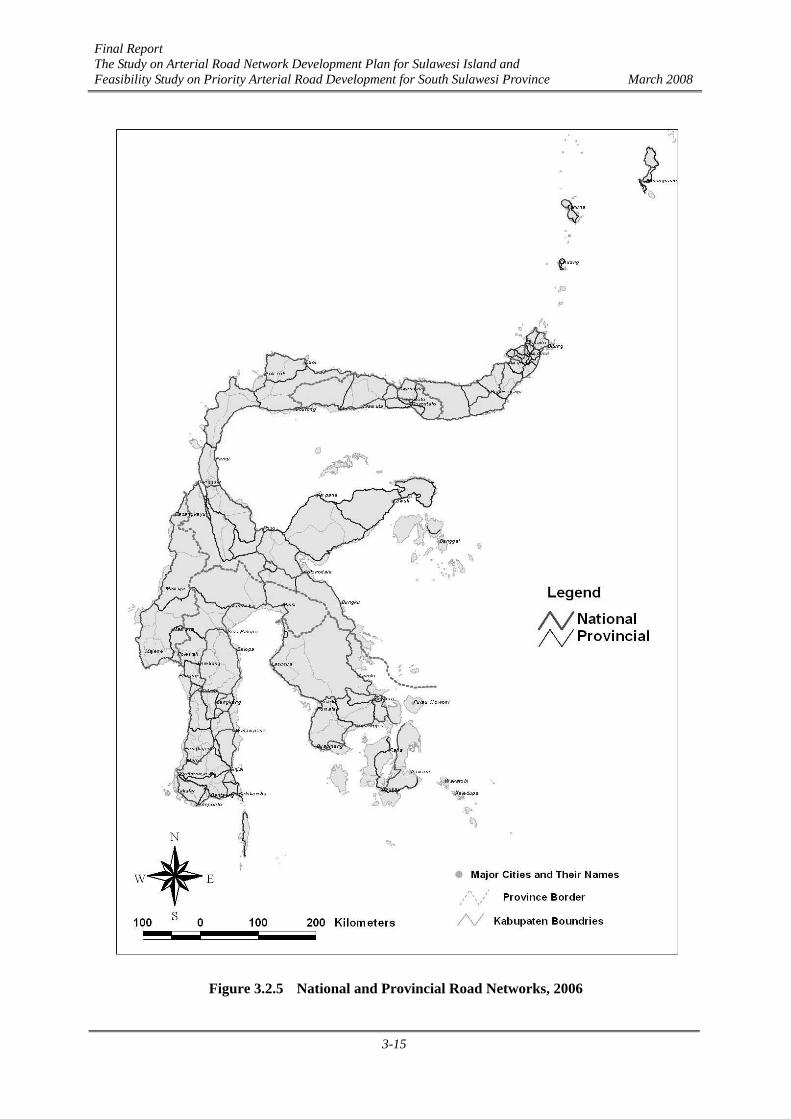
Sulawesi’s road network is composed of national, provincial, regency roads and other roads. Figure 3.2.5 shows the national and provincial roads, and Table 3.2.7 summarizes their lengths by province. From the standpoint of road function, these roads are differently classified into arterial, collector, local and district roads as presented earlier in Table 3.2.1. National roads cover most of the coastlines except in the eastern peninsula. Until 2004, however, the following routes were classified as provincial roads:
A. Northwestern coastal route connecting Mamuju and Kwandang (Gorontalo) via Palu.
B. Southern route in the northern peninsula connecting Gorontalo and Bitung.
C. Coastline route in the southeastern peninsula connecting Kolaka (Southeast Sulawesi) and Taripa (Central Sulawesi) via Tinnanggea (Southeast Sulawesi), Kendari, and Kolonadale.
D. Coastline route in the southern peninsula connecting Makassar and Tarunpakae (South Sulawesi) via Takalar and Bulukumba.
E. East-west link in Sulawesi Selatan connecting Bangkae and Palopo.
F. North-south link in Buton Island (Southeast Sulawesi).
Table 3.2.7 Lengths of National and Provincial Roads by Province, 2005
Unit: kmProvince Total
Arterial Collector 1 Collector 2 Collector 3North Sulawesi 393 874 734 6 2,008
19.6% 43.5% 36.6% 0.3% 100.0%Gorontalo 312 305 284 0 901
34.6% 33.8% 31.6% 0.0% 100.0%Central Sulawesi 684 1,122 1,933 44 3,783
18.1% 29.7% 51.1% 1.2% 100.0%South/West Sulawesi 1,171 937 1,464 22 3,594
32.6% 26.1% 40.7% 0.6% 100.0%Southeast Sulawesi 434 860 489 0 1,783
24.4% 48.2% 27.4% 0.0% 100.0%Total 2,994 4,097 4,904 72 12,068
24.8% 34.0% 40.6% 0.6% 100.0%7,092 4,976 12,068
58.8% 41.2%Source: Keputusan Menteri Permukinan Dan Prasarana Wilayah 2005, Number: 375/KPTS/M/2004
National Road Provincial RoadClassification
Final Report The Study on Arterial Road Network Development Plan for Sulawesi Island and Feasibility Study on Priority Arterial Road Development for South Sulawesi Province March 2008
3-15
Figure 3.2.5 National and Provincial Road Networks, 2006
Final Report The Study on Arterial Road Network Development Plan for Sulawesi Island and Feasibility Study on Priority Arterial Road Development for South Sulawesi Province March 2008
3-16
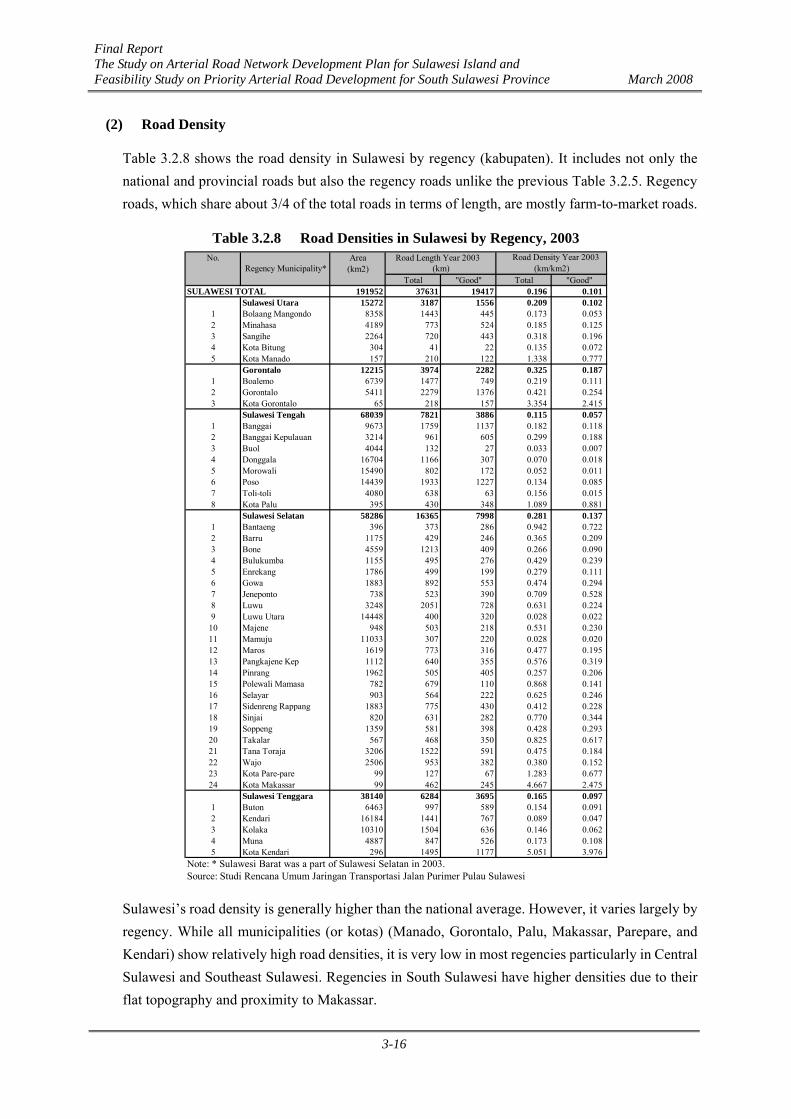
(2) Road Density
Table 3.2.8 shows the road density in Sulawesi by regency (kabupaten). It includes not only the national and provincial roads but also the regency roads unlike the previous Table 3.2.5. Regency roads, which share about 3/4 of the total roads in terms of length, are mostly farm-to-market roads.
Table 3.2.8 Road Densities in Sulawesi by Regency, 2003 No. Area Road Length Year 2003
(km2)Total "Good" Total "Good"
SULAWESI TOTAL 191952 37631 19417 0.196 0.101Sulawesi Utara 15272 3187 1556 0.209 0.102
1 Bolaang Mangondo 8358 1443 445 0.173 0.0532 Minahasa 4189 773 524 0.185 0.1253 Sangihe 2264 720 443 0.318 0.1964 Kota Bitung 304 41 22 0.135 0.0725 Kota Manado 157 210 122 1.338 0.777
Gorontalo 12215 3974 2282 0.325 0.1871 Boalemo 6739 1477 749 0.219 0.1112 Gorontalo 5411 2279 1376 0.421 0.2543 Kota Gorontalo 65 218 157 3.354 2.415
Sulawesi Tengah 68039 7821 3886 0.115 0.0571 Banggai 9673 1759 1137 0.182 0.1182 Banggai Kepulauan 3214 961 605 0.299 0.1883 Buol 4044 132 27 0.033 0.0074 Donggala 16704 1166 307 0.070 0.0185 Morowali 15490 802 172 0.052 0.0116 Poso 14439 1933 1227 0.134 0.0857 Toli-toli 4080 638 63 0.156 0.0158 Kota Palu 395 430 348 1.089 0.881
Sulawesi Selatan 58286 16365 7998 0.281 0.1371 Bantaeng 396 373 286 0.942 0.7222 Barru 1175 429 246 0.365 0.2093 Bone 4559 1213 409 0.266 0.0904 Bulukumba 1155 495 276 0.429 0.2395 Enrekang 1786 499 199 0.279 0.1116 Gowa 1883 892 553 0.474 0.2947 Jeneponto 738 523 390 0.709 0.5288 Luwu 3248 2051 728 0.631 0.2249 Luwu Utara 14448 400 320 0.028 0.022
10 Majene 948 503 218 0.531 0.23011 Mamuju 11033 307 220 0.028 0.02012 Maros 1619 773 316 0.477 0.19513 Pangkajene Kep 1112 640 355 0.576 0.31914 Pinrang 1962 505 405 0.257 0.20615 Polewali Mamasa 782 679 110 0.868 0.14116 Selayar 903 564 222 0.625 0.24617 Sidenreng Rappang 1883 775 430 0.412 0.22818 Sinjai 820 631 282 0.770 0.34419 Soppeng 1359 581 398 0.428 0.29320 Takalar 567 468 350 0.825 0.61721 Tana Toraja 3206 1522 591 0.475 0.18422 Wajo 2506 953 382 0.380 0.15223 Kota Pare-pare 99 127 67 1.283 0.67724 Kota Makassar 99 462 245 4.667 2.475
Sulawesi Tenggara 38140 6284 3695 0.165 0.0971 Buton 6463 997 589 0.154 0.0912 Kendari 16184 1441 767 0.089 0.0473 Kolaka 10310 1504 636 0.146 0.0624 Muna 4887 847 526 0.173 0.1085 Kota Kendari 296 1495 1177 5.051 3.976
Note: * Sulawesi Barat was a part of Sulawesi Selatan in 2003.Source: Studi Rencana Umum Jaringan Transportasi Jalan Purimer Pulau Sulawesi
Road Density Year 2003(km) (km/km2)Regency Municipality*
Sulawesi’s road density is generally higher than the national average. However, it varies largely by regency. While all municipalities (or kotas) (Manado, Gorontalo, Palu, Makassar, Parepare, and Kendari) show relatively high road densities, it is very low in most regencies particularly in Central Sulawesi and Southeast Sulawesi. Regencies in South Sulawesi have higher densities due to their flat topography and proximity to Makassar.

Final Report The Study on Arterial Road Network Development Plan for Sulawesi Island and Feasibility Study on Priority Arterial Road Development for South Sulawesi Province March 2008
3-17
3.2.3 Existing Road Conditions based on IRMS and other Data
(1) Road Widths
Most of the inter-city roads in Sulawesi have 2 lanes with road widths of less than 7 meters. Approximately 5,000 km (71%) of the national roads are less than 5.5 m wide as shown in Table 3.2.9. National roads that were formerly designated as provincial roads and changed to national roads in 2004 have narrow road widths.
Table 3.2.9 Road Width of National Roads
Unit: kmProvince
<5.5m 5.5m - 8.2m 14.0m >14.0m Total966 255 32 14 1,267
76.2% 20.1% 2.5% 1.1% 100.0%Gorontalo 546 60 9 1 616
88.6% 9.7% 1.5% 0.1% 100.0%1,683 81 40 3 1,806
93.2% 4.5% 2.2% 0.2% 100.0%344 192 15 0 551
62.4% 34.9% 2.7% 0.0% 100.0%526 927 34 70 1,557
33.8% 59.5% 2.2% 4.5% 100.0%944 325 18 7 1,294
73.0% 25.1% 1.4% 0.5% 100.0%Total 5,009 1,840 148 95 7,092
70.6% 25.9% 2.1% 1.3% 100.0%Source: Balai VI, MPW (Dec,2006)
SouthSulawesiSoutheastSulawesi
Carriageway Width (W)
NorthSulawesi
CentralSulawesiWestSulawesi
Table 3.2.10 shows estimated road width (carriageway width) for provincial roads. Approximately 76% is less than 4.5 m wide and 16% is 4.6 m–5.4 m wide.
Table 3.2.10 Road Width of Provincial Roads
Province Total=<4.5m 4.6m-5.4m 5.5m-6.9m 7.0m-9.9m >=10m
600 37 88 6 10 74181% 5% 12% 1% 1% 100%
Gorontalo 237 38 8 0 0 28483% 14% 3% 0% 0% 100%
1,673 259 20 14 9 1,97685% 13% 1% 1% 0% 100%831 416 232 7 0 1,486
56% 28% 16% 0% 0% 100%423 40 24 1 0 489
87% 8% 5% 0% 0% 100%Total 3,764 791 373 29 19 4,976
76% 16% 7% 1% 0% 100%Source: JICA Study Team estimated based on IRMS Data (Year 2005)
Carriageway Width (W)
South/WestSulawesi
CentralSulawesi
SoutheastSulawesi
NorthSulawesi
Figure 3.2.6 shows road width distribution. This figure was made based on the IRMS database provided by Bina Marga and information provided by Balai Besar VI. See Appendix 6 for details by province.

Final Report The Study on Arterial Road Network Development Plan for Sulawesi Island and Feasibility Study on Priority Arterial Road Development for South Sulawesi Province March 2008
3-18
Source: IRMS and Balai
Figure 3.2.6 Road Width Distribution, 2006
Final Report The Study on Arterial Road Network Development Plan for Sulawesi Island and Feasibility Study on Priority Arterial Road Development for South Sulawesi Province March 2008
3-19
(2) Surface Type
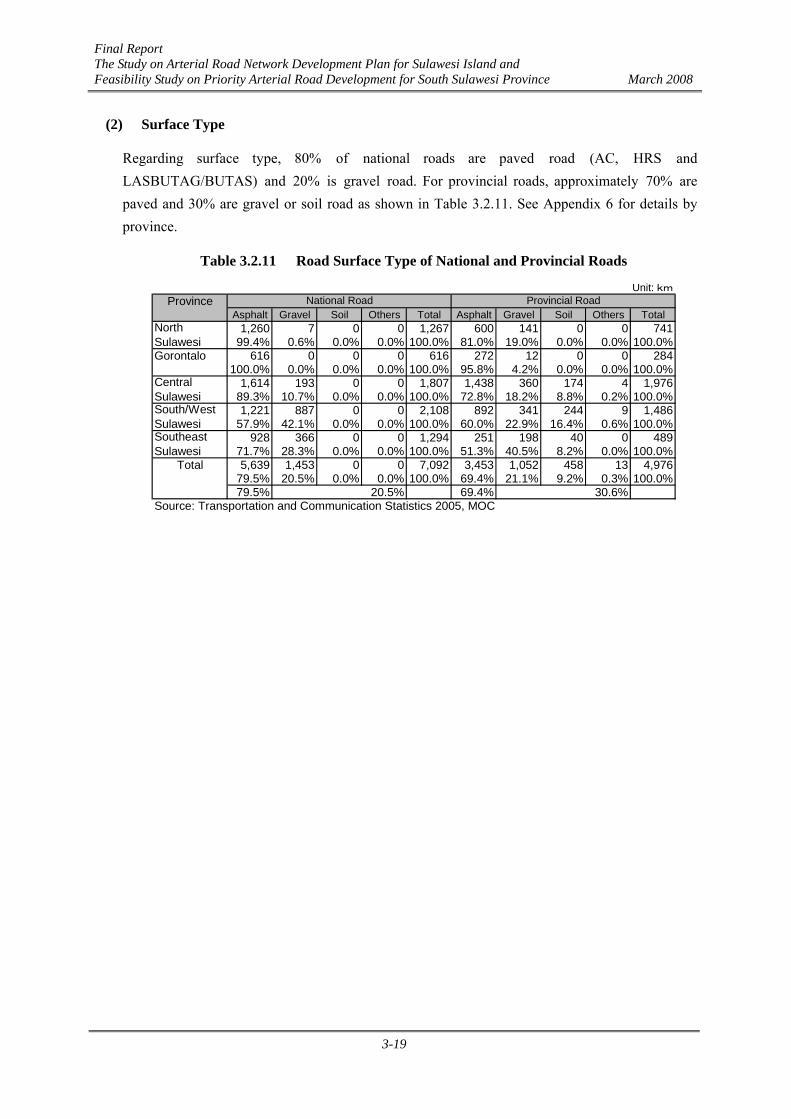
Regarding surface type, 80% of national roads are paved road (AC, HRS and LASBUTAG/BUTAS) and 20% is gravel road. For provincial roads, approximately 70% are paved and 30% are gravel or soil road as shown in Table 3.2.11. See Appendix 6 for details by province.
Table 3.2.11 Road Surface Type of National and Provincial Roads
Unit: km
ProvinceAsphalt Gravel Soil Others Total Asphalt Gravel Soil Others Total
1,260 7 0 0 1,267 600 141 0 0 74199.4% 0.6% 0.0% 0.0% 100.0% 81.0% 19.0% 0.0% 0.0% 100.0%
Gorontalo 616 0 0 0 616 272 12 0 0 284100.0% 0.0% 0.0% 0.0% 100.0% 95.8% 4.2% 0.0% 0.0% 100.0%
1,614 193 0 0 1,807 1,438 360 174 4 1,97689.3% 10.7% 0.0% 0.0% 100.0% 72.8% 18.2% 8.8% 0.2% 100.0%1,221 887 0 0 2,108 892 341 244 9 1,486
57.9% 42.1% 0.0% 0.0% 100.0% 60.0% 22.9% 16.4% 0.6% 100.0%928 366 0 0 1,294 251 198 40 0 489
71.7% 28.3% 0.0% 0.0% 100.0% 51.3% 40.5% 8.2% 0.0% 100.0%Total 5,639 1,453 0 0 7,092 3,453 1,052 458 13 4,976
79.5% 20.5% 0.0% 0.0% 100.0% 69.4% 21.1% 9.2% 0.3% 100.0%79.5% 20.5% 69.4% 30.6%
Source: Transportation and Communication Statistics 2005, MOC
National Road Provincial Road
NorthSulawesi
CentralSulawesiSouth/WestSulawesiSoutheastSulawesi

Final Report The Study on Arterial Road Network Development Plan for Sulawesi Island and Feasibility Study on Priority Arterial Road Development for South Sulawesi Province March 2008
3-20
Source: IRMS and Balai
Figure 3.2.7 Road Distribution by Surface Type, 2006
(3) Road Condition of National and Provincial Roads
National roads in Sulawesi are relatively well maintained as shown in Table 3.2.12. This is mainly due to the road improvement projects financed by various donor agencies mentioned earlier in Section 3.1.2 and the national budget (APBN). Those previously designated as provincial roads,

Final Report The Study on Arterial Road Network Development Plan for Sulawesi Island and Feasibility Study on Priority Arterial Road Development for South Sulawesi Province March 2008
3-21
however, still have poorly maintained sections. See Appendix 6 for details by province.
Table 3.2.12 Road Condition of National Roads
ProvinceGood Fair Poor Bad Total Good Fair Poor Bad Total
486 363 228 190 1,267 886 137 193 51 1,26738.4% 28.7% 18.0% 15.0% 100.0% 69.9% 10.8% 15.2% 4.1% 100.0%
Gorontalo 373 186 51 6 616 180 358 25 53 61660.6% 30.2% 8.3% 1.0% 100.0% 29.2% 58.1% 4.1% 8.6% 100.0%
850 630 150 177 1,807 687 589 351 181 1,80747.0% 34.9% 8.3% 9.8% 100.0% 38.0% 32.6% 19.4% 10.0% 100.0%
160 137 64 190 55229.1% 24.9% 11.6% 34.5% 100.0%
1,509 446 84 69 2,108 997 496 42 21 1,55671.6% 21.2% 4.0% 3.3% 100.0% 64.1% 31.9% 2.7% 1.3% 100.0%
482 499 98 215 1,294 380 514 276 124 1,29437.2% 38.6% 7.6% 16.6% 100.0% 29.3% 39.7% 21.4% 9.6% 100.0%
Total 3,700 2,124 611 657 7,092 3,290 2,230 951 620 7,09252.2% 29.9% 8.6% 9.3% 100.0% 46.4% 31.5% 13.4% 8.7% 100.0%
82.1% 17.9% 77.8% 22.2%Sources: * Transportation and Communication Statistics 2005, MOC ** Balai VI, MPW (Dec,2006)
SoutheastSulawesi
NorthSulawesi
CentralSulawesiWestSulawesiSouthSulawesi
Condition (2007)*Condition (2005)*Unit: km
Table 3.2.13 shows the road condition of provincial roads in 2005 and 2007. Approximately 60% are in good/fair condition and 40% are in poor/bad condition. The road condition of provincial roads is considerably poor compared with national roads.
Table 3.2.13 Road Condition of Provincial Roads
ProvinceGood Fair Poor Bad Total Good Fair Poor Bad Total km %
181 275 139 146 741 342 143 223 33 741 0 100%24.4% 37.1% 18.8% 19.7% 100.0% 46.2% 19.3% 30.1% 4.5% 100.0%
Gorontalo 79 46 24 135 284 72 48 91 104 315 31 111%27.8% 16.2% 8.5% 47.5% 100.0% 22.8% 15.2% 28.9% 33.2% 100.0%
896 458 380 242 1,976 243 1,044 302 448 2,037 61 103%45.3% 23.2% 19.2% 12.2% 100.0% 11.9% 51.3% 14.8% 22.0% 100.0%
150 126 100 205 58125.7% 21.8% 17.2% 35.3% 100.0%
300 338 175 673 1,486 238 545 238 189 1,209 304 120%20.2% 22.7% 11.8% 45.3% 100.0% 19.6% 45.0% 19.7% 15.6% 100.0%
80 228 75 106 489 136 386 262 159 943 454 193%16.4% 46.6% 15.3% 21.7% 100.0% 14.4% 40.9% 27.8% 16.9% 100.0%
Total 1,536 1,345 793 1,302 4,976 1,180 2,292 1,216 1,138 5,826 850 117%30.9% 27.0% 15.9% 26.2% 100.0% 20.3% 39.3% 20.9% 19.5% 100.0%
57.9% 42.1% 59.6% 40.4%Sources: * Transportation and Communication Statistics 2005, MOC ** Dinas PU Province (Sep,2007)
SoutheastSulawesi
NorthSulawesi
CentralSulawesiWestSulawesiSouthSulawesi
Condition (2007)**Condition (2005)* Length IncreaseUnit: km
The total length of provincial road as of September 2007 was increased by about 17% compared with that in 2005 since provincial government designated new links or upgraded some regency roads to be provincial roads.

Final Report The Study on Arterial Road Network Development Plan for Sulawesi Island and Feasibility Study on Priority Arterial Road Development for South Sulawesi Province March 2008
3-22
Source: IRMS, Balai and Directorat Jenderal Perhubungan Darat
Figure 3.2.8 Road Distribution by Maintenance Condition, 2006
(4) Road Condition of Regency (Kabupaten) Roads
In addition to national and provincial roads, there are also regency (kabupaten) roads used for daily life/activities performed in the regency. The total length of regency road network is 43,864km, and this accounts for about 3.7 times of the total of national and provincial roads.
Table 3.2.14 summarizes the surface type and condition of regency (kabupaten) roads by province
FLOOD PRONE AREA

Final Report The Study on Arterial Road Network Development Plan for Sulawesi Island and Feasibility Study on Priority Arterial Road Development for South Sulawesi Province March 2008
3-23
in Sulawesi. According to this data as of 2005, about 59% of roads are not paved by asphalt concrete and about 44% are in poor/bad condition. Since regency roads are essential for the life of local residents, it will become an important issue in the future to improve them.
It is noted that the pavement ratio is low with inferior road condition particularly in West Sulawesi.
Table 3.2.14 Road Surface Types and Conditions of Regency (Kabupaten) Roads, 2005 Unit: km
ProvinceAsphalt Gravel Soil Others Total Good Fair Poor Bad Total
North Sulawesi 2,334 1,040 116 0 3,490 1,108 1,216 899 267 3,49066.9% 29.8% 3.3% 0.0% 100.0% 31.7% 34.8% 25.8% 7.7% 100.0%
Gorontalo 1,514 340 470 126 2,450 1,114 140 448 748 2,45061.8% 13.9% 19.2% 5.1% 100.0% 45.5% 5.7% 18.3% 30.5% 100.0%
Central Sulawesi 2,924 2,853 1,920 309 8,006 3,085 1,825 1,410 1,686 8,00636.5% 35.6% 24.0% 3.9% 100.0% 38.5% 22.8% 17.6% 21.1% 100.0%
West Sulawesi 961 1,432 2,408 0 4,801 760 731 2,155 1,154 4,80120.0% 29.8% 50.2% 0.0% 100.0% 15.8% 15.2% 44.9% 24.0% 100.0%
South Sulawesi 8,475 5,132 4,389 830 18,826 5,389 5,390 3,255 4,793 18,82645.0% 27.3% 23.3% 4.4% 100.0% 28.6% 28.6% 17.3% 25.5% 100.0%
Southeast Sulawesi 1,719 2,939 1,432 201 6,291 1,991 1,756 1,058 1,486 6,29127.3% 46.7% 22.8% 3.2% 100.0% 31.6% 27.9% 16.8% 23.6% 100.0%
Total 17,927 13,736 10,735 1,466 43,864 13,447 11,058 9,225 10,134 43,86440.9% 31.3% 24.5% 3.3% 100.0% 30.7% 25.2% 21.0% 23.1% 100.0%40.9% 59.1% 55.9% 44.1%
Source: Transportation and Communication Statistics 2005, MOC
Surface Type Condition
3.2.4 Existing Bridge Conditions based on the IBMS and Other Information
In Sulawesi, there are 3,344 bridges on national roads with approximately total length of 55km and 2,523 bridges on provincial roads with approximately total length of 38km at present. Most of them are small, short bridges of less than 30m length. However, 65 bridges or 2% for national roads and 24 bridges or 1% for provincial roads are long with more than 100m length.
Table 3.2.15 Number of Bridges on National Roads by Province and Length, 2006 Length
< 10m 10-30m 30-60m 60-100m 100m < Subtotal Province No. % No. % No. % No. % No. % No. %
No. of Bridges of Unknown Lengths
Total
North Sulawesi 299 51 186 32 81 14 11 2 9 2 586 100 5 591Gorontalo 131 46 109 38 36 13 5 2 3 1 284 100 0 284Central Sulawesi 513 56 287 31 85 9 20 2 20 2 925 100 0 925West Sulawesi 107 39 102 37 47 17 10 4 11 4 277 100 0 277South Sulawesi 396 57 172 25 85 12 28 4 13 2 694 100 0 694Southeast Sulawesi 298 52 218 38 41 7 7 1 9 2 573 100 0 573
Total 1,744 52 1,074 32 375 11 81 2 65 2 3,339 100 5 3,344Source: IBMS

Final Report The Study on Arterial Road Network Development Plan for Sulawesi Island and Feasibility Study on Priority Arterial Road Development for South Sulawesi Province March 2008
3-24
Table 3.2.16 Number of Bridges on Provincial Roads by Province and Length, 2006 Length
< 10m 10-30m 30-60m 60-100m 100m < Subtotal Province No. % No. % No. % No. % No. % No. %
No. of Bridges of Unknown Lengths
Total
North Sulawesi 241 63 112 29 25 7 3 1 1 0 382 100 0 382Gorontalo 16 57 11 39 1 4 0 0 0 0 28 100 26 54Central Sulawesi 443 57 256 33 56 7 14 2 12 2 781 100 1 782West Sulawesi 62 70 16 18 9 10 1 1 0 0 88 100 0 88South Sulawesi 453 66 177 26 36 5 13 2 4 1 683 100 1 684Southeast Sulawesi 281 53 191 36 45 8 9 2 7 1 533 100 0 533
Total 1,496 60 763 31 172 7 40 2 24 1 2,495 100 28 2,523Source: IBMS
As for the conditions of the bridges, about 64% for national roads and 71% for provincial roads are no damage/good, and 26% for national roads and 13% for provincial roads are fair/poor. However, these data are only for the bridges that were surveyed. If the unsurveyed bridges were included, these percentages would have changed considerably.
Table 3.2.17 Number of Bridges on National Roads by Province and Condition, 2006 Province No Damage/Good Fair/Poor Bad/Very Bad Wooden/Unknown Total
North Sulawesi 399 (67.5%) 109 (18.4%) 41 (6.9%) 42 (7.1%) 591 (100%)Gorontalo 271 (95.4%) 10 (3.5%) 3 (1.1%) 0 (0%) 284 (100%)Central Sulawesi 496 (53.6%) 381 (41.2%) 40 (4.3%) 8 (0.9%) 925 (100%)West Sulawesi 178 (64.3%) 43 (15.5%) 20 (7.2%) 36 (13.0%) 277 (100%)South Sulawesi 489 (70.5%) 194 (28.0%) 11 (1.6%) 0 (0%) 694 (100%)South East Sulawesi 308 (53.8%) 140 (24.4%) 75 (13.1%) 50 (8.7%) 573 (100%)Total 2,141 (64.0%) 877 (26.2%) 190 (5.7%) 136 (4.1%) 3,344 (100%)
Source: IBMS
Table 3.2.18 Number of Bridges on Provincial Roads by Province and Condition, 2006 Province No Damage/Good Fair/Poor Bad/Very Bad Wooden/Unknown Total
North Sulawesi 272 (71.2%) 51 (13.4%) 1 (0.3%) 58 (15.2%) 382 (100%)Gorontalo 21 (38.9%) 0 (0%) 33 (61.1%) 0 (0%) 54 (100%)Central Sulawesi 726 (92.8%) 9 (1.2%) 0 (0%) 47 (6.0%) 782 (100%)West Sulawesi 63 (71.6%) 22 (25.0%) 2 (2.3%) 1 (1.1%) 88 (100%)South Sulawesi 476 (69.6%) 127 (18.6%) 56 (8.2%) 25 (3.6%) 684 (100%)South East Sulawesi 242 (45.4%) 117 (22.0%) 69 (12.9%) 105 (19.7%) 533 (100%)Total 1,800 (71.3%) 326 (12.9%) 161 (6.4%) 236 (9.4%) 2,523 (100%)
Source: IBMS

Final Report The Study on Arterial Road Network Development Plan for Sulawesi Island and Feasibility Study on Priority Arterial Road Development for South Sulawesi Province March 2008
3-25
3.2.5 Road Traffic based on the IRMS and Study Team’s Estimate
Figure 3.2.9 shows the distribution of traffic volumes in terms of PCUs/day. This was compiled from the IRMS 2006 and the estimate of the Study Team.
A. Most national roads have a traffic volume of less than 3,000 PCUs/day.
B. In Manado, Makassar, and other municipalities, traffic volumes exceed 5,000 PCUs/day.
C. Road sections having more than 10,000 PCUs/day are seen only in the urban areas of Manado, Makassar, and Kendari.
In addition, traffic count surveys and roadside interviews were conducted at various stations in Sulawesi. Survey results and analysis are summarized in Chapter 7 of this report.
Source: JICA Study Team
Figure 3.2.9 Present Traffic Volumes, 2007 (All Vehicles)
Manado
Gorontalo
Palu
Kendari
Makassar

Final Report The Study on Arterial Road Network Development Plan for Sulawesi Island and Feasibility Study on Priority Arterial Road Development for South Sulawesi Province March 2008
3-26
Bau-Bau
3.3 Air and Maritime Transportation
3.3.1 Air
Figure 3.3.1 illustrates the current air routes by airport in Sulawesi.
In Sulawesi, air traffic volume has increased dramatically after 2000. This is mainly due to the open-sky policy adopted in 1999 and the consequent fare reduction. It is said that the maritime industry was seriously affected by the stiff competition from the air transport industry.
In 2005, Hasanuddin Airport in Makassar handled about 2.6 million domestic passengers which is about 60% of Sulawesi’s total air traffic volume that year. Sam Ratulangi Airport in Manado handled the second-largest domestic passenger volume, at about 0.9 million (about 20%). Although the handling volume in other airports is still small, they show the same trend of rapid growth. In addition, international flights are now available from Makassar and Manado (and Gorontalo by 2007) to Singapore, Davao, etc.
Source: JICA Study Team
Figure 3.3.1 Present Air Routes in Sulawesi, 2007

Final Report The Study on Arterial Road Network Development Plan for Sulawesi Island and Feasibility Study on Priority Arterial Road Development for South Sulawesi Province March 2008
3-27
Airport Facility
Air transportation is essential to Indonesia, a populated archipelago without an effective interisland mode of transport. In 2004, there were 209 domestic routes which connected 99 cities. There are four major international airports in Indonesia, namely Soekarno Hatta as the national gateway, Bali as the international tourism gateway, and Surabaya and Medan, the entry points for secondary commercial centers.
The domestic air transport demand is highly concentrated in Jakarta. It is the center of air travel in Indonesia which reflects the prime status of this metropolis. Surabaya, Medan, Balikpapan, and Makassar have large air transport demands that justify their status as secondary domestic airport hubs.
There are three parties in airport management in Indonesia, namely the Directorate General of Air Communications (DGAC), PT. Angkasa Pura I (AP-I), and PT. Angkasa Pura (AP-II). There are 188 airports, of which 165 airports are managed by DGAC, 13 by AP-I, and 10 by AP-I, as shown in Table 3.3.1.
Table 3.3.1 Airports Managed by AP-I and AP-II, 2006 No. PT. Angkasa Pura I (AP-I) PT. Angkasa Pura (AP-II)
1 Bali Jakarta - Soekarno Hatta 2 Surabaya Jakarta - Halim Perdana Kusuma 3 Makassar Palembang 4 Balikpapan Pontianak 5 Biak Medan 6 Manado Padang 7 Yogyakarta Pekanbaru 8 Solo Bandung 9 Banjarmasin Banda Aceh
10 Semarang Tanjung Pinang 11 Ambon - 12 Mataram - 13 Kupang -
Source: Directorat Jenderal Perhubungan Udara
LegendClass I (Managed byPT. Angkasa Pura I)
Manado
Gorontalo
Palu
Toli-Toli
Makassar
Kendari
Class II
Class III
Class IV
Class V or less
Private Airport
Sagir
Luwuk
Buol
Poso
Buton
Muna
Mamuju
Tator
Masamba
Selayar
Saroako
Pomalaa
Tahuna
Seko
Rampi
Tania
Source: Directorat Jenderal Perhubungan Udara Figure 3.3.2 Location Map of Airports in
Sulawesi, 2006

Final Report The Study on Arterial Road Network Development Plan for Sulawesi Island and Feasibility Study on Priority Arterial Road Development for South Sulawesi Province March 2008
3-28
In Sulawesi, there are 22 airports. Two airports are managed by AP-I, namely Hasanuddin Airport in Makassar and Sam Ratulangi Airport in Manado. Seventeen airports are managed by DGAC and 3 are owned by private companies, namely PT. Aneka Tambang Pomalaa, PT. Inco in Soroako and PT. Wakatobi Resort. Details on the 22 airports in Sulawesi are summarized in Table 3.3.2.
In terms of function, Sam Ratulangi Airport (Manado) and Hasanuddin Airport (Makassar) are airport hubs, while Jalaluddin-Gorontalo, Mutiara-Palu, Wolter Monginsidi-Kendari, and Bubung-Luwuk are secondary airports in Sulawesi. Airports with class IV and V classification are local routes in Sulawesi.
Hasanuddin Airport (Makassar) has 18 domestic flight routes, Sam Ratulangi Airport (Manado) has 9, and Mutiara Airport (Palu) has 5. While the Sam Ratulangi Airport has 2 international routes, Hasanuddin Airport has 6 local routes serving Tampa Padang Airport-Mamuju, Pongtiku-Tana Toraja, Andi Jemma-Masamba, H. Aeropala-Selayar, Soroako, and Pomalaa.
The detailed description of the major airports in terms of: (1) airport facilities, (2) passenger and cargo traffic, (3) future development plan, (4) airport operation issues, and (5) accessibility are summarized in Appendix 2.
Table 3.3.2 Airports in Sulawesi, 2006 Number of Routes No. Name of Airport Location Class International Domestic Pioneer
1 Sam Ratulangi Manado I 2 9 2 2 Naha Tahuna IV - - 2 3 Melanggoaena Sangir III - - 2 4 Jalaluddin Gorontalo II - 3 - 5 Mutiara Palu II - 4 2 6 Bubung Luwuk III - 3 - 7 Lalos Tolitoli IV - - 1 8 Pogogul Buol - - - 1 9 Kasiguncu Poso IV - - 2
10 Wolter Mongisidi Kendari II - 2 - 11 Beto Ambari Buton V - - 1 12 Sugi Manuru Muna V - - - 13 Pomalaa Pomalaa Private - 1 - 14 Tampa Padang Mamuju III - 1 1 15 Hasanuddin Makassar I 1 18 6 16 Pongtiku Tator IV - - 1 17 Andi Jemma Masamba IV - - 2 18 H. Aroepala Selayar - - - 1 19 Seko Seko - - - 1 20 Rampi Rampi - - - - 21 Soroako Soroako Private - 1 - 22 Maranggo Tania Private - 1
Source: Directorat Jenderal Perhubungan Udara

Final Report The Study on Arterial Road Network Development Plan for Sulawesi Island and Feasibility Study on Priority Arterial Road Development for South Sulawesi Province March 2008
3-29
3.3.2 Maritime
(1) Intra-island Passenger Traffic by Ship
Maritime transportation, which connects islands separated by gulf, straits, and rivers, is one of the most important transportation systems in Indonesia for vehicles, passengers, and cargoes.
The PT. ASDP, a public corporation under the control of the Ministry of Communication (MOC), and the private shipping lines licensed from DGLT or KANWIL are fully in charge of the ferry operations all over Indonesia.
In its initial stage, the ferry transportation service started only in a few ports in Sulawesi particularly in Bajoe (South Sulawesi), Kolaka and Torobulu-Tompo (Southeast Sulawesi), Bitung (North Sulawesi), and Bira-Pamatata (South Sulawesi). Today there are 28 ferry ports consisting of 12 interprovincial ports and 16 interregional ports, as shown in Table 3.3.3. Moreover, there are 19 routes servicing 8 interprovincial routes, 7 intraprovincial routes and 4 interregional routes, as shown in Figure 3.3.4.
Table 3.3.3 List of Ferry Ports in Sulawesi, 2006 No Name of Ferry
Port Province of
Sulawesi Route1) No Name of Ferry
Port Province of
Sulawesi Route1)
1 Bajoe South I/P 15 Langgara Southeast I/R 2 Siwa South I/P 16 Torobulu Southeast I/R 3 Kolaka Southeast I/P 17 Tampo Southeast I/R 4 Lasusua Southeast I/P 18 Bau-Bau Southeast I/R 5 Tondasi Southeast I/P 19 Waara Southeast I/R 6 Taipa Central I/P 20 Mawasangka Southeast I/R 7 Pagimana Central I/P 21 Dongkala Southeast I/R 8 Mamuju West I/P 22 Luwuk Central I/R 9 Bitung North I/P 23 Salakan Central I/R
10 Gorontalo Gorontalo I/P 24 Banggai Central I/R 11 Pattumbulang South I/P 25 Pananaru North I/R 12 Bira South I/P 26 Melonggoane North I/R 13 Pamatata South I/R 27 Siau North I/R 14 Kendari Southeast I/R 28 P. Lembeh North I/R
Source: PT. ASDP 1) I/P: Interprovincial port, I/R: Interregional port
Table 3.3.4 shows the number of passengers transported by ferry within Sulawesi. In 2005, it was
Pagimana
Tahuna
Melanguane
Lasusua
AmpanaPantoloan
Source: PT. ASDP / Site Survey by JICA Study Team
Figure 3.3.3 Ferry Operation in Sulawesi, 2006

Final Report The Study on Arterial Road Network Development Plan for Sulawesi Island and Feasibility Study on Priority Arterial Road Development for South Sulawesi Province March 2008
3-30
recorded that around 1.5 million passengers were carried by ferry.
Table 3.3.4 Passenger Traffic Volume in 12 Interprovincial Ports No. Port 2001 2002 2003 2004 2005 1 Bajoe 414,388 438,950 276,011 265,584 208,976 2 Siwa - - - - 7,846 3 Kolaka 391,276 415,022 268,977 254,321 289,587 4 Lasusua - - - - 6,321 5 Tondasi - - - - 384 6 Taipa - 2,589 3,746 3,695 2,659 7 Pagimana 114,535 78,231 67,298 70,247 70,623 8 Mamuju 71,271 51,694 53,169 40,867 38,299 9 Bitung 9,997 6,786 10,399 14,964 17,388
10 Gorontalo 114,535 78,231 67,298 70,247 70,623 11 Pattumbukang - - - - 4,397 12 Bira 102,101 103,287 104,324 105,324 111,912 13 Pamatata 113,452 114,511 123,725 124,129 134,514 14 Kendari 21,381 12,529 13,587 9,436 12,269 15 Langgara 16,682 8,970 10,892 6,986 9,347 16 Torobulu 92,369 85,815 79,269 51,129 58,007 17 Tampo 73,761 67,210 76,184 53,330 53,486 18 Bau-bau 35,153 40,692 78,992 124,997 194,090 19 Waara 36,965 40,692 67,771 127,110 165,960 25 Pananaru 1,580 1,550 1,109 2,010 2,890 26 Melonggoane - - - - 3,549 27 Siau - - - - 253 28 P.Lembeh - - 5,312 11,895 5,461
Sulawesi Total 1,609,446 1,546,759 1,308,063 1,336,271 1,468,841 Source : Laporan Tahunan Dishub Provinsi, 2005
Table 3.3.5 shows the number of vehicles and cargo volume transported by ferry. In 2005, the total number of vehicles and cargo volume carried by ferry was an estimated 29,000 units and 69,000 tons, respectively.
Table 3.3.5 Vehicle and Cargo Volumes Carried by Ferry in Sulawesi, 2004-2005 Vehicle (no./yr) Cargo (ton/yr) No. Ferry Route 2004 2005 2004 2005
1 Bajoe-Kolaka 26,748 21,420 80,244 64,260 2 Siwa-Lasusua - 118 - 354 3 Bira-Tondasi - 28 - 76 4 Pattumbukang-Labuan - 34 - 132 5 Mamuju-Balikpapan 1,798 1,436 190 87 6 Taipa-Balikpapan 1,178 1,635 316 272 7 Pagimana-Gorontalo 4,707 3,397 21 58 8 Bitung-Ternate 763 971 9,170 4,476
Sulawesi Total 35,194 29,039 89,941 69,715 Source : Hasil Perhitungan
Tables 3.3.4 and 3.3.5 show a decrease in the number of passengers, vehicles, and volume of cargo in the period 2001-2005. The decline in the number of passengers and vehicle units might be caused by the shift to domestic air transport services among intra-island passengers.

Final Report The Study on Arterial Road Network Development Plan for Sulawesi Island and Feasibility Study on Priority Arterial Road Development for South Sulawesi Province March 2008
3-31
(2) Interisland Passenger Traffic by Ship
Table 3.3.6 shows the total number of passengers of interisland ships in Sulawesi. In 2005, there were 2.8 million outbound passenger trips and 2.1 million inbound passenger trips.
Table 3.3.6 Number of Passengers in Interisland Trips, 2005 Area Port Embarkation Disembarkation
Makassar 417,335 332,160 Parepare 292,145 202,904 Siwa Wajo 103,362 92,768 Others (5 ports) 22,158 17,908
Sulawesi Selatan
Subtotal 835,000 645,740 Bau-Bau 368,981 338,230 Kendari 144,825 146,954 Kolaka 75,854 91,648 Raha 39,142 59,477
Southeast Sulawesi
Subtotal 628,802 636,309 Manado 307,438 217,594 Bitung 89,881 78,169 Ulu Siau 35,561 37,150 Lirung 6,790 16,714
North Sulawesi
Subtotal 439,670 349,627 Gorontalo 575,056 303,805 Kwandang 7,513 5,444
Gorontalo
Subtotal 582,569 309,249 Palu 120,958 11,834 Tolitoli 86,681 88,425 Banggai 77,770 53,017 Buol 38,470 8,956 Morowali 28,575 22,931 Poso 7,839 10,808
Sulawesi Tengah
Subtotal 360,293 195,971 Sulawesi Total 2,846,334 2,136,896
PT. PELNI is a shipping network that operates nationwide. It organizes long-range loop cruises in 2 or 4-week cycles. It is basically different from the ferry service, which operates shuttle service between two terminals.
PT. PELNI has a number of routes in and around the islands of Sulawesi. These routes connect some cities of Indonesia with Sulawesi Island approximately 2 times a month. The PT. PELNI’s vessels call from 17 ports, namely: (1) Makassar, (2) Parepare, (3) Belang Belano, (4) Pantoloan, (5) Tolitoli, (6) Kwandang, (7) Tahuna, (8) Lirung, (9) Bitung, (10) Gorontalo, (11) Luwuk, (12) Banggai, (13) Kolonedale, (14) Kendari, (15) Raha, and (16) Bau-Bau.
Table 3.3.7 shows the recorded numbers of passengers and ships that stopped at Makassar port. According to this data, the number of passengers and ships that visited has decreased. It is thought that most passengers have shifted from shipping transportation to air transportation, since there is no significant difference in fare rates. Moreover, air transportation saves a lot of travel time.

Final Report The Study on Arterial Road Network Development Plan for Sulawesi Island and Feasibility Study on Priority Arterial Road Development for South Sulawesi Province March 2008
3-32
Table 3.3.7 Number of Passengers and Ship Calls of PT. PELNI Vessels at Makassar Port
Item 2002 2003 2004 2005Depart 623,608 483,351 396,785 402,603Arrive 486,491 363,606 302,640 312,326Total 1,110,099 846,957 699,425 714,929
Num. of ship calling 750 701 677 616Source: PELNO Makassar
Number ofpassenger
Table 3.3.8 shows the features of the 6 PT. PELNI ships calling at ports in Sulawesi. The capacity of each ship is between 5,700 GT and 13,900 GT with 1,000-2,200 passenger capacity.
Table 3.3.8 Feature of Ships Calling at Sulawesi Ports, 2005
Name of Ship GT Passenger Capacity (no.)
KM. Umsini 13,900 1,729 KM Tidar 13,900 1,974 KM Dobonsolo 13,900 1,974 KM Sinabung 13,900 1,906 KM. Nggapulu 13,900 2,206 KM. Tilong Kabila 5,700 969
Source: PT. Pelni Makassar
Figure 3.3.4 Ship Owned by PT. PELINI (KM. Siabung: 13,900 GT)
3.4 Cargo Transport
3.4.1 Port Facility
There are over 700 general ports in Indonesia, 2 of which are international port hubs, 21 are international ports, and 58 national ports.
There are about 150 general ports in Sulawesi. There are three international ports, namely
Final Report The Study on Arterial Road Network Development Plan for Sulawesi Island and Feasibility Study on Priority Arterial Road Development for South Sulawesi Province March 2008
3-33
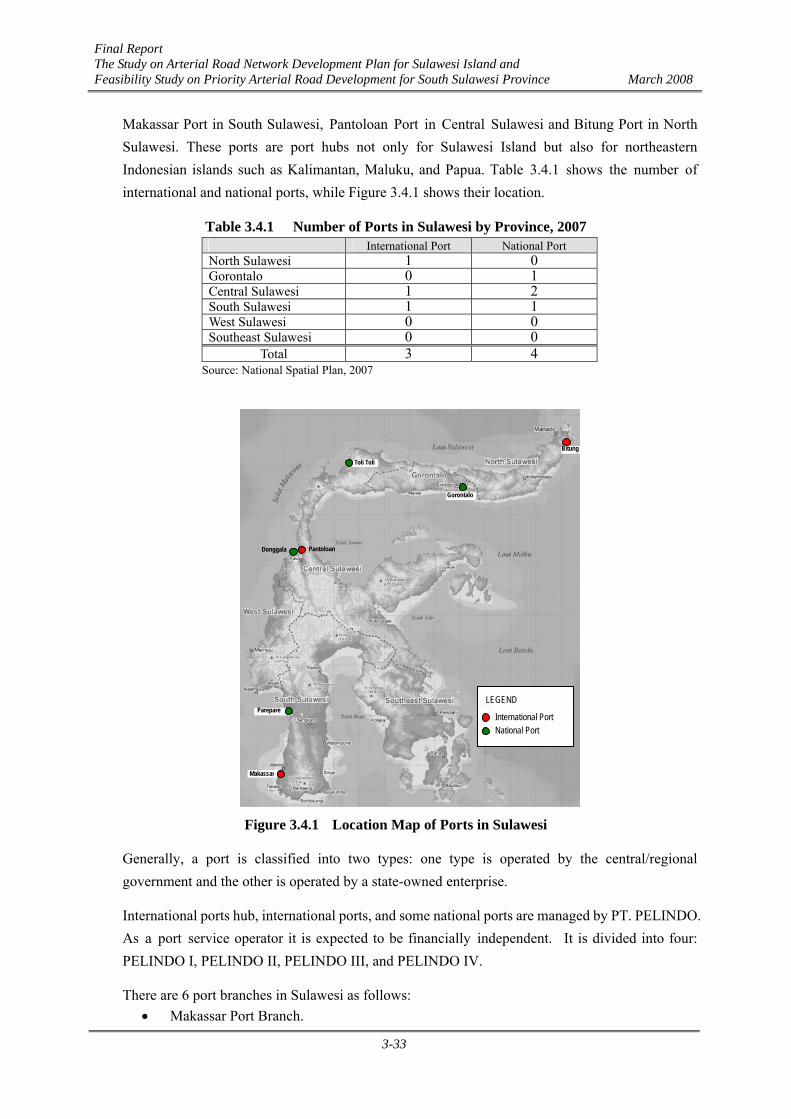
Makassar Port in South Sulawesi, Pantoloan Port in Central Sulawesi and Bitung Port in North Sulawesi. These ports are port hubs not only for Sulawesi Island but also for northeastern Indonesian islands such as Kalimantan, Maluku, and Papua. Table 3.4.1 shows the number of international and national ports, while Figure 3.4.1 shows their location.
Table 3.4.1 Number of Ports in Sulawesi by Province, 2007 International Port National Port North Sulawesi 1 0 Gorontalo 0 1 Central Sulawesi 1 2 South Sulawesi 1 1 West Sulawesi 0 0 Southeast Sulawesi 0 0
Total 3 4 Source: National Spatial Plan, 2007
Figure 3.4.1 Location Map of Ports in Sulawesi
Generally, a port is classified into two types: one type is operated by the central/regional government and the other is operated by a state-owned enterprise.
International ports hub, international ports, and some national ports are managed by PT. PELINDO. As a port service operator it is expected to be financially independent. It is divided into four: PELINDO I, PELINDO II, PELINDO III, and PELINDO IV.
There are 6 port branches in Sulawesi as follows: • Makassar Port Branch.
Bitung
Pantoloan
Makassar
Gorontalo
Toli Toli
Donggala
Parepare LEGEND
International Port National Port

Final Report The Study on Arterial Road Network Development Plan for Sulawesi Island and Feasibility Study on Priority Arterial Road Development for South Sulawesi Province March 2008
3-34
• Bitung Port Branch. • Parepare Port Branch. • Kendari Port Branch. • Gorontalo Port Branch. • Pantloan Port Branch.
Due to the number of ship calling, cargo handling volume, and port facilities these ports are considered major ports today. The site reconnaissance and data collection were carried out in all ports except for Pantloan Port due to security reasons. The features of port facilities and basic data and information on these 6 major ports are summarized in the Appendix.
3.4.2 Cargo Throughput in Major Sea Ports.
The data of cargo throughput in each major port in Sulawesi were collected by visiting the respective ports. Table 3.4.2 shows the data as summarized by province where the major ports are located.
In 2006, the total cargo throughput in the major sea ports was around 12.8 million tons. Of the total cargo, the total international cargo was 2.8 million tons (22%) and the domestic cargo was around 10.0 million tons (78%).
Table 3.4.2 Summary of Cargo Throughput in Sulawesi, 2006 (Unit: 000 tons)
SouthSulawesi
SoutheastSulawesi
CentralSulawesi Gorontalo North
Sulawesi Total Share inTotal
Share ofInt'l Cargo
Share ofDomestic
CargoOutbound
Export 805 654 119 27 408 2,013 16% 36%Domestic Out Subtotal
Intra-island 620 26 13 9 128 795 6% 22%Inter-regional 1,360 16 1,215 71 137 2,799 22% 78%Domestic Out Sub-total 1,980 42 1,228 79 265 3,595 28% 64% 100%
Total Outbound Cargo 2,785 696 1,348 106 673 5,607 44% 100%Inbound
Import 786 0 11 0 0 796 6% 11%Domestic In
Intra-island 47 460 51 156 82 795 6% 12%Inter-regional 2,732 169 1,384 156 1,162 5,604 44% 88%Domestic In Sub-total 2,779 629 1,436 311 1,244 6,399 50% 89% 100%
Total Inbound Cargo 3,565 629 1,447 311 1,244 7,196 56% 100%Grand Total 6,350 1,325 2,794 417 1,916 12,803 100%
International Cargo 1,590 654 130 27 408 2,809 22%Domestic Cargo 4,759 671 2,664 391 1,508 9,994 78%Total Cargo 6,350 1,325 2,794 417 1,916 12,803 100%
International Cargo 57% 23% 5% 1% 15% 100%Domestic Cargo 48% 7% 27% 4% 15% 100%Total Cargo 50% 10% 22% 3% 15% 100%
Total
Share by Province
Source: JICA Study Team based on loading and unloading data of cargo handled by major ports prepared by PT. PELINDO Note: 1. South Sulawesi: Makassar Port (PELINDO), Pare Pare Port (PELINDO), Bringkasi (Private cement and clinker loading
jetty), Malili (Private nickel loading port) 2. Southeast Sulawesi: Kendari Port (PELINDO), Pomalaa (Private nickel loading port) 3. Central Sulawesi: Pantloan Port (PELINDO) 4. Gorontalo: Gorontalo Port (PELINDO), Toli Toli Port 5. North Sulawesi: Bitung Port (PELINDO), Manado Port 6. Fuel traffic data of Sulawesi, PERTAMINA

Final Report The Study on Arterial Road Network Development Plan for Sulawesi Island and Feasibility Study on Priority Arterial Road Development for South Sulawesi Province March 2008
3-35
Of the total outbound cargo volume, the shares of export and domestic volumes were 36% and 64%, respectively. Of the total inbound cargo volume, the shares of import and domestic volumes were 12% and 88%, respectively. Of the total domestic outbound cargo, the volume for intra-island destinations was 22% and 78% was for interregional destinations. As such, the cargo volume transported to and from the other islands in Indonesia through Sulawesi (10.0 million tons) in 2006 was much bigger than the international cargo volume (2.8 million tons).
As shown in Table 3.4.3, South Sulawesi registered the largest share in all categories of maritime cargo traffic (51%), followed by Central Sulawesi (26%). Under the total international cargo volume category, Southeast Sulawesi ranked first (23%), followed by South Sulawesi (57%). However, under the total domestic cargo volume, Central Sulawesi got the largest share (26%), followed by South Sulawesi (49%). It should be noted that the major commodities exported by Southeast Sulawesi are nickel ore and nickel alloy, while Central Sulawesi transports rocks and sand mostly from Pantloan Port to Kalimantan Port.
Table 3.4.3 Share of Cargo Throughput in Major Ports by Province and Cargo Category, 2006 (%)
South Sulawesi
Southeast Sulawesi
Central Sulawesi Gorontalo North
Sulawesi Total
International Cargo Volume
57 23 5 1 14 100
Domestic Cargo Volume
49 7 26 5 13 100
Total 51 9 26 3 17 100 Source: JICA Study Team’s estimate based on data from PT. PELINDO
3.4.3 Cargo Traffic through International Ports
Table 3.4.4 shows the volume of cargo obtained from the PT. PELINDO throughout its major ports. However, the data showing the volume of cargo handled by international ports located in Sulawesi is limited.
Tables 3.4.5 and 3.4.6 show the major commodities produced and exported from Sulawesi and products imported from abroad. These are as follows:
- Exported Products: Cocoa, coconut oil, wheat flour, animal feed, wood, processed wood, preserved fish, coffee, nickel ore, nickel alloy, etc.
- Imported Products: Wheat, sugar, vegetable oil, petroleum products, fertilizer, steel products, consumer goods, etc.
- Transferred Productst: Wheat is imported mainly from Australia in bulk and its flour after processing is exported to Asian countries at around 1.0 million tons per year in bulk.
As such, the major exported and imported commodities are agricultural and mineral products. At present, the exportation and importation of industrial products for the manufacturing sector are not significant.

Final Report The Study on Arterial Road Network Development Plan for Sulawesi Island and Feasibility Study on Priority Arterial Road Development for South Sulawesi Province March 2008
3-36
Table 3.4.5 shows the destinations of major commodities exported from international ports. Table 3.4.6 shows the source countries of each major commodity.
In 2006, the total volume of international cargo was around 2.8 million tons.
Table 3.4.4 Estimated Cargo Volume Handled by Each Port, 2006 (Unit: 000 tons)
Province South Sulawesi North Sulawesi Port Makassar Parepare Bitung
Cocoa Wheat Wheat Flour Processed Wood Cassava Clinker Cement
232126855532
26311
Vegetable Oil Copra Meal
240160
Export
Subtotal 805 0 400Wheat Fertilizer Sugar Asphalt Steel Others
730231119
21
Import
Subtotal 786 0 0Total 1,591 0 400
Province Gorontalo Central Sulawesi Southeast Sulawesi Port Gorontalo Pantloan Kendari
Corn Molasses
225
Cacao
119 Nickel Ferro Alloy Processed Wood Coal Others
54333
67210
Export
Subtotal 27 119 654 Sugar 5 Import
Subtotal 0 5 0Total 27 124 654
Notes: 1. Vegetable oils refer to edible oil made from coconut or crude coconut oil (CNO). 2. The petroleum products imported are mostly high-speed diesel (HSD) and gasoline fuels for vehicles. 3. The port handling the export of nickel ore and nickel alloy in Southeast Sulawesi is a private specialized jetty owned
and operated by the mining companies. 4. Export of Kendari includes that of Malili and Kolaka.
Table 3.4.5 Destinations of Export Cargo from Sulawesi
Province South Sulawesi
North Sulawesi Gorontalo Central
Sulawesi Southeast Sulawesi
Port Makassar Bitung Gorontalo Pantloan Private Ports
Nickel Ore Canada, Japan, China Cacao Malaysia
Brazil USA Singapore
Malaysia USA Singapore China
Vegetable Oil USA, EU USA, EU USA Nickel Alloy Canada, Japan, China Preserved Fish Singapore,
Hong Kong, Japan
Source: Trade Statistics, Ministry of Trade, 2003

Final Report The Study on Arterial Road Network Development Plan for Sulawesi Island and Feasibility Study on Priority Arterial Road Development for South Sulawesi Province March 2008
3-37
Table 3.4.6 Origins of Major Commodities Imported into Sulawesi
Province South Sulawesi
North Sulawesi Gorontalo Central
Sulawesi Southeast Sulawesi
Port Makassar Bitung Gorontalo Pantloan Private Ports Wheat Australia
Canada USA
Sugar Australia South Africa Thailand
Philippines
Rice Vietnam Thailand
Vietnam Thailand
Vietnam
Edible Oil Malaysia Petroleum Products Singapore Coal Australia
Source: Trade Statistics, Ministry of Trade, 2003
3.4.4 Cargo Traffic through National and Regional Ports
(1) Intra-island Maritime Cargo Traffic
Table 3.4.7 shows the origin-destination (OD) table of intra-island cargo movements through the ports by commodity. Figure 3.4.2 illustrates the OD of these maritime cargoes by each major port and by each commodity. In 2006, the total cargo volume transported among the major ports in Sulawesi was around 1.6 million tons. This accounts for around 12% of the total cargo volume transported through the major ports.
(2) Interregional Maritime Cargo Traffic
Table 3.4.8 shows he number of ports in Indonesia linked to the major ports of Sulawesi. Movement of interregional maritime cargo to and from Sulawesi is illustrated in Figure 3.4.3. The total cargo volume transported to and from the major ports located in Sulawesi and the other ports by ship and ferry in Indonesia is estimated at around 8.4 million tons. This accounts for around 65% of the total cargo volume transported through the ports of Sulawesi.
Table 3.4.7 Intra-island Maritime Cargo Movement in Sulawesi, 2006 (Unit: tons)
Destination South Sulawesi Southeast
SulawesiWest Sulawesi Gorontalo North
Sulawesi
Cargo Origin
Total Outbound
Volume Makassar Pare Pare Kendari Pantoloan Toli Toli Gorontalo Bitung
Share
Makassar 590,209 300 460,071 24,919 0 54,965 49,954 74.1% Cement 198,686 300 105,007 16,429 50,950 26,000 Wheat Flour 36,802 4,614 7,000 3,015 22,173 Fertilizer 5,614 4,614 1,000 Rice 7,651 5,870 1,781 Fuel 149,802 149,802 Container 191,654 190,164 1,490 Parepare 29,787 2,750 6,492 0 7,411 13,134 3.7% Rice 28,016 2,750 5,500 7,411 12,355

Final Report The Study on Arterial Road Network Development Plan for Sulawesi Island and Feasibility Study on Priority Arterial Road Development for South Sulawesi Province March 2008
3-38
Destination South Sulawesi Southeast
SulawesiWest Sulawesi Gorontalo North
Sulawesi
Cargo Origin
Total Outbound
Volume Makassar Pare Pare Kendari Pantoloan Toli Toli Gorontalo Bitung
Share
Asphalt 992 992 Vegetables 779 779Kendari 25,747 25,747 3.2% Copra 4,502 4,502 Ratan 21,245 21,245 Pantoloan 13,889 4,397 9,492 1.7% Rice 1,705 1,705 Rock, Stone 7,787 7,787 Log 4,397 4,397 Toli Toli 757 757 0.1% Wood 757 757 Gorontalo 8,573 8,573 1.1% Molasses 4,060 4,060 Sugar Silop 4,513 4,513 Bitung 128,031 7,700 19,070 4,000 97,261 16.1% Rice 11,000 4,000 7,000 Vegetable Oil 7,700 7,700 Fertilizer 388 388 Fruits 58 58 Container 19,070 19,070 Fuel 89,815 89,815 Total 796,993 38,717 300 470,521 51,238 13,492 159,637 63,088 100.0%
Source: Cargo loading and unloading data of major ports in Sulawesi were analyzed and compiled by the Study Team.
Table 3.4.8 List of Ports Linked with Major Ports of Sulawesi Location of Major Ports Sulawesi
South Sulawesi Southeast
Sulawesi Center
Gorontalo Sulawesi North
Port Makassar Pare Pare Kendari Pantloan Gorontalo Bitung Nos. of Links Number 46 23 2 9 3 36 Outbound ‘000 tons 1,100 255 16 1,540 71 138Inbound ‘000 tons 1,340 495 22 1,190 56 618Total ‘000 tons 2,440 750 38 2,730 127 756Source: JICA Study Team

Final Report The Study on Arterial Road Network Development Plan for Sulawesi Island and Feasibility Study on Priority Arterial Road Development for South Sulawesi Province March 2008
3-39
MALUKU
Ambon
Sofifi
Manado
Palu
Makassar
Kendari
Samarinda
Banjarmasin
Palangkaraya
Pontianak
MataramSurabaya
Semarang
YogyakartaBandung
Jakarta
Kupang
KALIMANTAN
DempasarLOMBOK
Malaysia/ Timur
Gorontalo
Bitung
Mamuju
Luwuk
Truck/Bus, Motorcycle, Car/Parts
Parepare
Balikpapan
JAVA
International CargoInter Island Cargo
MALUKU
Ambon
Sofifi
Manado
Palu
Makassar
Kendari
Samarinda
Banjarmasin
Palangkaraya
Pontianak
MataramSurabaya
Semarang
YogyakartaBandung
Jakarta
Kupang
KALIMANTAN
DempasarLOMBOK
Malaysia/ Timur
Gorontalo
Bitung
Mamuju
Luwuk
Cacao
Parepare
Balikpapan
JAVA
MalaysiaSingapore
(230)
Brazil, USA (140)USA (20)
Malaysia, China (120)
International CargoInter Island Cargo
MALUKU
Ambon
Sofifi
Manado
Palu
Makassar
Kendari
Samarinda
Banjarmasin
Palangkaraya
Pontianak
MataramSurabaya
Semarang
YogyakartaBandung
Jakarta
KALIMANTAN
DempasarLOMBOK
Malaysia/ Timur
Gorontalo
Bitung
Mamuju
Luwuk
Coal, Nickel, Fuel
Parepare
Balikpapan
JAVA
Coal (520)
Nikkel to Japan,
China, Canada(540)
Nikkel to Malaysia,Bangla, etc.
(260)
International CargoInter Island Cargo
Ambon
Sofifi
Manado
Palu
Makassar
Kendari
Samarinda
Banjarmasin
Palangkaraya
Pontianak
MataramSurabaya
Semarang
YogyakartaBandung
Jakarta
KALIMANTAN
DempasarLOMBOK
Malaysia/ Timur
Gorontalo
Bitung
Mamuju
Luwuk
Food
Parepare
Balikpapan
JAVA
Rice (42)
Coconut oil (240)to China, Holland,
USA,etc.
Corn (21) toPhillipine, etc.Wheat to VN,
Korea,Malaysia (210)
International CargoInter Island Cargo
Coconuts
Suger(30)
MALUKU
Ambon
Sofifi
Manado
Palu
Makassar
Kendari
Samarinda
Banjarmasin
Palangkaraya
Pontianak
MataramSurabaya
Semarang
Yogyakarta
Bandung
Jakarta
Kupang
KALIMANTAN
DempasarLOMBOK
Malaysia/ Timur
Gorontalo
Bitung
Mamuju
Luwuk
Gypsum, Fertilizer, Log
Balikpapan
JAVA
Gypsum(51)
Fetilizer(70)
Log (61)
Plywood to Japan (47)
International CargoInter Island Cargo
Woodprocessedto Japan
(55)
MALUKU
Ambon
Sofifi
Manado
Palu
Makassar
KendariBanjarmasin
Palangkaraya
Pontianak
MataramSurabaya
Semarang
YogyakartaBandung
Jakarta
Kupang
KALIMANTAN
DempasarLOMBOK
Malaysia/ Timur
Gorontalo
Bitung
Mamuju
Luwuk
Others
Parepare
Balikpapan
JAVA
RockStone (900)
International CargoInter Island Cargo
Generalcargo(140)
to/fromPhillipine
MALUKU
Ambon
Sofifi
Manado
Palu
Makassar
Samarinda
Banjarmasin
Palangkaraya
Pontianak
MataramSurabaya
Semarang
YogyakartaBandung
Jakarta
Kupang
KALIMANTAN
DempasarLOMBOK
Malaysia/ Timur
Gorontalo
Bitung
Mamuju
Luwuk
Cement
Parepare
Balikpapan
JAVA
(210)(190)
(54)(68)
International CargoInter Island Cargo
NUSATENGGARA
TIMUR
Unit:1,000 ton/year Unit:1,000 ton/year
Unit:1,000 ton/year Unit:1,000 ton/year
Unit:1,000 ton/year Unit:1,000 ton/year
Unit:1,000 ton/year Unit:1,000 ton/year
Wheat fromAustralia,USA (730)
Corn (32)
MALUKU
Ambon
Sofifi
Manado
Palu
Makassar
Kendari
Samarinda
Banjarmasin
Palangkaraya
Pontianak
MataramSurabaya
Semarang
YogyakartaBandung
Jakarta
Kupang
KALIMANTAN
DempasarLOMBOK
Malaysia/ Timur
Gorontalo
Bitung
Mamuju
Luwuk
Animal Feed
Parepare
Balikpapan
JAVA
Cassava(32) toChina
Copra meal (160) to China,Korea, India, etc.
International CargoInter Island Cargo
Corn, etc.to Medan
Fuel(320
)Fuel(350
)
(25)
(30)(25)
toBatam
Note: Other interisland total (240)
Fuel(45)
Fetilizer(70)
Fertilizer(23) from
China
(290)Container
(230)
Note: Cargo less than20,000 tons/year is not
Kupang
Kupang
Container(14)
Container(35)
Container(122)
Note: Cargo of less than 20,000 tons/year is not presented. Source: O/D table prepared based on data provided by PT. PELINDO, 2006
Figure 3.4.2 International and Interisland Cargo Movements, 2005

Final Report The Study on Arterial Road Network Development Plan for Sulawesi Island and Feasibility Study on Priority Arterial Road Development for South Sulawesi Province March 2008
3-40
Ka
Mamuju
Poso
Pantoloan
Manado
Gorontalo
Kendari
Makassar
Parepare Kolaka
BitungTolitoli
Luwuk
Unit:1,000 ton/year
(7)
(22)
(6)
Food Material
(3)
(5)
(6)
(3)
(7)
(12)
(2)
(7)
Wheat Flour
RiceVegetable
(4)
(2)
(1)
Ka
Mamuju
Poso
Pantoloan
Manado
Gorontalo
Kendari
Makassar
ParepareKolaka
BitungTolitoli
Luwuk
Unit:1,000 ton/yearProcessed Food
Molasses(animal feed)Sugar Sirup(4)
(8)
Vegetable oil
(5)
Ka
Wood Product
Mamuju
Poso
Pantoloan
Manado
Gorontalo
Kendari
Makassar
ParepareKolaka
BitungTolitoli
Luwuk
Unit:1,000 ton/year
CopraRatan
(4)
Log
(5)(21)
(1)
Wood
Ka
Mamuju
Poso
Pantoloan
Manado
Gorontalo
Kendari
Makassar
Parepare Kolaka
Bitung
(16)
Tolitoli
Luwuk
Unit:1,000 ton/year
(51)
(26)
(105)
Cement
Bingkashi
Ka
Mamuju
Poso
Pantoloan
Manado
Gorontalo
Kendari
Makassar
ParepareKolaka
BitungT olitoli
Luwuk
Unit:1,000 ton/year
(1)
(5)
(16)
ChemicalFert ilizer
(150)
Fuel
(90)
Ka
Mamuju
Poso
Pantoloan
Manado
Gorontalo
Kendari
Makassar
ParepareKolaka
BitungTolitoli
Luwuk
Unit:1,000 ton/yearOthers
Asphalt
(2)
Container
(8)
Rock, Stone
(1)
(190)
(19)
Source: O/D table prepared based on data provided by PT. PELINDO, 2006
Figure 3.4.3 Intra-island Port Cargo Movement, 2005

Final Report The Study on Arterial Road Network Development Plan for Sulawesi Island and Feasibility Study on Priority Arterial Road Development for South Sulawesi Province March 2008
3-41
(3) Character of Cargo Transported to and from Sulawesi
1) General
In Sulawesi, the agricultural, fishery, and mining sectors dominate the economy. The manufacturing or processing industry has not significantly developed yet. Most of the maritime cargo to and from Sulawesi is transported in bulk, break-bulk, or liquid form. The major agricultural products are transported in sacks, liquid bulk for edible oil, and bulk carrier for mineral products such as cement and nickel ore. The share of containerized cargo seems to be increasing but not significant yet. Major commodities, such as cement in South Sulawesi and nickel in Southeastern Sulawesi which are produced very close to the sea port, are transported in bulk. A description of the production of cement and nickel ore is as follows:
Cement: South Sulawesi is endowed with considerable lime stone mountains and these are located around 40km north of Makassar along the western coast. There exists a large-scale lime stone quarry to produce cement. The annual production volume of cement is around 1.2 million tons. This huge volume is shipped mostly to all islands located in northeastern Indonesia, Kalimantan, and Papua. Some volume is shipped to Java through a special jetty owned by cement producers, in Bringkasi in the northern part of Makassar. In 2006, the recorded volume of cement shipped out from Sulawesi to the other islands was around 1.0 million tons, while the volume transported to other ports in Sulawesi in bulk cargo was about 200,000 tons.
Nickel Ore and Ferro-nickel: Southeast Sulawesi is endowed with considerable deposits of nickel ore. Nickel mines in the area have been developed by an international company. Nickel ore and ferro-nickel are shipped through a privately operated special jetty close to the mines located near Pomalaa in Southeastern Sulawesi and Soloako in South Sulawesi. In 2006, the registered volume of nickel ore shipped out from Sulawesi in 2006 was around 0.5 million tons.
Although the combined volume of cement and nickel ore shipped out from Sulawesi is quite large and its share in the total cargo volume traffic is substantial, they are shipped out through privately operated special jetties without much use of land transportation. If the cargo traffic volume of cement and nickel ore are excluded from the total cargo volume of Sulawesi, the shares of other commodities change. The shares of exported and imported cargoes in the total cargo volume, excluding the volume of cement and nickel ore, are 9% and 6%, respectively. The volume of domestic outbound and inbound cargoes was 2.4 million tons and 6.4 million tons, respectively.
The major international and domestic ports in Sulawesi are Makassar Port in South Sulawesi and Bitung Port in North Sulawesi. The Makassar Port handles 42% of the total maritime cargo volume and the Bitung Port handles 10%. The remaining 48% are handled by Parepare Port in South Sulawesi, Pantloan Port in Central Sulawesi, Gorontalo Port in Gorontalo, and Kendari Port together with the nickel loading port, in Southeast Sulawesi.

Final Report The Study on Arterial Road Network Development Plan for Sulawesi Island and Feasibility Study on Priority Arterial Road Development for South Sulawesi Province March 2008
3-42
The conditions of maritime transport for each major commodity produced in or imported to Sulawesi are outlined as follows:
Wheat: Makassar Port is considered as the wheat distribution center in the region and a port hub for wheat distribution in Eastern Indonesia. Wheat is imported from Australia to Makassar Port and then processed into wheat flour for export to Singapore, Malaysia, and other southeast Asian countries. Around half of the volume of unprocessed imported wheat is distributed locally and the rest is processed into wheat flour in wheat mills located in the northern end of the Makassar Port. Wheat flour is distributed in Sulawesi by land transportation and domestic shipping and to the other islands in the region by domestic shipping as well.
Clinker/Cement: The cement produced in South Sulawesi, 40-60km north of Makassar, is distributed through either Makassar Port in sack form or a private cement jetty located in the north of Makassar to Bangladesh, Malaysia, Vietnam, and other southeast Asian countries in bulk form. The clinker is also exported to these countries in bulk form for further processing into cement at these destinations. A major portion of cement transported through domestic shipping is in bulk form as well. The cement transported to the local or regional seaports are unloaded to the cement silo then sacked for distribution through land transportation. The cement processed in South Sulawesi is distributed to the islands in eastern Indonesia by maritime transportation either in sack or bulk form.
Coal: Coal is an energy source for the production of cement. It is brought to Makassar from Kalimantan (Banjarmasin) through domestic shipping.
Cacao: Indonesia is the world’s third-largest producer of cacao. About 90% is grown in South Sulawesi which accounts for almost 14% of the world’s total production. Cacao is exported in sacks to Malaysia and in containers to Brazil, USA, and Singapore. The volume of cacao processed in Sulawesi is limited to 10% of the total volume of production. The volume of cacao transported to Jakarta through domestic shipping for further processing is limited compared with the volume of cacao exported to the international market.
Table 3.4.9 Cacao Production in the World, 2005
Rank Country Volume (000 tons) Share (%) Estimated Value
(US$ mil.) 1 Cote d’Ivore 1,330 35 2 Ghana 736 19 3 Indonesia 610 16 890 4 Nigeria 366 10 5 Brazil 213 6
Source: FAO Statistics
The major ports which handle the exportation of cacao are Makassar Port (232,000 tons or 66%) and Pantoloan Port (119,000 tons or 34%).
Rice: Rice produced in South Sulawesi is distributed to the other islands in eastern Indonesia. The

Final Report The Study on Arterial Road Network Development Plan for Sulawesi Island and Feasibility Study on Priority Arterial Road Development for South Sulawesi Province March 2008
3-43
major ports which handle rice distribution are Parepare Port (207,000 tons or 80%), Makassar Port (30,000 tons or 11%), and Bitung Port (19,000 tons or 9%). To meet the increasing demand in eastern Indonesia and in Sulawesi, rice is imported from other southeast Asian countries such as Vietnam and Thailand.
Fertilizer: The fertilizer needed for the production of rice, corn, cacao, coffee, and other major agricultural products is brought from Surabaya, East Java to South Sulawesi through Makassar Port
Petroleum Products: There is no oil refinery in Sulawesi. From the nearest refinery of PERTAMINA located in Balikpapan in South Kalimantan, petroleum products are brought to Sulawesi through the ports of Makassar, Parepare, Palu, and Bitung. Fuel is further distributed by tankers from Makassar Port to Palopo and Kolaka, and from Bitung Port to Tolitoli, Gorontalo, Poso, Luwuk, and Kolonedale. The fuel is then distributed from the nearest fuel depots to different fuel service stations by around 1,000 lorries. In 2006, a total volume of about 2.8 million kiloliters or 2.4 million tons of fuel was supplied and consumed in Sulawesi. Of the total volume, 1.0 million tons is diesel fuel and 900,000 tons is gasoline. Diesel fuel, which is used for land and marine transportation, accounts for 43% of the total fuel consumed in Sulawesi. The need for asphalt to repair and construct roads in Sulawesi is met by importing asphalt from Singapore..
3.4.5 Major Commodities Traded and Processed
(1) Current Trading and Distribution of Goods
1) Volume and Value of Commodities Exported from Sulawesi
Trading in Sulawesi is composed of six types, namely: (1) domestic distribution within Sulawesi, (2) regional export, (3) international export, (4) regional import, (5) international import and, (6) international transfer trade. Tables 3.4.10 and 3.4.11 respectively show the volume and value of mining and agricultural products produced in Sulawesi and exported to other countries. As revealed in these tables, Sulawesi’s economy largely depends on agriculture and mining.
Table 3.4.10 Export Volume and Value of Sulawesi’s Mining Products, 2006 (Unit: ‘000 tons)
Commodity Total Output
Distributed Volume
Domestic Distribution
Regional Export
International Export
Volume Volume Volume Volume Volume Value Unit ‘000 tons ‘000 tons ‘000 tons ‘000 tons ‘000 tons US$ Mill.
Mining Products Nickel Nickel Ore 600 543 0 0 543 6,516.0 Ferro-nickel 33 0 0 33 1,145.0Cement Clinker 300 263 0 0 263 21.0 Cement 2,000 2,000 837 1,152 11 8.3Total 2,900 2,839 837 1,152 850 .7,690.3
Source: JICA Study Team Note: 1) Nickel ore price per ton in average of 2006 was US$12,000. (In 2007 the same is US$14,680) 2) Nickel ferro-alloy price in 2006 was US$34,700 in 2006. (In 2007 the same is US$ 28,470)

Final Report The Study on Arterial Road Network Development Plan for Sulawesi Island and Feasibility Study on Priority Arterial Road Development for South Sulawesi Province March 2008
3-44
Table 3.4.11 Export Volume and Value of Sulawesi’s Agricultural Products, 2006
(Unit: 000 tons) International
Export Commodity Total
Output (000 tons)
Distributed Volume
(000 tons)
Domestic Distribution
(000 tons)
Regional Export
(000 tons) 000 tons US$ mil.Agricultural Products Cocoa 350 350 0 0 350 560.0 Wheat Flour 603 362 231 46 85 51.0 Wheat 730 127 127 26.7 Animal Feed 170 0 0 170 13.6 Cassava 940 940 910 0 30 11.7 Coffee 57 57 52 0 5 8.6 Corn 1,300 1,130 1,060 50 20 2.0 Rice 5,300 4,240 4,030 210 0 0 Sweet Potato 160 130 130 0 0 0 Peanut 70 60 60 0 0 0 Soybean 27 27 27 0 0 0Forestry Products Wood Processed n.a. 60 0 0 60 55.2 Log 5 5 5 0 0 0 Rattan 21 21 12 9 0 0Fishery Products Crustacean 11 0 0 11 75.0 Marine Fish 347 332 309 0 23 66.0 Inland Fish 125 100 100 0 0 0Livestock Products Cow 89 71 71 0 0 0 Goat 19 19 19 0 0 0 Broiler 113 100 100 0 0 0
Total 10,256 8,312 7,116 315 881 977.6Source: Cargo throughput data obtained from PELINDO, data of economic statistics prepared by each province, trade
statistics prepared by the Ministry of Trade are compiled and summarized by the JICA Study Team Notes: 1. The unit price of the major products was estimated based on the relevant trade statistics of 2003. 2. Distributed volume refers to the volume of product either processed or unprocessed but distributed in Sulawesi
and its external markets in the region and abroad. 3. Whole volume of wheat is imported from Australia.
South Sulawesi Province is endowed with long lime stone mountain ranges along the eastern sea coast. This resource makes Sulawesi an important cement supplier in eastern Indonesia. Although the volume of cement export is limited, the potential supply of cement in the region is high.
Sulawesi is also endowed with a considerable size of nickel mine in Southeast Sulawesi. The nickel mines are developed and exploited by international mining companies.
As for international transfer trade, Sulawesi imports 730,000 tons of wheat from Australia and unloads it at Makassar.. It is then exported as unprocessed wheat or as wheat flour at about 127,000 tons to other Asian countries. The remaining volume of wheat which is processed into wheat flour is distributed in Sulawesi (230,000 tons) and to other regions of Indonesia, especially in the east (46,000 tons). Therefore, Sulawesi can be regarded as a hub for wheat transfer in southeast Asia and wheat distribution in Indonesia.
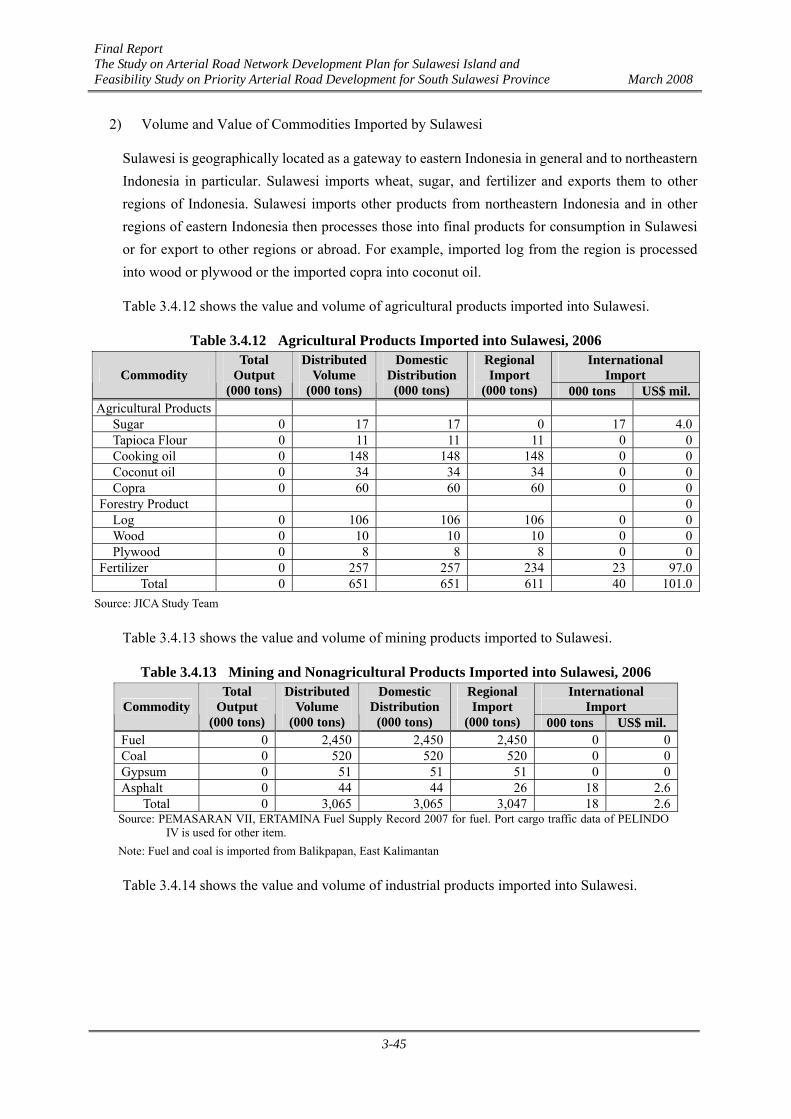
Final Report The Study on Arterial Road Network Development Plan for Sulawesi Island and Feasibility Study on Priority Arterial Road Development for South Sulawesi Province March 2008
3-45
2) Volume and Value of Commodities Imported by Sulawesi
Sulawesi is geographically located as a gateway to eastern Indonesia in general and to northeastern Indonesia in particular. Sulawesi imports wheat, sugar, and fertilizer and exports them to other regions of Indonesia. Sulawesi imports other products from northeastern Indonesia and in other regions of eastern Indonesia then processes those into final products for consumption in Sulawesi or for export to other regions or abroad. For example, imported log from the region is processed into wood or plywood or the imported copra into coconut oil.
Table 3.4.12 shows the value and volume of agricultural products imported into Sulawesi.
Table 3.4.12 Agricultural Products Imported into Sulawesi, 2006 International
Import Commodity Total
Output (000 tons)
Distributed Volume
(000 tons)
Domestic Distribution
(000 tons)
Regional Import
(000 tons) 000 tons US$ mil.Agricultural Products Sugar 0 17 17 0 17 4.0 Tapioca Flour 0 11 11 11 0 0 Cooking oil 0 148 148 148 0 0 Coconut oil 0 34 34 34 0 0 Copra 0 60 60 60 0 0Forestry Product 0 Log 0 106 106 106 0 0 Wood 0 10 10 10 0 0 Plywood 0 8 8 8 0 0Fertilizer 0 257 257 234 23 97.0
Total 0 651 651 611 40 101.0Source: JICA Study Team
Table 3.4.13 shows the value and volume of mining products imported to Sulawesi.
Table 3.4.13 Mining and Nonagricultural Products Imported into Sulawesi, 2006 International
Import Commodity Total
Output (000 tons)
Distributed Volume
(000 tons)
Domestic Distribution
(000 tons)
Regional Import
(000 tons) 000 tons US$ mil.Fuel 0 2,450 2,450 2,450 0 0Coal 0 520 520 520 0 0Gypsum 0 51 51 51 0 0Asphalt 0 44 44 26 18 2.6
Total 0 3,065 3,065 3,047 18 2.6Source: PEMASARAN VII, ERTAMINA Fuel Supply Record 2007 for fuel. Port cargo traffic data of PELINDO
IV is used for other item. Note: Fuel and coal is imported from Balikpapan, East Kalimantan
Table 3.4.14 shows the value and volume of industrial products imported into Sulawesi.

Final Report The Study on Arterial Road Network Development Plan for Sulawesi Island and Feasibility Study on Priority Arterial Road Development for South Sulawesi Province March 2008
3-46
Table 3.4.14 Industrial and Consumable Products Imported into Sulawesi, 2006 International
Import Commodity Total
Output (000 tons)
Distributed Volume
(000 tons)
Domestic Distribution
(000 tons)
Regional Import
(000 tons) 000 tons US$ mil.Steel Product 0 50 50 50 0 0Automobiles 300 300 300 0 0General goods 0 398 398 392 6 n.a.
Total 0 2,005 2,005 1,981 24 0Source: Cargo traffic data obtained from PELINDO IV.
Table 3.4.15 summarizes the outline of the products traded in Sulawesi.
Table 3.4.15 Summary of Volume and Value of Products Traded in Sulawesi International
Trade Commodity Distributed Volume (000
tons)
Domestic Distribution
(000 tons)
Regional Distribution
(000 tons) 000 tons US$ mil.Exported Agricultural Products 8,312 7,116 315 881 977.6Exported Mining Products 2,839 837 1,152 850 278.0
Subtotal of Exports 11,151 7,953 1,467 1,731 1,255.6Imported Agricultural Products 651 651 611 40 101.0Imported Mining Products 3,065 3,065 3,047 18 2.6Industrial and Consumables 2,005 2,005 1,981 24 0
Subtotal of Imports 5,721 5,721 5,639 82 103.6Total 16,872 13,674 7,106 1,819 1,359.2
Source: JICA Study Team
As shown in the preceding tables, in 2006 the total volume of commodities produced was around 15.5 million tons. It is processed into commercial products, of which the total volume is around 12.3 million tons. The type of processing of agricultural products is limited to drying, de-husking, and polishing, etc. and not processing into final products which can be directly marketed to the consuming countries.
Agricultural products account for 78% of the total volume of production. Of the total 12.3 million tons, around 8.0 million (76%) is consumed within Sulawesi and 5.7 million tons (24%) is distributed to the region surrounding Sulawesi. The total export volume of products is 3.2 million tons and 45% of it is distributed mostly in eastern Indonesia and 55% is exported to overseas markets. The total export value of Sulawesi products was about US$ 1.3 billion. Of the total export value, 78% and 22% account for agricultural products and mining products, respectively.
The volume of agricultural products exported to other regions accounts for 4.6% of the total domestic consumption volume. The volume of mining products or cement exported to other regions is more than the volume consumed in Sulawesi.
The total volume of imported products is 4.4 million tons of which 45% accounts for industrial and consumable products. Sulawesi imports most of its industrial products such as steel, machinery, and all consumable products from other regions of Indonesia or abroad.
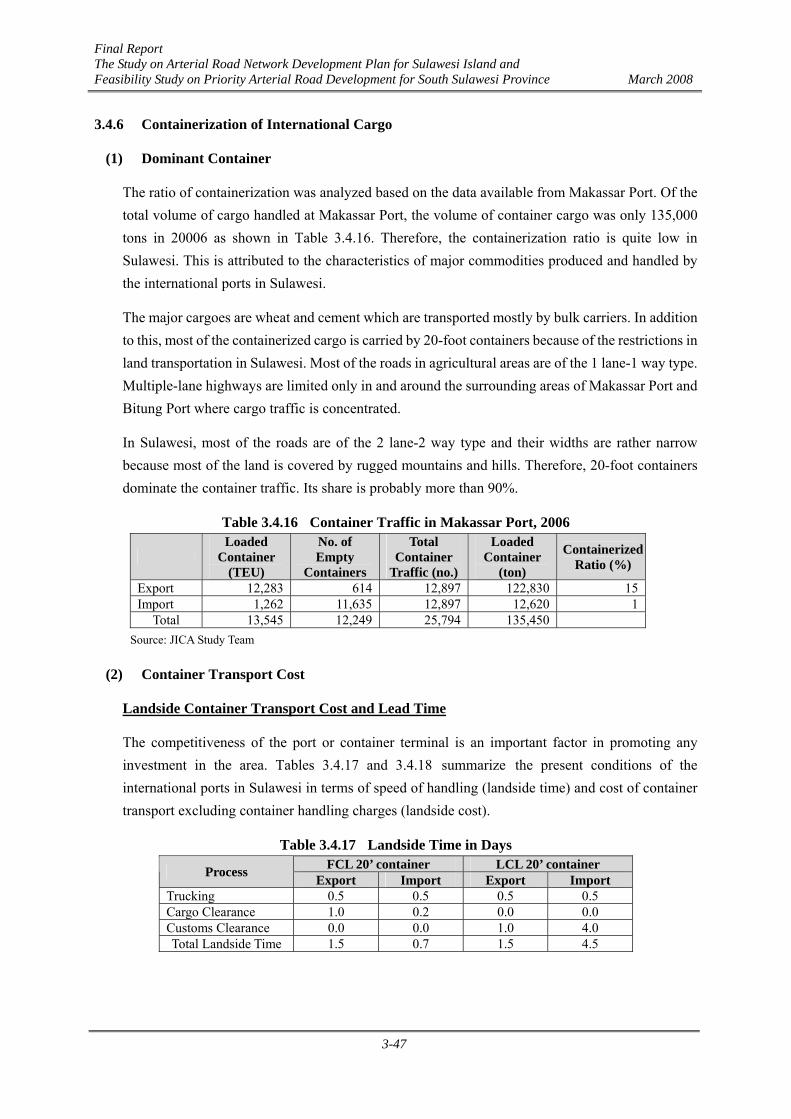
Final Report The Study on Arterial Road Network Development Plan for Sulawesi Island and Feasibility Study on Priority Arterial Road Development for South Sulawesi Province March 2008
3-47
3.4.6 Containerization of International Cargo
(1) Dominant Container
The ratio of containerization was analyzed based on the data available from Makassar Port. Of the total volume of cargo handled at Makassar Port, the volume of container cargo was only 135,000 tons in 20006 as shown in Table 3.4.16. Therefore, the containerization ratio is quite low in Sulawesi. This is attributed to the characteristics of major commodities produced and handled by the international ports in Sulawesi.
The major cargoes are wheat and cement which are transported mostly by bulk carriers. In addition to this, most of the containerized cargo is carried by 20-foot containers because of the restrictions in land transportation in Sulawesi. Most of the roads in agricultural areas are of the 1 lane-1 way type. Multiple-lane highways are limited only in and around the surrounding areas of Makassar Port and Bitung Port where cargo traffic is concentrated.
In Sulawesi, most of the roads are of the 2 lane-2 way type and their widths are rather narrow because most of the land is covered by rugged mountains and hills. Therefore, 20-foot containers dominate the container traffic. Its share is probably more than 90%.
Table 3.4.16 Container Traffic in Makassar Port, 2006
Loaded
Container (TEU)
No. of Empty
Containers
Total Container
Traffic (no.)
Loaded Container
(ton)
Containerized Ratio (%)
Export 12,283 614 12,897 122,830 15 Import 1,262 11,635 12,897 12,620 1
Total 13,545 12,249 25,794 135,450 Source: JICA Study Team
(2) Container Transport Cost
Landside Container Transport Cost and Lead Time
The competitiveness of the port or container terminal is an important factor in promoting any investment in the area. Tables 3.4.17 and 3.4.18 summarize the present conditions of the international ports in Sulawesi in terms of speed of handling (landside time) and cost of container transport excluding container handling charges (landside cost).
Table 3.4.17 Landside Time in Days FCL 20’ container LCL 20’ container Process Export Import Export Import
Trucking 0.5 0.5 0.5 0.5 Cargo Clearance 1.0 0.2 0.0 0.0 Customs Clearance 0.0 0.0 1.0 4.0 Total Landside Time 1.5 0.7 1.5 4.5

Final Report The Study on Arterial Road Network Development Plan for Sulawesi Island and Feasibility Study on Priority Arterial Road Development for South Sulawesi Province March 2008
3-48
Table 3.4.18 Landside Cost per Container (Unit: US$)
Cost Item 20’ FCL 20’ LCL Loading Charge to Truck 36 36 Trucking Charge to Port 95 95 Unloading Charge from Truck 36 36 Stevedoring 0 66 Stuffing 0 53
Total Cost for Export 167 286 Note: Trucking distance is assumed at 50 km as an average distance.
As shown in Table 3.4.17, the landside time in Sulawesi is relatively short except for the export of LCLs as customs clearance for imported goods takes a long time. The relatively short distance from the stocking area of goods and the international port, combined with the relatively smooth cargo handling operation, makes a relatively shorter landside time for container cargo handling possible. However, it may also be attributed to the smooth flow of cargo traffic in the international container handling terminal.
Table 3.4.18 shows the landside cost. The landside cost in Sulawesi for container transport is quite high compared to other major ports in Indonesia and in Asia. For instance, the trucking charge for 20-foot containers per kilometer is US$ 3.3, US$ 2.0, US$ 2.2, US$ 2.7, and US$ 1.5 in Sulawesi, Jakarta, Port Klang in Malaysia, Manila in the Philippines, and Ho Chi Minh in Vietnam, respectively. The loading and unloading charges of container to and from trucks are also quite high. This relatively higher landside cost for container handling might be attributed to a relatively small volume of container handling business in Sulawesi compared with other ports handling much larger volumes of container in Indonesia and in Asia.
Container Handling Charges in the Port
The container handling charges on the basis of tariffs of international ports in Sulawesi are summarized in Table 3.4.19.
Table 3.4.19 Container Handling Charges in Sulawesi (Unit: US$)
Makassar Bitung Pantoloan Average Loading 20’ Loaded Container 278 333 333 315 20’ Empty Container 222 167 111 167 40’ Loaded Container 556 533 667 585 40’ Empty Container 278 222 167 333 Unloading 20’ Loaded Container 278 333 367 326 20’ Empty Container 222 167 111 167 40’ Loaded Container 722 533 722 660 40’ Empty Container 278 222 167 222
Source: JICA Study Team

Final Report The Study on Arterial Road Network Development Plan for Sulawesi Island and Feasibility Study on Priority Arterial Road Development for South Sulawesi Province March 2008
3-49
The above container handling charges are all very high when compared with some of the major international container terminals in Asia and in Africa where cargo volume is not much like in Sulawesi. Table 3.4.20 shows the container cargo handling charges of major international container terminals in Asia, Middle East, and Africa.
Table 3.4.20 Container Handling Charges in Asia and Africa (Unit: US$)
Country Singapore Korea Indonesia U.A.E. Tanzania Port Singapore Pusan Tanjung
Perak Dubai Dar Es
Salaam 40’ Loaded Container 98 100 105 170 225 40’ Empty Container 60 80 Difference 6.0 5.8 5.6 3.4 2.6
Source: JICA Study Team
As shown in Table 3.4.20 the container cargo handling (40’ container) charge prevailing in Sulawesi is very high, higher even than the average container handling charge in Asia by 3.9 times while the difference from the average container handling charge of 20’ container in Asia is around 3 times.

Final Report The Study on Arterial Road Network Development Plan for Sulawesi Island and Feasibility Study on Priority Arterial Road Development for South Sulawesi Province March 2008
3-50
3.5 Administration Framework and Financial Situation in Road Sector
3.5.1 System of Highway Administration
Based on the decentralization policy, the majority of local offices of the central government at provincial governments and Kabupaten/Kota governments were once abolished and many of their staff and functions were integrated into each local government. However the local autonomy laws were revised by the Law No. 32/2004 and the Law No. 33/2004, coinciding with the selection of President Yudhoyono, which included a set of new policies such as the public selection of governors of local governments and centralization of once decentralized functions of the central government. The new laws also strengthened the control of the central government on its budget allocation and on the borrowing of local governments.
With regard to the highway administration, the once abolished Department of Highway (PU) has been restored from the Department of Settlement and Regional Infrastructure and the regional offices of PU (Balai Besar) have been re-established1 in January 2007 to coordinate the activities of PU at the regional level and conduct the procurement and implementation of the development of the national road network. Table 3.5.1 summarizes the responsibilities for activities in the highway administration at different government levels.
Table 3.5.1 Responsibilities of Highway Administrations Road Classification/Task Responsibility Funding Implementation
I. National Road 1. Planning Bina Marga APBN Bina Marga 2. Construction/ Betterment Bina Marga APBN Bina Marga
Balai Besar 3. Land Acquisition/ Resettlement Bina Marga
Local Governments APBN/(and
APBDI/APBDII) Bina Marga
Local Governments 4. Periodic Maintenance Bina Marga APBN Balai Besar
5. Routine Maintenance Bina Marga APBN PRASWIL/Balai Besar II. Provincial Road
1. Planning PRASWIL APBD1 PRASWIL 2. Construction/ Betterment PRASWIL APBD1(PAD/DAU/DAK/
External Grant/Loan) PRASWIL 3. Land Acquisition/ Resettlement PRASWIL APBDI, APBDII PRASWIL.
Local Governments 4. Periodic Maintenance PRASWIL APBD1(PAD/DAU/DAK/
External Grant/Loan) PRASWIL
5. Routine Maintenance PRASWIL APDB1 PRASWIL III. Kabupaten/Kota Road
1. Planning Dinas PU APBDII Dinas PU 2. Construction/ Betterment
Dinas PU APBDII , APBN
(PAD/DAU/DAK/External Grant/Loan)
Dinas PU
3. Land Acquisition/ Resettlement Dinas PU APBDII SKPD (Dinas PU)
4. Periodic Maintenance Dinas PU
APBDII (PAD/DAU/DAK/External
Grant/Loan) Dinas PU
5. Routine Maintenance Dinas PU APBDII Dinas PU Source: JICA Study Team
1 Based on the Decree of Ministry of Public Works No.14/PRT/M 2006 and No.15/PRT/M/2006
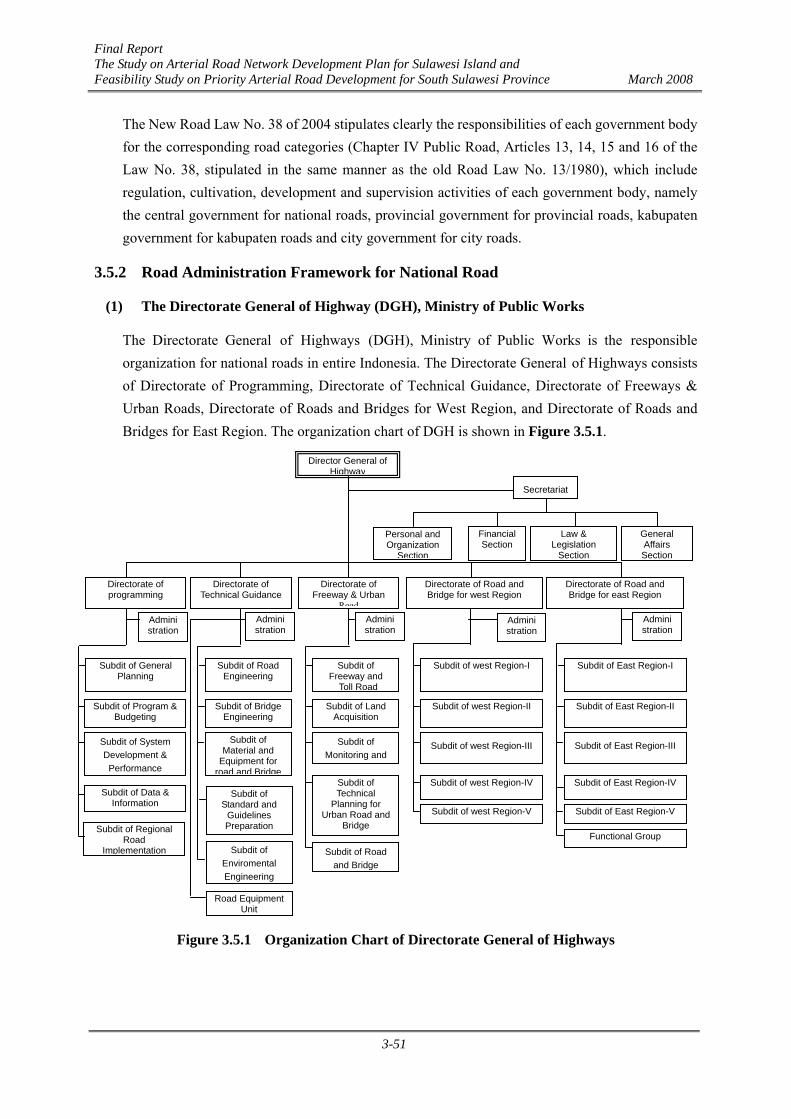
Final Report The Study on Arterial Road Network Development Plan for Sulawesi Island and Feasibility Study on Priority Arterial Road Development for South Sulawesi Province March 2008
3-51
The New Road Law No. 38 of 2004 stipulates clearly the responsibilities of each government body for the corresponding road categories (Chapter IV Public Road, Articles 13, 14, 15 and 16 of the Law No. 38, stipulated in the same manner as the old Road Law No. 13/1980), which include regulation, cultivation, development and supervision activities of each government body, namely the central government for national roads, provincial government for provincial roads, kabupaten government for kabupaten roads and city government for city roads.
3.5.2 Road Administration Framework for National Road
(1) The Directorate General of Highway (DGH), Ministry of Public Works
The Directorate General of Highways (DGH), Ministry of Public Works is the responsible organization for national roads in entire Indonesia. The Directorate General of Highways consists of Directorate of Programming, Directorate of Technical Guidance, Directorate of Freeways & Urban Roads, Directorate of Roads and Bridges for West Region, and Directorate of Roads and Bridges for East Region. The organization chart of DGH is shown in Figure 3.5.1.
Figure 3.5.1 Organization Chart of Directorate General of Highways
Director General of Highway
Secretariat
General Affairs Section
Law & Legislation
Section Financial Section
Personal and Organization
Section
Directorate of programming
Directorate of Technical Guidance Directorate of Directorate of Road and
Bridge for west Region Directorate of Road and Bridge for east Region
Directorate of Freeway & Urban
Road
Subdit of East Region-II
Subdit of East Region-I
Subdit of East Region-III
Subdit of East Region-IV
Subdit of East Region-V
Functional Group
Subdit of west Region-I
Subdit of west Region-II
Subdit of west Region-III
Subdit of west Region-V
Subdit of west Region-IV
Subdit of Freeway and
Toll Road
Subdit of Land Acquisition
Subdit of Monitoring and
Subdit of Technical
Planning for Urban Road and
Bridge
Subdit of Road and Bridge
Subdit of Road Engineering
Subdit of Bridge Engineering
Subdit of Material and
Equipment for road and Bridge
Subdit of Standard and
Guidelines Preparation
Subdit of Enviromental Engineering
Road Equipment Unit
Administration
Subdit of General Planning
Subdit of Program & Budgeting
Subdit of System Development & Performance
Subdit of Data & Information
Subdit of Regional Road
Implementation
Administration
Administration
Administration
Administration

Final Report The Study on Arterial Road Network Development Plan for Sulawesi Island and Feasibility Study on Priority Arterial Road Development for South Sulawesi Province March 2008
3-52
(2) Organization of Balai Besar, the Regional Representative of DGH
As a regional representative of DGH for implementation of National Highwaydevelopment in the technical matters, 7 Balai Besar (Table 3.5.2) and 3 Balai (covering Bali, Maluku, Papua and other areas) have been established throughout the country on the basis of the Decree of Ministry of Public Works No.14/PRT/M 2006 and No.15/PRT/M/2006, and started functioning from January 2007.
The main duty and the function of Balai Besar are as follows:
MAIN DUTY: 1) Conduct planning and technical guidance; 2) Construction, operational and maintenance monitoring, quality assurance, procurement of equipment and material, as well as organizational management. FUNCTION : 1) Data and Information preparation as the material for program compilation of national road management as well as the implementation of planning and technical guidance of road and bridge construction; 2) Construct, operational and maintenance monitoring of road and bridge; 3) Implementation of quality management system in road and bridge construction; 4) Provision, utilization, storing and maintenance of road and bridge materials and equipments, as well as construction quality assurance; 5) Staffing management, work organization, financial, state treasury, as well as coordination with related institutions.
Table 3.5.2 Jurisdiction of Balai Besar No Name of Technical
Implementation Unit Location Work Area
I Type A 1 Balai Besar Pelaksana Jalan Nasional I Medan (North
Sumatra) Aceh, North Sumatra, Riau and Riau Islands (Kepulauan Riau)
2 Balai Besar Pelaksana Jalan Nasional III Palembang (South Sumatra)
Jambi, South Sumatra and Bangka Belitung
3 Balai Besar Pelaksana Jalan Nasional IV Jakarta Banten, Jakarta and West Java 4 Balai Besar Pelaksana Jalan Nasional V Surabaya Central Java, East Java and Jogjakarta II Type B 5 Balai Besar Pelaksana Jalan Nasional II Padang West Sumatra, Bengkulu and Lampung 6 Balai Besar Pelaksana Jalan Nasional VI Makassar South Sulawesi, West Sulawesi, Central, North,
South East and Gorontalo 7 Balai Besar Pelaksana Jalan Nasional
VII Banjarmasin West Kalimantan, South Kalimantan and East
Kalimantan Source: Bina Marga
As illustrated in Figure 3.5.2 Balai Besar is independent from the sub-directorates of Bina Marga, but should coordinate with all the sub-directorates in the technical matters.
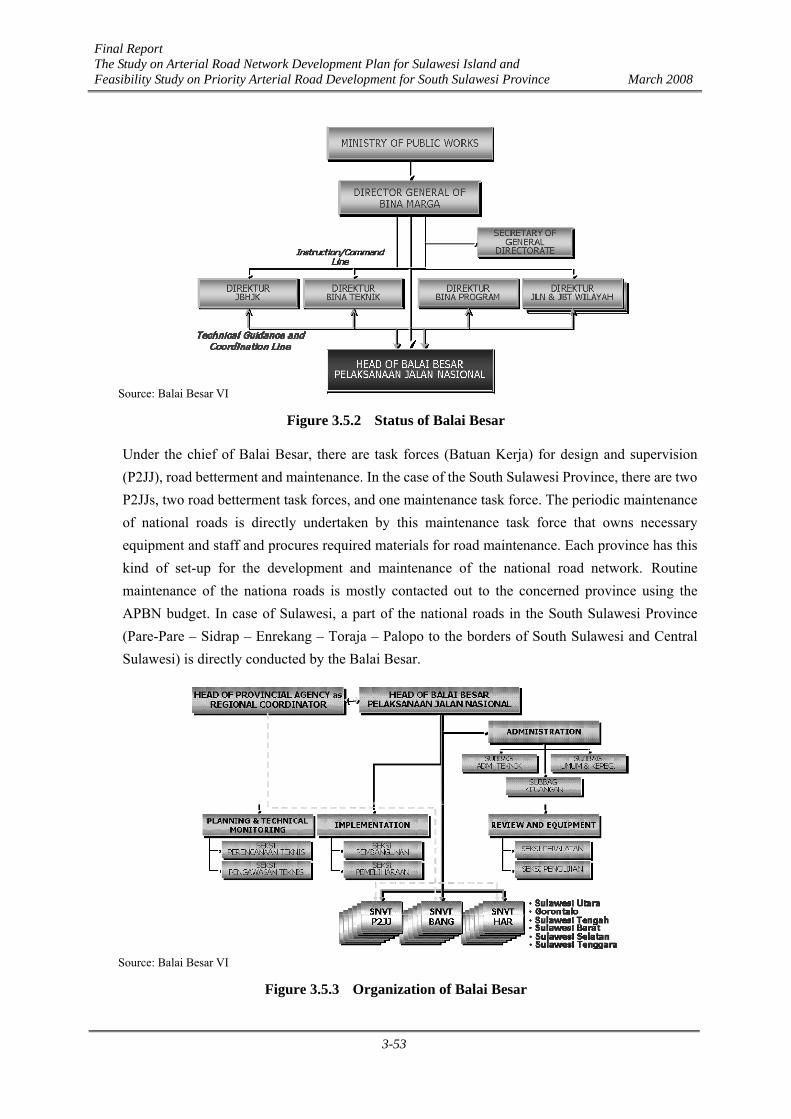
Final Report The Study on Arterial Road Network Development Plan for Sulawesi Island and Feasibility Study on Priority Arterial Road Development for South Sulawesi Province March 2008
3-53
Source: Balai Besar VI
Figure 3.5.2 Status of Balai Besar
Under the chief of Balai Besar, there are task forces (Batuan Kerja) for design and supervision (P2JJ), road betterment and maintenance. In the case of the South Sulawesi Province, there are two P2JJs, two road betterment task forces, and one maintenance task force. The periodic maintenance of national roads is directly undertaken by this maintenance task force that owns necessary equipment and staff and procures required materials for road maintenance. Each province has this kind of set-up for the development and maintenance of the national road network. Routine maintenance of the nationa roads is mostly contacted out to the concerned province using the APBN budget. In case of Sulawesi, a part of the national roads in the South Sulawesi Province (Pare-Pare – Sidrap – Enrekang – Toraja – Palopo to the borders of South Sulawesi and Central Sulawesi) is directly conducted by the Balai Besar.
Source: Balai Besar VI
Figure 3.5.3 Organization of Balai Besar

Final Report The Study on Arterial Road Network Development Plan for Sulawesi Island and Feasibility Study on Priority Arterial Road Development for South Sulawesi Province March 2008
3-54
(3) Directorate General of Land Transportation, Ministry of Transportation
The Directorate General of Land Transportation (DGLT) has a role in formulating and implementing policies and technical standardization in land transport sector. DGLT is to carry out the following functions in entire Indonesia:
i) Preparing materials for formulation of Ministry of Transportation’s policies on road transport, inland waterways and ferry services, urban transportation, and land transport safety;
ii) Implementing the formulated policies on road transport, inland waterways and ferry services, urban transportation, and land transport safety;
iii) Formulating standards, norms, manuals, criteria, procedures on road transport safety;
iv) Providing technical guidance and evaluation;
v) Executing administrative matters of Directorate General of Land Transportation.
Figure 3.5.4 illustrates the organization of DGLT.
ORGANIZATION CHART OF Director General ofDIRECTORATE GENERAL OF LAND TRANSPORTATION Land TransportationSTRUKTUR ORGANISA SI DIREKTORAT JENDERAL PERHUBUNGAN DARAT Direktur Jenderal
Perhubungan Da rat
Director of Directorate of Director of Directorate of Director of Directorate of Director of Directorate of Road Traffic and Transport Inland Waterways, Ferry Traffic & Transport Urban Transportation System Improvement Land Transportation Safety
Direktur Direktorat Direktur Direktorat Direktur Direktorat Direktur DirektoratLa lu Lintas dan An gkutan Jala n La lu Lintas & Angkutan S ungai, Dana u dan Penyeberan gan Bina Sistem Tra nspor tas i Perkotaan Keselamatan Tran spor tas i Darat
Chief of Subdit. of Chief of Subdit. of Chief of Subdit. of Chief of Subdit. ofRoad Transportation Facility Inland Waterways and Ferry Transport Network Urban Transportation Network Safety Management
Kasubdit. Kasubdit. Kasubdit. Kasubdit.Jaringan Tra nspor tas i Jalan Jaringan Tra nspor tas i Sunga i, Danau dan Penyeberangan Jaringan Tra nsportasi Perkotaan Manajemen Keselamatan
Chief of Subdit Chief of Subdit. of Chief of Subdit. of Chief of Subdit. ofRoad Transport Facilities Inland Waterways and Ferry Transport Facilities Urban Traffic Promotion and Partnership
Kasubdit. Kasubdit. Kasubdit. Kasubdit.Sarana Angkuta n Jalan Sarana Angkutan Sungai, Dan au dan Penyeberangan La lu Lintas Perkota an Promosi dan Kemitraa n
Chief of Subdit Chief of Subdit. of Chief of Subdit. of Chief of Subdit. ofRoad Traffic Inland Waterways and Ferry Harbors UrbanTransport Accreditation and Certification
Kasubdit. Kasubdit. Kasubdit. Kasubdit.La lu Lintas Jala n Pelabu han Su ngai, Danau , Penyeberangan Angkutan Perkotaa n Akred itasi dan Ser tifika si
Chief of Subdit Chief of Subdit. of Chief of Subdit. of Chief of Subdit. ofRoad Transport Inland Waterways and Ferry Traffic Urban Transport Mode Integration Safety Audit
Kasubdit. Kasubdit. Kasubdit. Kasubdit.Angkutan Jalan La lu Lintas Sungai, Danau dan Penyeberangan Pemaduan Moda Transpor ta si Perkotaan Audit Keselamatan
Chief of Subdit Chief of Subdit. of Chief of Subdit. ofOperational Control Inland Waterways and Ferry Transport Urban Transportation Impact
Kasubdit. Kasubdit. Kasubdit.Pengen dalian Op erasional Angkutan Sun gai, Danau dan Penyeberanga n Da mpak Transportasi Perko taan
Secretary of Dit. Gen. of Land TransportationSekretar is Dit. Jen. Perhubung an Darat
Figure 3.5.4 Organization of Directorate General of Land Transportation (DGLT)

Final Report The Study on Arterial Road Network Development Plan for Sulawesi Island and Feasibility Study on Priority Arterial Road Development for South Sulawesi Province March 2008
3-55
3.5.3 Road Administration Framework for Provincial Road
There are 6 provinces on the Island of Sulawesi: North Sulawesi, Gorontalo, Central Sulawesi, South Sulawesi, West Sulawesi and South East Sulawesi. Gorontalo was established from 2002 and West Sulawesi from 2006.
(1) South Sulawesi Province
Dinas Praswil (Dinas Prasarana Wilayah of South Sulawesi Provincial Government) is responsible for provincial roads in the South Sulawesi Province. Responsibilities of Dinas Praswil for the road sector include planning, design, construction and maintenance of provincial roads as well as maintenance of part of national roads. The organization chart of Dinas Praswil (Dinas Prasarana Wilayah) is shown in Figure 3.5.5.
There are corresponding maintenance divisions (Kepala seksi Pemeliharaan) in the Dinas Praswail for national road and provincial road. There are three to four officers in each division for the administrative works for the maintenance. Actual implementation of the maintenance work is conducted at each UPTD (Unit Pelaksana Teknis Dinas: Unit for Technical Implementation of Agency) established at Kabupaten/Kota level. The UPTDs conduct the routine maintenance by procuring freelance labors and the periodic maintenance by outsourcing sub-contractors.
The UPTDs may sometimes function as a project implementation unit (“Officers for Technical Activities Implementation”) for the development of Provincial Road and as a “Working Unit” for the development of National Road.
U P T DWILAYAH IV
ADMINISTRATIVE DIVISION
HEAD OF AGENCY
VICE OF HEAD
KEPALA SUB.BAGIANKEPEGAWAIAN
KEPALA SUB.BAGIANKEUANGAN
KEPALA SUB.BAGIANPROGRAM
KEPALA SUB.BAGIANU M U M
KEPALA SUB.DINASBINA TEKNIK
KEPALA SUB.DINASJARINGAN JLN NAS.
KEPALA SUB.DINASJARINGAN JLN.PROP.
KEPALA SUB.DINASPENGAWASAN DAN
PEMANFAATAN JALAN
KEPALA SUB.DINASPERALATAN DAN
B A H A N
KEPALA SEKSIPROGRAM DAN
EVALUASI
KEPALA SEKSIPERENCANAAN
T E K N I S
KEPALA SEKSISURVEI DANLEGER JALAN
KEPALA SEKSIPEMBANGUNAN DANPENINGKATAN JALAN
DAN JEMBATANKEPALA SEKSIPEMEL. JALAN
DAN JEMBATAN
KEPALA SEKSITATA TEKNIS
KEPALA SEKSIPERIJINAN DAN
PEMANFAATAN JALAN
KEPALA SEKSIPENGAWASAN DAN
PEMANFAATAN JALAN
KEPALA SEKSIPERALATAN JALAN
KEPALA SEKSIBAHAN JALAN
KEPALA SEKSIINVENTARISASIKEKAYAAN MILIKNEGARA/DAERAH
KEPALA SEKSIPEMBANGUNAN DANPENINGKATAN JALAN
DAN JEMBATANKEPALA SEKSIPEMEL. JALAN
DAN JEMBATAN
KEPALA SEKSITATA TEKNIS
FUNGSIONAL
KASUBAG TATA USAHA
U P T DWILAYAH III
K A S IJALAN DAN JEMBATAN
KASI PERALATANDAN BAHAN JALAN
KEPALA SUB UNITKAB.MAROS/PANGKEP
KEPALA SUB UNITKOTA MAKASSAR
KEPALA SUB UNITKAB. J.PONTO DAN BANTAENG
KEPALA SUB UNITKAB. BULUKUMBAKEPALA SUB UNIT
KAB. SELAYAR
KASUBAG TATA USAHA
U P T DWILAYAH II
K A S IJALAN DAN JEMBATAN
KASI PERALATANDAN BAHAN JALAN
KEPALA SUB UNITKAB. PINRANG
KEPALA SUB UNITKAB. SIDRAP
KEPALA SUB UNITKAB. ENREKANGKEPALA SUB UNIT
KAB. BARRU
KASUBAG TATA USAHA
K A S IJALAN DAN JEMBATAN
KASI PERALATANDAN BAHAN JALAN
KEPALA SUB UNITKAB. SINJAI
KEPALA SUB UNITKAB. BONE
KEPALA SUB UNITKAB. SOPPENG
KEPALA SUB UNITKAB. WAJO
KASUBAG TATA USAHA
U P T DWILAYAH I
K A S IJALAN DAN JEMBATAN
KASI PERALATANDAN BAHAN JALAN
KEPALA SUB UNITKAB. LUWU SELATAN
KEPALA SUB UNITKAB. LUWU UTARA
KEPALA SUB UNITKAB. TANA TORAJAKEPALA SUB UNITKAB. LUWU TIMUR
KASUBAG TATA USAHA
U P T DPENGUJIAN
K A S IUJI MUTU
K A S IUJI TANAH
K A S IUJI BAHAN
Source: Dinas Praswil of South Sulawesi Province
Figure 3.5.5 Organization Chart of Dinas Prasarana Wilayah South Sulawesi Province

Final Report The Study on Arterial Road Network Development Plan for Sulawesi Island and Feasibility Study on Priority Arterial Road Development for South Sulawesi Province March 2008
3-56
(2) Other Five Provinces
Other five provinces have Dinas PU under which the divisions of Water Resource Development, Road Infrastructure Development and Settlement and Housing as illustrated in Figure 3.5.6 as the case of Central Sulawesi Province. The division of Road Infrastructure Development is responsible for planning, design, construction and maintenance of provincial roads as well as maintenance of part of national roads.
There are corresponding maintenance divisions (Kepala seksi Pemeliharaan) in the Dinas Praswail for national road and provincial road. There are three to four officers in each division for the administrative works for the maintenance. Actual implementation of the maintenance work is conducted at each UPTD (Unit Pelaksana Teknis Dinas: Unit for Technical Implementation of Agency) established at Kabupaten/Kota level. The UPTDs conduct the routine maintenance by procuring freelance labors and the periodic maintenance by outsourcing sub-contractors.
Form 3 : Organisasi dan Kapasitas
Sub Bagian Kepegawaian Sub Bagian Perlengkapan
Seksi Sungai,Rawa, Pantai, Danau
Dan Pengelolaan Sumber Daya Air
Seksi Jalan Seksi Tata Ruang
Seksi Perencanaan Dan Pelaporan
Sub Bagian Keuangan
Seksi Irigasi
Seksi Operasi Dan Pemeliharaan
Seksi PerencanaanTeknik
Subdin Tata Ruang Bina Program Dan Pendataan
Subdin Bina Pengembangan Perumahan
& Permukiman
Subdin Pengembangan Prasarana Jalan
Seksi Pemeliharaan Jalan Dan Jembatan
Seksi Jembatan
Seksi PerencanaanTeknik
Seksi Evaluasi Dan Pengendalian
Seksi Survey Dan Pendataan
Kelompok Jabatan Fungsional
U P T D
Seksi Perumahan Wilayah II
Seksi Perumahan Wilayah II
Seksi Air Bersih Dan Penyehatan Lingkungan
Seksi Perumahan Wilayah I
Subdin Pengembangan Sumber Daya Air
Sub Bagian Umum
Seksi Pelayanan Pengujian Seksi Pelayanan Peralatan
STRUKTUR ORGANISASIDINAS PERMUKIMAN DAN PRASARANA WILAYAH PROVINSI SULAWESI TENGAH
Kepala UPTD
Sub Bagian Tata UsahaSeksi Pemeliharaan
Peralatan
KEPALA BAGIAN TATA USAHA
KEPALA DINAS
Source: Central Sulawesi Province
Figure 3.5.6 Organization Chart of Dinas PU of Central Sulawesi Province

Final Report The Study on Arterial Road Network Development Plan for Sulawesi Island and Feasibility Study on Priority Arterial Road Development for South Sulawesi Province March 2008
3-57
(3) Road Maintenance Forces of Each Province
The road maintenance of the provincial roads for each Province and Balai Besar VI is conducted as follows:
Table 3.5.3 Maintenance Force of Province/ Balai Besar No. of Maintenance
Force (person) Routine Maintenance Periodic Maintenance
1. North Sulawesi 34 Fully Direct Fully Sub Contract 2. Gorontalo 27 Fully Direct Fully Sub Contract 3. Central Sulawesi 36 Fully Direct Fully Sub Contract 4. South Sulawesi 22 Fully Direct Fully Sub Contract 5. West Sulawesi 26 50% Direct:50%Sub
Contract Fully Sub Contract
6. South East Sulawesi 34 Mostly Direct Fully Sub Contract 7. Balai Besar VI 36 Mostly Contract out to
Provinces Fully Direct but actual
works by sub contractors
Source: JICA Study Team
3.5.4 Mechanism of Revenue and Budget Allocation in Indonesia
(1) Revenue Sources for Regional Government
The laws of regional autonomy established in 1999 (Law No. 22 concerning the Regional Administration and Law No. 25 concerning Financial Equilibrium of Central and Regional Governments) have changed the mechanism of revenue and budget allocation in Indonesia in terms of balance between the local and central governments.
The following illustrates the basic policy of the laws. Based on this policy, decentralization of authority and funding from the central government towards Provincial, Kabupaten and Kota governments2 has taken place.
i) Reduction of Central Government Functions and Delegation of its authorities to Kabupaten and Kota Governments
ii) Equalization of Province, Kabupaten and Kota iii) Effective Monitoring Function by Strengthening Authority of Local Councils
Table 3.5.4 summarizes the sources of revenue that the local governments have obtained after the decentralization. There are two major revenue sources for a local government, namely its own revenue from local tax and levies and the revenue allocation from the central government. The majority of tax revenues from automobiles and gasoline are collected at the provincial level and allocated to Kabupaten/Kota within the province concerned.
2 The offices of the Central Government such as foreign relations, defense, national security, judicial courts, monetary and fiscal matter, and
religion were maintained at local government level.
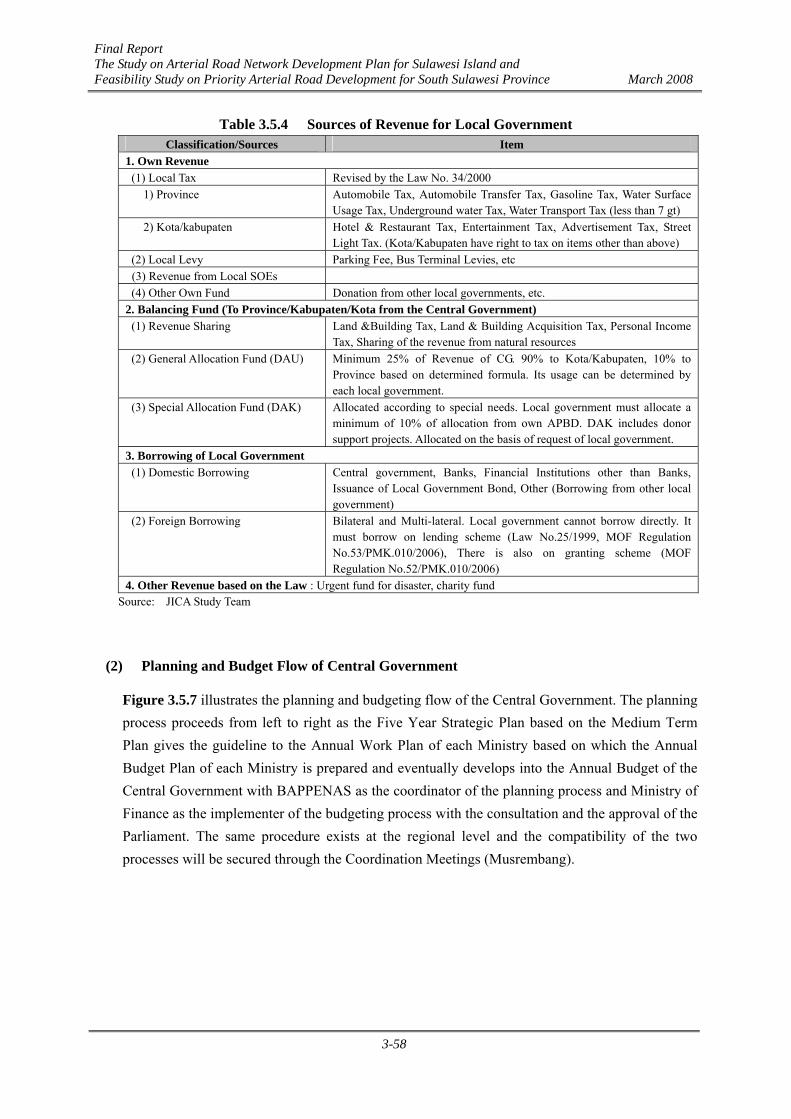
Final Report The Study on Arterial Road Network Development Plan for Sulawesi Island and Feasibility Study on Priority Arterial Road Development for South Sulawesi Province March 2008
3-58
Table 3.5.4 Sources of Revenue for Local Government Classification/Sources Item
1. Own Revenue (1) Local Tax Revised by the Law No. 34/2000
1) Province Automobile Tax, Automobile Transfer Tax, Gasoline Tax, Water Surface Usage Tax, Underground water Tax, Water Transport Tax (less than 7 gt)
2) Kota/kabupaten Hotel & Restaurant Tax, Entertainment Tax, Advertisement Tax, Street Light Tax. (Kota/Kabupaten have right to tax on items other than above)
(2) Local Levy Parking Fee, Bus Terminal Levies, etc (3) Revenue from Local SOEs (4) Other Own Fund Donation from other local governments, etc.
2. Balancing Fund (To Province/Kabupaten/Kota from the Central Government) (1) Revenue Sharing Land &Building Tax, Land & Building Acquisition Tax, Personal Income
Tax, Sharing of the revenue from natural resources (2) General Allocation Fund (DAU) Minimum 25% of Revenue of CG. 90% to Kota/Kabupaten, 10% to
Province based on determined formula. Its usage can be determined by each local government.
(3) Special Allocation Fund (DAK) Allocated according to special needs. Local government must allocate a minimum of 10% of allocation from own APBD. DAK includes donor support projects. Allocated on the basis of request of local government.
3. Borrowing of Local Government (1) Domestic Borrowing Central government, Banks, Financial Institutions other than Banks,
Issuance of Local Government Bond, Other (Borrowing from other local government)
(2) Foreign Borrowing Bilateral and Multi-lateral. Local government cannot borrow directly. It must borrow on lending scheme (Law No.25/1999, MOF Regulation No.53/PMK.010/2006), There is also on granting scheme (MOF Regulation No.52/PMK.010/2006)
4. Other Revenue based on the Law : Urgent fund for disaster, charity fund Source: JICA Study Team
(2) Planning and Budget Flow of Central Government
Figure 3.5.7 illustrates the planning and budgeting flow of the Central Government. The planning process proceeds from left to right as the Five Year Strategic Plan based on the Medium Term Plan gives the guideline to the Annual Work Plan of each Ministry based on which the Annual Budget Plan of each Ministry is prepared and eventually develops into the Annual Budget of the Central Government with BAPPENAS as the coordinator of the planning process and Ministry of Finance as the implementer of the budgeting process with the consultation and the approval of the Parliament. The same procedure exists at the regional level and the compatibility of the two processes will be secured through the Coordination Meetings (Musrembang).

Final Report The Study on Arterial Road Network Development Plan for Sulawesi Island and Feasibility Study on Priority Arterial Road Development for South Sulawesi Province March 2008
3-59
referred noticed will create the compatibility through Musrembang
Strategic PlanMinsitry/Institution
National MediumTerm PlanNational Long
Term PlanGov.Work
Plan
Work PlanMinistry/Institution Budget Plan
Minsitry/InstitutionBudget Details
APBN Draft APBN
Local Medium Term Plan
Strategic Plan of Working Unit
Local Long Term Plan
Work Plan ofWorking Unit
Local Gov Work Plan APBD Draft APBD
Budget Planof Working
Unit
Details ofAPBD
referred
guidelines
guidelines
guidelines
guidelines
guidelines guidelines
guidelines
guidelines
guidelines
described
guidelines
referred
described
Central
Governm
entR
egional/LocalG
overnment
Act of NationalDevelopment
Planning System Act of StateMinistry
Source: BAPPENAS
Figure 3.5.7 Planning and Budgeting Flow
3.5.5 Road Sector Budget Allocation of Central Government
After the enforcement of the Local Autonomy Policy, the ratio of capital expenditure of the Central Government against GDP has been decreasing due to the fiscal reform program of IMF and the decentralization of fiscal resources towards local governments. Before that the ratio remained at the level of about 6% to 9%, but it immediately went down to 3% after the Policy has been enforced for the years 2002, 2003 and 2004, then lowered further recently to 1.9% for the years 2005 and 2006 as shown in Table 3.5.5.
The revenue of the Central Government has been constantly increasing for the last five years and about 34% to 35% of the revenue has been transferred to the local governments as transfer fund.
Table 3.5.5 Expenditures of Central Government Item Expenditure (% of GDP)
Recurrent Expenditure
Actual 11-15% Before Local Autonomy Policy Capital
Expenditure Actual 6-9%
Central Government
2002 Budget
2003 Budget
2004 Budget
2005 Budget
2006 Budget
- Recurrent (CG) 11.2% 9.2% 8.1% 7.7% 10.9% - Capital (CG) 3.0% 3.2% 3.1% 1.9% 1.9% - CG Total 14.2% 12.4% 11.2% 9.6% 12.8% Local Government 5.6% 5.7% 5.2% 4.7% 6.6%
After Local Autonomy Policy
Total 19.8% 18.1% 16.5% 14.3% 19.4% Source: BPS, Ministry of Finance
The budget allocated to the road sector accounted for 1.2% to 1.3% of the Government Expenditure recently and its tendency has been fairly stable. About 4.0 to 7.0 trillion Rupiahs have been allocated to the road sector for the last five years.
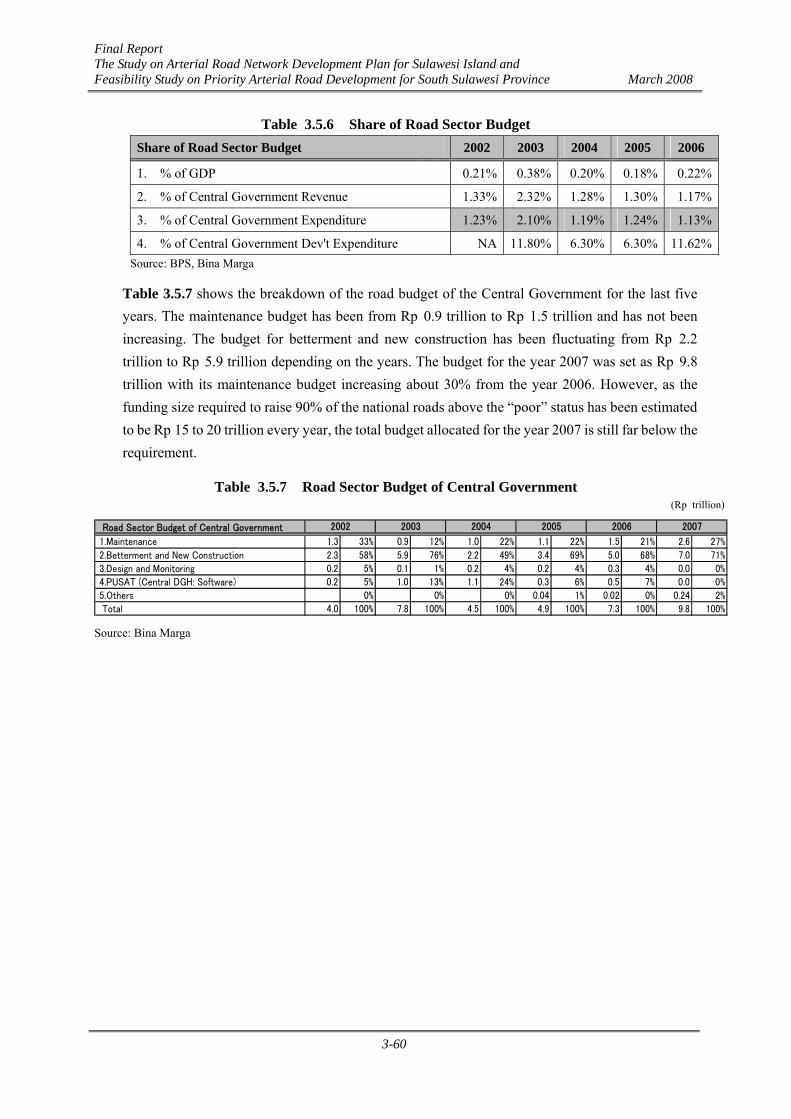
Final Report The Study on Arterial Road Network Development Plan for Sulawesi Island and Feasibility Study on Priority Arterial Road Development for South Sulawesi Province March 2008
3-60
Table 3.5.6 Share of Road Sector Budget Share of Road Sector Budget 2002 2003 2004 2005 2006
1. % of GDP 0.21% 0.38% 0.20% 0.18% 0.22%
2. % of Central Government Revenue 1.33% 2.32% 1.28% 1.30% 1.17%
3. % of Central Government Expenditure 1.23% 2.10% 1.19% 1.24% 1.13%
4. % of Central Government Dev't Expenditure NA 11.80% 6.30% 6.30% 11.62%Source: BPS, Bina Marga
Table 3.5.7 shows the breakdown of the road budget of the Central Government for the last five years. The maintenance budget has been from Rp 0.9 trillion to Rp 1.5 trillion and has not been increasing. The budget for betterment and new construction has been fluctuating from Rp 2.2 trillion to Rp 5.9 trillion depending on the years. The budget for the year 2007 was set as Rp 9.8 trillion with its maintenance budget increasing about 30% from the year 2006. However, as the funding size required to raise 90% of the national roads above the “poor” status has been estimated to be Rp 15 to 20 trillion every year, the total budget allocated for the year 2007 is still far below the requirement.
Table 3.5.7 Road Sector Budget of Central Government (Rp trillion)
Road Sector Budget of Central Government
1.Maintenance 1.3 33% 0.9 12% 1.0 22% 1.1 22% 1.5 21% 2.6 27%
2.Betterment and New Construction 2.3 58% 5.9 76% 2.2 49% 3.4 69% 5.0 68% 7.0 71% 3.Design and Monitoring 0.2 5% 0.1 1% 0.2 4% 0.2 4% 0.3 4% 0.0 0% 4.PUSAT (Central DGH: Software) 0.2 5% 1.0 13% 1.1 24% 0.3 6% 0.5 7% 0.0 0% 5.Others 0% 0% 0% 0.04 1% 0.02 0% 0.24 2% Total 4.0 100% 7.8 100% 4.5 100% 4.9 100% 7.3 100% 9.8 100%
2006 20072002 2003 2004 2005
Source: Bina Marga

Final Report The Study on Arterial Road Network Development Plan for Sulawesi Island and Feasibility Study on Priority Arterial Road Development for South Sulawesi Province March 2008
3-61
Rp.
Rp.
Rp.
Rp.
Trill
ion
Trill
ion
Trill
ion
Trill
ion
298.
616
.0%
100.
0%33
6.2
16.4
%10
0.0%
349.
915
.4%
100.
0%38
0.4
13.7
%10
0.0%
625.
218
.7%
100.
0%
210.
111
.3%
70.4
%25
4.1
12.4
%75
.6%
272.
212
.0%
77.8
%29
7.8
10.7
%78
.3%
416.
312
.5%
66.6
%
(Inco
me
Tax)
0.0%
0.0%
120.
95.
9%36
.0%
134
5.9%
38.3
%14
2.2
5.1%
37.4
%21
0.7
6.3%
33.7
%
(VA
T)0.
0%0.
0%80
.83.
9%24
.0%
86.3
3.8%
24.7
%98
.83.
5%26
.0%
128.
33.
8%20
.5%
88.5
4.7%
29.6
%82
4.0%
24.4
%77
.13.
4%22
.0%
81.7
2.9%
21.5
%20
5.3
6.2%
32.8
%
322.
217
.3%
107.
9%37
0.6
18.1
%11
0.2%
374.
416
.5%
107.
0%39
7.8
14.3
%10
4.6%
647.
719
.4%
103.
6%
224.
012
.0%
75.0
%25
3.7
12.4
%75
.5%
255.
311
.2%
73.0
%26
6.2
9.6%
70.0
%42
7.6
12.8
%68
.4%
a. R
ecur
rent
exp
endi
ture
0.0%
0.0%
188.
69.
2%56
.1%
184.
48.
1%52
.7%
212.
67.
6%55
.9%
364.
710
.9%
58.3
%
(Per
sonn
el e
xpen
ditu
re)
0.0%
0.0%
50.4
2.5%
15.0
%56
.72.
5%16
.2%
--
b. D
evel
opm
ent e
xpen
ditu
re0.
0%0.
0%66
.13.
2%19
.7%
70.9
3.1%
20.3
%53
.61.
9%14
.1%
62.9
1.9%
10.1
%
(Roa
d Se
ctor
)4.
00.
2%1.
3%7.
80.
4%2.
3%4.
50.
2%1.
3%4.
90.
2%1.
3%7.
30.
2%1.
2%
mai
nten
ance
1.3
0.1%
0.4%
0.9
0.0%
0.3%
1.0
0.0%
0.3%
1.1
0.0%
0.3%
1.5
0.0%
0.2%
Bet
term
ent a
nd N
ew C
onst
ruct
ion
2.3
0.1%
0.8%
5.9
0.3%
1.8%
2.2
0.1%
0.6%
3.4
0.1%
0.9%
5.0
0.1%
0.8%
Des
ign
and
Mon
itorin
g0.
20.
0%0.
1%0.
10.
0%0.
0%0.
20.
0%0.
0%0.
20.
0%0.
0%0.
30.
0%0.
0%
PU
SA
T (C
entra
l DG
H: s
oftw
are)
0.2
0.0%
0.1%
1.0
0.0%
0.3%
1.1
0.1%
0.3%
0.3
0.0%
0.1%
0.5
0.0%
0.1%
Oth
ers
0.0%
0.0%
0.0%
0.0%
0.0%
0.0%
0.04
0.0%
0.0%
0.02
0.0%
0.0%
98.2
5.3%
32.9
%11
6.9
5.7%
34.8
%11
95.
2%34
.0%
131.
54.
7%34
.6%
220.
16.
6%35
.2%
a. R
even
ue S
harin
g Fu
nd0.
0%0.
0%27
.91.
4%8.
3%26
.91.
2%7.
7%31
.21.
1%8.
2%59
.31.
8%9.
5%
b. G
ener
al A
lloca
tion
Fund
69.2
3.7%
23.2
%77
3.8%
22.9
%82
.13.
6%23
.5%
88.8
3.2%
23.3
%14
5.7
4.4%
23.3
%
c. S
peci
al A
lloca
tion
Fund
0.0%
0.0%
2.6
0.1%
0.8%
3.1
0.1%
0.9%
4.3
0.2%
1.1%
11.6
0.3%
1.9%
d. S
peci
fic A
uton
omy
Bal
ance
Fun
d3.
50.
2%1.
2%9.
40.
5%2.
8%6.
80.
3%1.
9%7.
20.
3%1.
9%3.
50.
1%0.
6%
-23.
6-1
.3%
-7.9
%-3
4.4
-1.7
%-1
0.2%
-24.
4-1
.1%
-7.0
%-1
7.4
-0.6
%-4
.6%
-22.
4-0
.7%
-3.6
%
23.6
34.4
24.4
17.4
22.4
16.9
31.5
40.5
37.6
50.9
6.6
2.9
-16.
1-2
0.2
-28.
5
Not
e: 1
) Sin
ce 2
005
is u
sing
uni
fied
budg
et, t
hat i
nclu
ded
of th
e bu
dget
ed c
urre
nt e
xpen
ditu
res
and
budg
eted
dev
elop
men
t exp
endi
ture
2. F
orei
gn F
inan
ce
Sour
ce: M
OF
Bud
get S
tatis
tics
2. T
rans
fer F
und
C. F
isca
l Bal
ance
(A-B
)D
. Def
icit
Fina
ncin
g1.
Dom
estic
Fin
ance
1. T
ax R
even
ue
2. N
on-ta
x R
even
ue
B. E
xpen
ditu
re1.
Cen
tral G
ov. E
xpen
ditu
re
Rat
ioG
DP
Rat
ioR
atio
GD
P R
atio
Rat
ioG
DP
Rat
io
A. R
even
ue
Bud
get I
tem
2002
2003
Rp.
Tril
lion
GD
P R
atio
Rat
ioG
DP
Rat
ioR
atio
2004
2005
2006
Tabl
e 3.
5.8
Rev
enue
and
Exp
endi
ture
of C
entr
al G
over
nmen
t (B
udge
t)

Final Report The Study on Arterial Road Network Development Plan for Sulawesi Island and Feasibility Study on Priority Arterial Road Development for South Sulawesi Province March 2008
3-62
3.5.6 Road Sector Budget Allocation of Provincial Government
(1) Budget Allocation for National Road Development and Maintenance from Central Government
Table 3.5.8 illustrates the historical trend of the budget of Bina Marga allocated to the provinces form 2001 to 2007 mainly for the development and maintenance of the national road network. The total amount of the budget allocated to all provinces was Rp 9.8 trillion for the year of 2007. The annual average growth rate of the budget for the period has been about 28%. The shares among the regions for the year of 2007 are as follows:
Sumatera 24.2% Jawa 29.6% Kalimantan 19.6% Bali dan Nusa Tengara 6.4% Sulawesi 11.7% Maluku da Papua 8.5%
The Sulawesi Region has a 12 % share of the whole country for the year 2007. Its average share for the period from 2001 to 2007 has been 11.4%. The share of the Sulawesi Region in the country has been fairly stable for the last 3 years ranging between 11% and 12%. The share of the Sulawesi in the national road sector budget allocation may be considered relatively high as compared to that of GRDP being only 4.2% (2004) and that of population being 7.3%.
The breakdown of budget category for the average of the period of 2001-2007 for the whole country is as follows: Road Maintenance 22.1% Road Betterment and New Construction 67.2% Design and Monitoring 2.3% PUSAT (Central DGH) 7.6% Others 0.7% The total amount allocated to all the Sulawesi provinces for 2007 is 1,054 Rp billion. Among the provinces of the Sulawesi Region the share of the South Sulawesi Province has been about one fourth of the total Sulawesi budget allocated from Bina Marga (Table 3.5.9) growing in recent years..

Final Report The Study on Arterial Road Network Development Plan for Sulawesi Island and Feasibility Study on Priority Arterial Road Development for South Sulawesi Province March 2008
3-63
Table 3.5.9 Budget Allocation of Bina Marga to Provinces (2001-2007)
(Rp Million)No Province/Project
2001 2002 2003 2004 2005 2006 2007 Total1 Nanggroe Aceh Darussalam 114,037 160,851 3,785,852 67,780 271,221 273,855 298,855 4,972,4512 Sumatera Utara 85,525 147,617 204,976 164,989 204,405 340,869 360,869 1,509,2503 Sumatera Barat 146,804 79,449 79,758 97,520 97,231 130,189 184,253 815,2044 Riau 141,421 146,259 148,654 163,701 162,105 181,622 183,122 1,126,8845 Kepulauan Riau 15,951 39,980 65,568 121,4996 Jambi 69,260 128,391 133,644 103,495 162,737 163,565 209,565 970,6577 Bengkulu 36,558 95,704 89,305 91,192 91,299 105,760 147,361 657,1798 Sumatera Selatan 59,893 138,351 54,813 62,783 128,189 254,501 343,009 1,041,5399 Kepulauan Bangka Belitung 36,570 68,535 61,425 63,682 69,121 89,121 388,454
10 Lampung 52,101 177,626 41,469 48,300 249,005 238,446 294,153 1,101,10011 DKI jakarta 132,858 292,594 425,45212 Banten 947 59,782 68,952 60,409 66,909 94,466 107,606 459,07113 Jawa Barat 85,579 205,822 82,980 103,740 362,084 518,995 548,368 1,907,56814 Jawa Tengah 146,916 251,592 134,823 141,399 165,770 324,516 354,016 1,519,03215 DI Yogyakarta 45,592 36,725 55,479 68,169 75,570 88,420 104,979 474,93416 Jawa Timur 57,907 173,295 141,448 165,857 326,649 709,519 1,258,418 2,833,09317 Kalimantan Barat 54,208 88,185 80,384 113,732 173,993 218,218 233,218 961,93818 Kalimantan Tengah 71,512 119,546 72,764 106,245 146,352 288,142 690,000 1,494,56119 Kalimanta Timur 360,636 353,907 446,676 467,612 529,129 521,135 545,635 3,224,73020 Kalimantan Selatan 57,595 95,868 96,733 98,849 98,742 185,499 294,000 927,28621 Bali 32,586 82,441 40,603 45,793 52,513 104,338 154,338 512,61222 Nusa Tenggara Barat 33,695 76,855 55,538 44,230 50,384 83,318 104,518 448,53823 Nusa Tenggara Timur 64,465 140,869 115,965 130,594 177,198 231,390 316,390 1,176,87124 Sulawesi Utara 83,883 167,922 112,095 99,112 98,948 159,691 229,691 951,34225 Gorontalo 48,257 52,966 50,849 78,076 88,030 90,030 408,20826 Sulawesi Tengah 58,683 101,349 98,925 115,977 117,723 127,951 132,201 752,80927 Sulawesi Selatan 62,375 152,621 90,734 117,609 118,113 227,628 340,768 1,109,84828 Sulawesi Barat 79,910 109,910 189,82029 Sulawesi Tenggara 45,692 106,341 80,419 104,197 104,527 150,420 151,420 743,01630 Maluku 44,706 99,677 84,113 95,047 95,901 173,259 195,395 788,09831 Maluku Utara 22,418 59,212 53,497 49,446 50,310 87,345 109,202 431,43032 Papua 183,718 235,299 277,262 288,268 210,819 235,971 294,371 1,725,70833 Irian Jaya Barat 107,806 141,865 166,865 416,536
Total 2,218,712 3,766,383 6,849,362 3,328,319 4,653,341 6,770,792 8,999,809 36,586,718PUSAT (Central Directorate General ofHighways/DGH) incl. Others 38,219 190,377 950,570 1,139,396 296,169 538,522 806,272 3,959,525
Grand Total 2,256,931 3,956,760 7,799,932 4,467,715 4,949,510 7,309,314 9,806,081 40,546,243
Region2001 2002 2003 2004 2005 2006 2007 Total
Sumatera 705,599 1,110,818 4,607,006 861,185 1,445,825 1,797,908 2,175,876 12,704,217Jawa 336,941 727,216 483,682 539,574 996,982 1,868,774 2,665,981 7,619,150Kalimantan 543,951 657,506 696,557 786,438 948,216 1,212,994 1,762,853 6,608,515Bali dan Nusa Tengara 130,746 300,165 212,106 220,617 280,095 419,046 575,246 2,138,021Sulawesi 250,633 576,490 435,139 487,744 517,387 833,630 1,054,020 4,155,043Maluku dan Papua 250,842 394,188 414,872 432,761 464,836 638,440 765,833 3,361,772Total 2,218,712 3,766,383 6,849,362 3,328,319 4,653,341 6,770,792 8,999,809 36,586,718
Note: PUSAT and Others are excluded.Budget Category
2001 2002 2003 2004 2005 2006 2007 TotalRoad Maintenance 640,455 1,279,571 879,154 979,311 1,126,480 1,480,582 2,617,619 9,003,172Road Betterment and New Construction 1,655,560 2,318,816 5,886,180 2,195,950 3,372,758 5,006,372 6,951,489 27,387,125Design and Monitoring 108,945 167,995 84,026 153,057 154,105 266,650 934,778PUSAT (Central DGH) 38,219 190,377 950,570 1,139,396 254,068 538,522 3,111,152Others 42,101 17,187 237,150 296,438Total 2,443,179 3,956,759 7,799,930 4,467,714 4,949,512 7,309,313 9,806,258 40,732,665
Share of Budget Category 2001 2002 2003 2004 2005 2006 2007 AverageRoad Maintenance 26.2% 32.3% 11.3% 21.9% 22.8% 20.3% 26.7% 22.1%Road Betterment and New Construction 67.8% 58.6% 75.5% 49.2% 68.1% 68.5% 70.9% 67.2%Design and Monitoring 4.5% 4.2% 1.1% 3.4% 3.1% 3.6% 0.0% 2.3%PUSAT (Central DGH) 1.6% 4.8% 12.2% 25.5% 5.1% 7.4% 0.0% 7.6%Others 0.0% 0.0% 0.0% 0.0% 0.9% 0.2% 2.4% 0.7%Total 100.0% 100.0% 100.0% 100.0% 100.0% 100.0% 100.0% 100.0%
Share of Sulawesi2001 2002 2003 2004 2005 2006 2007 Average
Indonesia 100.0% 100.0% 100.0% 100.0% 100.0% 100.0% 100.0% 100.0%Sulawesi Total 11.3% 15.3% 6.4% 14.7% 11.1% 12.3% 11.7% 11.4%Sulawesi Utara (North) 3.8% 4.5% 1.6% 3.0% 2.1% 2.4% 2.6% 2.6%Gorontalo 1.3% 0.8% 1.5% 1.7% 1.3% 1.0% 1.3%Sulawesi Tengah (Central) 2.6% 2.7% 1.4% 3.5% 2.5% 1.9% 1.5% 2.1%Sulawesi Selatan 2.8% 4.1% 1.3% 3.5% 2.5% 3.4% 3.8% 3.0%Sulawesi Barat (West) 1.2% 1.2% 1.2%Sulawesi Tenggara (South East) 2.1% 2.8% 1.2% 3.1% 2.2% 2.2% 1.7% 2.0%Sulawesi Selatan/Sulawesi Total 24.9% 26.5% 20.9% 24.1% 22.8% 27.3% 32.3% 26.7%
Source: Bina Marga
Budget Allocation
Table 3.5.10 shows the breakdown of the budget categories of the Bina Marga Budget allocated
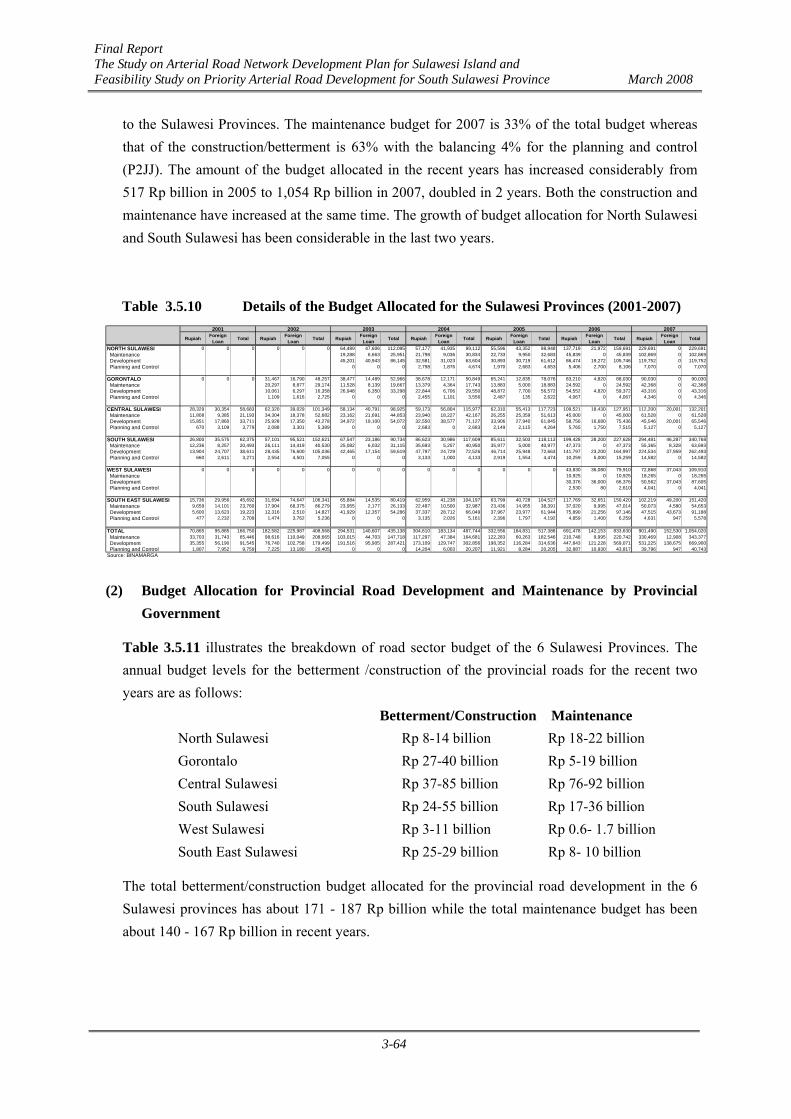
Final Report The Study on Arterial Road Network Development Plan for Sulawesi Island and Feasibility Study on Priority Arterial Road Development for South Sulawesi Province March 2008
3-64
to the Sulawesi Provinces. The maintenance budget for 2007 is 33% of the total budget whereas that of the construction/betterment is 63% with the balancing 4% for the planning and control (P2JJ). The amount of the budget allocated in the recent years has increased considerably from 517 Rp billion in 2005 to 1,054 Rp billion in 2007, doubled in 2 years. Both the construction and maintenance have increased at the same time. The growth of budget allocation for North Sulawesi and South Sulawesi has been considerable in the last two years.
Table 3.5.10 Details of the Budget Allocated for the Sulawesi Provinces (2001-2007) 2001 2002 2003 2004 2005 2006 2007
Rupiah ForeignLoan Total Rupiah Foreign
Loan Total Rupiah ForeignLoan Total Rupiah Foreign
Loan Total Rupiah ForeignLoan Total Rupiah Foreign
Loan Total Rupiah ForeignLoan Total
NORTH SULAWESI 0 0 0 0 0 0 64,489 47,606 112,095 57,177 41,935 99,112 55,596 43,352 98,948 137,719 21,972 159,691 229,691 0 229,691 Maintenance 19,288 6,663 25,951 21,798 9,036 30,834 22,733 9,950 32,683 45,839 0 45,839 102,869 0 102,869 Development 45,201 40,943 86,145 32,581 31,023 63,604 30,893 30,719 61,612 86,474 19,272 105,746 119,752 0 119,752 Planning and Control 0 0 0 2,798 1,876 4,674 1,970 2,683 4,653 5,406 2,700 8,106 7,070 0 7,070
GORONTALO 0 0 0 31,467 16,790 48,257 38,477 14,489 52,966 38,678 12,171 50,849 65,241 12,835 78,076 83,210 4,820 88,030 90,030 0 90,030 Maintenance 20,297 8,877 29,174 11,528 8,139 19,667 13,379 4,364 17,743 13,883 5,000 18,883 24,592 0 24,592 42,368 0 42,368 Development 10,061 6,297 16,358 26,948 6,350 33,298 22,844 6,706 29,550 48,872 7,700 56,572 54,552 4,820 59,372 43,316 0 43,316 Planning and Control 1,109 1,616 2,725 0 0 0 2,455 1,101 3,556 2,487 135 2,622 4,067 0 4,067 4,346 0 4,346
CENTRAL SULAWESI 28,329 30,354 58,683 62,320 39,029 101,349 58,134 40,791 98,925 59,173 56,804 115,977 62,310 55,413 117,723 109,521 18,430 127,951 112,200 20,001 132,201 Maintenance 11,808 9,385 21,193 34,304 18,378 52,682 23,162 21,691 44,853 23,940 18,227 42,167 26,255 25,359 51,613 45,000 0 45,000 61,528 0 61,528 Development 15,851 17,860 33,711 25,928 17,350 43,278 34,972 19,100 54,072 32,550 38,577 71,127 33,906 27,940 61,845 58,756 16,680 75,436 45,546 20,001 65,546 Planning and Control 670 3,109 3,779 2,088 3,301 5,389 0 0 0 2,683 0 2,683 2,149 2,115 4,264 5,765 1,750 7,515 5,127 0 5,127
SOUTH SULAWESI 26,800 35,575 62,375 57,101 95,521 152,621 67,547 23,186 90,734 86,623 30,986 117,609 85,611 32,503 118,113 199,428 28,200 227,628 294,481 46,287 340,768 Maintenance 12,236 8,257 20,493 26,111 14,419 40,530 25,082 6,032 31,115 35,693 5,257 40,950 35,977 5,000 40,977 47,373 0 47,373 55,365 8,328 63,693 Development 13,904 24,707 38,611 28,435 76,600 105,036 42,465 17,154 59,619 47,797 24,729 72,526 46,714 25,948 72,663 141,797 23,200 164,997 224,534 37,959 262,493 Planning and Control 660 2,611 3,271 2,554 4,501 7,055 0 0 0 3,133 1,000 4,133 2,919 1,554 4,474 10,259 5,000 15,259 14,582 0 14,582
WEST SULAWESI 0 0 0 0 0 0 0 0 0 0 0 0 0 0 0 43,830 36,080 79,910 72,868 37,043 109,910 Maintenance 10,925 0 10,925 18,265 0 18,265 Development 30,376 36,000 66,376 50,562 37,043 87,605 Planning and Control 2,530 80 2,610 4,041 0 4,041
SOUTH EAST SULAWESI 15,736 29,956 45,692 31,694 74,647 106,341 65,884 14,535 80,419 62,959 41,238 104,197 63,799 40,728 104,527 117,769 32,651 150,420 102,219 49,200 151,420 Maintenance 9,659 14,101 23,760 17,904 68,375 86,279 23,955 2,177 26,133 22,487 10,500 32,987 23,436 14,955 38,391 37,020 9,995 47,014 50,073 4,580 54,653 Development 5,600 13,623 19,223 12,316 2,510 14,827 41,929 12,357 54,286 37,337 28,712 66,049 37,967 23,977 61,944 75,890 21,256 97,146 47,515 43,673 91,188 Planning and Control 477 2,232 2,709 1,474 3,762 5,236 0 0 0 3,135 2,026 5,161 2,396 1,797 4,192 4,859 1,400 6,259 4,631 947 5,578
TOTAL 70,865 95,885 166,750 182,582 225,987 408,568 294,531 140,607 435,138 304,610 183,134 487,744 332,556 184,831 517,388 691,478 142,153 833,630 901,490 152,530 1,054,020 Maintenance 33,703 31,743 65,446 98,616 110,049 208,665 103,015 44,703 147,718 117,297 47,384 164,681 122,283 60,263 182,546 210,748 9,995 220,742 330,469 12,908 343,377 Development 35,355 56,190 91,545 76,740 102,758 179,499 191,516 95,905 287,421 173,109 129,747 302,856 198,352 116,284 314,636 447,843 121,228 569,071 531,225 138,675 669,900 Planning and Control 1,807 7,952 9,759 7,225 13,180 20,405 0 0 0 14,204 6,003 20,207 11,921 8,284 20,205 32,887 10,930 43,817 39,796 947 40,743Source: BINAMARGA
(2) Budget Allocation for Provincial Road Development and Maintenance by Provincial Government
Table 3.5.11 illustrates the breakdown of road sector budget of the 6 Sulawesi Provinces. The annual budget levels for the betterment /construction of the provincial roads for the recent two years are as follows:
Betterment/Construction Maintenance North Sulawesi Rp 8-14 billion Rp 18-22 billion Gorontalo Rp 27-40 billion Rp 5-19 billion
Central Sulawesi Rp 37-85 billion Rp 76-92 billion South Sulawesi Rp 24-55 billion Rp 17-36 billion West Sulawesi Rp 3-11 billion Rp 0.6- 1.7 billion South East Sulawesi Rp 25-29 billion Rp 8- 10 billion
The total betterment/construction budget allocated for the provincial road development in the 6 Sulawesi provinces has about 171 - 187 Rp billion while the total maintenance budget has been about 140 - 167 Rp billion in recent years.

Final Report The Study on Arterial Road Network Development Plan for Sulawesi Island and Feasibility Study on Priority Arterial Road Development for South Sulawesi Province March 2008
3-65
Table 3.5.11 Road Sector Budget of 6 Provinces of Sulawesi Region
(Mil. Rp)2002 2003 2004 2005 2006 2007
NORTH SULAWESI Maintenance 3,132 12,591 7,818 7,068 18,643 22,489 Development 11,058 9,843 0 3,425 8,172 13,953 Total 14,190 22,434 7,818 10,493 26,815 36,442GORONTALO Maintenance 65,000 13,949 3,475 9,614 19,370 5,396 Development 17,637 5,630 4,086 23,887 27,166 40,987 Total 82,637 19,579 7,561 33,501 46,536 46,383CENTRAL SULAWESI Maintenance 5,332 8,670 7,928 12,221 25,196 16,508 Development 3,071 6,556 9,576 9,582 13,698 21,147 Total 8,403 15,226 17,504 21,803 38,894 37,655SOUTH SULAWESI Maintenance 17,965 22,293 31,501 15,217 17,214 36,350 Development 13,098 8,724 9,341 13,341 23,739 55,030 Total 31,064 31,018 40,842 28,559 40,953 91,380WEST SULAWESI Maintenance 1,700 600 Development 2,600 10,537 Total 0 0 0 0 4,300 11,137SOUTH EAST SULAWESI Maintenance 16,980 13,970 3,640 2,325 7,552 10,250 Development 11,320 11,430 1,560 1,712 24,751 29,140 Total 28,300 25,400 5,200 4,037 32,303 39,390TOTAL Maintenance 108,410 71,473 54,362 46,446 89,675 91,593 Development 56,185 42,184 24,563 51,948 100,127 170,794 Total 164,594 113,657 78,925 98,394 189,802 262,387Source: Sulawesi Provinces
Table 3.5.12 shows the revenue and expenditure of 6 Sulawesi provinces with the road sector expenditure of corresponding year. The total revenue of the 6 provinces has been growing at the average annual growth rate of 17% to 20%. On the other hand the road sector expenditure has not been growing as rapidly as the revenue with its average share being about 10% of the total revenue.
Table 3.5.12 Revenue and Expenditure of 6 Provinces of Sulawesi Region
Rp. Billion Ratio Rp. Billion Ratio Rp. Billion Ratio Rp. Billion Ratio Rp. Billion Ratio Rp. Billion Ratio
1,930.8 100% 2,222.4 100% 2,339.9 100% 2,842.2 100% 4,041.4 100% 4,384.3 100%
780.4 40% 804.1 36% 899.9 38% 1,199.5 42% 1,295.8 32% 1,406.2 32%
Carry on from Previous Year 226.2 12% 60.3 3% 30.1 1% 48.4 2% 619.3 15% 0.0 0%
Local Taxes 434.5 23% 551.6 25% 680.8 29% 930.4 33% 501.6 12% 1,202.1 27%
Local User Charges 49.2 3% 72.9 3% 76.7 3% 83.8 3% 80.1 2% 93.7 2%
Local Gov. Owned Company Profit 25.9 1% 65.8 3% 48.6 2% 81.9 3% 45.5 1% 51.8 1%
Others 44.6 2% 53.5 2% 63.7 3% 54.9 2% 49.3 1% 58.6 1%
1,150.3 60% 1,418.3 64% 1,440.1 62% 1,642.7 58% 2,745.5 68% 2,978.1 68%
Tax Revenue Sharing 105.6 5% 166.8 8% 163.7 7% 204.3 7% 237.6 6% 297.5 7%
Non Tax Revenue Sharing 18.5 1% 1.3 0% 1.5 0% 78.4 3% 0.8 0% 0.5 0%
General Allocation Fund (DAU) 1,023.2 53% 1,168.1 53% 1,225.4 52% 1,317.5 46% 2,488.5 62% 2,484.3 57%
Special Allocation Fund (DAK) 0.0 0% 50.3 2% 0.0 0% 0.1 0% 0.2 0% 97.4 2%
Others 3.0 0% 31.7 1% 49.5 2% 42.4 1% 18.5 0% 98.4 2%
1,842.8 100% 2,164.1 100% 2,398.2 100% 2,421.2 100% 3,453.3 100% 3,629.5 100%
1,123.8 61% 1,064.4 49% 1,636.6 68% 1,534.8 63% 2,124.1 62% 1,946.1 54%
719.0 39% 1,099.6 51% 761.6 32% 886.4 37% 1,329.2 38% 1,683.4 46%
(1) Raod Sector Expenditure 164.6 9% 113.7 5% 78.9 3% 98.4 4% 189.8 5% 262.4 7%
a. Betterment and Construction 56.2 3% 42.2 2% 24.6 1% 51.9 2% 100.1 3% 170.8 5%
b. Routine and Periodic Maintenance 108.4 6% 71.5 3% 54.4 2% 46.4 2% 89.7 3% 91.6 3%
Note (1): There has been the change of statistical format during 2002 - 2004 for all of the 6 provinces
2007Budget Item
2002 2003 2004
A. Revenue
2005 2006
1. Local Own Revenue (PAD)
2. Intergovernmental Transfer
B. Expenditure1. Recurrent Expenditure
2. Development/Capital Expenditure(1)
Source: Provincial Statistics
C. Fiscal Balance (A-B)D. Deficit Financing
1. Loan,etc
2. Repayment,etc

Final Report The Study on Arterial Road Network Development Plan for Sulawesi Island and Feasibility Study on Priority Arterial Road Development for South Sulawesi Province March 2008
3-66
3.6 Transport Problems and Issues in Sulawesi
3.6.1 Transport Sector and Road Subsector
(1) Dominance of Road Transport
Indonesia’s transport sector is generally dominated by road transport. Road transport accounts for more than 80% for passengers and 90% for freight. This is closely related to the concentrated population in Java Island particularly in Jakarta. It has been a national strategy to disperse population from Java to less populated regions to attain a balanced development. If this strategy is materialized, air transportation will take a more important role in interisland passenger transport, rail transport in intra-Java passenger transport, and coastal shipping in inter-island freight transport.
In Sulawesi, this issue seems less significant because it is located in eastern Indonesia which is assumed to be one of the densely populated areas and considered a center of economic activities. Nevertheless, it is essential for Sulawesi to realize more balanced modal shares. At present, the modal share of road transport in Sulawesi for freight is estimated at 64% (HLRIP-II), which is considerably lower than the national average of 92%.
(2) Transport Sector Management
The decentralization process in the management of the transport sector is ongoing. Since Law No. 22 and No. 25 were enacted in 1999, the responsibilities over sector management and project implementation have been transferred from the central government to local governments. Although the efficiency and capacity of the sector have been partially improved by deregulation (such as the open-sky policy in the air transport subsector), the quality of sector management has not improved. For instance, the responsibility for the development and maintenance of national roads previously shouldered by Bina Marga were transferred to the Ministry of Settlement and Regional Infrastructure (MSRI or Kimpraswil). In 1999 it was returned to Bina Marga again. The process of decentralization is not moving forward as seen in this example. It even caused some confusion in the road transport sector coupled with other reasons such as lack of capacity of local officials to shoulder the transferred responsibilities and to coordinate among central/local government agencies.
In Sulawesi, national roads are planned, developed, and managed by the National Road Implementation Executive Unit VI (Kepala Balai Besar Pelaksanaan Jalan Nasional–VI) which is under Bina Marga. Since its establishment in January 2007, it has not fully functioned yet. West Sulawesi is a new province, separated in 2004 from South Sulawesi, and has yet to prepare for provincial road management. As such, many things have to be reorganized and rectified in Sulawesi in relation to the management of the road transport sector. The road information system, including the IRMS which is the basis for planning and monitoring, should be reconstructed in accordance with the changes in administration and classification.
3.6.2 Road Infrastructure

Final Report The Study on Arterial Road Network Development Plan for Sulawesi Island and Feasibility Study on Priority Arterial Road Development for South Sulawesi Province March 2008
3-67
(1) Inadequacy of Road Infrastructure
Sulawesi’s road infrastructure is underdeveloped. Although its road density is slightly higher than the national average, the level is still far from satisfactory. Most of the arterial roads have 2 narrow lanes, while road conditions tend to be bad in remote places. Alignment is generally poor and winding in hilly/mountainous areas. The long rugged coastline of Sulawesi also makes road alignment long and winding with frequent rises and falls. Table 3.5.1 reveals how extreme detours should be made when traveling between provincial capital cities through existing roads that are winding due to a steep topography and complex coastlines. When the ratio “A/B” is 2.0, it means that road users have to run twice the distance of a straight route. This problem can be solved by improving the alignment of existing roads and developing new roads. However, its effect is only to a certain extent as the severe topographic constraints cannot be easily overcome. The more realistic solution would be a more positive usage of ferries and the realignment of extremely curved sections of existing arterial roads. Particularly for Kendari, the capital city of Southeast Sulawesi, a nautical highway system could be proposed using interpeninsular ferries to improve its accessibility to other provinces.

Final Report The Study on Arterial Road Network Development Plan for Sulawesi Island and Feasibility Study on Priority Arterial Road Development for South Sulawesi Province March 2008
3-68
Table 3.6.1 Actual Road Distances and Crow-Fly Distances between Provincial Capital Cities Actual Distance Crow-fly Distance Ratio
(km) - A (km) - B A/BManado - Gorontalo 416 226 1.84Manado - Palu 963 619 1.56Manado - Mamuju 1356 801 1.69Manado - Makassar 1800 949 1.90Manado - Kendari 1872 685 2.73Gorontalo - Palu 617 395 1.56Gorontalo - Mamuju 1010 582 1.74Gorontalo - Makassar 1454 746 1.95Gorontalo - Kendari 1421 504 2.82Palu - Mamuju 393 218 1.80Palu - Makassar 837 468 1.79Palu - Kendari 1007 445 2.26Mamuju - Makassar 444 276 1.61Mamuju - kendari 1009 419 2.41Makassar - Kendari 1057 361 2.93Source: JICA Study Team's estimate based on IRMS.
Another important fact in Sulawesi is that the poorer the area, the scarcer the road becomes.. This does not necessarily mean, however, that underdevelopment of roads is the cause of poverty. Since roads have been historically developed along with the expansion of economic activities, the fact is that economic activities require roads and road development enables economic growth. Thus road development should be implemented in close coordination with regional development plans.
Sulawesi needs to develop its economy to be the center of eastern Indonesia and road infrastructure should be provided to comply with the economic, social, and industrial development plans.
(2) Toll Road and Private Sector Participation
The central government seems to be taking on the task of sector management more than directly involving itself in planning, implementation, and daily operation of roads due probably to lack of budget and other underlying reasons. For roads where significant traffic is foreseen, private sector participation naturally should be pursued. Even if traffic demand is not so large as to produce profits sufficient to the private sector, PPP (public-private partnership) may be applied with a government subsidy shouldering part of the project cost.
In the current legal/institutional framework, the central government conducts an open bidding and selects a private proponent for a toll road project where the proponent forms a joint venture company with PT. Jasa Marga. Since PPP projects are hardly implemented recently in Indonesia, current discussions are held regarding the legal/institutional scheme of PFI/PPP project and the status/role of PT. Jasa Marga.
In Sulawesi, some toll road projects are proposed using PFI/PPP scheme, such as the Manado-Bitung Toll Road Project. Financial feasibility has not been tested yet, and the project may require considerable government subsidy. Hence, this should be a PPP project which needs scrutiny

Final Report The Study on Arterial Road Network Development Plan for Sulawesi Island and Feasibility Study on Priority Arterial Road Development for South Sulawesi Province March 2008
3-69
under the current legal/institutional system. Generally speaking, 100% privately financed road projects would be possible only in and near the city area such as Makassar and Manado. PPP schemes could be applied more widely depending on the ongoing institutional reform.
3.6.3 Environment and Traffic Safety
(1) Environmental Issues
Regional development and environmental protection generally conflict with each other. This problem is also true in the road transport subsector. Fortunately, however, most road projects likely to be proposed will be on the improvement of existing roads, such as minor upgrading (partial widening and realignment), rehabilitation, and maintenance. Their environmental and social impacts, particularly of resident relocation and resettlement would be minimal.
However, there should certainly be negative impacts attributed to road projects. These impacts should be minimized through better planning, design, implementation, and maintenance. The cost needed to carry out the measures on environmental protection should be reflected in the project evaluation.
(2) Traffic Safety
Table 3.5.2 summarizes the traffic accident statistics of southeast countries. In terms of the number of deaths per 1,000 population, Indonesia received an average ranking, while Malaysia, Thailand, and Vietnam showed higher death rates. However, Singapore’s rate is nearly a third of Indonesia, and if high vehicle ownership in Singapore is taken into account, Indonesia is far more dangerous than Singapore. Moreover the number of accidents is quickly increasing in Indonesia according to Directorat Jenderal Perhubungan Darat (2006).
Although accident statistics are only partially available in Sulawesi, records show that South Sulawesi registered 676 deaths due to traffic accidents in 2005. This is equivalent to 0.09 deaths per 1,000 population, which is significantly lower than the national average of 0.141. But this is not good news for Sulawesi, because accident statistics may have been underreported as revealed in national police statistics.

Final Report The Study on Arterial Road Network Development Plan for Sulawesi Island and Feasibility Study on Priority Arterial Road Development for South Sulawesi Province March 2008
3-70
Table 3.6.2 Road Accident Deaths and Injuries in Southeast Asia, 2003
Population No. of Deaths(estimated)
(000) Deaths Injuries Deaths Injuries per 1000 Pop.
Brunei Darussalam 358 28 645 28 1273 0.078Cambodia 13,531 824 6329 1017 20340 0.075Indonesia 214,674 8781 13941 30464 2550000 0.141Lao People's 5,661 415 6231 581 18690 0.102 Democratic RepublicMalaysia 24,437 6282 46420 6282 46420 0.257Myanmar 49,463 1308 9299 1308 45780 0.026Philippines 80,166 995 6790 9000 493970 0.112Singapore 4,185 211 7975 211 9072 0.05Thailand 63,145 13116 69313 13116 1529034 0.207Vietnam 81,314 11319 20400 13186 30999 0.162Total Asean 536,934 43259 187343 75193 4745578 0.14Source : Asean
Country Estimated Police Reported
In the future, when traffic volume will be larger, there is a strong possibility that the number of accidents will dramatically increase. Long-distance vehicles run quite fast on inter-city arteries paying no attention to local residents and villages located along the roads particularly in Sulawesi. This problem should be taken seriously and proper countermeasures should be proposed.
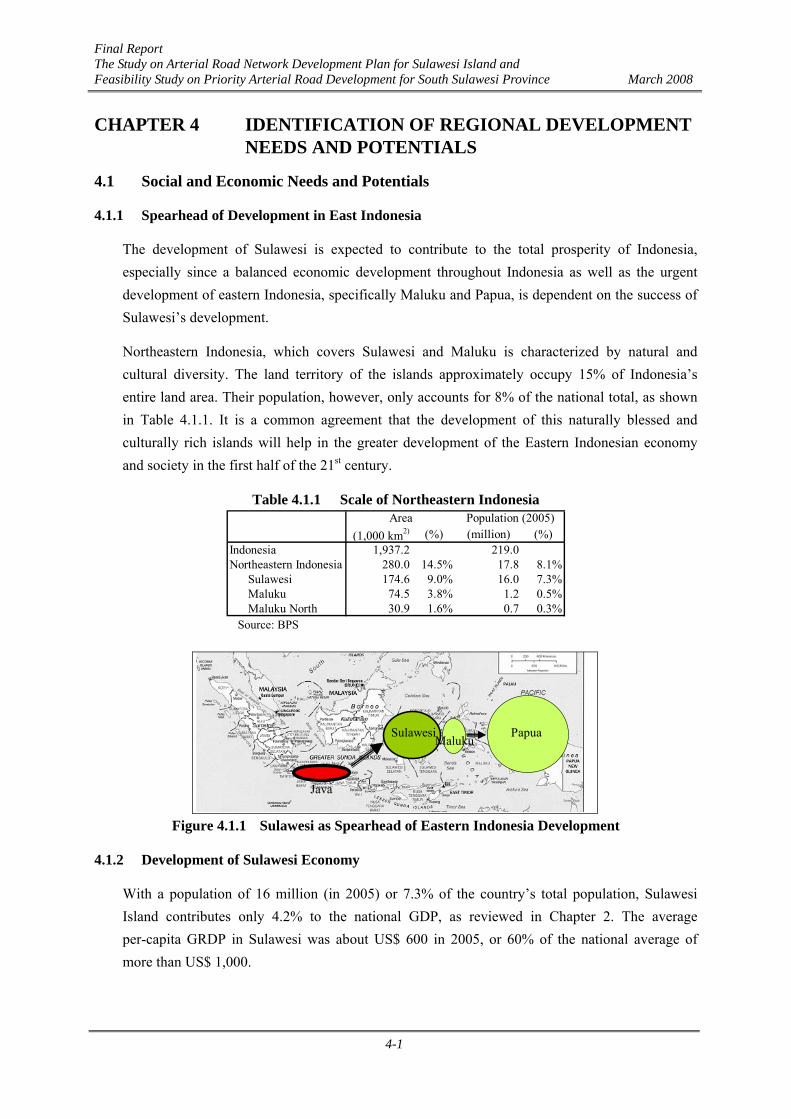
Final Report The Study on Arterial Road Network Development Plan for Sulawesi Island and Feasibility Study on Priority Arterial Road Development for South Sulawesi Province March 2008
4-1
CHAPTER 4 IDENTIFICATION OF REGIONAL DEVELOPMENT NEEDS AND POTENTIALS
4.1 Social and Economic Needs and Potentials
4.1.1 Spearhead of Development in East Indonesia
The development of Sulawesi is expected to contribute to the total prosperity of Indonesia, especially since a balanced economic development throughout Indonesia as well as the urgent development of eastern Indonesia, specifically Maluku and Papua, is dependent on the success of Sulawesi’s development.
Northeastern Indonesia, which covers Sulawesi and Maluku is characterized by natural and cultural diversity. The land territory of the islands approximately occupy 15% of Indonesia’s entire land area. Their population, however, only accounts for 8% of the national total, as shown in Table 4.1.1. It is a common agreement that the development of this naturally blessed and culturally rich islands will help in the greater development of the Eastern Indonesian economy and society in the first half of the 21st century.
Table 4.1.1 Scale of Northeastern Indonesia
(1,000 km2) (%) (million) (%)Indonesia 1,937.2 219.0Northeastern Indonesia 280.0 14.5% 17.8 8.1%
Sulawesi 174.6 9.0% 16.0 7.3%Maluku 74.5 3.8% 1.2 0.5%Maluku North 30.9 1.6% 0.7 0.3%
Area Population (2005)
Source: BPS
Figure 4.1.1 Sulawesi as Spearhead of Eastern Indonesia Development
4.1.2 Development of Sulawesi Economy
With a population of 16 million (in 2005) or 7.3% of the country’s total population, Sulawesi Island contributes only 4.2% to the national GDP, as reviewed in Chapter 2. The average per-capita GRDP in Sulawesi was about US$ 600 in 2005, or 60% of the national average of more than US$ 1,000.
Java
Sulawesi PapuaMaluku
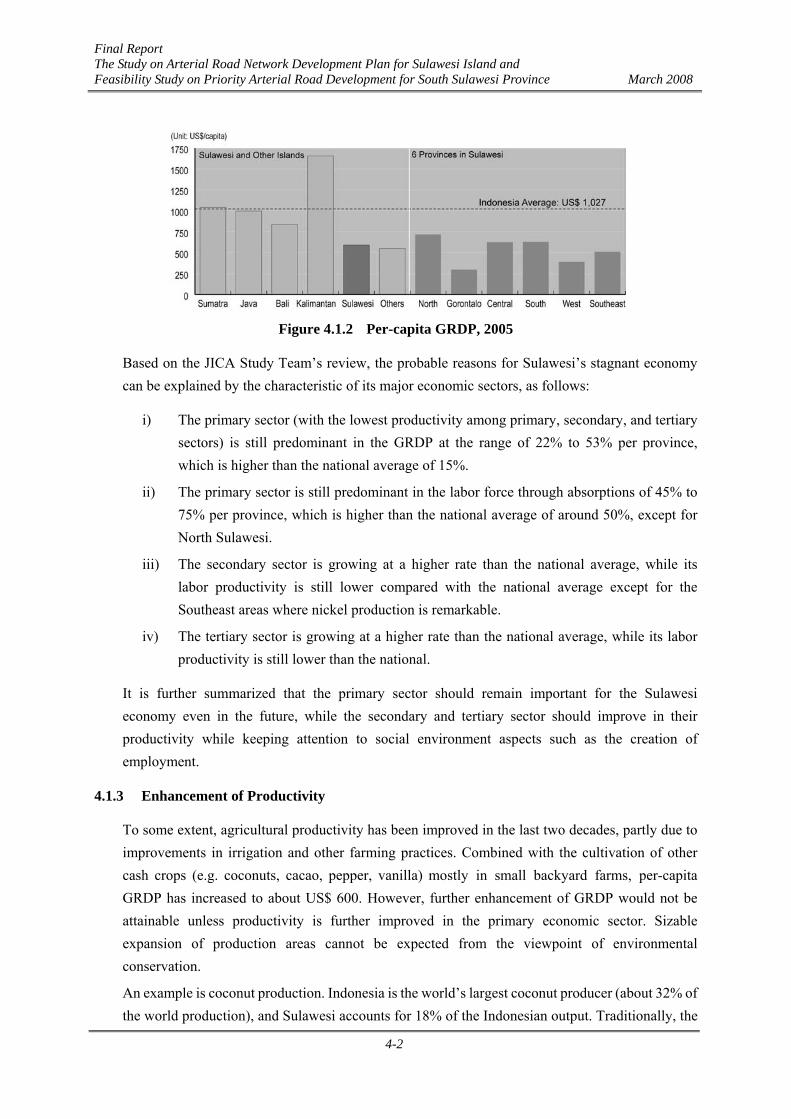
Final Report The Study on Arterial Road Network Development Plan for Sulawesi Island and Feasibility Study on Priority Arterial Road Development for South Sulawesi Province March 2008
4-2
Figure 4.1.2 Per-capita GRDP, 2005
Based on the JICA Study Team’s review, the probable reasons for Sulawesi’s stagnant economy can be explained by the characteristic of its major economic sectors, as follows:
i) The primary sector (with the lowest productivity among primary, secondary, and tertiary sectors) is still predominant in the GRDP at the range of 22% to 53% per province, which is higher than the national average of 15%.
ii) The primary sector is still predominant in the labor force through absorptions of 45% to 75% per province, which is higher than the national average of around 50%, except for North Sulawesi.
iii) The secondary sector is growing at a higher rate than the national average, while its labor productivity is still lower compared with the national average except for the Southeast areas where nickel production is remarkable.
iv) The tertiary sector is growing at a higher rate than the national average, while its labor productivity is still lower than the national.
It is further summarized that the primary sector should remain important for the Sulawesi economy even in the future, while the secondary and tertiary sector should improve in their productivity while keeping attention to social environment aspects such as the creation of employment.
4.1.3 Enhancement of Productivity
To some extent, agricultural productivity has been improved in the last two decades, partly due to improvements in irrigation and other farming practices. Combined with the cultivation of other cash crops (e.g. coconuts, cacao, pepper, vanilla) mostly in small backyard farms, per-capita GRDP has increased to about US$ 600. However, further enhancement of GRDP would not be attainable unless productivity is further improved in the primary economic sector. Sizable expansion of production areas cannot be expected from the viewpoint of environmental conservation.
An example is coconut production. Indonesia is the world’s largest coconut producer (about 32% of the world production), and Sulawesi accounts for 18% of the Indonesian output. Traditionally, the
Final Report The Study on Arterial Road Network Development Plan for Sulawesi Island and Feasibility Study on Priority Arterial Road Development for South Sulawesi Province March 2008
4-3
major coconut production centers in Sulawesi are North Sulawesi and Central Sulawesi. However, the coconut trees in these provinces are already old, tall, and less productive. The coconut processing industries in North Sulawesi collect raw materials from other provinces and the Maluku islands. Likewise, cacao is primarily based on household cultivation and most cacao trees are overaged with reduced productivity. Cultivation of these cash crops has not been well maintained enough to keep their productivity high and to expand their production in a sustainable manner. The competitiveness of these traditional products has diminished in recent years.
4.1.4 Improvement of Quality and Value
In addition to decreasing productivity, the quality of major cash crops has degraded or has become uneven due to improper cultivation practices . For instance, cacao production has primarily become dependent on household production which gives less attention to the control of diseases and fermentation before they are marketed.
Good practices can be learned from the excellent coffee cultivation in Toraja, South Sulawesi. The investor (TOARCO) has operated its own coffee plantation, extending guidance services to the independent coffee growers near its estate in order to improve and maintain the quality of the products for marketing, thereby establishing a reputable brand name. Although strenuous efforts are required, such a production process should better be replicated in other products to improve product quality and gain more income.
Most Sulawesi products in the primary and secondary sectors are transported and marketed in Java, or exported as raw materials with minimal processing in Sulawesi, resulting in low levels of value added in the region. For instance, since most cacao is exported as beans, their processing into cacao butter and powder has not increased in Sulawesi. Corns are also exported without local processing along with marine products such as fishes, seaweeds, sea cucumber, etc., which are also marketed without local processing.
Since the expansion of cultivation areas in Sulawesi is less expected and employment opportunities must be expanded in view of growing urbanization, Sulawesi products should be processed to the maximum extent in order to help attain sustainable development.
Some of the key issues that need to be addressed therefore are: (1) attracting investors into the processing industry, (2) initiating programs that would attract Java-based firms to expand or shift operations to Sulawesi, and (3) encouraging foreign-based investors to jointly invest in local processing of Sulawesi products. In this context, improvements in the investment environment in Sulawesi will play a vital role.
4.1.5 Paradigm Shift to Sustainable Development
As mentioned above, the per-capita Sulawesi GRDP is currently at the US$ 600 level, or 60% of the national average. To catch up with the national average of more than US$ 1,000, conventional approaches in production and processing would not be sufficient., thus requiring a paradigm shift.
This paradigm shift can be made possible through the improvement of productivity and the

Final Report The Study on Arterial Road Network Development Plan for Sulawesi Island and Feasibility Study on Priority Arterial Road Development for South Sulawesi Province March 2008
4-4
quality of Sulawesi’s products, resulting in enhanced product competitiveness in the domestic and international markets. An example is a shift from household cultivation of cash crops to the combination of household and plantation cultivation as in the case of Toraja TOARCO coffee. To this end, the investment environment for domestic and international investors in Sulawesi should be improved. Otherwise, such a paradigm shift could be hardly attainable.
Figure 4.1.3 Growth Target of Per-capita GRDP
4.1.6 Environmental Protection and Conservation
To a certain extent, Sulawesi’s natural environment has degraded through accelerated deforestation, urbanization, and other economic activities. Further deterioration of the environment should be prevented to the maximum extent.
In order to balance environmental protection and economic development, the principal issue is creating a cycle-oriented region/society in Sulawesi, lowering the environmental loads in every activity, including improvements in the transportation network. Instead of degrading limited natural resources, efforts should be made to promote renewable energy sources, renewal of products, and maximum utilization of unused materials. It may be that GRDP growth rates would not be high enough under a cycle-oriented economy compared with a resource-depriving economy. However, it will be more beneficial to the people of Sulawesi if they accept that their living environment would be more comfortable for generations to come should they follow a cycle-oriented economy.
4.1.7 Development Plan by Province
The JICA Study Team visited each province to consult and discuss existing provincial plans with the BAPPEDA and other provincial authorities. Through interviews with the BAPPEDA and a review of these plans, the focal points of the development strategies are identified and summarized, as follows:

Final Report The Study on Arterial Road Network Development Plan for Sulawesi Island and Feasibility Study on Priority Arterial Road Development for South Sulawesi Province March 2008
4-5
Table 4.1.2 Summary Results of Interviews with BAPPEDA
Province Major Product/Industry
Regional Development Plan
Priority Road & Infrastructure Development
South Sulawesi
Nickel, Cacao, Palm Oil, Coffee, Vegetable, Vanilla Processing, Manufacture of Cement, Food, Etc.
Maminasata Regional devt. Parepare KAPET
- Roads improvement/ development in Mamminasata
- Maros-Parepare-West Sulawesi Province road- Makassar- Maros- Watampone road - Makassar- Bulukumba- Plau Selayar road via
ferry - Parepare- Palopo- Malili road
North Sulawesi
International Tourism Destination, Gold, Pearls, Coconut, Vanilla, Fish Meal, Coconut Oil/Coir, Vanilla Processing
- Manado-Bitung-Likpang Triangle zone dev.
- Amurang new port FEZ - Bitung KAPET
- Manado – Bitung toll road Note: Southern coastal road is under
construction by ADB & AusAID - Shortage of power supply despite of Tanggari
hydro power & geo-thermal plant (20MW) near Tondano
Gorontalo Corn, Coconut, Fish -Great Gorontalo Development Plan - Kwandang Area Development Plan
- Gorontalo city bypass - Northern coastal road - Bologtio- Limgato North-South road (Long
term) - Improvement of Anggrek port (Kwandang) - Expansion of existing coal power plant (40
MW) + new coal power plant (20MW) Southeast Sulawesi
Nickel, Sand/Rock, Asphalt, Cacao, Cashew Nuts, Fish Products (tuna, canned fish in Buton Island)
Kendari-Kolaka KAPET - Kolaka- Malili national road - North-bound coastal road from Kendari to
Central Sulawesi - Baubau – Labuan road in Buton Island - Lasolo River basin development (electricity,
irrigation) West Sulawesi
Palm Oil, Cacao, Coconut, Coffee, Orange
Cyber water front city (new Provincial Capital in Mamuju)
- West Coast Trans Sulawesi Highway up to Palu
- Connection road from Mamuju to Sabbang/Traja area in South Sulawesi Province
- Connection road from Mamuju to Kab. Mamasa
- Port expansion for shipping to Kalimantan (Vegetable, rice, pepper, cow)
- Expansion of the airport near Mamuju (1,200m→2,100m, long term)
- Hydro power development to supplement power shortage
Central Sulawesi
Coconut, Cacao, Coffee, Clove, Wood, Construction Materials
Luwuk KAPET -Kolonodale-Tokala near Morowali reserve forest
4.1.8 Potential Resources
Based on a review of the existing plans and available information, the JICA Study Team came up with a distribution of the islands potential resources in agriculture, fishery and mining, as illustrated in Figure 4.1.4.
In addition to conventional resource development, some technologies have to be mobilized to create innovative approaches to development (e.g. biological technologies) so that development plans are cycle-oriented and their environmental loads are minimized.

Final Report The Study on Arterial Road Network Development Plan for Sulawesi Island and Feasibility Study on Priority Arterial Road Development for South Sulawesi Province March 2008
4-6
Figure 4.1.4 Prospective Resources/Industries
4.2 Industrial Development Needs and Potentialities in Sulawesi
As discussed in Chapter 3, the major commodities traded in and exported from Sulawesi are cocoa, coconut oil, fishery products, animal feeds, processed wood, nickel, cement, and others.
The major agricultural commodities, such as cocoa and coconut oil, are typical Sulawesi industries. These commodities have been exported to the international markets without high value-added activities, or in other words, without industrial processing except for traditional preliminary
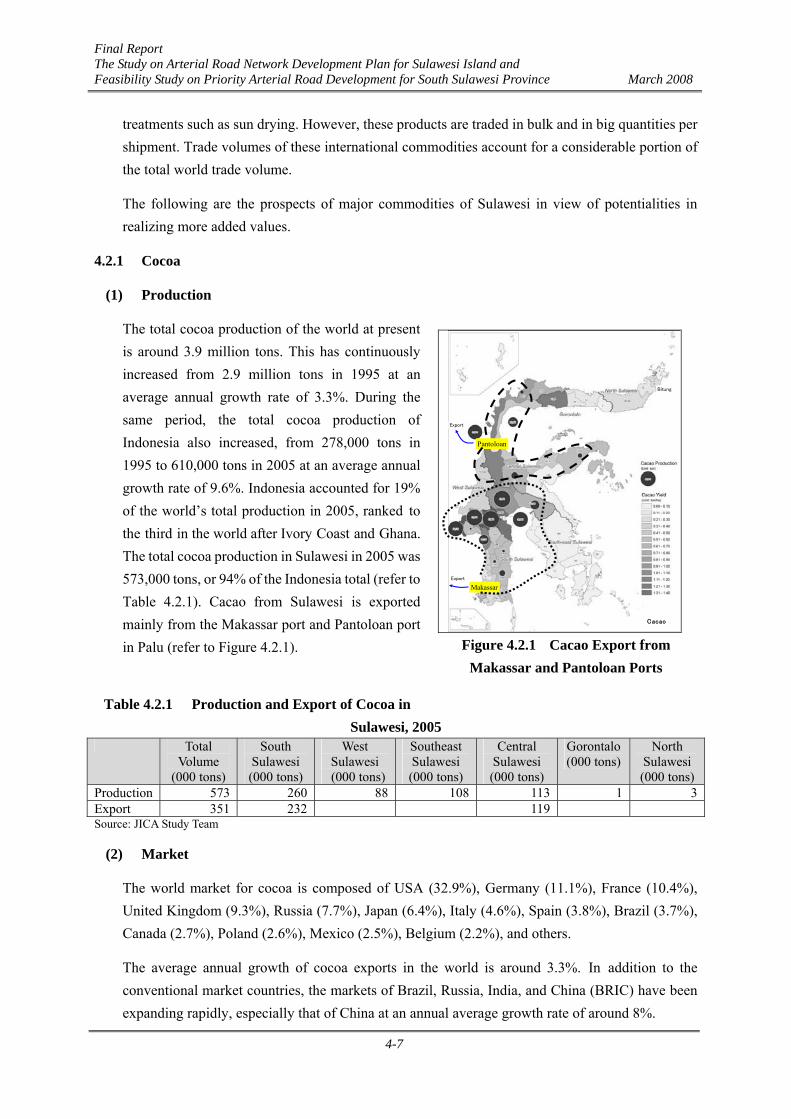
Final Report The Study on Arterial Road Network Development Plan for Sulawesi Island and Feasibility Study on Priority Arterial Road Development for South Sulawesi Province March 2008
4-7
treatments such as sun drying. However, these products are traded in bulk and in big quantities per shipment. Trade volumes of these international commodities account for a considerable portion of the total world trade volume.
The following are the prospects of major commodities of Sulawesi in view of potentialities in realizing more added values.
4.2.1 Cocoa
(1) Production
The total cocoa production of the world at present is around 3.9 million tons. This has continuously increased from 2.9 million tons in 1995 at an average annual growth rate of 3.3%. During the same period, the total cocoa production of Indonesia also increased, from 278,000 tons in 1995 to 610,000 tons in 2005 at an average annual growth rate of 9.6%. Indonesia accounted for 19% of the world’s total production in 2005, ranked to the third in the world after Ivory Coast and Ghana. The total cocoa production in Sulawesi in 2005 was 573,000 tons, or 94% of the Indonesia total (refer to Table 4.2.1). Cacao from Sulawesi is exported mainly from the Makassar port and Pantoloan port in Palu (refer to Figure 4.2.1).
Table 4.2.1 Production and Export of Cocoa in Sulawesi, 2005
Total Volume
(000 tons)
South Sulawesi (000 tons)
West Sulawesi
(000 tons)
Southeast Sulawesi (000 tons)
Central Sulawesi (000 tons)
Gorontalo (000 tons)
North Sulawesi (000 tons)
Production 573 260 88 108 113 1 3Export 351 232 119 Source: JICA Study Team
(2) Market
The world market for cocoa is composed of USA (32.9%), Germany (11.1%), France (10.4%), United Kingdom (9.3%), Russia (7.7%), Japan (6.4%), Italy (4.6%), Spain (3.8%), Brazil (3.7%), Canada (2.7%), Poland (2.6%), Mexico (2.5%), Belgium (2.2%), and others.
The average annual growth of cocoa exports in the world is around 3.3%. In addition to the conventional market countries, the markets of Brazil, Russia, India, and China (BRIC) have been expanding rapidly, especially that of China at an annual average growth rate of around 8%.
Makassar
Pantoloan
Bitung
Cacao
Export
Export
Figure 4.2.1 Cacao Export from
Makassar and Pantoloan Ports

Final Report The Study on Arterial Road Network Development Plan for Sulawesi Island and Feasibility Study on Priority Arterial Road Development for South Sulawesi Province March 2008
4-8
As such, the BRIC market will grow rapidly and form a big consumer market that will include the consumption of cocoa-based products. It is presumed that a considerable portion of finished products are destined for Japan and China. The average chocolate consumption per person in these typical chocolate-consuming countries is around 3.8 kg or around 4.8 kg per person in terms of cocoa beans weight. Since the volume of cocoa beans exported from Sulawesi is around 350,000 tons. Therefore, the number of people that purchased chocolate from Sulawesi’s cocoa is estimated at around 73 million people per year. This means that even if the cocoa production of Sulawesi is doubled from its present level it can easily be consumed by the emerging markets especially that of China. It should be noted that the distance from Sulawesi to China is the shortest among the major destinations of Sulawesi’s cocoa.
(3) Potentialities for Industrialization in Sulawesi
At present, a number of cocoa processing factory are in operation. They process cocoa into cocoa butter, liquor, and powder at KIMA (Kawasan Industri Makassar), north of the Port of Makassar, although their capacity is small and limited. The major processing operation is undertaken by EFFEM (a local company of Mars of USA).
Added value on cocoa beans produced in Sulawesi can be realized by introducing larger-scale processing of cocoa beans into cocoa butter and cocoa powder at the preliminary levels in Sulawesi, including taking into consideration that the cocoa beans grown in Sulawesi cannot be regarded as high-quality beans due to its low flavor. However, such an investment can only be feasible with the introduction of foreign direct investments (FDI) with strong market linkages.
Without such a linkage closely connected to international markets it will not be feasible to run such processing operation in Sulawesi. It will also be risky for an investor as conformity with various international standards needs to be assured for such processed products for the international markets.
The improvement of cocoa bean production in terms of quality and yield can be made through proper technical assistance provided by investing multinational firms, as the quality of raw material is a determinant in the success of their investments and expected returns.
To promote FDIs in cacao processing, legal/tax incentives specific to Sulawesi are inevitable. Moreover, infrastructure, such as power supply and waste treatment plants, should be necessary even in the KIMA area, where cocoa processing factories exist at present. Palu in Central Sulawesi can also be a target area considering that the cacao produced in there and in West Sulawesi is for export.

Final Report The Study on Arterial Road Network Development Plan for Sulawesi Island and Feasibility Study on Priority Arterial Road Development for South Sulawesi Province March 2008
4-9
4.2.2 Coconut Oil
(1) Production
The total crude coconut oil (CNO) production in the world was 3.18 million tons in 2005, down from 3.26 million tons in 2000. Palm oil, palm kernel oil, and rapeseed, on the other hand, expanded their production volumes by 8.9 % per annum. Sunflower, groundnut, and olive had declining production volumes for the same period, while the decline of coconut oil was most significant in both volume and share in the world total.
Indonesia is the second-largest producer of CNO after the Philippines. Indonesia produced CNO at around 848,000 tons in 2005 accounting for 26% of the world total CNO production. Of the total CNO produced, 750,000 tons or 88% is exported. As shown in Figure 4.2.2, the production of CNO in Indonesia is stable, while the Philippines shows a decreasing volume.
CNO production volume in Sulawesi is 290,000 tons/year, or 34% of the Indonesia total, as shown in Table 4.2.2. CNO exports are mainly done through the Bitung port as shown in Figure 4.2.3.
Chnage of CNO Export Volume
0
200
400
600
800
1,000
1,200
1,400
1,600
1,800
2,000
2000 2001 2002 2003 2004 2005
Year
Volu
me
('000
tons
)
Philippines Indonesia Others
Source: Based on data obtained from APCC
Figure 4.2.2 Changes of Export Volumes of CNO in the World
Parepare
Makassar
Pantoloan
Bitung
Coconut
Coconut Oil Export to Ch ina, Holland, USA, etc.
Copra Meal Export to China, Korea, India, etc.
Source: JST
Figure 4.2.3 CNO Export from Bitung Port
Table 4.2.2 Production and Export Volumes of CNO in Sulawesi Total
Volume (000 tons)
South Sulawesi (000 tons)
West Sulawesi
(000 tons)
Southeast Sulawesi (000 tons)
Central Sulawesi (000 tons)
Gorontalo (000 tons)
North Sulawesi (000 tons)
Production 290 31 3 2 16 238Export 290 31 259
Source: JICA Study Team

Final Report The Study on Arterial Road Network Development Plan for Sulawesi Island and Feasibility Study on Priority Arterial Road Development for South Sulawesi Province March 2008
4-10
(2) Market
Changes in the people’s eating habits in the industrialized countries might have caused the decline in coconut oil consumption. The preference for reportedly lighter and less fatty substances, therefore, might further affect CNO consumption and the shift to palm oil.
(3) Potentialities for Industrialization in Sulawesi
In the past 10 years, the production and consumption of bio-diesel has increased sharply at an average growth rate of more than 30% in Europe. The annual total consumption of bio-diesel in the EU has already reached 4 million kiloliters. In 1995, the use of bio-diesel in the EU was almost insignificant, but the experiment of using bio-diesel in commercial sizes has just commenced. Bio-diesel is made of vegetable oil. In the case of the EU market, most of the raw materials used to produce bio-diesel are rapeseed and sunflower oil.
It is possible to produce bio-diesel from coconut oil as well as palm oil. The production of these two vegetable oils has been dominated by Asian countries. As in the case of coconut oil, the major producing countries are the Philippines and Indonesia.
Sulawesi has been known as a coconut island. Sulawesi has around 700,000 hectares planted to coconuts, accounting for around 20% of the total coconut cultivation areas of Indonesia. The northern part of Sulawesi, such as North Sulawesi and Gorontalo, are the areas where intensive cultivation of coconuts has been practiced for a considerably long period.
The following advantages are cited for the production of bio-diesel from coconut oil in Sulawesi.
Change of Dynamics on Governance in the Market for Coconut-based Products: Around 88% of the CNO produced in Sulawesi is destined for the international market which has been dominated by a few multinational players, such as Procter and Gamble, Unilever, Henkel, etc., which govern market dynamics. However, in the case of the trade in bio-diesel, the market is dominated by numerous automobile owners and commercial land transport operators. The dynamics governing the market of bio-diesel is totally different and cuts off international relations in the trade of coconut oil which has traditionally been maintained over the centuries.
Bio-diesel Development Leads Value-added Activities: The potentialities for a coconut-based industrialization in Sulawesi is quite high due to the existence of intensive coconut farming in huge areas without value-added activities and wherein demand and purchase prices of copra from the farmers have fluctuated. Thus, stable incomes for farmers have yet to be realized. However, with the introduction of bio-diesel production, constant purchases of copra can be possible. This will in turn further encourage the processing of coconut-based products. The more value added to Sulawesi’s coconut products the more income the farmers will get. Thus, the potentialities for coconut-based industrialization are thought to be quite high.

Final Report The Study on Arterial Road Network Development Plan for Sulawesi Island and Feasibility Study on Priority Arterial Road Development for South Sulawesi Province March 2008
4-11
Balance between Food and Energy Security: A large-scale bio-diesel production based on coconuts should be planned in conjunction with increased production of staple or food crops. Otherwise the cultivation of “energy plants” will reduce the areas suitable for food crop cultivation. In the case of coconut-based bio-diesel production, a balance between food crop cultivation and energy crop cultivation can be assured because coconut cultivation allows intercropping. Coconut trees are recommended for planting at 10 m grid intervals to provide space for the cultivation of other crops such as corn, soybeans, vegetables, fruits (banana, pineapple, cacao, etc.). Where the precipitation is limited and the land is not suitable for cultivation of food crops other than coconut, Jatropha trees are recommended to be planted as a supplementary feed stock for the production of bio-diesel. The minimum requirement of precipitation per year for Jatropha cultivation is 600 mm in general1.
4.2.3 Coffee
(1) Production
Total coffee production in Indonesia increased to 762,000 tons in 2005 from 457,000 tons in 1995 at an average annual growth rate of 5.9%. The coffee export volume of Indonesia is ranked second and accounts for around 12% of the total world production. The volume of production of coffee in Sulawesi in 2005 was 57,000 tons, or only 7% of the total coffee exported by Indonesia.
Despite this production increase, Indonesia’s export earnings from coffee did not change from its US$ 170 million earnings in 1995 to its US$ 173 million counterpart in 2005.
Meanwhile, the price of Sulawesi coffee is much higher than those of other coffee produced in other areas of Indonesia. The Sulawesi coffee known as Toraja is grown in the mountainous area near the center of the island. It is commonly found today in specialty stores.
(2) Market
Total volume of coffee traded in the world in 2005 was around 6.6 million tons, an increase from 4.5 million tons in 1995, or an average annual growth rate of 4.4%. However, in the past 10 years, market prices of coffee fluctuated so much and the value of coffee marketed throughout the world did not change much. This implies an oversupply wherein the more coffee produced, the further market prices decline. However, since 2004 the international market prices of coffee have seen an upward trend, as shown in Table 4.2.3. This could be attributed to changes in the marketing system represented by a rapid business expansion of Starbucks or similar types of marketing operations throughout the world, coupled with the increased consumption of coffee in China.
1 In the case of Indonesia, the experimental production and distribution of bio-diesel are ongoing, but the raw
material selected for such bio-diesel is palm oil. In parallel with the planning of bio-diesel based on palm oil, the cultivation of Jatropha has progressed as well especially in areas in Indonesia where there is limited precipitation, a condition suitable for growing Jatropha which does not require much water .

Final Report The Study on Arterial Road Network Development Plan for Sulawesi Island and Feasibility Study on Priority Arterial Road Development for South Sulawesi Province March 2008
4-12
Table 4.2.3 Changes in Annual Average Prices of Coffee Unit Price in US$ per Ton
1995 1996 1997 1998 1999 2000 2001 2002 2003 2004 2005 2006 Ave. Price
371 216 258 377 272 258 139 104 143 152 227 238
(+%) (-%)
- - 42%
19% 46% - 28%
- 5% - 46%
- 25%
38% 6% 49% 5%
(3) Potentialities for Industrialization in Sulawesi
Sulawesi’s coffee has not prospered under intense worldwide competition in the coffee industry. However, the following can be proposed so that the industry can gain more export earnings for Sulawesi.
Quality Control of Beans: The quality of coffee grown in South Sulawesi is basically good as it is Arabica. However, the quality and peculiar character of Arabica, such as its good aroma and depth of taste, can only be attained when they are grown correctly with utmost care. It requires a certain management and control to continuously attain its ultimate reputation and price. Experiences gained from the Japanese investment and management practices in the production of TOARCO Toraja coffee in a 1,300-hectare land should be replicated. The Japanese coffee producer (Key Coffee) has also managed the production and quality control of coffee grown on small landholdings surrounding their estate (as their outgrowers) by extending technical assistance aimed at increasing coffee production from nuclear farming.
Marketing of Sorted Green Beans: Processed green beans should be marketed through the marketing efforts of appointed traders or directly by the coffee processing company. In such a way, prices will not be determined simply through auctions. The way of purchasing coffee beans has changed these days as started by Starbucks and other firms. Therefore, direct business negotiations with potential buyers or traders would be needed to ultimately add value to the coffee grown in Sulawesi.
4.2.4 Animal Feeds
(1) Production
Sulawesi produces soybeans, maize, and copra in considerable volumes, as shown in Table 4.2.3.
The volume of animal feeds exported, mainly from North Sulawesi through Bitung port, was around 170,000 tons and its export value is estimated at around US$ 17 million, assuming that the unit price of animal feed is US$10 cents per kilogram which is nominal in the world. The details of the animal feeds exported from Sulawesi, such as materials, grade, usage, etc., are not known yet. However, it is assumed that the major portion is a by-product from CNO processing and unmilled maize grown widely in North Sulawesi and Gorontalo.

Final Report The Study on Arterial Road Network Development Plan for Sulawesi Island and Feasibility Study on Priority Arterial Road Development for South Sulawesi Province March 2008
4-13
Table 4.2.4 Production Volume of Typical Crops for Animal Feed Production in Sulawesi (Unit: 000 tons)
Item Prod. Vol. (000 tons)
Remark
Copra 363 Sulawesi exported around 230,000 tons of CNO. 55% of copra weight equals CNO in weight.
Maize 1,305 South Sulawesi accounts for around 55% while North Sulawesi and Gorontalo account for around 34% of the total output of Sulawesi.
Cassava 936 South Sulawesi accounts for around 50% and Southeast Sulawesi accounts for 27% of the total output of Sulawesi
Soybean 38 South Sulawesi accounts for almost 70% of the total output of Sulawesi.
Source: Combined data available from Statistics of Each Province of Sulawesi
(2) Market
A range of crops can be used in animal feeds, the most common of which are maize, soybeans, copra, seed wastes after oil extraction, etc. Ninety percent of the world’s soybeans are used to feed animals and vast quantities are exported around the world. The EU alone imported some 24 million tons of soybeans in 2005. The description of major animal feeds is as follows:
Soybeans: Soybeans are a major source of protein for cows, sheep, poultry, and pigs. Sixty percent of soybeans used for animal feeds are fed to poultry.
Maize: Maize is used as animal feeds in several ways. “Fodder” maize is fed directly to cattle without processing.
Copra cake: Coconut oil is produced by extracting oil from copra, which is dried coconut endosperm. When the oil is expelled mechanically the residue is called copra cake, and if the solvent is extracted to increase the yield of oil, the product is called copra meal. These copra by-products are valuable protein sources in animal feeds especially for dairy feed. Copra is usually an expensive animal feed, though it has been fed to poultry and pigs with good results. As the fat in copra contains only small amounts of unsaturated fatty acids its consumption leads to firm body fat and good flavor.
Fish meal: Fish meal is made from the waste of fish after processing of fish such as bones, heads, tails, and guts. Fish meal is good as animal feed especially for broiler raising, duck farming, aquaculture, etc. Most of the fish that are caught in Sulawesi are directly consumed in local markets or consumed without processing, thus no significant amount of waste is left to produce fish meal.
(3) Potentialities for Industrialization in Sulawesi
The world demand for livestock has steadily increased, especially in China and India. This trend could continue with steady economic growth. However, a more important market for Sulawesi’s animal feeds is its own domestic market. If livestock raising is properly done in Sulawesi, the province could find a more valuable market in and out of Sulawesi than just exporting animal feed

Final Report The Study on Arterial Road Network Development Plan for Sulawesi Island and Feasibility Study on Priority Arterial Road Development for South Sulawesi Province March 2008
4-14
directly to the overseas markets. If the product flow of the animal feed processing industry is linked with that of the livestock industry, the effect of the value-added activities can be optimized.
The points described below should be discussed in the animal feed production in Sulawesi.
Halal Meat for Export: Demand for halal meat (meat processed or prepared under Muslim procedures) is expected to increase especially in the Middle East where local supply has traditionally been unable to meet the growing demand. Although Sulawesi has produced a considerable volume of livestock its market is currently confined to the domestic market. In order to meet export potentialities of halal meat for overseas markets, a systematic certification system as well as a complete refrigeration system has to be established since the products need to be vacuum-packed and frozen prior to shipment.
Recycling System based on Locally Available Resources: Even as some local animal feeds are exported overseas, there should be some portion to develop local livestock raising in Sulawesi, aimed at exporting processed livestock products which have much higher value than those sold in local markets. A considerable value can be added on livestock products processed by home and food industries, especially when exported to industrialized and mass-consumption countries.
Premixed Animal Feed: High-value animal feeds are those that are premixed with various kinds of materials such as milled maize, copra meal, fish meal, bone powder, etc. At the moment, these materials are treated separately and are not mixed in order to get the highest prices. Leftovers are considered wastes and not utilized at all. If these materials can be collected and consolidated, a premixed animal feed or organic fertilizer can be produced, thereby elimitaing wastes and optimizing incomes.
Animal Feed as Bio-diesel Production’s By-products: The production volume of copra meal and maize can be effectively and surely increased when the cultivated areas for coconut are expanded with the aim of primarily producing raw materials for bio-diesel production as discussed in the preceding section.
4.2.5 Livestock
(1) Production
The volume of livestock production is estimated by multiplying the number of heads of each livestock with the assumed yield of each product after their processing for consumption. Table 4.2.4 summarizes the estimated approximate volume of livestock production and consumption in Sulawesi at present.

Final Report The Study on Arterial Road Network Development Plan for Sulawesi Island and Feasibility Study on Priority Arterial Road Development for South Sulawesi Province March 2008
4-15
Table 4.2.5 Estimated Production Volume of Livestock Products Total
Volume (000 tons)
South Sulawesi (000 tons)
West Sulawesi
(000 tons)
Southeast Sulawesi (000 tons)
Central Sulawesi (000 tons)
Gorontalo (000 tons)
North Sulawesi (000 tons)
Cow 89 39 5 13 12 13 8Goat 19 8 3 2 4 2 1Pig 12 5 2 0 2 0 3Broiler 113 43 2 9 25 4 30Total 233 95 12 24 43 19 42
Source: JICA Study Team
(2) Market
Currently, the livestock market in Sulawesi is solely local. No livestock products are exported to international markets because of the absence of such facilities as: abattoirs, meat processing plants, ice plants, cold storage units, and refrigerated transport systems.
(3) Potentialities for Industrialization in Sulawesi
Most of the livestock raised in Sulawesi is processed in compliance with the rules and regulations of the Muslim culture. Such meat processed under Muslim culture is called “halal” meat. Muslims are allowed to eat halal meat (except pork). The overseas market of halal meat has been expanding especially in the Middle East where meat consumption has increased but livestock production has been stagnant due to climatic conditions and geological features. Although local consumption of halal meat has been expanding and its export potentialities are quite large for Sulawesi’s livestock producers, these potentialities cannot be realized unless livestock, such as cow, goat, broilers, etc., are processed properly and preserved for transportation. The following are the necessary recommendations in order to realize this.
Modern Slaughter House: There is a need for slaughter houses and meat processing plants with combined proper waste treatment units that meet environmental protection standards as well as facilities for preservation (freezers, cold storages units, chillers, vacuum packers, etc.). These facilities, however, will require a considerable amount of capital.
Promotion of Halal Meat for Export: If such facilities were provided and the production of halal meats would be available in Sulawesi, then the overseas markets, such as the Middle East countries in general and Malaysia and Singapore in particular, where more households can afford good quality halal meat, would continuously import such products from Sulawesi.
Exporting to Kalimantan: Kalimantan, a neighboring island of Sulawesi, has been considered as an energy-resource island where the local economy actively absorbs the local labor force. However, due to its geographical characteristics, the province’s food supply has a limit in supporting its exploding population. Sulawesi has the sole potential of supplying food to its neighbor. In the west coast of Sulawesi are the cities of Mamuju, Palu, and Parepare, which have prospered due to their linkages with the developing cities in the east coast of Kalimantan.

Final Report The Study on Arterial Road Network Development Plan for Sulawesi Island and Feasibility Study on Priority Arterial Road Development for South Sulawesi Province March 2008
4-16
4.2.6 Fishery and Marine Product
(1) Production
Total production volume of marine and inland fishery products in Sulawesi and the volume of export by province are shown in Table 4.2.5.
Table 4.2.6 Production and Export Volume of Fishery Products in Sulawesi, 2005 Total
Volume (000 tons)
South Sulawesi (000 tons)
West Sulawesi
(000 tons)
Southeast Sulawesi (000 tons)
Central Sulawesi (000 tons)
Gorontalo (000 tons)
North Sulawesi (000 tons)
Marine 845 347 38 189 37 35 199Inland 155 125 6 4 6 1 13Export 25 4 0 3 0 1 17
Source: JICA Study Team
Fish processing activities are limited to traditional products using traditional methods, such as sun-dried fish, etc. Fish processing requires the provision of a cold chain system in and out of the island. However, currently there is no such product distribution system throughout Sulawesi. A limited cold chain system for the fishery industry has been developed in North and Southeast Sulawesi.
(2) Market
The main market for both marine and inland fishery products is the domestic market in Sulawesi. However, the volume of exports accounts for a mere 3% of total landed marine products, while none of the production of inland fishery are exported.
(3) Potentialities for Industrialization in Sulawesi
The fishery and marine products sector in Sulawesi has not been developed or fully industrialized. Some fishery products such as frozen bonito, tuna, etc. which have a high value are exported to international markets in the form of frozen or canned products. However, the volume is still limited. These processing activities are concentrated in and around Bitung in North and Southeast Sulawesi. Generally, fish distributed widely in Sulawesi are traded through the traditional method, using ice blocks to preserve their quality. They are solely used for the local market.
Inland Fishery: Inland fishing has long been a practice and it developed gradually especially along and near coastlines and areas located close to the cities where constant demand exists. However, traditionally inland fish are not processed and are simply sold using ice. This product holds a potential for processing into more value-added products. But this will be subject to the acceptance of local markets and tastes and, subsequently, the international markets.
Fish or marine product processing requires considerable manpower. Therefore, a considerable volume of job opportunities will be generated especially for the rural areas where coastal and inland fishery activities have already existed for so long.

Final Report The Study on Arterial Road Network Development Plan for Sulawesi Island and Feasibility Study on Priority Arterial Road Development for South Sulawesi Province March 2008
4-17
Furthermore, if the fish processing industry take places in a wholistic manner in tandem with the food processing industry their added value could be maximized. For example, animal feeds can be produced by mixing the offal from fish processing with other materials that would be generated from processing livestock and major cash crops.
High-priced Marine Products: Among marine and aquaculture products, the high-value pearls are followed by crustacean products (e.g. sea cucumber). Pearl culture in Sulawesi is concentrated in Gorontalo and parts of North Sulawesi, where sea waters are crystal clear. Highly specialized techniques are required in the production of world-class pearls. Often, such techniques are transferred from private Japanese pearl companies.
4.2.7 Mining Products (Cement)
(1) Production
Cement is the major mining product in Sulawesi. The marketing and production of cement produced in Indonesia, including Sulawesi, is mainly for domestic consumption. Total cement volume produced in 2005 in Indonesia was around 32.2 million tons, 1.9 million tons or 6% of which came from Sulawesi. Of this volume around 0.9 million tons were distributed in Sulawesi and around 1.0 million tons were distributed to the eastern Indonesian region.
Cement from Sulawesi,which is produced by PT Semen Tonasa and PT Semen Bosowa is shipped widely to the islands in the eastern Indonesia including Maluku and Nusa Tenggara, and to Java and Kalimantan. The volume of cement shipped out from Sulawesi to these islands in 2006 was around 1.0 million tons. The volume transported by ship to other ports in Sulawesi was around 200,000 tons in 2006. Some volumes are shipped to Java through a special jetty owned by cement producers which is located at Bringkasi in the north of Makassar.
(2) Market
Parallel to the recovering economy of Indonesia, cement consumption has slowly been improving. Government officials are expecting that cement production will increase from the current 32 million tons a year to around 46 million tons a year by 2010.
(3) Potentialities of Industrialization in Sulawesi
The total installation capacity of the cement production facilities in Sulawesi is estimated at around 5.3 million tons. (PT Semen Bosowa Maros, Kabupaten Maros, South Sulawesi, 1.8 million tons; and PT Semen Tonasa, Pangkep, South Sulawesi, 3.5 million tons). Total cement produced in 2006 in Sulawesi was 1.9 million tons. This data implies that there is huge capacity for increased production.
Two other new companies have already obtained government permission to commence cement production in Sulawesi, namely PT Balocci Makmur and PT Lebak Harapan Makmur. These two companies also plan to operate in South Sulawesi. With this, it could be said that the promotion of
Final Report The Study on Arterial Road Network Development Plan for Sulawesi Island and Feasibility Study on Priority Arterial Road Development for South Sulawesi Province March 2008
4-18
investments in cement production is not necessary in the coming years.
Also, the existence of quite a huge limestone mountain along the Maros shore in South Sulawesi will enhance cement production activities in this area.
4.2.8 Mineral Products (Nickel)
(1) Production
Indonesia produces around 140,000 tons of nickel-based alloys, ranking it fourth in the world after Russia, (315,000 tons), Australia (210,000 tons), Canada (196,000 tons). Nickel in Indonesia is mined at the PT Antam sites in Pomalaa, Southeast Sulawesi, Soroako in South Sulawesi and in Gebe, Gees, and Tanjung Buli in North Maluku. Southeast Sulawesi is endowed with a considerable deposit of nickel ore and its mines have been developed by international companies. Nickel ore and ferro-nickel are shipped through a special private jetty located close to the mine fields along the sea near Pomalaa in Southeast Sulawesi as well as in Soloako in South Sulawesi. The volume of nickel shipped out from Sulawesi in 2006 was around 500,000 tons.
PT Inco plans to develop two nickel deposits, Bahodopi in Central Sulawesi and Plomalaa in Southeast Sulawesi, as well. Because of the growing prices of nickel in the international market, which is mainly pushed up by China, the development of nickel mining in Sulawesi through more investments should be enhanced in the coming years.
(2) Market
Owing to the strong demand for primary nickel in China, market prices of nickel have been rising at an annual average of around 26% since 2001. That year, prices were around US$6,000 per ton and currently they have reached the US$ 15,000 per ton level.
Markets for primary nickel, which is used mainly for the production of stainless steel and nickel-based rechargeable batteries, have continuously increased since 2000. In 2004, world demand for primary nickel registered at an all-time high, resulting in most nickel producers to operate at full capacity. Primary nickel demand in 2006 was around 1.2 million tons. This demand will be buoyed by spiraling consumption in China, a consumption which has risen from 43,400 tons in 1999 to 160,000 tons in 2006.
China consumes more stainless steel than any other country. It consumed 4.7 million tons of stainless steel in 2004, with state-owned mills producing 1.32 million tons. Chinese imports of stainless steel totaled 2.90 million tons and are showing a steady increase in the future.

Final Report The Study on Arterial Road Network Development Plan for Sulawesi Island and Feasibility Study on Priority Arterial Road Development for South Sulawesi Province March 2008
4-19
(3) Potentialities for Industrialization in Sulawesi
The further development of nickel mining will continue in Sulawesi as returns-on-investments on the expansion of mining operation, as well as the production of nickel ferro-alloy becomes lucrative. Likewise crude oil prices, which are undoubtedly considerably high in the international market, are predicted to continue in the future although it will also be dependent on the Chinese economy.
Because of its proven reserves or deposits of nickel in Sulawesi, the development of nickel mining in Sulawesi will continue especially in Southeast Sulawesi.
4.2.9 Oil and Gas Industries (Crude oil and LNG)
(1) Production
Crude Oil: The production of crude oil in Indonesia, which is a member country of OPEC, was 1.09 mb/d in 2006. This accounted for approximately 1.4% of the world’s daily production, ranking the country number 20th among the world’s oil-producing countries. Export revenue from crude oil was US$ 6.2 billion which accounts for around 6% of the total foreign exchange trade earnings of Indonesia. The country’s oil reserves are approximately 8.6 million barrels.
LNG: Indonesia has some of the largest known pools of natural gas in the world, with total estimated reserves of 187 trillion standard cubic feet (SCF). Indonesia produced 8.16 trillion cubic feet (TCF) of gas in 2006, ranking eighth among the world’s gas-producing countries. Of this, 46% was dedicated to domestic demand for power generation, fertilizer production, and other industries, while the rest was exported mainly as liquefied natural gas (LNG). The major markets of Indonesia’s LNG are Japan (71%), South Korea (20%), and Taiwan (9%).
Fuel Supply in Sulawesi: Sulawesi’s fuel consumption has totally been dependent on imported petroleum products coming from the nearest refinery operating in Balikpapan, East Kalimantan through PERTAMINA. The total fuel imported in 2006 by Sulawesi was 3.3 million KL (gasoline 1.2 million KL, heavy fuel 0.6 million KL, and diesel 1.5 million KL) and distributed through 19 fuel depots by liquid carriers and around 800 units of tank lorry throughout Sulawesi.
(2) Exploitation Projects for Oil and Gas
Oil and Gas Development Projects in Sulawesi: Since April 2002, the exploration for oil and gas has continued in Central Sulawesi mainly by PERTAMINA. The offshore Tiaka oil field is one of five oil fields explored in the Banggai Basin and it has started production of crude oil at a rate of 6,500 bpd. The oil loading facility was constructed and put into operation off Batui, Central Sulawesi which is around 100km southwest from Luwuk and around 15km offshore. Luwuk has served as a supply base for the oil and gas field developments.
Four oil and gas fields, out of five explored in the Banggai Basin, have been certified as gas deposits with huge volumes of reserves. Tiaka, one of the five fields, has an oil deposit and is

Final Report The Study on Arterial Road Network Development Plan for Sulawesi Island and Feasibility Study on Priority Arterial Road Development for South Sulawesi Province March 2008
4-20
around 15 km offshore. It is expected that exploitation will last around 27 years. Shipments of crude oil already started in 2006.
Two big oil and gas projects have been studied then started in 2006. One is the building of a refinery in Parepare, South Sulawesi and the other is the production of LNG in Central Sulawesi. They are outlined below.
Refinery Project in South Sulawesi: Parepare is an ideal unloading port for crude oil because of its deep water and relatively calm bay protected by several islands off Parepare’s shore. The plan to build a big-scale petroleum refinery was studied in the past. Its construction is expected to commence in 2007 and complete by 2011. Target production capacity of the refinery is 300,000 bbl/d with investments coming from one of the leading oil companies in the Middle East through a joint venture with PERTAMINA. The first phase of the project is designed to produce around 150,000 bbl/d and supply the products to East Indonesia (Sulawesi’s total consumption may account for around 50% of the total volume produced by this refinery.). The second phase is designed to produce around 150,000 bbl/d for export overseas. Capital investments in order to build such a refinery are estimated to be around US$ 1.2 - 1.5 billion.
LNG Project in Central Sulawesi: Central Sulawesi is considered as Indonesia’s next big gas- producing area after Aceh. PT Medco Energi Internasional Tbk (Medco), together with PERTAMINA, plans to build a new LNG facility in Central Sulawesi underpinned by proven gas reserves of 28 TCF. If this is realized, it will be the fourth LNG plant in Indonesia. Once this project goes on stream, the Dongin, Senoro and Toili area in Central Sulawesi, could easily become Indonesia’s current biggest natural gas-producing field because of its big gas reserves, which are twice as large as the gas reserves operated by Exxon Mobile in Arun, Aceh, which has been in operation since the late 1970s. The expected amount of capital investment for this LNG project would be in the US$ 1.5 - 2.0 billion range.
Change in Regional Autonomy: On 1 January 2001, the Regional Autonomy Law 22/1999 and the Fiscal Decentralization Law 25/1999 came into effect. Law 25/1999 contains formulas for revenue sharing between the central government and various regional authorities. On 15 October 2004, the Government of Indonesia amended these laws with Regional Autonomy Law 32/2004 and Fiscal Decentralization Law 32/2004, clarifying further the roles of the central and regional authorities. These two new laws also changed the revenue sharing between the central government and the regional authorities. According to these new laws, the revenue from natural-gas-based investment projects can be split among the central government, provincial government, and the regency at a rate of 70%, 6%, and 24%, respectively. Before this law was implemented, the entire revenue generated from such projects went to the central government.
Therefore, once the LNG project becomes operative the provincial and local governments can expect huge and steady revenue that can be used to stimulate the economy of Sulawesi.

Final Report The Study on Arterial Road Network Development Plan for Sulawesi Island and Feasibility Study on Priority Arterial Road Development for South Sulawesi Province March 2008
4-21
4.2.10 Manufactured Products
(1) Production
The total value and volume of export of non-agriculture-based manufactured goods from Sulawesi in 2003 was around US$ 100 million and 61,000 tons, respectively. Manufactured goods in Sulawesi accounted for 8.7% of the total export value and 3.8% of the total export volume. Currently, the major manufactured products produced in and exported from Sulawesi are processed wood including plywood, textile products, and garment. Table 4.2.6 shows the value and volume of manufactured goods by province.
Table 4.2.7 Value and Volume of Manufactured Goods Exported by Sulawesi, 2003 Total South
Sulawesi Southeast Sulawesi
Central Sulawesi
North Sulawesi
Export Value (US$ million) 64 (64.5) 9 (9.3) 24 (23.6) 3 (2.6) Export Volume (000 tons) 31 (51.1) 12 (20.0) 15 (23.8) 3 (5.0)
Source: JICA Study Team, based on trade statistics of the Ministry of Trade, 2005 Note: Figures in parentheses refer to percentage in total by province.
The major manufactured products in Sulawesi by province are as shown in Table 4.2.7
Table 4.2.8 Major Non-agriculture-based Manufactured Products by Province Unit: US$ Million
Major Product Total Export
Amount
South Sulawesi
Southeast Sulawesi
Central Sulawesi
North Sulawesi
Processed Wood 26 12 5 9 0 Garment 17 17 0 0 0 Furniture 4 3 0 1 0 Fabricated Steel 2 0 0 0 2 Others 51 33 4 14 0 Total 100 65 9 24 2 Share 100% 65% 9% 24% 2%
Source: JICA Study Team
Most manufacturing activities take place in the industrial estate managed and operated by PT. Kawasan Industry Makassar or KIMA in South Sulawesi. This industrial estate is located 15km from the Port of Makassar and a 10-minute drive from Hassanudin International Airport. The present area is 203 hectares and is planned to be expanded to 700 hectares. At present, it has around 150 establishments, most of which are based on agribusiness or agro-industry or hold their production or storage facilities in KIMA.
(2) Potentialities for Industrialization in Sulawesi
The comparative advantage of Sulawesi in developing its manufacturing sector and in attracting FDIs into manufacturing activities lies on its geographical location as well as cheap labor especially in and around the major cities of Sulawesi, namely Makassar in South Sulawesi and Manado or Bitung in North Sulawesi. Whether FDIs in the manufacturing sector, especially those export-oriented, will either be based on locally available materials or just on the availability of

Final Report The Study on Arterial Road Network Development Plan for Sulawesi Island and Feasibility Study on Priority Arterial Road Development for South Sulawesi Province March 2008
4-22
skilled or acceptable skill levels of labor, will be totally dependent on the attractiveness of Sulawesi.
FDIs in the manufacturing sector in Sulawesi cannot be realized in a short period of time. It will require coordination for the promotion of Sulawesi as a competitive destination for FDIs among all concerned agencies and the central government of Indonesia as well as the private sector, not only in Sulawesi but outside. Coordination efforts for the promotion of industrial development in Sulawesi can be optimized when all the provinces in Sulawesi are governed by a single development policy, even though the nature of industrialization differs for each province.