Chapter 3. Health Sensing for PHM - Seoul National University
46
Seoul National University Byeng D. Youn Laboratory for System Health & Risk Management Department of Mechanical & Aerospace Engineering Seoul National University Prognostics and Health Management (PHM) Chapter 3. Health Sensing for PHM
Transcript of Chapter 3. Health Sensing for PHM - Seoul National University

Seoul National University
Byeng D. YounLaboratory for System Health & Risk Management Department of Mechanical & Aerospace EngineeringSeoul National University
Prognostics and Health Management (PHM)
Chapter 3. Health Sensing for PHM

Seoul National University
CONTENTS
2019/1/4 - 2 -
Introduction1Failure Identification2Fundamentals of Sensor Systems3Sensor Classification 4
5 Data Acquisition and Sensor Networks
6 Case Study

Seoul National University2019/1/4 - 3 -
1. IntroductionObjective of Health Sensing• To acquire the health-relevant signal in a cost-effective and highly detectable manner• Sensor Selection
– To select proper sensors capturing health-relevant signal
• Data Acquisition– Amount of data, sampling rate/duration/period, logging capability, optimal DAQ
system• Sensor Networks Design
– Optimizing sensor position, minimizing the number of sensors
Chapter 3. Health Sensing for PHM
Acceleration Strain Temperature
DijDetected States
HC FM1 ••• FMMTrue States
HCFM1•••
FMM
1
23
4
5
6
7 8
9
Side wall
Confusion (or Detectability) Matrix

Seoul National University2019/1/4 - 4 -
1. IntroductionVarious Sensors for PHM
Chapter 3. Health Sensing for PHM
Thermal Sensor
Acoustic Sensor
Strain Sensor
Current Voltage Sensor
VibrationSensor Oil Sensor Load
Sensor Flow Sensor
Electric components
hot spots
Component excitation Stress level
Cabling isolation
faults
Acceleration,velocity,
displacement
Components with
excessive wear
Stress HydrometerFlux
Electronics,Bearings
Bearings,Gearboxes,
Engines
Blades,Bearings
Engine,Switches,
Cables
Bearings,Gearboxes,
Shafts
Bearings,Gearboxes,
Engines
Rotor,Dams,
Bridges
HydraulicComponents
Electronics Gearboxes Cables Bearings RotorEnginesBlades HydraulicComponent

Seoul National University2019/1/4 - 5 -
2. Failure IdentificationFailure Modes, Effects and Criticality Analysis (FMECA) • FMECA is a disciplined method to identify and analyze :
– All potential failure modes of the various parts of a system– Effects of the failures may have on the system– How to avoid the failures, and/or mitigate the effects of the failures on the system
• Purposes in System Design Process– Assist in selecting design alternatives with high reliability and high safety for
avoiding the failure modes– Provide an effective method for evaluating the effect of proposed changes to the
design and/or operational procedures on mission success and safety
• Purposes in Prognostics and Health Management (PHM) – Provide information of proper physical quantities to be acquired for fault diagnosis
and prognosis– Develop early criteria for test planning and requirements for test equipment– Decide priorities of maintenance after some potential failures may happen
Chapter 3. Health Sensing for PHM
Seoul National University2019/1/4 - 6 -
2. Failure IdentificationFailure Modes, Effects and Criticality Analysis (FMECA) • Bottom-Up Approach
– Each component on the lowest level of indenture is studied one-by-one– The analysis is complete since all components are considered
• Top-Down Approach– The analysis starts with the main system functions and how these may fail– It will not complete, but it focuses on problem areas
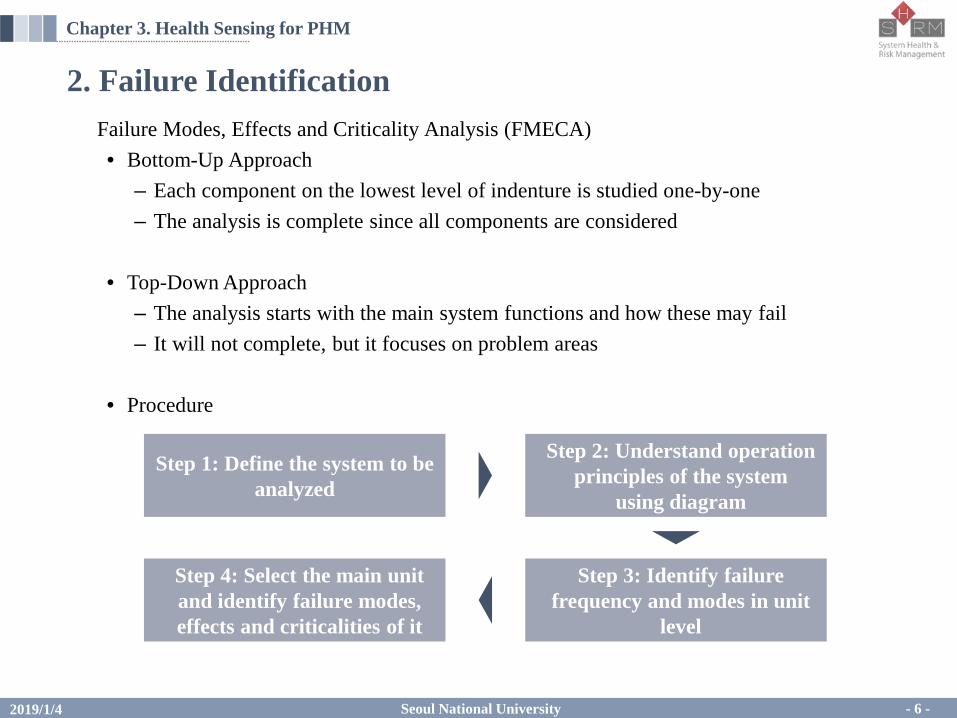
• Procedure
Chapter 3. Health Sensing for PHM
Step 1: Define the system to be analyzed
Step 2: Understand operation principles of the system
using diagram
Step 3: Identify failure frequency and modes in unit
level
Step 4: Select the main unit and identify failure modes, effects and criticalities of it

Seoul National University2019/1/4 - 7 -
2. Failure IdentificationExample: FMECA on Solenoid Valve in Urban Railway Vehicle• Step 1: Define the system to be analyzed
– Consider schematics and operational detail of the system– Clarify the function of the system and identify the system indenture levels
• Step 2: Understand operation principles of the system using diagram– A functional diagram representing the operation, interrelationship and interdependen-
cies of functional entities of the system should considered– It provides the ability to trace the failure mode effects through each level of indenture
Chapter 3. Health Sensing for PHM
Major System(Railway Vehicle)
System(Power Transfer)
Subsystem(Braking System)
Unit(Valve, Compressor)
Main Reservoir
Brake Valve
Air Reservoir
Control Valve
Brake Cylinder
Air Reservoir
Control Valve
Brake Cylinder
Brake Brake
ElectronicControl Unit
Compressor

Seoul National University2019/1/4 - 8 -
2. Failure IdentificationExample : FMECA on Solenoid Valve in Urban Railway Vehicle• Step 3: Identify failure frequency and modes in unit level
– It provides a rationale to select the particular unit from the perspective of failure frequencies and modes
• Step 4: Select the main unit and identify failure modes, effects and criticalities of it– Based on the information obtained from this FEMCA and failure cause, some of
physical quantities for detecting each failure mode can be considered
Chapter 3. Health Sensing for PHM
Unit Air Compressor Solenoid Valve
Failure Frequency 522 times for 13 years 1757 times for 13 years
Failure Mode Oil deterioration Rust by moisture
Burnout of coils Rubber damage Debris accumulation
Item Failure Mode Failure Effect Failure Criticality Failure Cause Signals
Solenoid coil Burnout of coilsAbnormal
valve bar behavior20%
Interruption of coils
Current
Valveseat
Rubber damageValve bar jamming
10% Fatigue failure Pressure
Debris accumulation
Air leakage 70% Impurities in air Pressure
Seoul National University2019/1/4 - 9 -
2. Failure IdentificationAccelerated Life Test (ALT)• Purpose
– The product life test would require a long-time test (e.g., 104 ~ 105 hours) under normal stress condition
– These cause practical difficulty when planning the tests and analyzing failure data
• ALT Applications– Materials testing and evaluation : concrete, metals, ceramics, fibers, plastics, etc.– Parts testing and evaluation : Semiconductors, bearings, motors, generators, etc.– Testing and evaluation of engineered systems : aircraft, automobiles, etc.
Acceleration Method (1/2)• Compressed-Time Testing
– Many products experience on-off operation cycles instead of continuous operation. (e.g. appliance doors are more frequently opened and closed)
– The tests are frequently used, but the loads and environmental stresses are maintained at the level expected in normal use
Chapter 3. Health Sensing for PHM

Seoul National University2019/1/4 - 10 -
2. Failure IdentificationAcceleration Method (2/2)• Advanced-Stress Testing (or Physical Acceleration Testing)
– Advanced-stress testing may be employed to accelerate failures, since as increased loads or harsher environments are applied to a device, an increased failure rate may be observed
– Some engineering instances include : 1) Electronics industry - components are tested at elevated temperatures to increase
the incidence of random failure 2) Nuclear industry - pressure vessel steels are exposed to extreme levels of neutron
irradiation to increase the rate of failure
Conditions for ALT (1/2)• Condition 1 : Determination of the rate stage
– Faults rarely occur in response to a single physical or chemical reaction.– Ex) Bearing rolling contact fatigue and degradation stage
Chapter 3. Health Sensing for PHM
<500µm ~1mm <1mm
Sub-surface crack:Acoustic emission from crack
Spall initiation:Metal particle detached,Plastic deformation
Spall propagation:Friction, temperature ↑Lubricant viscosity ↓
Extend spall & fatigue:Excessive heat from contact,Lubricant burn
Seoul National University2019/1/4 - 11 -
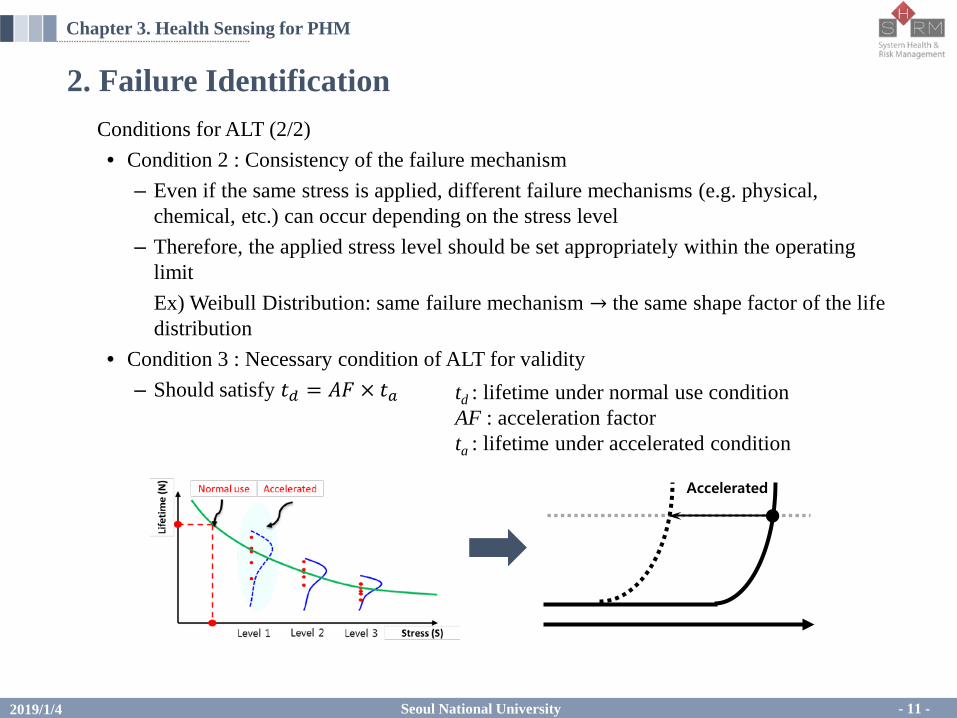
2. Failure IdentificationConditions for ALT (2/2)• Condition 2 : Consistency of the failure mechanism
– Even if the same stress is applied, different failure mechanisms (e.g. physical, chemical, etc.) can occur depending on the stress level
– Therefore, the applied stress level should be set appropriately within the operating limitEx) Weibull Distribution: same failure mechanism → the same shape factor of the life distribution
• Condition 3 : Necessary condition of ALT for validity– Should satisfy 𝑡𝑡𝑑𝑑 = 𝐴𝐴𝐴𝐴 × 𝑡𝑡𝑎𝑎
Chapter 3. Health Sensing for PHM
td : lifetime under normal use conditionAF : acceleration factorta : lifetime under accelerated condition
Accelerated

Seoul National University2019/1/4 - 12 -
3. Fundamentals of Sensing SystemFramework of Measuring Systems of Three Stages• Stage 1. Sensor-transducer stage
– The primary function of the first stage is to detect or to sense the measurands– Unwanted sensitivity is a measuring error, called noise
• Stage 2. Signal conditioning stage– To modify the transduced information so that it is acceptable to the third stage. – It may performs many operations, such as amplification, filtering to remove noise,
analog-to-digital convertering, integration, differentiation, as may be required• Stage 3. Readout-recording stage
– The third stage provides the information sought in a form comprehensible to one of the human senses or to a controller
Chapter 3. Health Sensing for PHM
Sensor-transducer
Signalconditioner
Indicator
Recorder
Computer
Processor
Controller
MeasurandTransduced
signal(analogous to
input)
Analogous driving signal
Auxiliary power(not always required)
Auxiliary power(usually required)
Calibrationinput
Sensor DAQ

Seoul National University2019/1/4 - 13 -
3. Fundamentals of Sensing SystemTypes of Input Quantities• Classification of mechanical quantities by time dependence
– Static : constant in time, the most easily measured– Dynamic : varying in time, can be classified as 1) steady state periodic and 2)
nonrepetitive or transient
• Analog and Digital Signals– Analog signal: A signal whose magnitude is continuously changed with respect to
time. The physical quantities that we commonly know and the values measured by analog sensors are analog signals
– Digital signal: A signal whose magnitude is discontinuously changed with respect to time. Mechanical quantities normally behave in an analog manner. Distinct advantages are often obtained in converting an analog signal to an equivalent digital signal for the purposes of signal conditioning and/or readout
Chapter 3. Health Sensing for PHM

Seoul National University2019/1/4 - 14 -
3. Fundamentals of Sensing SystemSensor Dimensionality• Sensors measure through physical processes that span a multidimensional space–time
environment. In most cases, these processes occur over single, multiple dimensions.
Precision and Accuracy• Precision : The size of the smallest quantity that can be distinguished by a system• Accuracy : The quality and/or confidence in a given measurement
Chapter 3. Health Sensing for PHM
Point sensors (0D) 1D sensors 2D sensors 3D sensors
Examples
accelerometer TDR 2D imaging Radiography
AccurateNot Precise
AccuratePrecise
Not AccuratePrecise
Not AccurateNot Precise

Seoul National University2019/1/4 - 15 -
3. Fundamentals of Sensing SystemCalibration• Definition : The process to accurately measure the value of the physical quantities before
using the sensor• Single Point Calibration
– If the output is exactly proportional to the input, a single simultaneous observation of input and output will suffice to fix the constant of proportionality
• Multipoint Point Calibration– Multipoint calibration works when the output is not simply proportional, and, more
generally, improves the accuracy of the calibration
Chapter 3. Health Sensing for PHM
• output = 𝑠𝑠𝑠𝑠𝑠𝑠𝑠𝑠𝑠𝑠 × input +𝑖𝑖𝑖𝑖𝑡𝑡𝑠𝑠𝑖𝑖𝑖𝑖𝑠𝑠𝑠𝑠𝑡𝑡
• Intercept ideally has zero value, but is varied by circumstance (e.g. temperature, humidity, etc.)
• Slope and intercept values are normally provided by manufacturer.
• Slope usually has fixed value, but is varied in long-time usage
Input
Output
Slope
Operating sensor range
Overload range

Seoul National University2019/1/4 - 16 -
3. Fundamentals of Sensing SystemSensitivity • Definition : The change of sensors output per unit change in the measured quantity• A more sensitive sensor’s reading changes significantly in response to smaller changes in
the measured quantity
– Sensitivity = Change in ouputChange in input
• Sensitivity can be expressed as V/cm, V/g, V/(m/s2), etc.
Resolution• Definition : The smallest change it can detect in the quantity that it is measuring.• In general, the number of bits represent the degree of resolution• Higher bits, higher resolution (e.g. n bit device present analog signal with 2n values)
Chapter 3. Health Sensing for PHM
3 bit
16 bit
Seoul National University2019/1/4 - 17 -
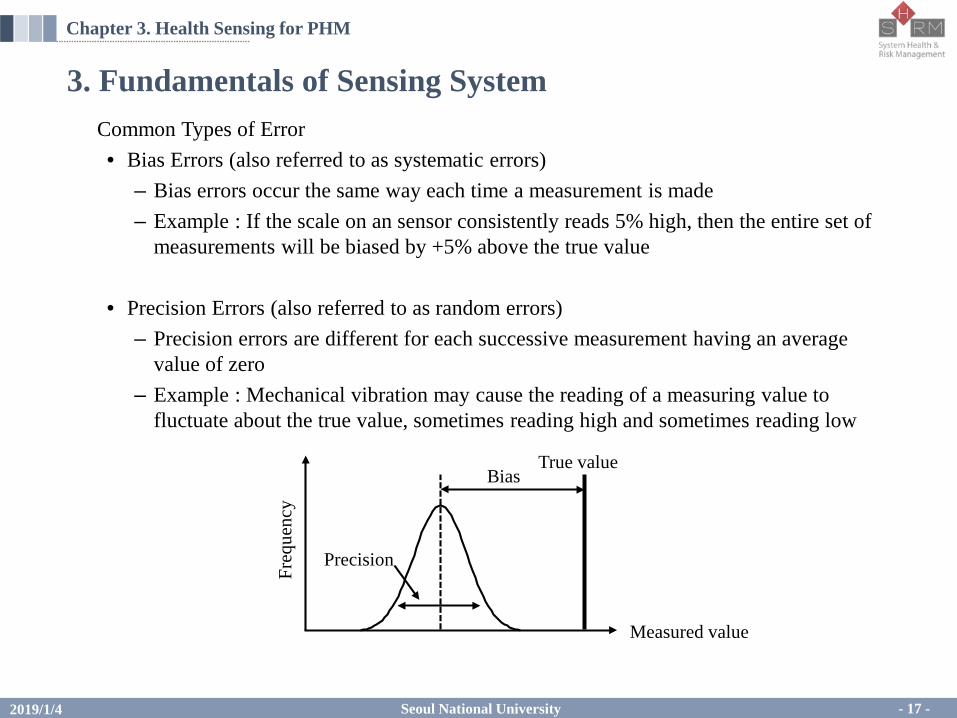
3. Fundamentals of Sensing SystemCommon Types of Error• Bias Errors (also referred to as systematic errors)
– Bias errors occur the same way each time a measurement is made– Example : If the scale on an sensor consistently reads 5% high, then the entire set of
measurements will be biased by +5% above the true value
• Precision Errors (also referred to as random errors)– Precision errors are different for each successive measurement having an average
value of zero– Example : Mechanical vibration may cause the reading of a measuring value to
fluctuate about the true value, sometimes reading high and sometimes reading low
Chapter 3. Health Sensing for PHM
Precision
True valueBias
Measured value
Freq
uenc
y

Seoul National University2019/1/4 - 18 -
3. Fundamentals of Sensing SystemMeasurands• Definition
– Physical properties that are directly measurable with sensors
• Geometric Configuration : Displacement, Tilt and Flatness– Human eyesight and simple sensors can quickly measure geometric properties– All geometric measurements require an established reference frame with an associated
coordinate system
• Kinematics : Displacement, Strain, Velocity, and Acceleration– Structural stiffness calculations and models often make use of displacement– Accelerations measurement are common due to low cost for measuring than velocities
or displacements
• Kinetics: Force, Stress, Torque, Pressure– Indirect measurements (typically based on deformation) are more common– Example : Load cell for measuring a force actually measure the deformation of an
internal elastic element and infers it from elastic force-deformation model
Chapter 3. Health Sensing for PHM

Seoul National University2019/1/4 - 19 -
3. Fundamentals of Sensing SystemMeasurands• Electromagnetic Properties: Impedance, Voltage, Current, Magnetic Flux
– Direct measurements (typically based on voltage) are more common– Example : LCR meter measures impedances (resistance, capacitance, inductance)
using frequency responses of voltage and current across specimen
• Chemical State: Corrosion, Dissolved Gas– Many experimental techniques (e.g. chromatography) can be used to measure or
separate the target chemicals.– Example 1 : Hydrogen sulfide corrosively damage concrete sewer pipe– Example 2 : Dissolved gases in transformer oil are closely related to internal faults
• Others : Temperature, Moisture, etc.– A variety of sensors (e.g. thermometer: mercury, alcohol, bimetal, thermistor, infrared)
can measure and transduce the information into an easily measured property, such as voltage, optical intensity, or direct digital readout.
Chapter 3. Health Sensing for PHM

Seoul National University2019/1/4 - 20 -
3. Fundamentals of Sensing SystemDimensional Units of Sensing : International System of Units (SI System)• Establishment of the SI System
– Seven base units of SI System are listed in below left table – Other dimensions can be derived from these base unis by multiplication and division
shown – A few such derived units are assigned special name shown in below right table
Chapter 3. Health Sensing for PHM
QuantityUnit
Name Symbol
Length Meter m
Mass Kilogram kg
Time Second S
Electric current Ampere A
Temperature Kelvin K
Amount of substance Mole mol
Luminous intensity Candela cd
QuantityUnit Other
UnitName Symbol
Angle Radian rad m�m-1
Frequency Hertz Hz s-1
Force Newton N kg�m�s-2
Pressure, Stress Pascal P N/m2
Power Watt W N�m�s-1
Charge Coulomb C A�s
Voltage Volt V W/A

Seoul National University2019/1/4 - 21 -
3. Fundamentals of Sensing SystemDimensional Units of Sensing : International System of Units (SI System)• Conversions between system of units
– There are five systems listed in below table – System of units differs in their use of defined and derived units– In any case, whichever system is used, a consistent, compatible balance of units must
be maintained
• Example : Determine the conversion factor between pounds-force and newtons– 1 lbf = 32.147 lbm�ft/s2
= 32.147 (0.453 kg) (12�0.0254m)/s2
= 4.448 kg�m/s2
= 4.448 N
Chapter 3. Health Sensing for PHM
QuantityUnit
SI CGS English Engineering Absolute English Technical English
Length Meter (m) Centimeter (cm) Foot (ft) Foot (ft) Foot (ft)
Time Second (s) Second (s) Second (s) Second (s) Second (s)
Mass Kilogram (kg) Gram (g) Pound-mass (lbm) Pound-mass (lbm) slug
Force Newton (N) Dyne Pound-force (lbf) Poundal Pound-force (lbf)
Seoul National University2019/1/4 - 22 -
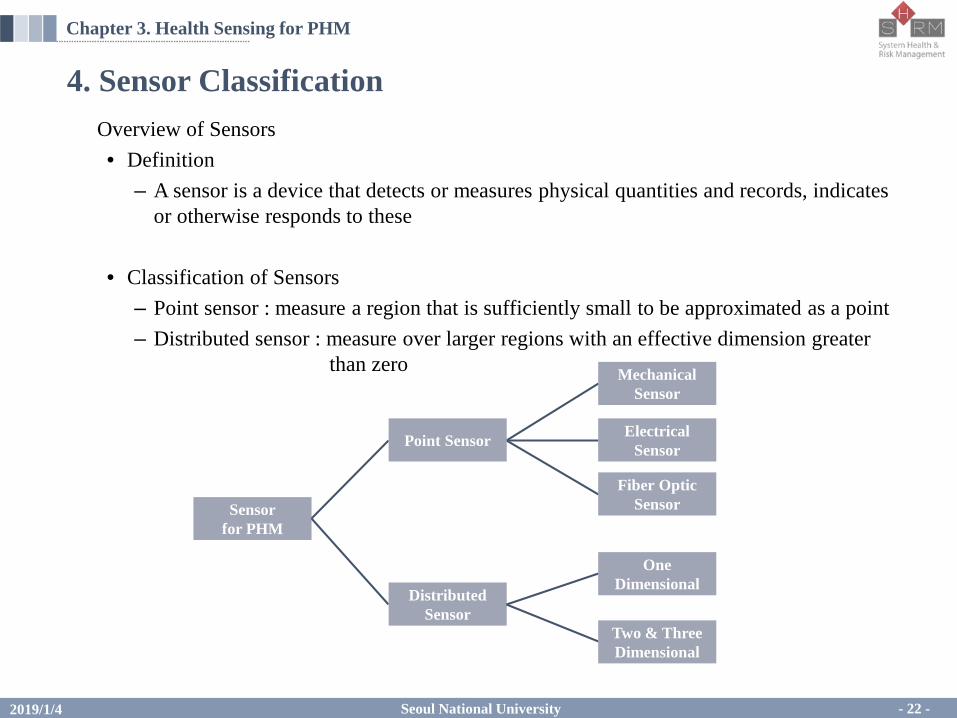
4. Sensor ClassificationOverview of Sensors• Definition
– A sensor is a device that detects or measures physical quantities and records, indicates or otherwise responds to these
• Classification of Sensors– Point sensor : measure a region that is sufficiently small to be approximated as a point– Distributed sensor : measure over larger regions with an effective dimension greater
than zero
Chapter 3. Health Sensing for PHM
Sensorfor PHM
Distributed Sensor
Mechanical Sensor
Electrical Sensor
Fiber Optic Sensor
Point Sensor
One Dimensional
Two & Three Dimensional
Seoul National University2019/1/4 - 23 -
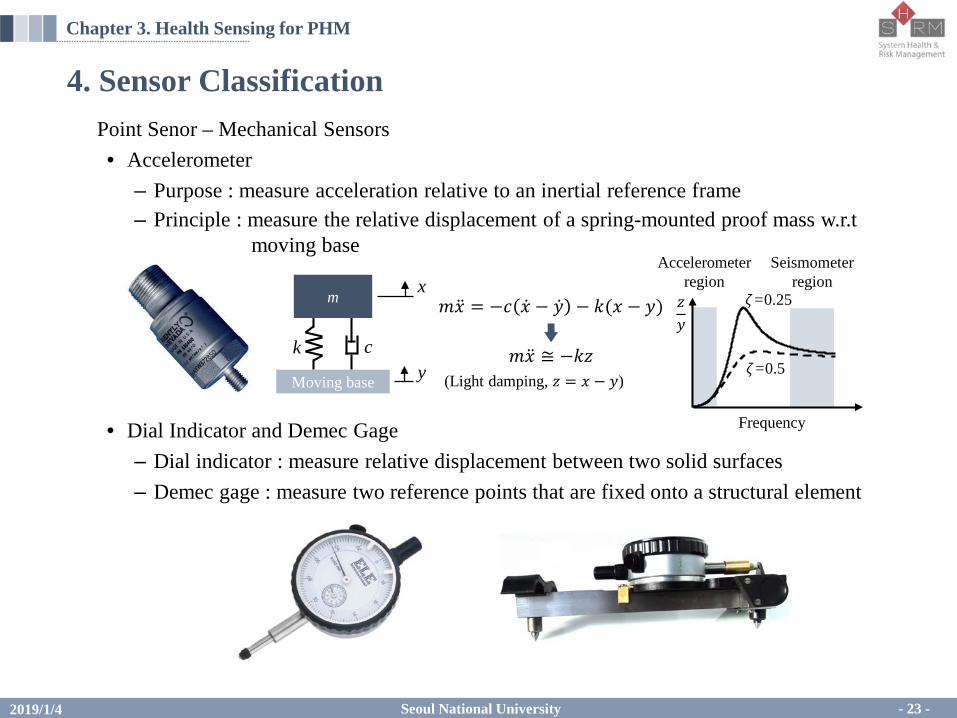
4. Sensor ClassificationPoint Senor – Mechanical Sensors• Accelerometer
– Purpose : measure acceleration relative to an inertial reference frame– Principle : measure the relative displacement of a spring-mounted proof mass w.r.t
moving base
• Dial Indicator and Demec Gage– Dial indicator : measure relative displacement between two solid surfaces– Demec gage : measure two reference points that are fixed onto a structural element
Chapter 3. Health Sensing for PHM
c
Moving base
m
ky
x𝑚𝑚�̈�𝑥 = −𝑖𝑖 �̇�𝑥 − �̇�𝑦 − 𝑘𝑘(𝑥𝑥 − 𝑦𝑦)
𝑚𝑚�̈�𝑥 ≅ −𝑘𝑘𝑘𝑘(Light damping, 𝑘𝑘 = 𝑥𝑥 − 𝑦𝑦)
Frequency
𝑘𝑘𝑦𝑦
𝜁𝜁=0.5
𝜁𝜁=0.25
Accelerometerregion
Seismometerregion

Seoul National University2019/1/4 - 24 -
4. Sensor ClassificationPoint Sensor – Mechanical Sensors• Gyroscope Sensor and Microphone
– Gyroscope sensor : measure rotation and orientation using gravity– Microphone : measure acoustic pressure
• Schmidt Hammer and Portable Indenter– Schmidt hammer : estimate the strength of a brittle material by measuring the amount
of energy absorbed during a standardized hammer impact– Portable indenter: measure the hardness of a material from indentation
(e.g. Brinell hardness testing, Vickers hardness testing)
Chapter 3. Health Sensing for PHM

Seoul National University2019/1/4 - 25 -
4. Sensor ClassificationPoint Sensor – Electrical Sensors• Strain Gage
– Purpose : measure mechanical strain on the structure – Principle : measure electrical resistance change of the strain gage in response to
deformation (e.g., elongation, compression) called piezoelectric effect
• Load Cell and Pressure Sensor– Load cell : measure forces and loads using piezoresistive strain gage– Pressure sensor : measure pressure using piezoresistive strain gage
Chapter 3. Health Sensing for PHM
Measured resistance form circuit
Insensitive to lateral force
Tension increased resistance
Rosette strain gagefor 2D

Seoul National University2019/1/4 - 26 -
4. Sensor ClassificationPoint Sensor – Electrical Sensors• Thermocouple
– Purpose : measure the temperature difference between two positions– Principle : produce a temperature-dependent voltage as a result of Seeback effect and
this voltage can be interpreted to temperature
• Capacitance Sensor and Water Absorption Detector– Capacitance sensor : measure capacitance of conductive or dielectric material– Water absorption detector : measure the moisture of insulators by capacitance change
Chapter 3. Health Sensing for PHM
c
Metal 2
Metal 1
JunctionVoltage
𝛻𝛻𝑉𝑉 = −𝑆𝑆(𝑇𝑇)𝛻𝛻𝑇𝑇Seeback Effect
𝑉𝑉 = �𝑇𝑇𝑟𝑟𝑒𝑒𝑒𝑒
𝑇𝑇𝑠𝑠𝑒𝑒𝑠𝑠𝑠𝑠𝑒𝑒𝑆𝑆+ 𝑇𝑇 − 𝑆𝑆− 𝑇𝑇 𝑑𝑑𝑇𝑇

Seoul National University2019/1/4 - 27 -
4. Sensor ClassificationPoint Sensor – Optic Sensors• Optical Microphones
– Purpose : measure the acoustic (sound) pressure – Principle : measure changes in light intensity reflected from an vibrating membrane
fluctuating sound waves and transform these into sound signal
• Light Sensor and Laser-based Gas Sensor– Light sensor : measure the intensity or brightness of light– Laser-based gas sensor : defect and quantify gases from absorption of energy of light
Chapter 3. Health Sensing for PHM
Membrane
Light source
Photo detector

Seoul National University2019/1/4 - 28 -
4. Sensor ClassificationDistributed Sensor – 1D• Time Domain Reflectometry (TDR)
– Purpose : characterize faults and these location in metallic cables– Principle : transmit an incident signal onto the conductor and measure the condition of
reflected signal considering the impedance mismatch
• Fiber Bragg Grating (FBG) Sensor and Fiber Optic Interferometer– FBG sensor : measure the vibration using the reflected wavelength of light caused by
bragg scattering and deformed cable (raman scattering)– Fiber optic interferometer : measure temperature from optical phase difference (Rayleigh)
Chapter 3. Health Sensing for PHM
Pulse generator
Oscillo-scope
Reflected
Incident
Reflectedafter strain
Transmitted
Transmittedafter strain
Unstrained FBG
Strained FBG
Optical fiber
Metal
Transparent temperature sensitive layer
Phase difference

Seoul National University2019/1/4 - 29 -
4. Sensor ClassificationDistributed Sensor – 2D and 3D• Laser Doppler Vibrometer (LDV)
– Purpose : measure the acceleration, velocity and displacement and image these– Principle : the laser from the LDV is directed and the information of vibration is
extracted from the Doppler shift of the reflected laser beam frequency
• Thermographic Camera and Acoustic Camera – Thermographic camera : form images using radiation for finding overheating part– Acoustic camera : visualize the pressure field for characterizing the location and
amplitude of sound sources
Chapter 3. Health Sensing for PHM
Moving target
Scanning mirrors
Laser vibrometerHigh speed
camera
Laser line dielectric mirror
Moving target

Seoul National University2019/1/4 - 30 -
4. Sensor ClassificationDistributed Sensor – 2D and 3D• Acoustic Emission (AE) Testing and Sensor
– Purpose : detect faintest surface movements of elastic waves released from fractures and find the location of these
– Principle : piezoelectric effect and triangulation
• Metal Particle Counter and Ground Penetrating Radar Testing– Metal particle counter : detect and count metal particles from wear– Ground penetrating radar testing : image the subsurface using electromagnetic radar
Chapter 3. Health Sensing for PHM
Sensor 3
Sensor 1
Sensor 2
+ + + + +
– – – – –PZTMetal
Elastic waves
Electrical signals
Seoul National University2019/1/4 - 31 -
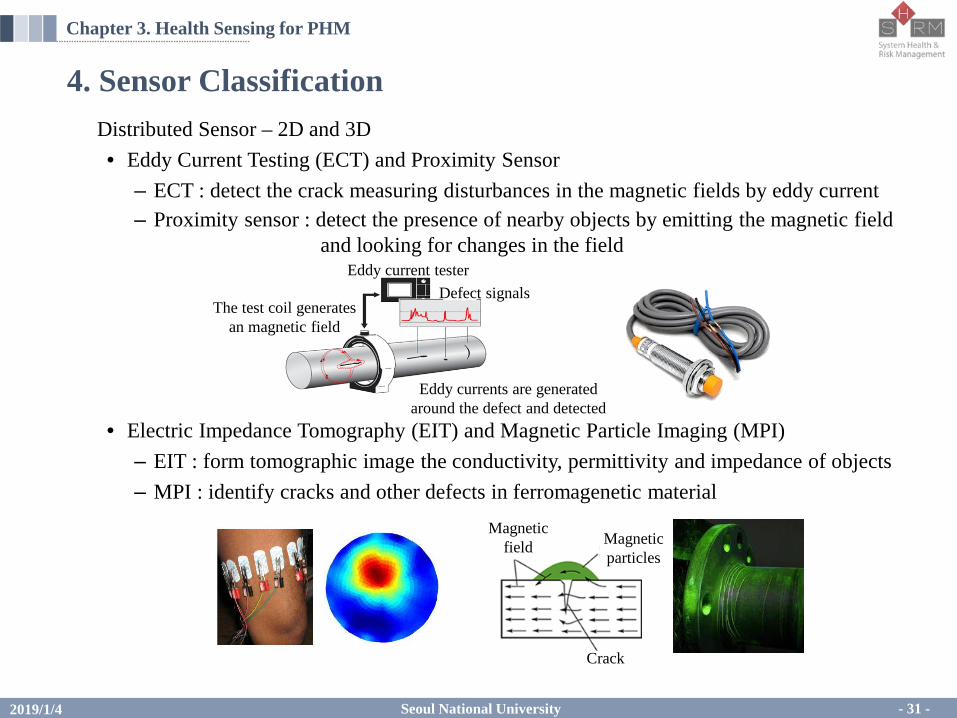
4. Sensor ClassificationDistributed Sensor – 2D and 3D• Eddy Current Testing (ECT) and Proximity Sensor
– ECT : detect the crack measuring disturbances in the magnetic fields by eddy current– Proximity sensor : detect the presence of nearby objects by emitting the magnetic field
and looking for changes in the field
• Electric Impedance Tomography (EIT) and Magnetic Particle Imaging (MPI)– EIT : form tomographic image the conductivity, permittivity and impedance of objects– MPI : identify cracks and other defects in ferromagenetic material
Chapter 3. Health Sensing for PHM
Defect signalsEddy current tester
The test coil generates an magnetic field
Eddy currents are generated around the defect and detected
Crack
Magnetic particles
Magnetic field
Seoul National University2019/1/4 - 32 -
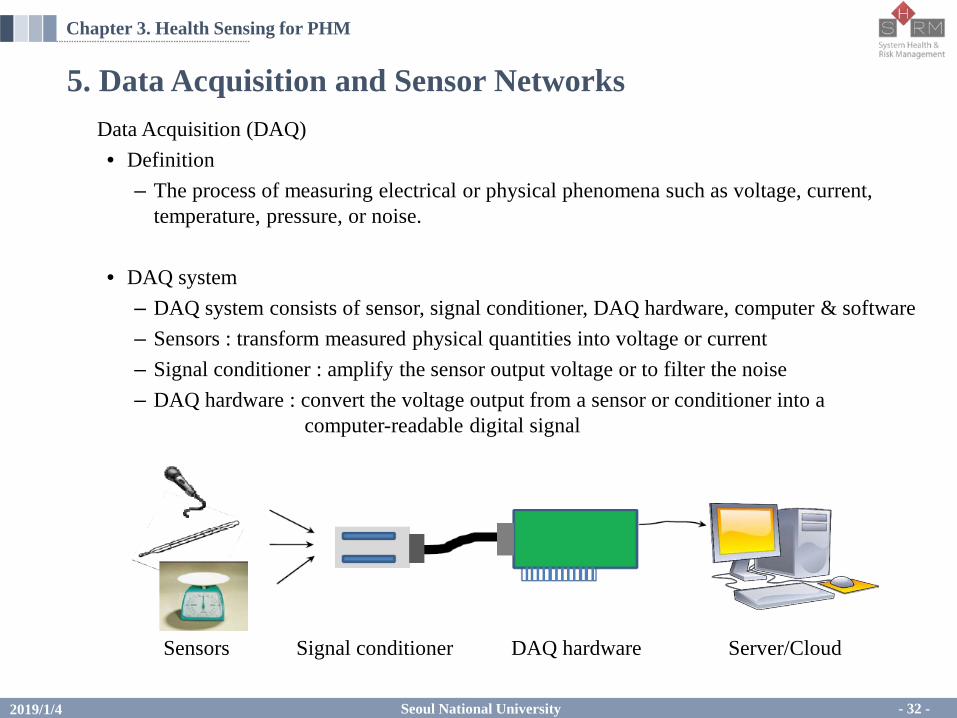
5. Data Acquisition and Sensor NetworksData Acquisition (DAQ) • Definition
– The process of measuring electrical or physical phenomena such as voltage, current, temperature, pressure, or noise.
• DAQ system– DAQ system consists of sensor, signal conditioner, DAQ hardware, computer & software– Sensors : transform measured physical quantities into voltage or current– Signal conditioner : amplify the sensor output voltage or to filter the noise– DAQ hardware : convert the voltage output from a sensor or conditioner into a
computer-readable digital signal
Chapter 3. Health Sensing for PHM
Sensors Signal conditioner DAQ hardware Server/Cloud
Seoul National University2019/1/4 - 33 -
5. Data Acquisition and Sensor NetworksData Acquisition (DAQ) • Functions of DAQ Hardware
– Analog input : measure analog signals (e.g. oscilloscope)– Analog output : analog signal generation and output (e.g. function generator)– Digital input : measure digital signals– Digital output : digital signal generation and output– Counter input : measure frequency, cycle, number of digital pulse– Counter output : digital pulse generation and output function
• Analog-to-Digital Converter (ADC)– Since computers recognize digital signals, analog signals must be converted to digital
signals. – Resolution of ADC : A measure of how precisely an analog value is decomposed when
the ADC converts an analog signal to a digital signal– The higher the number of bits, the better the resolution– The better the resolution, the more accurately converted to a digital value– Ex) If analog input range 0 ~ 10V,
1 bit ADC: divide into two values (e.g. 0V or 5V)n bit ADC: divide into 2n values
Chapter 3. Health Sensing for PHM

Seoul National University2019/1/4 - 34 -
5. Data Acquisition and Sensor NetworksData Acquisition (DAQ) • Analog-to-Digital Converter (ADC)
– To collect the signal with the maximum resolution, the ADC’s range of use is properly set according to the range of the input signal.
– Ex) Resolution difference according to input range of ADCcase1: 0 ~ 10 V analog input, 3 bit ADCcase2: -10 ~ 10 V analog input, 3 bit ADC
Chapter 3. Health Sensing for PHM
10.00
0
8.75
7.50
6.25
5.00
3.75
2.50
1.25
Time (μs)
Am
plitu
de (V
)
111
110
101
100
011
010
001
000
2000 50 100 150
110
10.00
-10.00
7.50
5.00
2.50
0
-2.50
-5.00
-7.50
Time (μs)
Am
plitu
de (V
)
111
101
100
011
010
001
000
2000 50 100 150
Case 1 Case 2

Seoul National University2019/1/4 - 35 -
5. Data Acquisition and Sensor NetworksSensor Networks • Definition
– Distributed networks of small and lightweight sensors to monitor engineered system
• Components in Sensor Networks– Assembly of distributed or localized sensors– Central point of information clustering– Set of computing resources at the central point to handle data correlation and data
mining
• Networked vs Individual Sensors– Extended range of sensing : Cover a wider area of operation– Redundancy : Multiple nodes close to each other increase fault tolerance– Improved accuracy : Sensor nodes collaborate and combine their data to increase the
accuracy– Extended functionality : Sensor nodes can not only perform sensing functionality, but
also provide forwarding service
Chapter 3. Health Sensing for PHM
Seoul National University2019/1/4
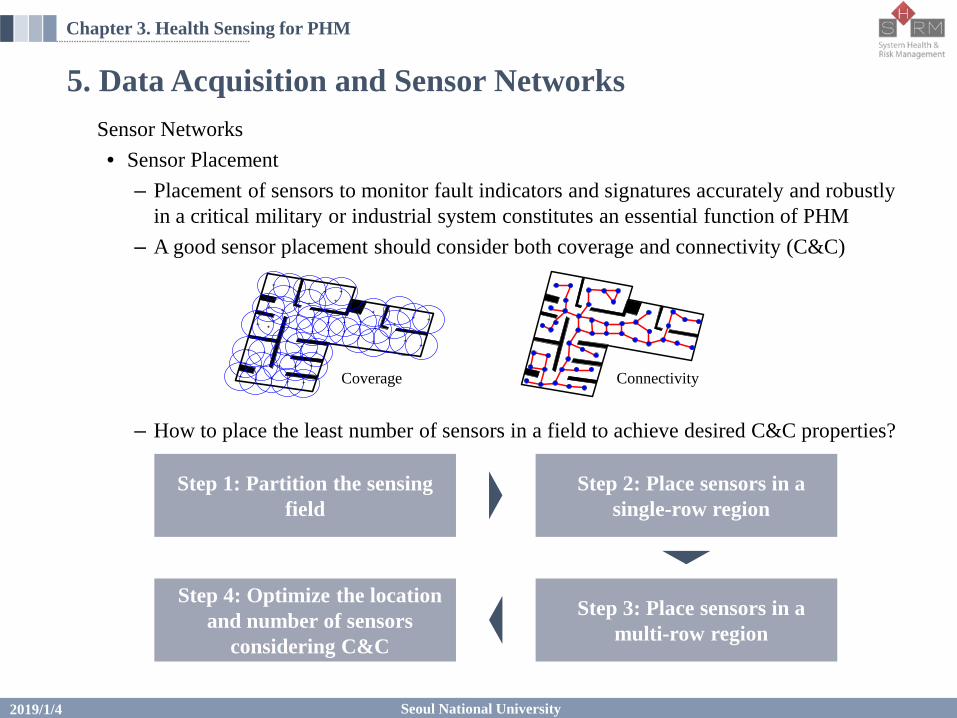
5. Data Acquisition and Sensor NetworksSensor Networks • Sensor Placement
– Placement of sensors to monitor fault indicators and signatures accurately and robustly in a critical military or industrial system constitutes an essential function of PHM
– A good sensor placement should consider both coverage and connectivity (C&C)
– How to place the least number of sensors in a field to achieve desired C&C properties?
Chapter 3. Health Sensing for PHM
+ +
+
++
++ +
+
+
+ + ++
+ + + ++
+ + + ++ +
++ +
+
+
++ +
++
++
+ + +
+ + +++
+
++
+
Coverage Connectivity
Step 1: Partition the sensing field
Step 2: Place sensors in a single-row region
Step 3: Place sensors in a multi-row region
Step 4: Optimize the location and number of sensors
considering C&C

Seoul National University2019/1/4 - 37 -
5. Data Acquisition and Sensor NetworksWireless Sensor Networks (WSN)• Definition
– Wireless network consisting of spatially distributed autonomous device using sensors to monitor physical or environmental conditions
• Characteristics of WSN– Robust in harsh and hostile environments where wired sensors can’t be deployed– Scalable and dense WSN construction for PHM – Low cost and computational power– Ability to cope with sensor nodes failure (→Resilience)– Power consumption constraints for sensor nodes (→Energy Harvesting)
• Applications of WSN– Structural health monitoring– Internet of Things (IoT)– Cyber Physics System (CPS)– Smart factory
Chapter 3. Health Sensing for PHM

Seoul National University2019/1/4 - 38 -
6. Case Study: Wind Turbine Main Bearing & GearboxSensor Type – Accelerometer, Tachometer, Thermometer, Particle sensor, …• Characteristics
– Need to consider load transfer paths for locating sensors
• Standard– IEC 61400-25, ISO 10816-21, …– Specify the measurement target, location,
type, method, …
Chapter 3. Health Sensing for PHM
- 38 -
Transfer path 2
Transfer path 1Transfer path 3
Accelerometer
Gearbox
Generator
GearboxMainbearing
Revolving motor
Control cabinet
Target Location Type
Gearbox
Input bearing axial, radial Acceleration
Output bearing axial, radial Acceleration
Oil cleanliness Particle count
Mainbearing
Axial, radial Acceleration
Rotational RPM

Seoul National University2019/1/4 - 39 -
6. Case Study: Overhead Transport (OHT)Sensor Type – Current sensor and Encoder embedded in a servo drive• Characteristics
– Hard to install health-relevant sensors (e.g., accelerometer)– Complicated operating conditions (e.g., straight, stepped, branch, …)
• Acquire control signals originally measured for feedback control purpose– Command torque calculated by current– Speed calculated by encoder – One wireless DAQ per OHT vehicle
Chapter 3. Health Sensing for PHM
- 39 -
OHT Vehicle
OHT Vehicle
OHT System
Spee
dTo
rque
time

Seoul National University2019/1/4 - 40 -
6. Case Study: Power GeneratorSensor Type – Wet Bar Detector (Water Absorption Detector)• Measuring the capacitance of the ground wall insulation• Estimating the extent of water penetration indirectly; WET insulation ⇨ HIGH
capacitance• Non-destructive to the stator bar• Measurement procedure:
– Clean the bars to assure proper contact before the test– Attach the probe to bars within three-inch of the bar armor– Measure the capacitance on given points
Chapter 3. Health Sensing for PHM
- 40 -
Out
Top
In
OutIn
@ Collected End (CE) @ Turbine End (TE)
Out
Top
In3-capacitance 3-capacitance
2-capacitance 2-capacitance
OutIn
Total 10-capacitance
Output𝜀𝜀𝑟𝑟: Relative static permittivity
𝜺𝜺𝒘𝒘𝒘𝒘𝒘𝒘𝒘𝒘𝒘𝒘 : 80.4𝜺𝜺𝒎𝒎𝒎𝒎𝒎𝒎𝒘𝒘 : 5.6 - 6.0
𝜀𝜀0: Electric constant(~ 8.854x10⁻¹² F/m)
A: Area of testert : Thickness of insulation
Irregular measurement: Once every 2 or 3 years;
0rACt
ε ε=
Capacitance [pF]

Seoul National University2019/1/4 - 41 -
6. Case Study: Steam Turbine Rotor
Chapter 3. Health Sensing for PHM
CCW
45⁰45⁰X-axisY-axis
Distance
Current
Linear
Coil System (inside)
MagneticField
Eddy Current
Test Specimen
- 41 -
X-
axis
Y-
axis
0 1 2 3 4 50
5
10
Order(frequency)
|Y(f
)|
Bode Plot FFTOrbit Plot
-20 -10 0 10 20
-20
-10
0
10
20
( )
㎛ )
0 100 200 300-1
-0.5
0
0.5
1
Degree
0 100 200 300-1
-0.5
0
0.5
1
Degree
Time-base Plot
0 1000 2000 3000 40000
50
100
|Y|(㎛ )
0 1000 2000 3000 4000-300
-200
-100
0
RPM
Pha
se(d
eg)
Sensor Type – Proximitor Sensor• Characteristics
– Gap measurement sensor using eddy current variation
– 0.1 μm unit resolution & high accuracy– AC & DC measurement
• Data Acquiring Method– 2 sensors in 90 deg. to sense each axis
behavior– Max / Min value limited by linear
correlation of voltage and displacement• Acquired Data
– Two raw signals from a position

Seoul National University2019/1/4 - 42 -
Chapter 3. Health Sensing for PHM
Reflected
Sent
Leakage
Temp. sensor (RTD)
Pressuregauge
Test bed for OTDR verification test
6. Case Study: Smart LNG PlantsSensor Type – OTDR Test Equipment
OTDR Test Setting• OTDR : MTS8000 (JDS Uniphase Corporation)• Optical Fiber : Single mode bare (Helically Installed)• Fiber Length : 1134m• Point Sensors : 3 pressure gauges, 5 RTDs• Inner flow : Dry ice (approx. -45°C)

Seoul National University2019/1/4 - 43 -
6. Case Study: Power Transformer (1)Sensor Type – Accelerometer
Data Acquisition
Chapter 3. Health Sensing for PHM
- 43 -
Power Transformer• Single phase• Shell type• About 1000 MVA• Oil-filled
Accelerometer• Charge-type• Magnet mount
Frequency-domain signal
0 500 1000 1500 20000
0.5
1
1.5
2
2.5
3
3.5
X: 120Y: 3.33
X: 240Y: 0.7207
X: 360Y: 0.3368
Frequency (Hz)
Vel
ocity
(mm
/sec
)
Time-domain signal
Vel
ocity
(mm
/sec
)
Impossible to install sensors inside
Detecting propagated vibration through oil
36~112 sensors/transformer Signals at every 1.25Hz
(0~2kHz)
Seoul National University2019/1/4 - 44 -
Chapter 1. Introduction
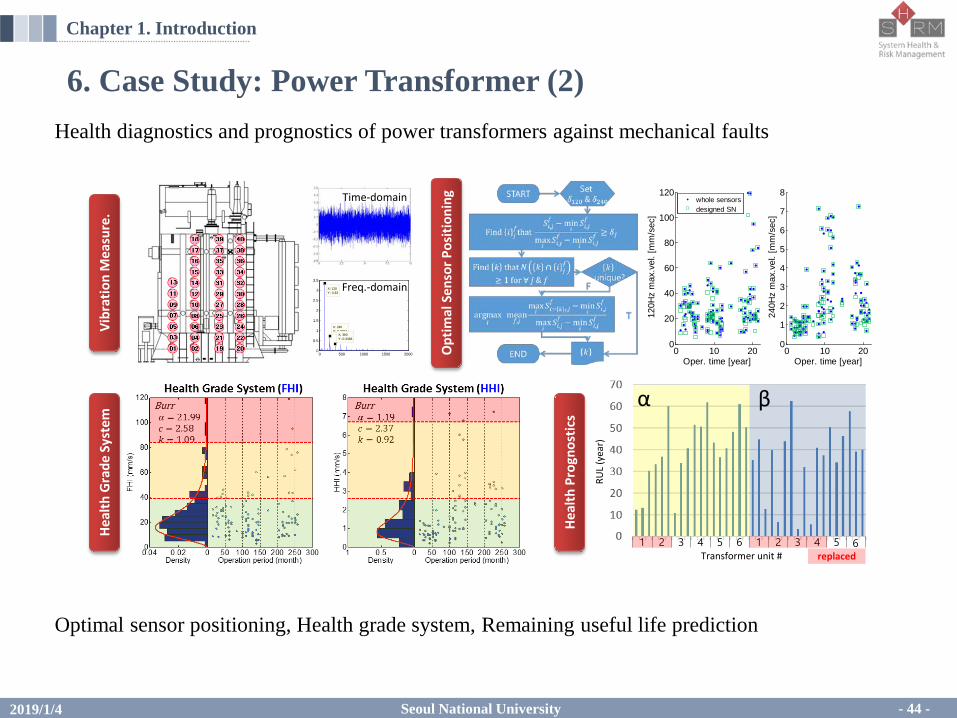
Health diagnostics and prognostics of power transformers against mechanical faultsVi
brat
ion
Mea
sure
.He
alth
Gra
de S
yste
m
0 10 200
20
40
60
80
100
120
Oper. time [year]
120H
z m
ax.v
el. [
mm
/sec
]
0 10 200
1
2
3
4
5
6
7
8
Oper. time [year]
240H
z m
ax.v
el. [
mm
/sec
]
whole sensorsdesigned SN
α β
1 2 3 654 1 2 3 654replaced
RUL
(yea
r)
Transformer unit #He
alth
Pro
gnos
tics
Opt
imal
Sen
sor P
ositi
onin
gTime-domain
0 500 1000 1500 20000
0.5
1
1.5
2
2.5
3
3.5
X: 120Y: 3.33
X: 240Y: 0.7207
X: 360Y: 0.3368
Freq.-domain
6. Case Study: Power Transformer (2)
Optimal sensor positioning, Health grade system, Remaining useful life prediction

Seoul National University
THANK YOUFOR LISTENING
2019/1/4 - 45 -
Seoul National University2019/1/4 - 46 -
Reference
Reference [1] S. C. Mukhopadhyay, New Developments in Sensing Technology for Structural Health
Monitoring, Springer, 2011.[2] G. Vachtsevanos et al., Intelligent Fault Diagnosis and Prognosis for Engineering
Systems, John Wiley & Sons, 2006.[3] D. Hustion, Structural Sensing, Health Monitoring, and Performance Evaluation, CRC
Press, 2011.[4] D. E. Adams, Health Monitoring of Structural Materials and Components, Press, John
Wiley & Sons, 2007.[5] T. G. Beckwith, Mechanical Measurements, Pearson Education, 2007.[6] D. J. Inman, Engineering Vibrations, Pearson Education, 2008.[7] Amirat, Yassine, et al. "A brief status on condition monitoring and fault diagnosis in
wind energy conversion systems." Renewable and sustainable energy reviews 13.9 (2009): 2629-2636.
[8] Feng, Zhipeng, and Ming J. Zuo. "Vibration signal models for fault diagnosis of planetary gearboxes." Journal of Sound and Vibration 331.22 (2012): 4919-4939.