Chapter 3 Growth of Ayurvedic Industry in...
31
52 Chapter 3 Growth of Ayurvedic Industry in Kerala The events that occurred at the national level regarding the evolution and revival of Ayurveda had its traces in Kerala also. The revitalisation of Ayurveda in Kerala is the story of the establishment of a legend in health care. The revitalization process began in a small town Kottackkal, near Calicut in the Northern Kerala. Panniyinpalli Sankunni Warrier was born into an orthodox but talented family of temple service caste. The family had the reputation of good Ayurvedic physicians. He was given formal training in Ayurveda, at the time when western medicine was gaining acceptance in Kottackkal. He was eager to learn western medicine but the chief handicap was the language which he learned from a native doctor who had mastered English. He was liberal and catholic in his outlook. His house was open to people of all caste and creed. Soon Warrier became well accepted. This visionary realised the poor state of Ayurveda and formed the Arya Vaidya Samajam (meaning association) in 1902. It was a formal gathering of Ayurvedic physicians. Samajam helped to exchange views and experiences and soon became a platform for the revitalisation movement and was perhaps the first public body for this cause in Kerala (Panikkar, 2002). It aimed at a creative introspection of Ayurveda both its past and present. The Samajam meetings had two dimensions which included general speeches and secondly reading papers that led to more professional discussions on illness, treatment and medicine. Samajam was thus successful in bringing together uncodified experiences and innovations in Ayurveda. The deliberations in the Arya Vaidya Samajam took efforts to preserve the stagnation of knowledge and for this
Transcript of Chapter 3 Growth of Ayurvedic Industry in...
52
Chapter 3
Growth of Ayurvedic Industry in Kerala
The events that occurred at the national level regarding the
evolution and revival of Ayurveda had its traces in Kerala also. The revitalisation of
Ayurveda in Kerala is the story of the establishment of a legend in health care. The
revitalization process began in a small town Kottackkal, near Calicut in the Northern
Kerala. Panniyinpalli Sankunni Warrier was born into an orthodox but talented
family of temple service caste. The family had the reputation of good Ayurvedic
physicians. He was given formal training in Ayurveda, at the time when western
medicine was gaining acceptance in Kottackkal. He was eager to learn western
medicine but the chief handicap was the language which he learned from a native
doctor who had mastered English. He was liberal and catholic in his outlook. His
house was open to people of all caste and creed. Soon Warrier became well
accepted. This visionary realised the poor state of Ayurveda and formed the Arya
Vaidya Samajam (meaning association) in 1902. It was a formal gathering of
Ayurvedic physicians. Samajam helped to exchange views and experiences and soon
became a platform for the revitalisation movement and was perhaps the first public
body for this cause in Kerala (Panikkar, 2002).
It aimed at a creative introspection of Ayurveda both its past and
present. The Samajam meetings had two dimensions which included general
speeches and secondly reading papers that led to more professional discussions on
illness, treatment and medicine. Samajam was thus successful in bringing together
uncodified experiences and innovations in Ayurveda. The deliberations in the Arya
Vaidya Samajam took efforts to preserve the stagnation of knowledge and for this
53
they began to publish the classified texts in regional languages. This was of great use
to the people in this profession. By the end of nineteenth century there were as many
as fifty medical journals in Indian languages. Sankunni Warrier himself wrote books
in Malayalam about various dimensions of Ayurveda. The mouthpiece of the
revitalisation process in Kerala began in 1903 with the publication of a fortnightly
journal called Dhanwantari in 1903. This process of retrieval became more
successful with the establishment of some institutional infrastructure for the teaching
of Ayurveda. Keeping this in mind, Pathasala (meaning school) was started with an
aim to bring about timely changes, to train physicians and to acquaint the British
government the about the merits of indigenous system (Varier, 2002). The education
was free was open to all without any caste or a gender barriers.
The establishment of Pathasala stimulated the revitalisation
process. It became an important event in the intellectual-cultural life of Kerala and
emerged as a pioneering institutional effort to reach out to western knowledge from
a strong rooted tradition (Panikkar, 2002). Warrier realised that Ayurveda could be
effective and popular only if its medicines were standardised and prepared in
accordance with textual prescription. This was possible only if practitioners took
initiative to form companies and took steps for marketing. The popularity and
effectiveness of western medicine was largely dependent on its easy availability in
accordance with the prescription of doctors. Warrier emulated this practice. With
this view he established the Arya Vaidya Sala (hereafter AVS) in Kottackkal in the
Malappuram District of Kerala in 1902. This was the landmark in the Ayurvedic
medicine manufacturing sector of Kerala. AVS prepared medicines on modern and
scientific lines and marketed them on a commercial basis. The sale of medicine in
54
AVS was moderate in the beginning. The history of the Ayurvedic industry in the
state changes its direction here.
In Kerala, the efforts for small scale production actually began in
1900 at Trichur District of Kerala by Immatty who belonged to a well reputed
Catholic family. They had physicians in their family. All medicines except
Kashayam was prepared and bottled in their shop. Immatty catered the needs of
people in this areas and South Kerala. The land mark in the Ayurvedic Medicine
manufacturing was already set with the establishment of the AVS, Kottakkal. The
Pathasala that the AVS formed was a workshop for many enthusiastic
manufacturers to begin the process of bulk production.
The manufacturing process till the middle of the 20th
century was
undertaken by the practicing Ayurvedic physicians who had there own personal
pharmacies in their clinics preparing necessary medicines exclusively for their
patients (not for open sale). As they had to show results of these medicines to their
patients, they produced good quality medicines. The growing acceptability of these
physicians earned patients from far away places. It was difficult for the patients to
travel too long to consult their vaidhyars and collect medicines. This growing
demand for the medicines forced the companies to establish agencies as retail outlets
throughout the State. This was the beginning of the agency sale in Kerala. In Kerala
sale of Ayurvedic medicines through agencies was initiated by AVS. This channel of
distribution is still followed in Kerala.
As agency sales got widely accepted the clinic pharmacies declined.
Unlike allopathic medicines Ayurvedic medicines were not popularly sold through
private dispensaries in early days. When the demand for the medicines increased it
became impossible for the manufacturing units to meet the growing demand. This
55
forced the firms to think of large scale production by means of capital intensive
techniques. AVS initiated the mechanisation era with the initiation of AC generator
in 1949 and a counter line grinding system with 12 grinders in 1952 (Varier, 2002).
However the pace of mechanisation was not rapid. It is also essential to understand
the catalysing factors that contributed to the growth of the industry. This is dealt
with in the succeeding section.
3.1 Factors Contributing to the Growth of Ayurvedic Industry in the State
The preceding section of the chapter dealt with the evolution and
transition of Ayurvedic drug manufacturing process. One of the major factors that
contributed to the fast growth of the industry is the spontaneous growth of the health
care infrastructure. Hence a discussion of the health care infrastructure in the state
appears to be essential. The following section attempts to pinpoint this aspect.
3.1.1 Health Care Infrastructure and its Dimensions.
The sustainability and success of any health care system depends
upon the efficiency and quality of infrastructure provided to support it. However
efficient the health care system is, it cannot be useful in the absence of a support
system to hold and foster it. According to the Indian Constitution the expenditure
responsibility relating to the social sector and economic infrastructure are largely
assigned to the state Governments. Enhancing human development levels requires
state to set up their expenditure on key services like health education along with
improving delivery mechanism of public services to obtain desired outcomes. And
the imperfect nature of the health services is often regarded as a reason to justify
government intervention. Government intervention is justified because health
service market is the closest approximation of perfectly competitive equilibrium
(Arrow,1963). The decisions taken by the government is the outcome of a
56
bargaining process which reflects the collective public choices and private interest
of a few (James et al., 1990). In this process those who have stronger role in
decision making succeeds in negotiating a greater share to their side (Sadanandan,
2001). This is true in the case of Ayurvedic heath care system. The government
allocations of budget funds have always gone in favour of allopathic system
(Aravindan and Kunhikannan, 2000). Thus while government intervention in health
care is advocated to prevent discrimination it is the same government involvement
that accentuated the discrimination.
Kerala‟s achievements in health care in the backdrop of low
economic development have been widely discussed among academicians and
researchers. Kerala model as it was called in the early past was extensively put in
research at national and international levels. One of the factors that are considered
responsible for this glory is the achievements the state has made in the field of
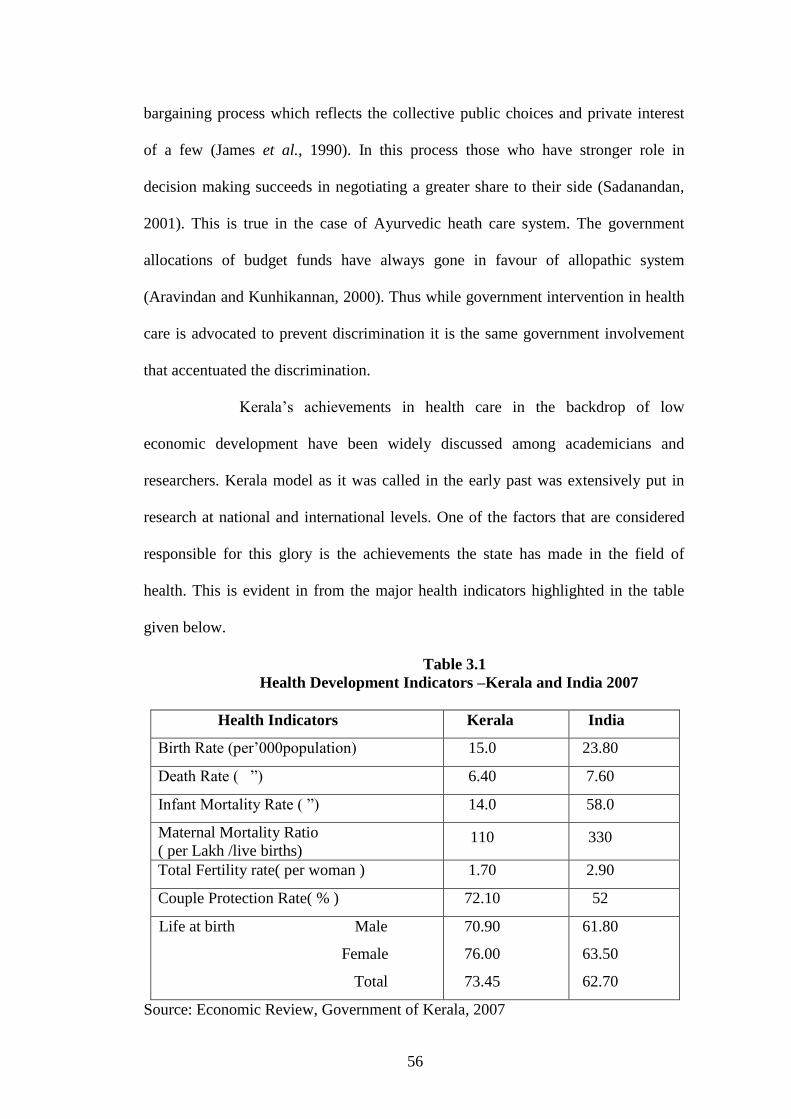
health. This is evident in from the major health indicators highlighted in the table
given below.
Table 3.1
Health Development Indicators –Kerala and India 2007
Health Indicators Kerala India
Birth Rate (per‟000population) 15.0 23.80
Death Rate ( ”) 6.40 7.60
Infant Mortality Rate ( ”) 14.0 58.0
Maternal Mortality Ratio
( per Lakh /live births) 110 330
Total Fertility rate( per woman ) 1.70 2.90
Couple Protection Rate( % ) 72.10 52
Life at birth Male
Female
Total
70.90
76.00
73.45
61.80
63.50
62.70
Source: Economic Review, Government of Kerala, 2007
57
It is evident from the table 3.1 that the accomplishment made by
Kerala are much ahead the rest of the state‟s and all India figures. Key factors
contributing to this success are high accessibility of health system at low cost, non
health contributions such as spread of education land reforms, public distribution
system of food and housing (Varatharajan et al., 2002) committed efforts of the
government etc. Among the factors the most striking would the state investment
decisions. An attempt to analyse the budget allocations of the state towards health
and the split of total health expenditure on various categories and institutions is
done in the succeeding section. The impact of these investments on the private
sector is also dealt with.
3.1.2 Budget allocations and Health Care Sector
In the pre independence period, Kerala consisted of princely kingdoms
of Travancore, Cochin and Malabar. In Travancore the provision of health care
services was considered as the duty of the state. Although the present state of Kerala
was formed in 1956, the good health status of the people existed prior to its existence.
The chief cause for this may be attributed to the existence of Ayurveda system of
health care which is native to Kerala. It was so prevalent in Kerala that people
approached the practitioners instead of going for self treatment. Even during those
days health care received due consideration in State‟s fiscal allocations. And the
increase in the supply of health care led to the increase in demand for the same. As the
state budget expanded there was a legitimate rise in the share of health.During1905-10
health care received 4.31 percent of the total share. Since 1960-65 there was a
phenomenal growth in budget allocations. During this period the all India allocation
for health was 8.30 percent of total budget allocation whereas it was 10.45 percent in
Kerala. These differences in investments allocations continued but with declining
58
trend. During 1991-95 while Kerala allocated 8.60 percent of its total expenditure for
health all India allotment was 8.12 percent (RBI Bulletin, 1995). It may be seen that
this falling share and resultant narrowing of gap between the state and all India is a
clear reflection of the mounting fiscal crisis of the state.
Education received the top priority in the state fiscal allocations
followed by health among social sectors. But the rate of growth pattern of
investments in education was not followed in the case of health. It may be
concluded that while education sector witnessed a phenomenal growth, the
investments in health showed only marginal increase. The trends show that there is
gradual withdrawal of government from health which resulted in the entry and
overall domination of the private sector in health care. Kerala has a long history of
organized health care and by the time of its formation a strong foundation for an
efficient health care system was well laid. Some medical colleges in the state are
about 150 years old (Varatharajan et al., 2002). Health has been a major item of
spending in the budget from early years. The annual growth rate of government
health care expenditure during the last three decades was 13.04 percent which was
more than the growth of Gross State Domestic Product , 9.81percent (Ramankutty,
1999). The budgetary share of health declined since 1980-81 from 6.95 percent to
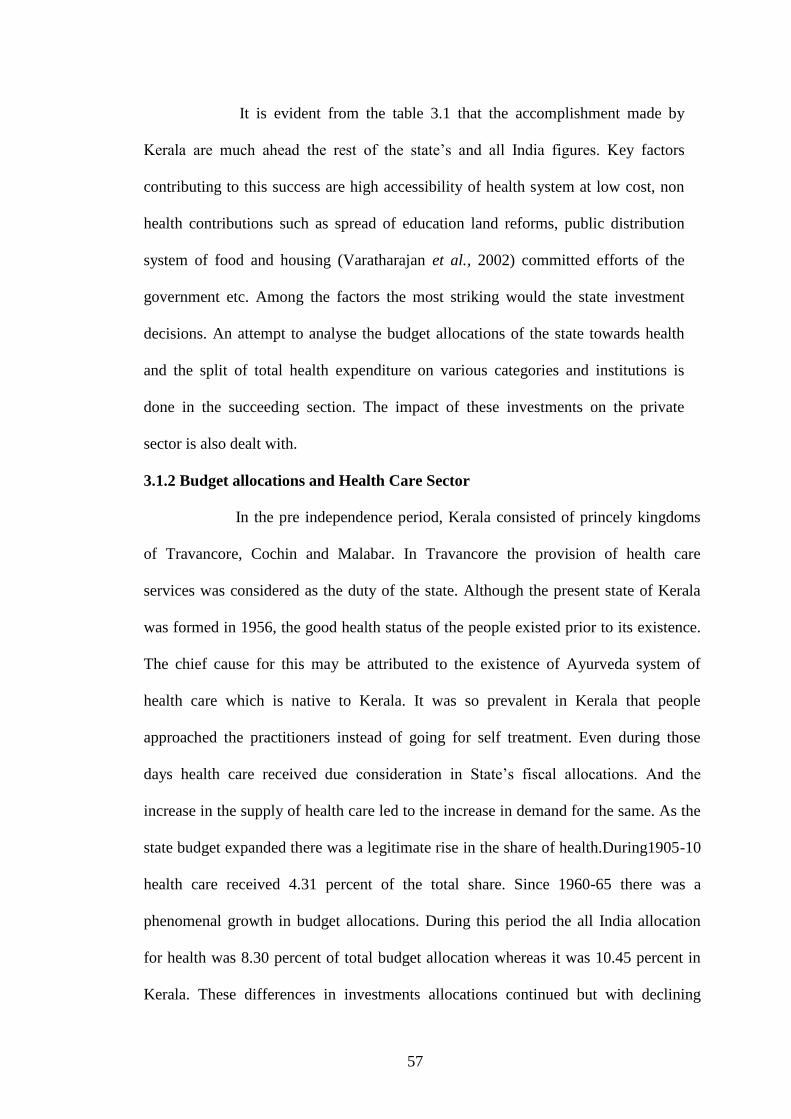
around 5 percent in 2000-01. As a percentage of the GSDP the figures are more
damaging as evident from table 3.2.
It is evident from the table that the health expenditure as a percent of
GSDP experienced a major contraction since 1999. However the share of education,
water supply and sanitation and social services (components other than health in
development expenditure) showed the tendency to revert the trend in spending in the
budget estimates of 2006-07, no such trend was witnessed in the case of health.
59
In spite of these disturbing trends Kerala has an elaborate and a well
equipped infrastructure for the development of health care. The succeeding section
examines this in detail.
Table 3.2
Share of Health as a Percentage of GSDP
Year Ratio of GSDP
1999-2000 1.14
2000-01 0.99
2001-02 1.04
2002-03 0.99
2003-04 0.96
2004-05 0.92
2005-06 1.03
2006-07(RE) 0.99
Source: State Finances: A Study of Budgets,
RBI, Various issues.
3.1.3 Healthcare infrastructure in Kerala
The health care system is the chief factor for the accomplishments in
health status. The health care facilities may be divided into three in view of service of
care: Allopathy, Ayurveda and Homeopathy and three categories in terms of ownership
–public private and cooperatives.
Kerala‟s healthcare infrastructure consists of 15,465
institutions, 1,20,258 beds and 27,165 doctors in the state (Economic Review, 2007).
While 39.4 percent of institutions, 85.3 percent of beds and 59.6 percent of doctors
60
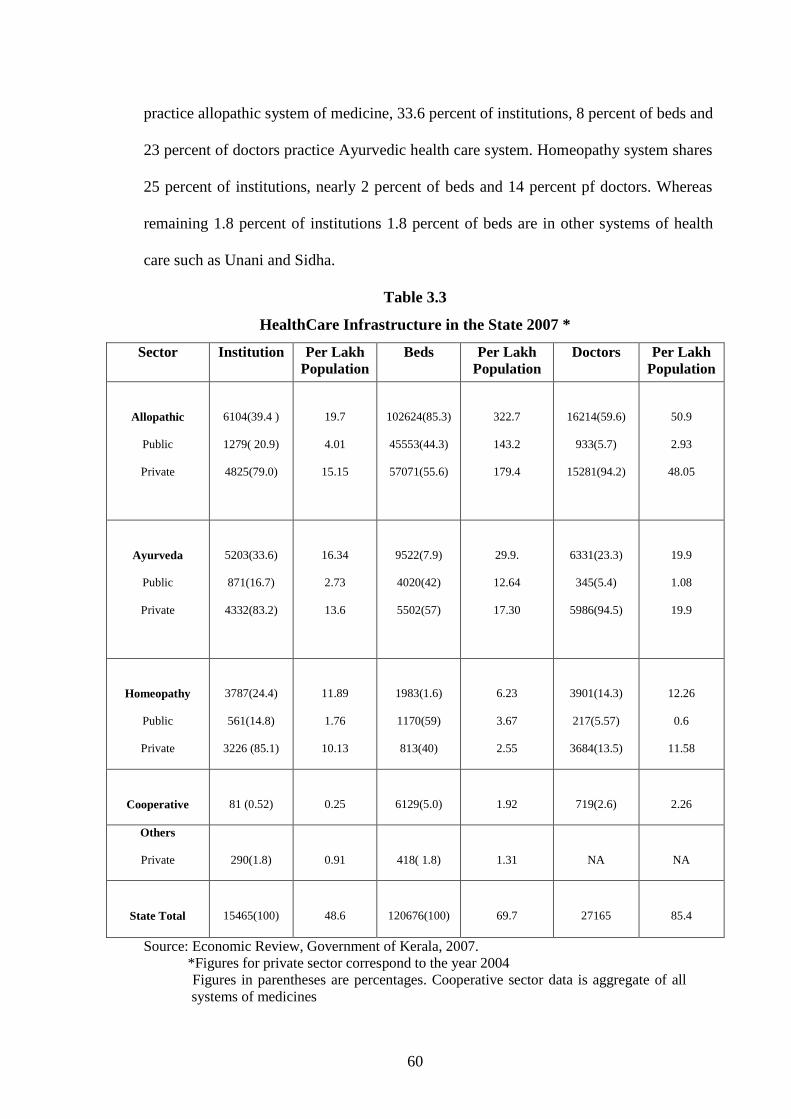
practice allopathic system of medicine, 33.6 percent of institutions, 8 percent of beds and
23 percent of doctors practice Ayurvedic health care system. Homeopathy system shares
25 percent of institutions, nearly 2 percent of beds and 14 percent pf doctors. Whereas
remaining 1.8 percent of institutions 1.8 percent of beds are in other systems of health
care such as Unani and Sidha.
Table 3.3
HealthCare Infrastructure in the State 2007 *
Sector
Institution Per Lakh
Population
Beds Per Lakh
Population
Doctors Per Lakh
Population
Allopathic
Public
Private
6104(39.4 )
1279( 20.9)
4825(79.0)
19.7
4.01
15.15
102624(85.3)
45553(44.3)
57071(55.6)
322.7
143.2
179.4
16214(59.6)
933(5.7)
15281(94.2)
50.9
2.93
48.05
Ayurveda
Public
Private
5203(33.6)
871(16.7)
4332(83.2)
16.34
2.73
13.6
9522(7.9)
4020(42)
5502(57)
29.9.
12.64
17.30
6331(23.3)
345(5.4)
5986(94.5)
19.9
1.08
19.9
Homeopathy
Public
Private
3787(24.4)
561(14.8)
3226 (85.1)
11.89
1.76
10.13
1983(1.6)
1170(59)
813(40)
6.23
3.67
2.55
3901(14.3)
217(5.57)
3684(13.5)
12.26
0.6
11.58
Cooperative
81 (0.52)
0.25
6129(5.0)
1.92
719(2.6)
2.26
Others
Private
290(1.8)
0.91
418( 1.8)
1.31
NA
NA
State Total
15465(100)
48.6
120676(100)
69.7
27165
85.4
Source: Economic Review, Government of Kerala, 2007.
*Figures for private sector correspond to the year 2004
Figures in parentheses are percentages. Cooperative sector data is aggregate of all
systems of medicines
61
Public sector commands control over 17 percent of institutions 44 percent
of beds and 5.6 percent of the doctors, while 82 percent of institutions 55 percent of beds
and 94 percent of doctors are in private sector. The remaining 0.52 percent of institutions
5 percent of beds and 2.6 percent of doctors is in the cooperative sector. The private
sector completely outstrips the public sector in terms of the number of institutions, beds
and practicing doctors. The public sector now has 2711 institutions, 50743 beds and
1495 doctors. Although 32 percent (16.7 percent Ayurveda and 14.8 percent
homeopathic) of public institutions practice Indian system of medicine, Allopathic
system controls over 79 percent of institutions, 44 percent of beds and over 92.7 percent
of doctors. Historically, the involvement of private sector in health care of Kerala was
provided by institutions such as mission hospitals which existed for a non – profit causes
(Kawasimha, 1998). But the present state of the mushrooming private sector, reveals that
it exist for a pure profit cause. The advancement in technology, the aging of the society
and the over health consciousness of the people have raised the cost of health care. At
the same time the fiscal crisis of the state had reached dangerous point leading to falling
share of health in the state budgets. This gave a space for the private sector to grow and
dominate the health care sector in Kerala.
Needless to say the fiscal crisis of the state has affected the quality of
health care provided in the public sector. Most of the people prefer private sector
because of the care provided by the public sector did not satisfy them. The shortage of
medicines, less availability of facilities, curt attitude of the health personnel, and lack of
cleanliness in the government owned medical institutions led to the growing demand for
private sector. It is believed that in Kerala demand for health is governed by the factors
more than ability to pay (Sankar, 2001). Further, more the underutilisation of the health
care infrastructure in the public sector, due to financial and managerial reasons has led
62
to the creation of idle capacity in the public sector which is estimated to be 12.3 percent
for doctors, 25.7 percent for nurses, 25.7 percent for beds, 53.2 percent for building
spaces and 59.3 percent for land. (Varatharajan et al., 2002). Thus it is clear from the
forgoing analysis that the trend and prospects in the health expenditure has laid down a
clear platform for the growth of Ayurvedic industry in the state. The gradual withdrawal
of the government from health care led to the upcoming of the private sector and this
augmented the emergence of large number of Ayurvedic medicine manufacturing units
in Kerala.
3.2 Structure of Ayurvedic Industry in Kerala
Normally Ayurvedic drug manufacturers in Kerala are classified into
two categories - organised and unorganised manufacturers. The organised sector can
be further classified into large scale manufacturers and small scale manufacturers.
Large scale manufacturers: are well established manufactures who
operate at national and international levels. They are the leaders in the industry who
bring dynamic changes into the industry. Large firms have the advantage of being
the torch bearers of the royal families who possessed mastery of Ayurveda. These
firms enjoy the goodwill and acceptance in the minds of the present day consumers.
They invest largely in R & D and are largely responsible for the revival and growth
of the Ayurvedic industry in the country. In terms of source of knowledge, nature
and process of drug discovery, product innovation, marketing, scientific
applications, fragmentation of markets, consumer categories and pricing they
resemble the allopathic pharmaceutical sector.
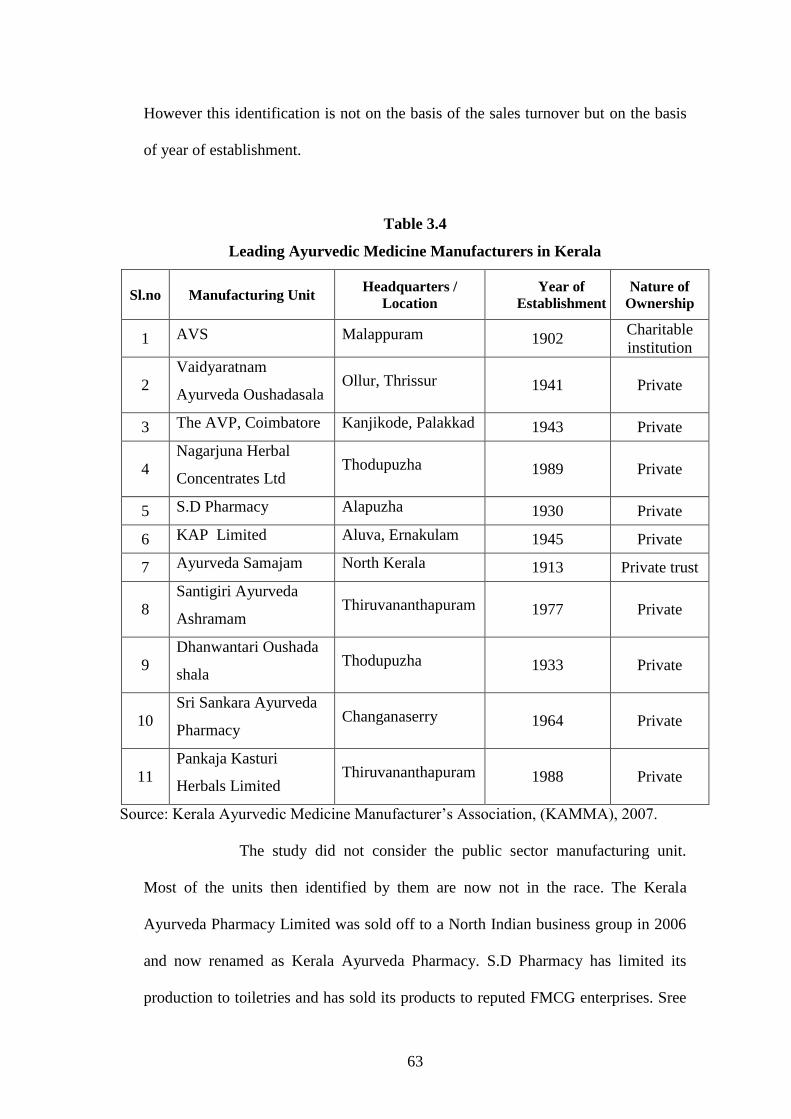
A study of the Ayurvedic industry conducted by EXIM Bank (2002)
and Kerala State Industrial Development Corporation (2004) identified 11 major
players in the State. The major players identified by the KSIDC are as follows.
63
However this identification is not on the basis of the sales turnover but on the basis
of year of establishment.
Table 3.4
Leading Ayurvedic Medicine Manufacturers in Kerala
Sl.no Manufacturing Unit Headquarters /
Location
Year of
Establishment
Nature of
Ownership
1 AVS Malappuram 1902 Charitable
institution
2
Vaidyaratnam
Ayurveda Oushadasala Ollur, Thrissur 1941 Private
3 The AVP, Coimbatore Kanjikode, Palakkad 1943 Private
4
Nagarjuna Herbal
Concentrates Ltd Thodupuzha 1989 Private
5 S.D Pharmacy Alapuzha 1930 Private
6 KAP Limited Aluva, Ernakulam 1945 Private
7 Ayurveda Samajam North Kerala 1913 Private trust
8
Santigiri Ayurveda
Ashramam Thiruvananthapuram 1977 Private
9
Dhanwantari Oushada
shala Thodupuzha 1933 Private
10
Sri Sankara Ayurveda
Pharmacy Changanaserry 1964 Private
11
Pankaja Kasturi
Herbals Limited Thiruvananthapuram 1988 Private
Source: Kerala Ayurvedic Medicine Manufacturer‟s Association, (KAMMA), 2007.
The study did not consider the public sector manufacturing unit.
Most of the units then identified by them are now not in the race. The Kerala
Ayurveda Pharmacy Limited was sold off to a North Indian business group in 2006
and now renamed as Kerala Ayurveda Pharmacy. S.D Pharmacy has limited its
production to toiletries and has sold its products to reputed FMCG enterprises. Sree
64
Sankara Pharmacy is now concentrating on the treatment side alone. Pankaja Kasturi
has focused its attention in the promotion of its branded product which has made
remarkable impact in the Ayurvedic sector of Kerala. The Pharmaceutical
Corporation (Indian Medicines) Kerala Limited (popularly known as Oushadi and
hereafter Oushadi) commenced in 1941 and registered as company in 1975 is the
largest producer of Ayurvedic medicines in the public sector in India.
Small scale manufactures: these firms operate in a particular
geographical area and produce a few specialised drugs. They are large in number but
contribute very marginally to the total production. Their production is mainly
household oriented1. They do not carry production on all days. Nonetheless they are
very strong in their area of operation.
The unorganised sector consists of small units owned and operated by
vaidhyars who are locally well accepted. They have rich clients and are always
approachable. They produce as per the need and do not face problems like
infrastructural constraints, procurement of medicines, mechanisation and other fiscal
formalities and regulations. The production process followed by them is very simple.
Most of the medicinal herbs needed for the preparation are grown in their own
premises or are locally bought. Their consumers have greater confidence in them
and they are not registered manufacturers their sales turnover is not officially known
but the total sales of the entire unorganised manufactures taken together will be
much larger than the sales of the large firms taken individually.
65
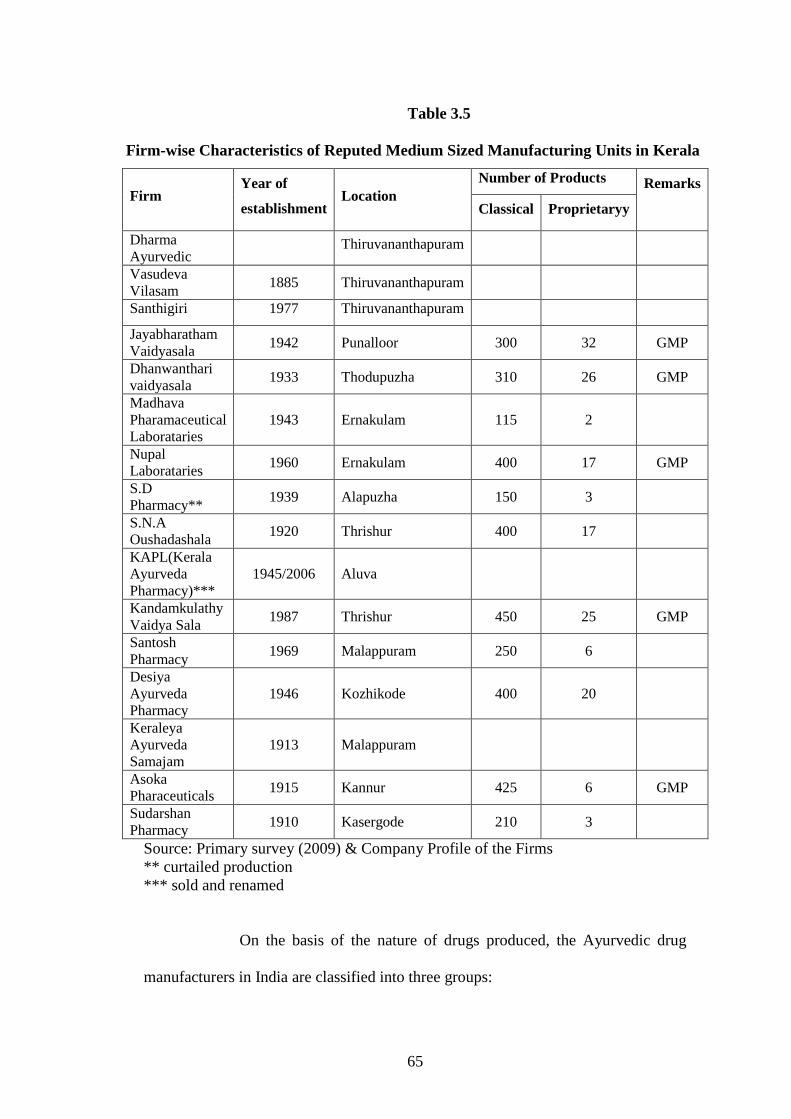
Table 3.5
Firm-wise Characteristics of Reputed Medium Sized Manufacturing Units in Kerala
Firm Year of
establishment Location
Number of Products Remarks
Classical Proprietaryy
Dharma
Ayurvedic Thiruvananthapuram
Vasudeva
Vilasam 1885 Thiruvananthapuram
Santhigiri 1977 Thiruvananthapuram
Jayabharatham
Vaidyasala 1942 Punalloor 300 32 GMP
Dhanwanthari
vaidyasala 1933 Thodupuzha 310 26 GMP
Madhava
Pharamaceutical
Laborataries
1943 Ernakulam 115 2
Nupal
Laborataries 1960 Ernakulam 400 17 GMP
S.D
Pharmacy** 1939 Alapuzha 150 3
S.N.A
Oushadashala 1920 Thrishur 400 17
KAPL(Kerala
Ayurveda
Pharmacy)***
1945/2006 Aluva
Kandamkulathy
Vaidya Sala 1987 Thrishur 450 25 GMP
Santosh
Pharmacy 1969 Malappuram 250 6
Desiya
Ayurveda
Pharmacy
1946 Kozhikode 400 20
Keraleya
Ayurveda
Samajam
1913 Malappuram
Asoka
Pharaceuticals 1915 Kannur 425 6 GMP
Sudarshan
Pharmacy 1910 Kasergode 210 3
Source: Primary survey (2009) & Company Profile of the Firms
** curtailed production
*** sold and renamed
On the basis of the nature of drugs produced, the Ayurvedic drug
manufacturers in India are classified into three groups:
66
1. Truly traditional manufacturers who produce proper Ayurvedic
medicines based on classic texts2. They are largely self-regulated, grown on the
basis of their merit and good will. They still consider production of Ayurvedic
medicines as ethical or holistic.
2. Firms that produce cosmetic and personnel care products3 they draw upon
the traditional knowledge without fully following them.
3. New entrants into the scene are firms producing patent products. They use
the textual sources and formulate medicines according to their R& D.
Majority of the firms operating in the state come under the first
category but there seem to be a fast rise in the number of firms indulged in the
making of cosmetic and patented products. The well established companies of
Ayurvedic medicines are strengthening this part of their operations (Banerjee, 2002).
3.3 Characteristics of Ayurvedic Industry in Kerala
The Ayurvedic Industry in the state possesses certain
characteristic features. These features are unique to Kerala.
1. Monopolistic in nature. The Ayurvedic industry in the state is a classic example for
monopolistic market structure. It implies that there are large number of producers
and large number of consumers for the Ayurvedic medicines. It follows product
differentiation to the extent that each producer produces textual medicines by
making minor modifications in the classical formulations. These differentiated
products are known as patented products or proprietary medicines. The patented
products are new formulations made on the basis of established Ayurvedic
knowledge.
2. High concentration. There is heavy geographical concentration of units in
Kerala. Majority of the units are located in north Kerala. 58 percent of the units in
67
1998, 45 percent in 2001 and 48 percent of the units in 2007 are located in north
Kerala. This concentration of industry may be ascribed to the availability of
medicinal plants, existence of qualified vaidhyars, recognition for Ayurvedic system
etc.
3. Traditional legacy. Majority of the units have a strong traditional knowledge of
Ayurveda which was richly inherited from their forefathers. This is evident from the
close observation of the units in Kerala. Even the new generation Ayurvedic firms
possess sound hereditary traits. This hereditary legacy has helped tremendously in
earning reputation and good will for the units. The respect for the traditional families
who practiced Ayurveda with a holistic approach was transmitted to their present
day torchbearers which are evident from their growing sales figures.
4. Medicinal plant market nexus. Like any other industry the Ayurvedic
manufacturing units in Kerala are closely knitted to those areas where there is easy
availability of medicinal herbs. The concentration of the units in north Kerala is
mainly credited to the supply of herbs from the Attapady, Badagara, Nilambur and
Wayanad forest regions, the focus of units lying in the central Kerala depend upon
the medicinal plant market in the high ranges of Idukki district and the units in the
south Kerala depend upon the tribal belt of the southern parts of Western Ghats
particularly from area such as Palode and Kottur market. This proximity to
medicinal plant market helps them to reduce the cost of transportation and easy and
timely availability of raw materials.
5. Private sector domination. The Ayurvedic industry in the State is dominated by
the private sector. There are only two public sector firms in the state, The
Pharmaceutical Corporation of Kerala Limited (Oushadi) and Ayurdhara4
established in 2000 operated by the Kerala State SC/ST Federation. These two units
68
supply Ayurvedic medicines to the government Ayurvedic hospitals, dispensaries
and clinics. Besides they have agencies within the state and outside. Among these
two units Oushadi is key public sector firm and that part of the demand unmet by
Oushadi is fulfilled by Ayurdhara.
6. Existence of a few large firms and too many small firms. Another unique
characteristic of the industry is the coexistence of a few large firms who produce
nearly 80 percent of the total Ayurvedic medicines and large number of small firms
who contribute marginally to the total output. This coexistence has created negative
effect on the very existence of the small firms.
7. Capital intensive. One of the major defects of the Ayurvedic industry in the past
was the traditional method of producing medicines. Mostly the medicines were
produced by the Vaidhyars using their hands and this was a reason for lesser
acceptance for Ayurvedic medicines especially in the West. This was replaced by
mechanised units. All the leading producers have well equipped machines and the
process of manufacture is well coordinated through skilled and trained labour.
However the contribution of capital to total product is not seen to be significant. The
traces of traditional methods of production are still seen among small scale
manufacturers.
8. Production in anticipation of demand. The production in this industry is in
anticipation of demand and not according to demand. The demand requirements
cannot be suddenly met because the preparation of medicines is a lengthy process
which involves preserving. It also depends upon the availability of raw materials.
Hence the total quantity to be produced is done on the basis of past demand and
future expectations.
69
9. Price differentials. Although the ingredients of the textual medicines are the
same for all manufactures the price of the product varies from firm to firm. These
price variations are mainly due to the differences in the size of the firm, the
economies in production enjoyed by the large firms. But the interesting aspect about
the industry is that these differences in price do not influence the consumer‟s
preference for a particular firm. Hence it may be inferred that it is the brand name
rather than the price that influences the consumer demand.
10. Family–owned business Ayurvedic medicine manufacturing companies
whether in organised or unorganised sector are mostly family owned business. The
origin of these units may be traced back to a vaidya who used to prepare medicines
for dispensing and gradual acceptance led to the growth of such units. Most of these
units are run by third generation members. This ownership pattern has led to transfer
knowledge from one generation to other thereby enriching the knowledge base of
the units.
3.4 Growth of Ayurvedic Industry in Kerala
The evolution and transition of Ayurvedic industry in the
state its structure and characteristics has been described in the earlier section. The
discussion on the Industry helps to get an overview of the industry. Needless to say
the Ayurvedic industry in the state has attained phenomenal growth over the years
both in terms of the real output employment, volume of sales etc. The succeeding
section attempts to portray the overall growth of the Ayurvedic industry in the state.
70
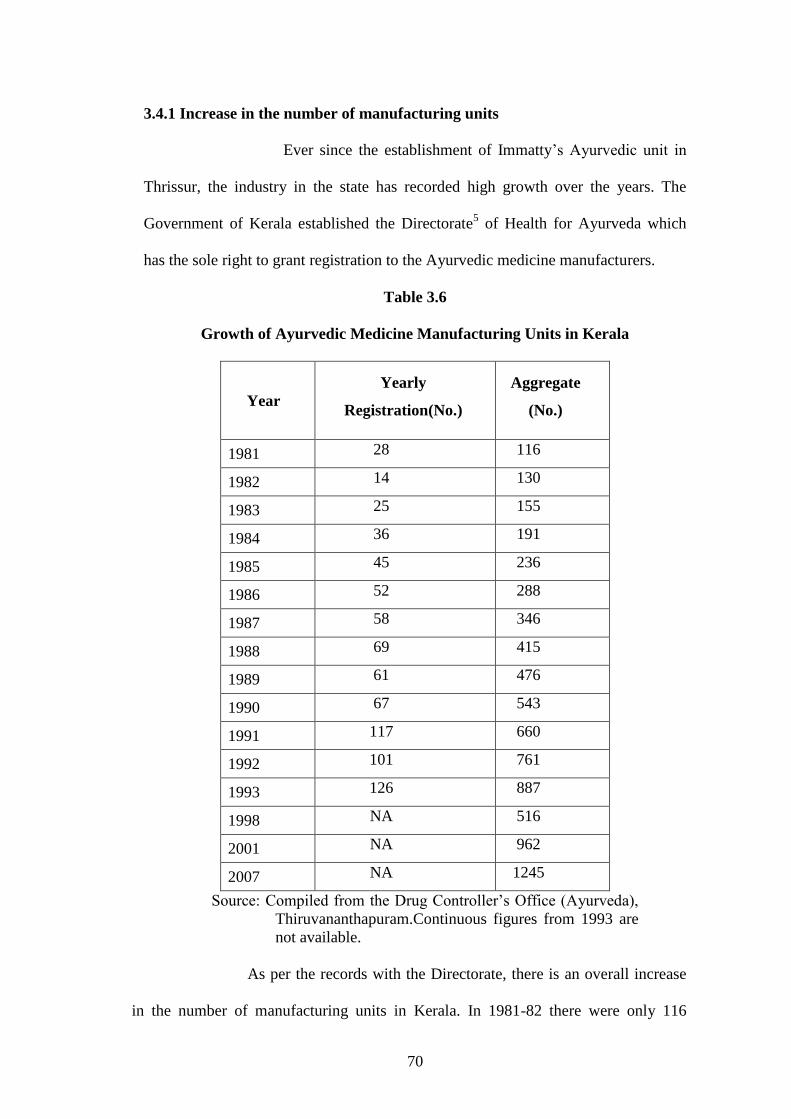
3.4.1 Increase in the number of manufacturing units
Ever since the establishment of Immatty‟s Ayurvedic unit in
Thrissur, the industry in the state has recorded high growth over the years. The
Government of Kerala established the Directorate5 of Health for Ayurveda which
has the sole right to grant registration to the Ayurvedic medicine manufacturers.
Table 3.6
Growth of Ayurvedic Medicine Manufacturing Units in Kerala
Year
Yearly
Registration(No.)
Aggregate
(No.)
1981 28 116
1982 14 130
1983 25 155
1984 36 191
1985 45 236
1986 52 288
1987 58 346
1988 69 415
1989 61 476
1990 67 543
1991 117 660
1992 101 761
1993 126 887
1998 NA 516
2001 NA 962
2007 NA 1245
Source: Compiled from the Drug Controller‟s Office (Ayurveda),
Thiruvananthapuram.Continuous figures from 1993 are
not available.
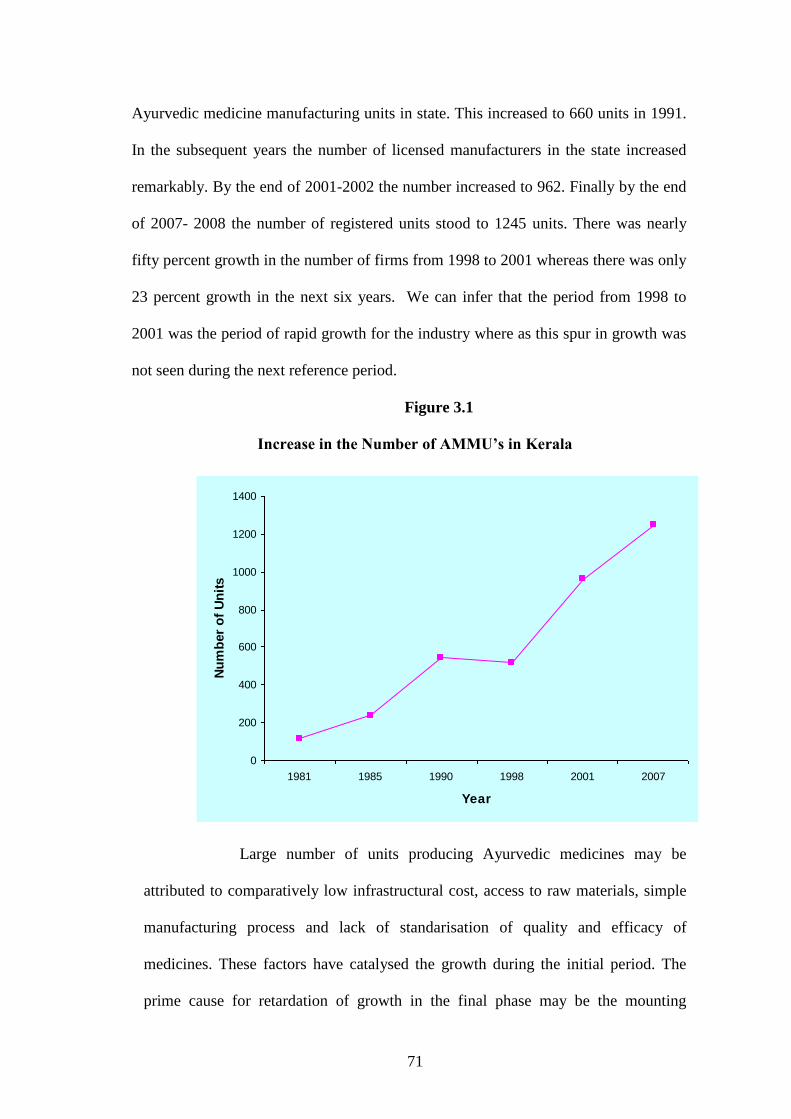
As per the records with the Directorate, there is an overall increase
in the number of manufacturing units in Kerala. In 1981-82 there were only 116
71
Ayurvedic medicine manufacturing units in state. This increased to 660 units in 1991.
In the subsequent years the number of licensed manufacturers in the state increased
remarkably. By the end of 2001-2002 the number increased to 962. Finally by the end
of 2007- 2008 the number of registered units stood to 1245 units. There was nearly
fifty percent growth in the number of firms from 1998 to 2001 whereas there was only
23 percent growth in the next six years. We can infer that the period from 1998 to
2001 was the period of rapid growth for the industry where as this spur in growth was
not seen during the next reference period.
Figure 3.1
Increase in the Number of AMMU’s in Kerala
0
200
400
600
800
1000
1200
1400
1981 1985 1990 1998 2001 2007
Year
Nu
mb
er
of
Un
its
Large number of units producing Ayurvedic medicines may be
attributed to comparatively low infrastructural cost, access to raw materials, simple
manufacturing process and lack of standarisation of quality and efficacy of
medicines. These factors have catalysed the growth during the initial period. The
prime cause for retardation of growth in the final phase may be the mounting
72
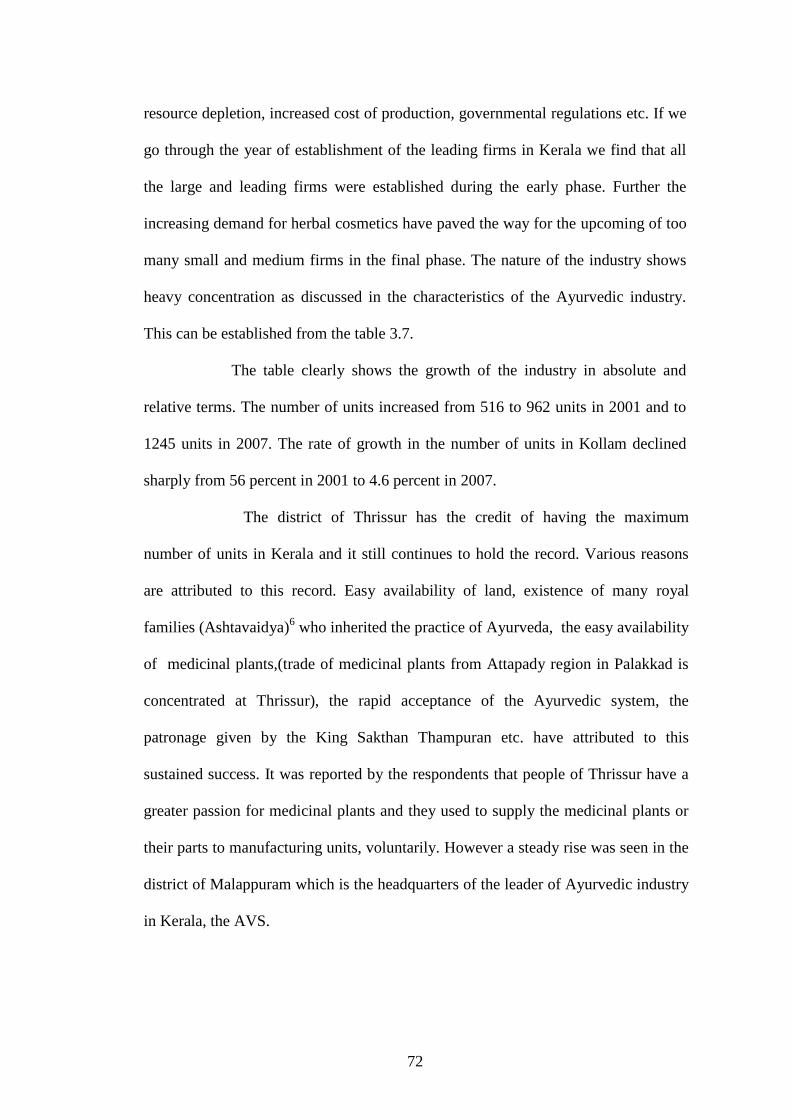
resource depletion, increased cost of production, governmental regulations etc. If we
go through the year of establishment of the leading firms in Kerala we find that all
the large and leading firms were established during the early phase. Further the
increasing demand for herbal cosmetics have paved the way for the upcoming of too
many small and medium firms in the final phase. The nature of the industry shows
heavy concentration as discussed in the characteristics of the Ayurvedic industry.
This can be established from the table 3.7.
The table clearly shows the growth of the industry in absolute and
relative terms. The number of units increased from 516 to 962 units in 2001 and to
1245 units in 2007. The rate of growth in the number of units in Kollam declined
sharply from 56 percent in 2001 to 4.6 percent in 2007.
The district of Thrissur has the credit of having the maximum
number of units in Kerala and it still continues to hold the record. Various reasons
are attributed to this record. Easy availability of land, existence of many royal
families (Ashtavaidya)6 who inherited the practice of Ayurveda, the easy availability
of medicinal plants,(trade of medicinal plants from Attapady region in Palakkad is
concentrated at Thrissur), the rapid acceptance of the Ayurvedic system, the
patronage given by the King Sakthan Thampuran etc. have attributed to this
sustained success. It was reported by the respondents that people of Thrissur have a
greater passion for medicinal plants and they used to supply the medicinal plants or
their parts to manufacturing units, voluntarily. However a steady rise was seen in the
district of Malappuram which is the headquarters of the leader of Ayurvedic industry
in Kerala, the AVS.
73
Table 3.7
District wise number of Registered Ayurvedic Medicine Manufacturing
Units in Kerala
District 1998 2001 2007
Thiruvananthapuram 34 90 (62.2 ) 132 (31.8 )
Kollam 42 121 (56.0 ) 127 (4.72 )
Pathnamthitta 11 5 ( -120 ) 40 (87.5)
Kottayam 24 93 (74.1 ) 79 (-17.7 )
Idukki 12 16 (25 ) 19 (15.7 )
Alapuzha 21 87 (75.8) 69 (-26.0)
Ernakulam 68 112 (39.2 ) 179 (37.4)
Thrishur 143 195 (26.6 ) 243 (19.75 )
Malappuram 41 26 (-57.6 ) 78 (66.6 )
Wayanad 4 2 ( 50) 5 ( 60)
Kozhikode 34 93 (63.4) 97 ( 4.12)
Kannur 38 66 ( 42.4) 63 (-4.5 )
Palakkad 37 49 ( 24.4) 106 (53.7 )
Kasargode 7 7 8 (12.5 )
Total 516 962 ( 46.36 ) 1245 (22.73)
Source: Drug Controller‟s Office, Thiruvananthapuram.
Kerala Ayurvedic Medicine Manufacturer Association, 1991.Figures
in Parentheses shows percentage values.
If we split the State into southern and northern regions it can be seen
that Northern Kerala (consisting of the districts of Thrissur, Kozhikode, Malapurram,
Wayand, Kannur and Kasergode) proved to be the fertile land for the growth of
Ayurvedic industry in the state. All the major players in the State are located in the
74
northern region. The aggregate figures depict the steady growth of the industry over
the years. It can be seen that if the early growth was marked by the coming of large
units, the growth in the later years is attributed to the establishment of small firms.
Most of these new firms are engaged in the manufacturing of cosmetic herbal
products which have a greater demand in the market. But the field experience
revealed that many of the registered units were not operating. Again there were units
which carried out production in seasonally specific periods like August to January
(Karkidakam7) which is considered to be the month for rejuvenating health using
Ayurveda. Hence it can be concluded that the actual number of operating units may
be much lesser than the published figures.
3.4.2 Consumption of Raw material
The increase in the amount of inputs used in the production of
the output may be treated as the indicator for the growth of the industry. As mentioned
in the forgoing section the number of small and medium firms exceeds the number of
large firms. A serious handicap in this area is that most of the small and tiny units do
not maintain proper records of the raw material consumption. Hence the analysis is
based on the raw material consumption figures of the large firms. Major raw material
used in the Ayurvedic industry is medicinal plants obtained from forest and cultivable
lands. Apart from this the industry used jaggery, ghee, oil, preservatives, permitted
amounts of alcohol etc. Here the data relates to the consumption of medicinal plants
alone, as they constitute 80 percent of the total raw material used in the formulation of
Ayurvedic medicines. The data shows that the consumption of the raw material is on
an increase. From the output figures and the data obtained from the leading firms we
can infer that the consumption in absolute terms has consistently increased during the
period of study.
75
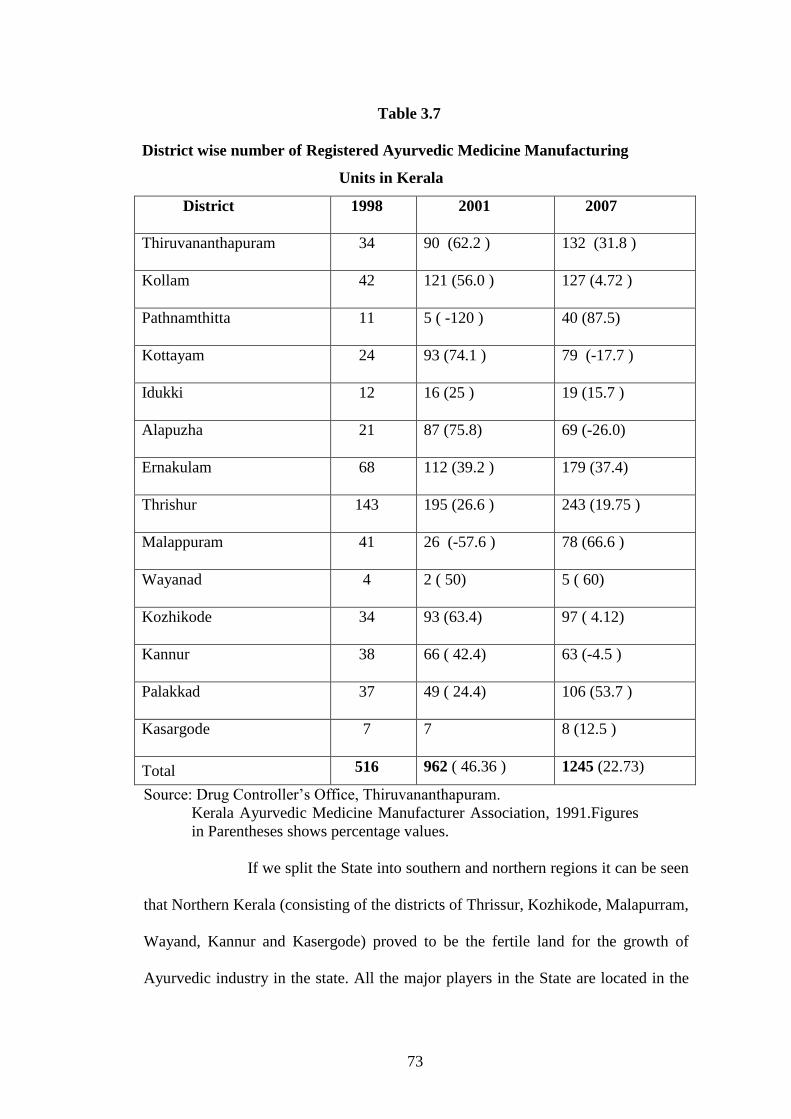
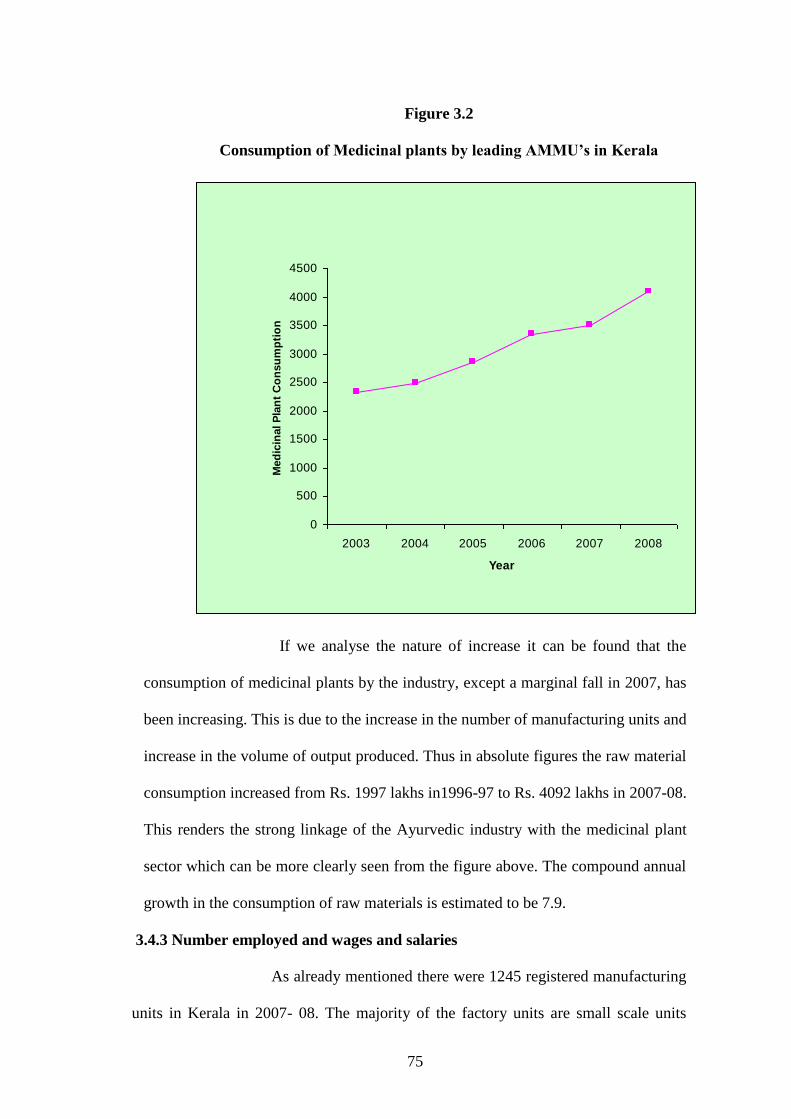
Figure 3.2
Consumption of Medicinal plants by leading AMMU’s in Kerala
0
500
1000
1500
2000
2500
3000
3500
4000
4500
2003 2004 2005 2006 2007 2008
Year
Med
icin
al P
lan
t C
on
su
mp
tio
n
If we analyse the nature of increase it can be found that the
consumption of medicinal plants by the industry, except a marginal fall in 2007, has
been increasing. This is due to the increase in the number of manufacturing units and
increase in the volume of output produced. Thus in absolute figures the raw material
consumption increased from Rs. 1997 lakhs in1996-97 to Rs. 4092 lakhs in 2007-08.
This renders the strong linkage of the Ayurvedic industry with the medicinal plant
sector which can be more clearly seen from the figure above. The compound annual
growth in the consumption of raw materials is estimated to be 7.9.
3.4.3 Number employed and wages and salaries
As already mentioned there were 1245 registered manufacturing
units in Kerala in 2007- 08. The majority of the factory units are small scale units
76
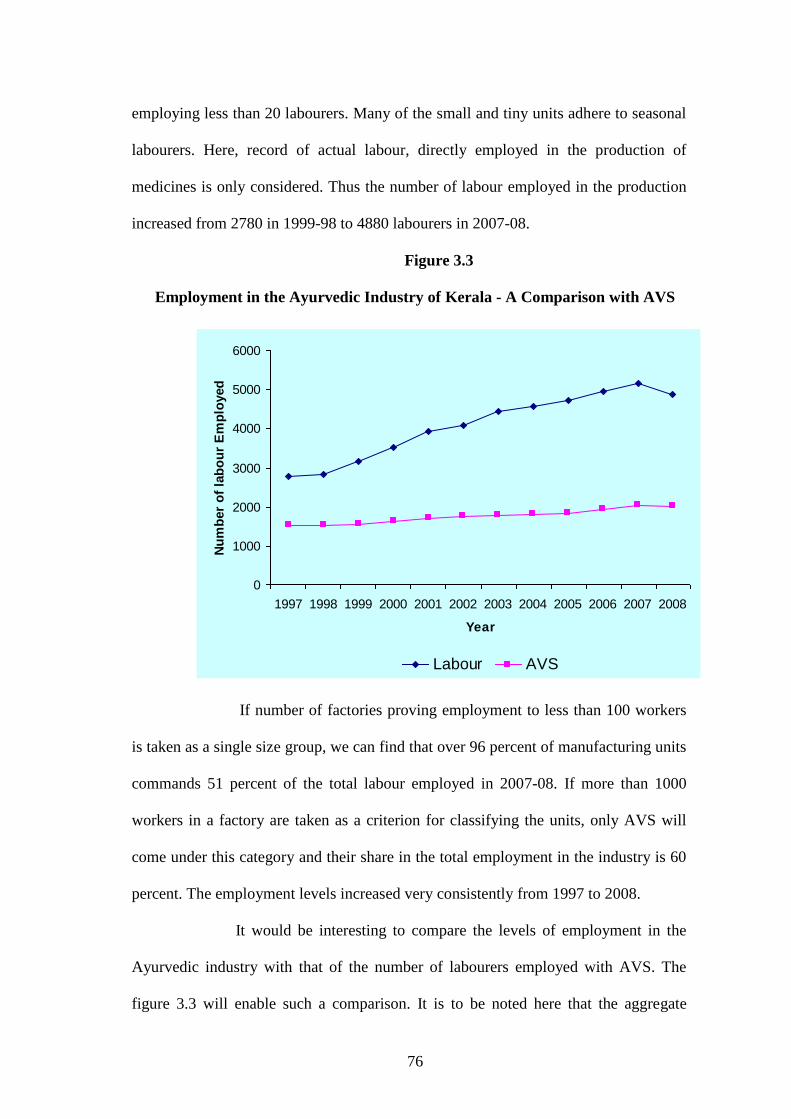
employing less than 20 labourers. Many of the small and tiny units adhere to seasonal
labourers. Here, record of actual labour, directly employed in the production of
medicines is only considered. Thus the number of labour employed in the production
increased from 2780 in 1999-98 to 4880 labourers in 2007-08.
Figure 3.3
Employment in the Ayurvedic Industry of Kerala - A Comparison with AVS
0
1000
2000
3000
4000
5000
6000
1997 1998 1999 2000 2001 2002 2003 2004 2005 2006 2007 2008
Year
Nu
mb
er
of
lab
ou
r E
mp
loyed
Labour AVS
If number of factories proving employment to less than 100 workers
is taken as a single size group, we can find that over 96 percent of manufacturing units
commands 51 percent of the total labour employed in 2007-08. If more than 1000
workers in a factory are taken as a criterion for classifying the units, only AVS will
come under this category and their share in the total employment in the industry is 60
percent. The employment levels increased very consistently from 1997 to 2008.
It would be interesting to compare the levels of employment in the
Ayurvedic industry with that of the number of labourers employed with AVS. The
figure 3.3 will enable such a comparison. It is to be noted here that the aggregate
77
employment trends in the Ayurvedic industry has been similar to the trend of
employment in AVS. The pattern of the employment corresponds to the rise and fall
of the labour employed in the industry. This may help us to confer that the industry
has followed the pattern of its leader. This trend needless to say happens because AVS
employs maximum number of labour. The compound annual growth in the number of
labour employed in the Ayurvedic industry as a whole was estimated to be 6. Wages
and salaries disbursed to the employees have also increased over the years. From
Rs.661 lakhs in 1997- 98, the total emoluments given to the employees in the
Ayurvedic industry have increased to Rs.2374 lakhs in 2007-08. The compound
annual growth in the increase in wages and salaries estimated to be 14.8.
3.4.4 Product Profile
The modernisation and commercialisation that has happened in the
Ayurvedic industry of Kerala is very evident when we observe the dynamic change in
the product profile of the firms. The developments in Ayurvedic pharmacy during the
past half a century focused on the enhancement of effectiveness, changing the form of
medicine (for instance, decoctions into tablets) and improving tastiness. The industry
produces three kinds of medicines such as medicines that are based on classical
formulations or textual medicines; proprietary medicines8 which are patented
9 and
cosmetic and toiletries.
Over the years the number of firms producing the third category of
medicines has increased and the numbers of firms producing pure Ayurvedic
medicines have declined. Most of the firms deal with branded products10
which are of
great demand and are sold as over–the-counter products. These consumer brands are
advertised directly to consumers through public media such as television, newspapers
and magazines. In contrast, the biomedical providers are marketed to physicians,
78
pharmacists and chemists. Most of the medium sized firms produce patented
medicines by altering some composition in the classical formulations. Generally, the
proprietary medicines and beauty products fall into the category of consumer brands
and seem to be fast moving in the world market. However the national trend shows
that there is greater demand and orientation towards the consumer brands.
Table 3.8
Product Profile of Large Ayurvedic Firms
(% of the total products)
Manufacturer Consumer
Brands
Classical
Formulations
AVS None 100
Vaidyaratnam 4 75
Nagarjuna 3 69
Oushadi None 81
Source: Company Profile of Firms, 2008
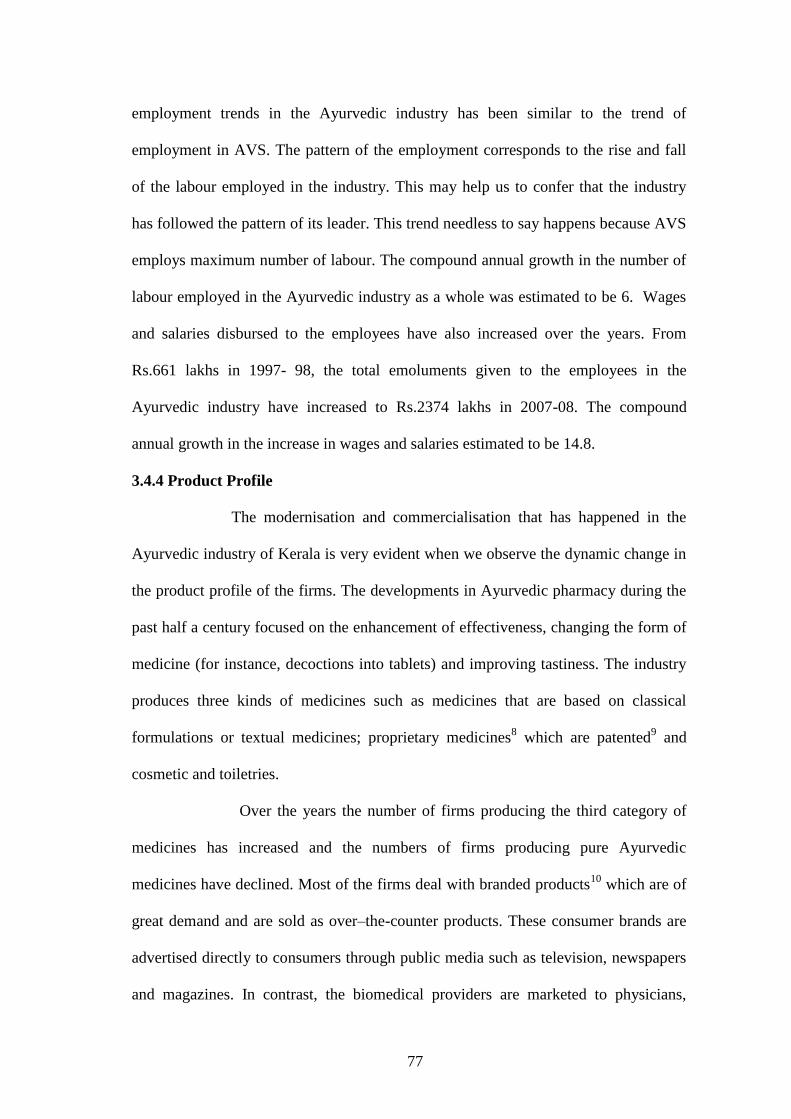
3.4.5 Sales and Export
Another very strong indicator of the growth of the industry is the
figures on sales, both domestic and exports. When compared to domestic sales the
volume of exports are considerably low. Most of the leading firms have no exports
where as firms like Nagarjuna has established plants for exports alone. The
continuous figures available for six leading firms show that the volume of sales is
showing systematic increase over the years. From Rs.14046 lakhs in 2003-04 the
sales of the leading firms increased to Rs 23,354 lakhs in 2007-08. When we add the
sales figures of the other firms the aggregate sales figures will be much higher. The
compound annual growth rate in sales was found to be 15.9.
79
Figure 3.4
Growth of sales of leading AMMU’s in Kerala
0
5000
10000
15000
20000
25000
2003 2004 2005 2006 2007 2008
Year
Sale
s (
in
Lakh
s)
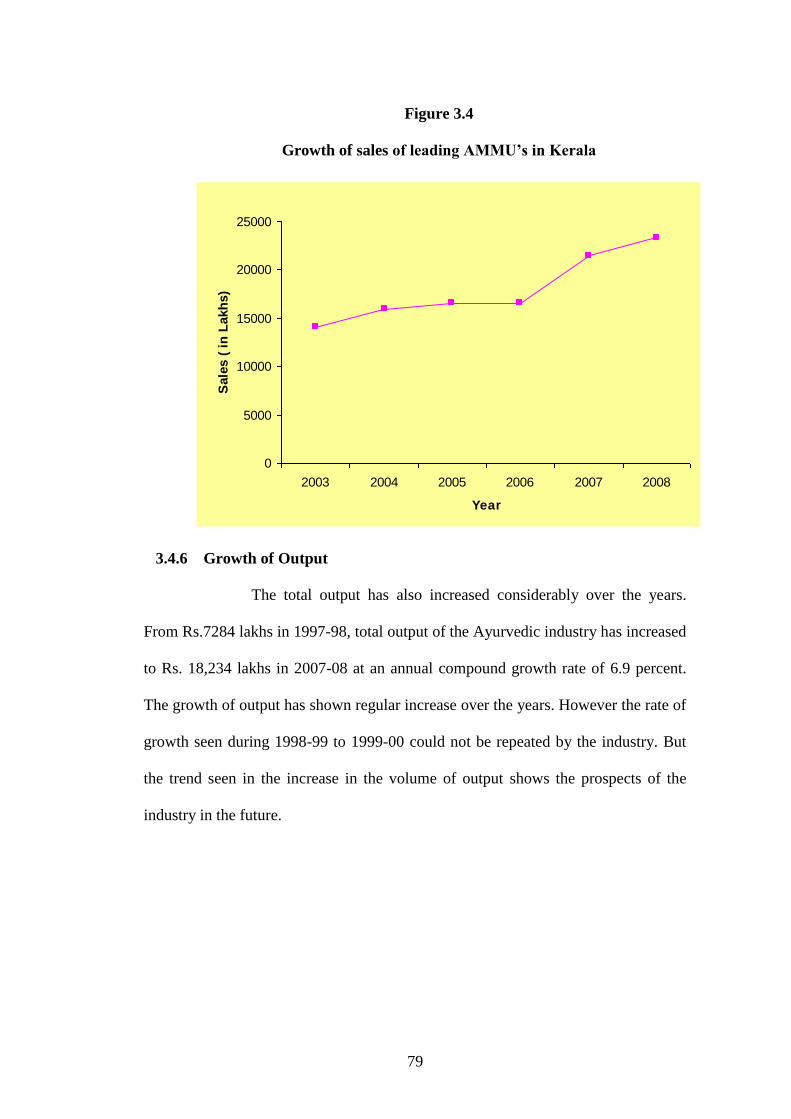
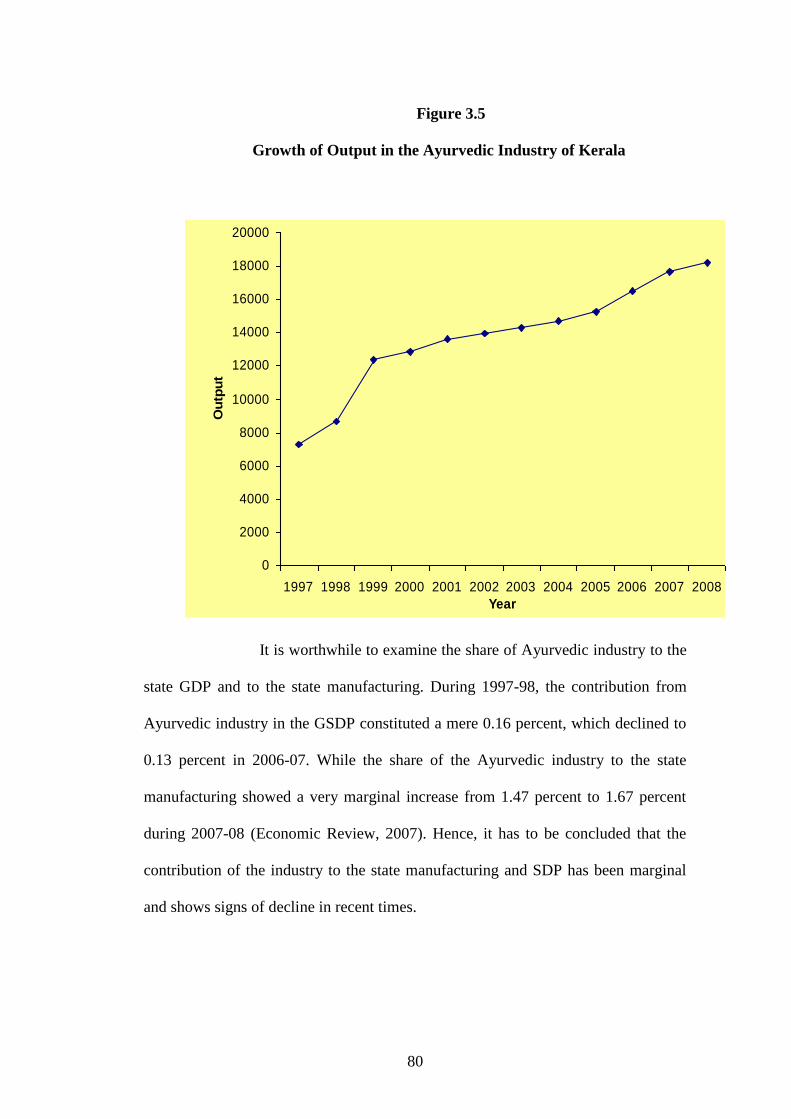
3.4.6 Growth of Output
The total output has also increased considerably over the years.
From Rs.7284 lakhs in 1997-98, total output of the Ayurvedic industry has increased
to Rs. 18,234 lakhs in 2007-08 at an annual compound growth rate of 6.9 percent.
The growth of output has shown regular increase over the years. However the rate of
growth seen during 1998-99 to 1999-00 could not be repeated by the industry. But
the trend seen in the increase in the volume of output shows the prospects of the
industry in the future.
80
Figure 3.5
Growth of Output in the Ayurvedic Industry of Kerala
0
2000
4000
6000
8000
10000
12000
14000
16000
18000
20000
1997 1998 1999 2000 2001 2002 2003 2004 2005 2006 2007 2008
Year
Ou
tpu
t
It is worthwhile to examine the share of Ayurvedic industry to the
state GDP and to the state manufacturing. During 1997-98, the contribution from
Ayurvedic industry in the GSDP constituted a mere 0.16 percent, which declined to
0.13 percent in 2006-07. While the share of the Ayurvedic industry to the state
manufacturing showed a very marginal increase from 1.47 percent to 1.67 percent
during 2007-08 (Economic Review, 2007). Hence, it has to be concluded that the
contribution of the industry to the state manufacturing and SDP has been marginal
and shows signs of decline in recent times.
81
The foregoing analysis depicted clearly the evolution and transition
of Ayurvedic industry in the state. From a mere clinical production system the
industry has been transformed into contemporary lines using modern means of
production and novel techniques of marketing. The Ayurvedic industry began as a
petty household production unit; later with the help of mechanisation moved towards
bulk production from there it matured into large scale manufacturing sector. At the
same time dichotomy exists with regards to small manufacturers who still adhere to
the old methods of production. One factor contributing to the growth of the industry
has been the provision of a sound infrastructure facility and that has also been dealt
with in this chapter.
End Notes
1. Petty production was the beginning of the process of industrialisation of Ayurvedic
manufacturing. Here Production was a household activity where all the members of the
family played a part in the production procedure. Apart from them there was some hired
labour who were not paid. Obviously the volume of production was less.
2. Classical formulations are based on Ayurvedic samhitas such as Sahasrayogam and
Astangahrdya which include traditional medicinal formulations such as arishtams, asavams,
ghruthams, lehyams, thailams, and choornams.
3 Personal care products are mostly herbal cosmetic products which are of high demand.
They use the classical formula and innovate it in the user friendly form
4. Ayurdhara was established to save the primary gatherers mostly tribals from the clutches
of exploitation by the private traders. Accordingly tribals sell the medicinal plants collected
from forests directly to the Ayurdhra and the profits earned by the firm is distributed back to
the tribals itself. Thus it is a mechanism to improve the capabilities of the tribals.
5. All medicines produced by the firms have to get prior manufacturing license from the
Drug Controllers Office. The firms will have to inform the composition of medicinal plants
and the reference text on the basis of which the medicines are produced. The license is
issued after the inspection of the composition. The Drug Control Act, 1940 has listed 54
texts which can be used as the reference text for formulation.
6 Ashtavaidya families are Ayurvedic physicians well-versed with knowledge on eight
branches of Ayurveda. The present generation members are well established in the field.
Vaidyaratnam Oushadasala which belongs to Ashtavaidya family is classified as large scale
manufacturer; where as E.T Vaidyaratnam Moos Vaidyasala is a reputed medium sized unit
from the Ashtavaidya family. Both of them come from the Thrishur region.
7. Karkidakom, name of Malayalam month that normally falls between August and
September. In the agricultural dominated society of past Kerala it is believed to be a slack
82
season. Here farmers take rest, repairs their agricultural tools, prepares the seed for sowing
in the next month Chingam. And for undertaking the hectic work in Chingam they refresh
their body using Ayurvedic treatment. Although the agricultural dominated society has
vanished in Kerala, the social custom is still followed in the State. In Tamil Karkidakom is
known by the name Aadi.
8. Proprietary medicines are medicines of known composition
9. Patented medicines are of unknown composition.
10. Branded products are products that bear the trademark of the company like
Chyavanaprash by Dabur India Limited.