Chapter 3 Forging a Path Toward More Sustainable Living ... · 3-2 Chapter 3: Forging a Path for...
82
Chapter 3 Forging a Path Toward More Sustainable Living: A Sustainable Communities Strategy Chapter Contents A Sustainable Strategy for the San Diego Region .......................................... 3-2 SCS Public Involvement Activities ................... 3-4 Land Use and Transportation Connection ...... 3-5 A Sustainable Land Use Pattern ..................... 3-7 Protecting Resource Areas and Farmland ..... 3-44 The 2050 RTP Transportation Network ........ 3-63 Transportation Demand Management Measures ............................... 3-65 Transportation System Management Measures ............................... 3-65 Pricing Measures ......................................... 3-66 Meeting Targets for Reducing Greenhouse Gas Emissions .......................... 3-66 Considering Social Equity in the SCS ............ 3-70 Considering Energy Consumption and Cutting Greenhouse Gas Emissions ....... 3-70 Meeting Federal Air Quality Requirements ... 3-72 Climate Change Impacts and Adaptation..... 3-72 Considering Public Health in the SCS ........... 3-72 Promoting Sustainability through Incentives and Collaboration........................ 3-73 Consultation with the Local Agency Formation Commission ................... 3-75 Streamlining the Process for CEQA .............. 3-75 Conclusion .................................................. 3-78
Transcript of Chapter 3 Forging a Path Toward More Sustainable Living ... · 3-2 Chapter 3: Forging a Path for...

Chapter 3
Forging a Path Toward More Sustainable Living: A Sustainable Communities Strategy
Chapter Contents
A Sustainable Strategy for the San Diego Region .......................................... 3-2
SCS Public Involvement Activities ................... 3-4
Land Use and Transportation Connection ...... 3-5
A Sustainable Land Use Pattern ..................... 3-7
Protecting Resource Areas and Farmland ..... 3-44
The 2050 RTP Transportation Network ........ 3-63
Transportation Demand Management Measures ............................... 3-65
Transportation System Management Measures ............................... 3-65
Pricing Measures ......................................... 3-66
Meeting Targets for Reducing Greenhouse Gas Emissions .......................... 3-66
Considering Social Equity in the SCS ............ 3-70
Considering Energy Consumption and Cutting Greenhouse Gas Emissions ....... 3-70
Meeting Federal Air Quality Requirements ... 3-72
Climate Change Impacts and Adaptation ..... 3-72
Considering Public Health in the SCS ........... 3-72
Promoting Sustainability through Incentives and Collaboration ........................ 3-73
Consultation with the Local Agency Formation Commission ................... 3-75
Streamlining the Process for CEQA .............. 3-75
Conclusion .................................................. 3-78

3-2 Chapter 3: Forging a Path for More Sustainable Living
2050 Regional Transportation Plan
The 2050 Regional Transportation Plan (RTP)
and its Sustainable Communities Strategy
(SCS) seek to guide the San Diego region
toward a more sustainable future by
integrating land use, housing, and
transportation planning to create
communities that are more sustainable,
walkable, transit oriented, and compact.
Planning for future patterns of density, how
people get around, and how land is used is
really driven by one goal: creating great places
to live, work, and play.
Senate Bill 375 (SB 375), which went into
effect in 2009, added statutes to the
California Government Code to encourage
planning practices that create sustainable
communities. It calls for each metropolitan
planning organization to prepare an SCS as
an integrated element of the Regional
Transportation Plan. This new element shows
how integrated land use and transportation
planning can lead to lower greenhouse gas
(GHG) emissions from autos and light trucks.
Government Code sections are referenced
throughout the SCS to show how the region
is meeting the requirements of SB 375. In
addition, Appendix D includes a matrix that
specifies the page number of the SCS or other
sections of the 2050 RTP where each of the
requirements of SB 375 can be found.
A Sustainable Strategy for the San Diego Region “Each metropolitan planning organization
shall prepare a sustainable communities
strategy.” (Government Code Section
65080(b)(2)(B))
Achieving sustainability will require living and
working in ways that protect and sustain our
region’s vital social, environmental, and
economic resources.
The strategy for the San Diego region is to use
existing and reasonably expected funding to
achieve our region’s transportation and
housing needs, while also respecting, and
enhancing our natural resources.
The path toward living more sustainably is
clear: focus housing and job growth in
urbanized areas where there is existing and
planned transportation infrastructure, protect
sensitive habitat and open space, invest in a
transportation network that provides residents
and workers with transportation options that
reduce GHG emissions, and implement the
plan through incentives and collaboration.
Although SB 375 went into effect recently,
the building blocks of the SCS have formed
the foundation of transportation planning in
the San Diego region for many years. For
example, regional habitat planning efforts
began in the 1990s. The Regional
Comprehensive Plan (RCP), which integrates
transportation, land use and housing planning
Achieving
sustainability will
require living and
working in ways that
protect and sustain
our region’s vital
social, environmental,
and economic
resources.
SANDAG 2050 Regional Transportation Plan 3-3
to create a more sustainable region, was
adopted by SANDAG in 2004.
The RCP was built on the principles of
sustainability and smart growth. Sustainability
is defined in the RCP as “simultaneously
meeting our current economic,
environmental, and community needs, while
also ensuring that we aren’t jeopardizing the
ability of future generations to meet their
needs.” A prosperous economy, a healthy
environment, and social equity are described
as the “Three Es” of sustainability.
The RCP set forth our regional vision which is
being furthered through the 2050 RTP and its
SCS. That vision is:
“To preserve and enhance the San Diego
region’s unique features – its vibrant and
culturally-diverse communities, its beaches,
deserts, mountains, lagoons, bluffs, canyons,
and its international setting – and promote
sustainability, economic prosperity, and an
outstanding quality of life for everyone.”
The 2050 RTP and its SCS build on these
ongoing planning efforts, with the added
focus on reducing GHG emissions as the
region strives to meet new requirements
mandated by SB 375.
“Prior to adopting a sustainable communities
strategy, the metropolitan planning
organization shall quantify the reduction in
greenhouse gas emissions projected to be
achieved by the sustainable communities
strategy.” (Government Code Section
65080(b)(2)(H))
As part of its mandate under SB 375, in 2010,
the California Air Resources Board (CARB) set
specific targets for reducing GHG emissions
for cars and light trucks for each of the state’s
regions from a 2005 base year. The GHG
targets set for the San Diego region call for a
7 percent per capita reduction by 2020, and a
13 percent per capita reduction by 2035.
As shown in Table 3.1 our region will meet or
exceed these targets by, among other means,
using land in ways that make developments
more compact, conserving open space, and
investing in a transportation network that
gives residents transportation options.
It is important to note that the 2050 RTP
addresses GHG and vehicle miles traveled
from a broader range of vehicles – such as
public transit buses, heavy duty trucks, and
school buses – than those addressed in SB
375. This chapter focuses only on the
requirements of SB 375 which call for GHG
reductions for the specific vehicle classes, cars
and light trucks. Other performance metrics
related to GHG emissions are addressed in the
balance of the 2050 RTP chapters where
appropriate. A further discussion of how the
targets are met and the relationship to VMT
and GHG emissions is provided later in this
chapter in the Meeting Targets for Lowering
GHG Emissions section.
The 2050 RTP horizon year extends well
beyond the target years of 2020 and 2035
outlined in SB 375. So what happens beyond
2035? While growth will continue in the
region, after the urbanized areas have been
developed according to current local general
plans, development could gradually move
toward more remote areas where fewer
transportation options are available if local
plans are not changed. The growth forecast
shows this happening simply because most
local general plans have a horizon year prior
to 2050. Although, it is expected that local
plans will be updated and revised between
now and 2050 to reflect more development in
the urbanized areas of the region, based on
current plans, the projected growth beyond
2040 would likely result in an increased
demand for driving. The results now shown
Sustainability is
defined in the RCP as
“simultaneously
meeting our current
economic,
environmental, and
community needs,
while also ensuring
that we aren’t
jeopardizing the ability
of future generations
to meet their needs.”

3-4 Chapter 3: Forging a Path for More Sustainable Living
Thousands of
residents,
community leaders,
academics, business
leaders, elected
officials, and
representatives from
underrepresented
groups have
participated in the
development of the
2050 RTP and its
SCS.
for 2050 are best estimates based on
historical and current empirical observations
in the region and do not reflect future
attitude changes about transportation and
where people will choose to live and work as
a result of significant investments in
transportation options.
In addition, the GHG modeling for 2050 uses
emission factors for the year 2040 (EMFAC
2007 includes emissions factors through 2040
only) and assumes no technological
improvements to vehicles or fuels in the final
ten years of the plan (This is due to the lack of
accepted published data beyond 2040).
In accordance with SB 375, the building
blocks of the SCS include:
A land use pattern that accommodates our
region’s future employment and housing
needs, and protects sensitive habitats and
resource areas
A transportation network of public transit,
managed lanes and highways, local
streets, bikeways and walkways built
and maintained with reasonably
expected funding
Managing demands on our transportation
system (also known as Transportation
Demand Management or TDM) in ways
that reduce or eliminate traffic congestion
during peak periods of demand
Managing our transportation system (also
known as Transportation System
Management, or TSM) through measures
that maximize the efficiency of the
transportation network
Innovative pricing policies and other
measures designed to reduce vehicle miles
traveled and traffic congestion during
peak periods of demand
The key difference between past and current
regional planning efforts is a sharper focus on
reducing GHG emissions from cars and light
trucks. For these vehicles, the state has
developed a three-tiered approach to
reducing GHG emissions. In addition to the
regional land use policies and transportation
investments contained in the 2050 RTP, the
state has enacted laws to increase vehicle fuel
efficiency and to increase the use of
alternative, lower carbon transportation fuels.
SANDAG, and other regional stakeholders,
are supporting infrastructure planning for
alternative fuels, which is addressed later in
this chapter.
SCS Public Involvement Activities “The metropolitan planning organization shall
conduct at least two informational meetings
in each county within the region for members
of the board of supervisors and city councils
on the sustainable communities strategy.”
(Government Code Section 65080(b)(2)(E))
Table 3.1 – 2050 RTP – Results of Greenhouse Gas Emissions and Vehicle Miles Traveled Reductions
Average Weekday Per Capita CO2 and VMT Reductions for Cars and Light Trucks from 2005
Target Year CARB Target GHG VMT
2020 7% 14% 12%
2035 13% 13% 10%
2050 N/A 10% 7%
Source: SANDAG and CARB
SANDAG 2050 Regional Transportation Plan 3-5
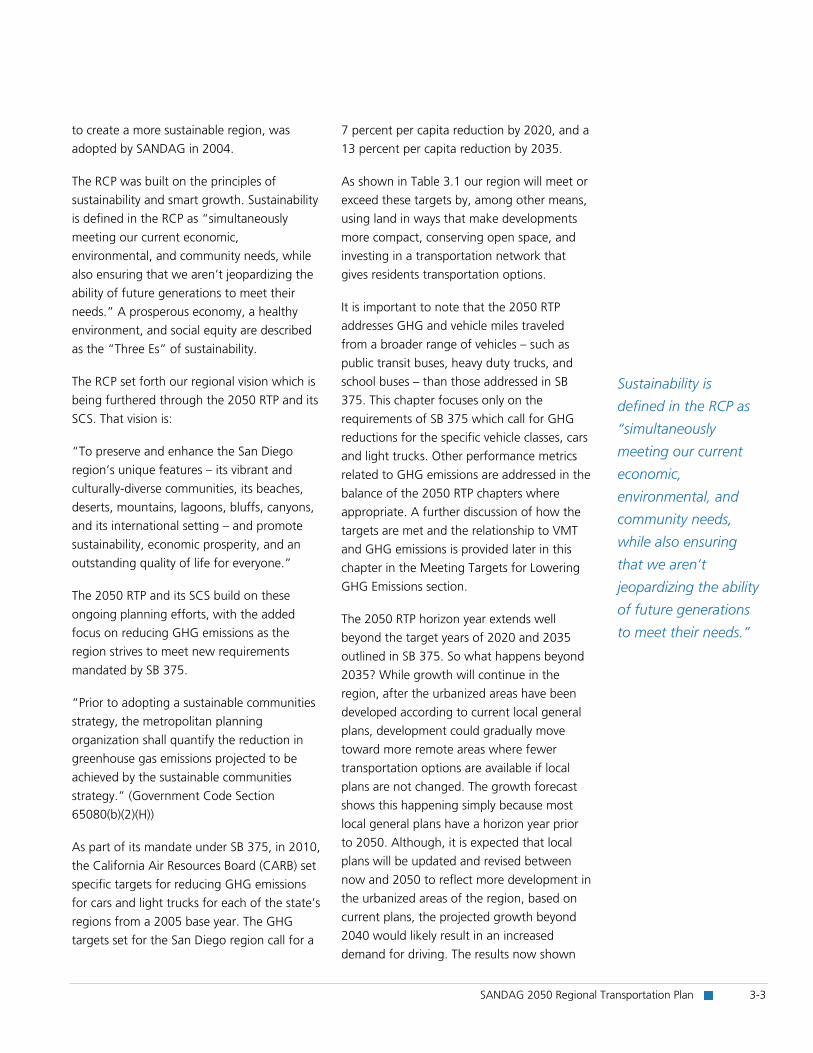
Involving the public in the development of the
SCS was a major priority in the San Diego
region. On October 8, 2010, SANDAG
conducted an informational meeting on the
SCS at the SANDAG Board of Directors
meeting. Pursuant to Government Code
Section 65080(b)(2)(E), only one informational
meeting is required if it is attended by the
county board of supervisors and city
councilmembers who represented a majority
of the cities with a majority of the population
in the incorporated areas of the county. The
minutes and attendance by jurisdiction for this
meeting can be found in Technical
Appendix 6, entitled 2050 RTP and SCS Public
Outreach Program. These documents show
that the meeting was attended by all
jurisdictions within San Diego County.
SANDAG has exceeded the statutory
requirement by holding discussions
concerning the SCS at several other public
meetings of the Board of Directors since
October 2010. The documentation from these
meetings also is included in Technical
Appendix 6.
“Each metropolitan planning organization
shall adopt a public participation plan, for
development of the sustainable communities
strategy.” (Government Code Section
65080(b)(2)(F)
Through an extensive public outreach
program, thousands of residents, community
leaders, academics, business leaders, elected
officials, and representatives from
underrepresented groups have participated in
the development of the 2050 RTP and its SCS.
The 2050 RTP Public Involvement Plan (PIP)
established a process and outlined specific
activities for communicating with, and
obtaining input from, the public throughout
the RTP development process. The PIP is based
on the SANDAG Public Participation Plan
adopted by the Board of Directors on
December 18, 2009.
SANDAG’s efforts to involve the public in the
development of the 2050 RTP and its SCS
have been tracked and recorded to chronicle
the large number, and wide range of activities
organized and held by SANDAG. This record
shows that SANDAG exceeded the public
involvement requirements, including
informational meetings mandated by SB 375
and federal regulations. The details of these
activities are included in Chapter 9 and
Technical Appendix 6.
Drawing a Closer Connection to How Land Is Used, and How We Get Around: the Land Use and Transportation Connection For some time, SANDAG has been drawing an
increasingly closer connection between how
land is used, and how we get around. Since
the late 1990s, the principles that guide our
vision for the future have deepened and
matured. The cities and County of San Diego
have begun to integrate local and regional
plans for accommodating the region’s
growing population, preserving open space,
and reducing GHG emissions. This holistic
approach to planning is referred to as
“smart growth.”
3-6 Chapter 3: Forging a Path for More Sustainable Living
The Regional
Comprehensive Plan
sets forth a regional
strategy to promote
smarter growth,
focusing on locating
higher density and
mixed-use
development close
to existing, and
planned
transportation
infrastructure.
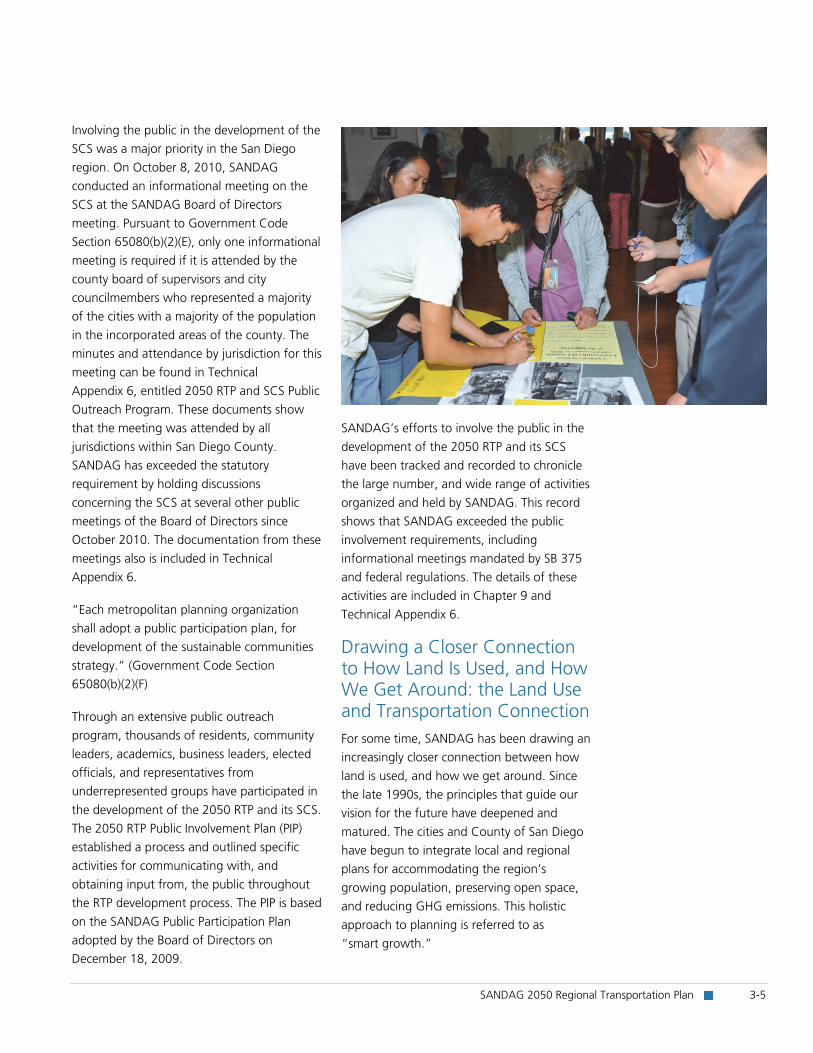
Acting individually and collectively, local
jurisdictions have taken and are continuing to
take significant steps to protect the
environment. These include creating plans for
conserving valuable natural habitats, better
protecting watersheds, conserving energy,
and reducing reliance on petroleum.
Some of the region’s largest initiatives to
protect natural habitats include the Multiple
Species Conservation Program (MSCP) and
the Multiple Habitat Conservation Program
(MHCP). Adopted in 1997 and 2003,
respectively, the MSCP and MHCP span the
region. Collectively, these initiatives establish
a “greenprint” for the region.
The Regional Comprehensive Plan (RCP),
adopted by the SANDAG Board of Directors in
2004, serves as a blueprint for the region’s
future growth and development. It sets forth
a regional strategy to promote smarter
growth, focusing on locating higher density
and mixed-use development close to existing,
and planned transportation infrastructure.
This strategy focuses particularly on elevating
the role of public transit in people’s daily lives.
The RCP is based upon three themes:
Improving the connections between land
use and transportation plans by using
smart growth principles
Using land use and transportation plans to
guide decisions about environmental and
public facility investments
Focusing on collaboration and incentives
to achieve regional goals and objectives
The RCP and RTP planning processes are
iterative, each informing the other. Upon
adoption of this RTP, SANDAG will begin
work to update the RCP to reflect its SCS.
Shortly after the adoption of the 2004 RCP,
SANDAG worked closely with the 18 cities
and the County of San Diego to develop the
regional Smart Growth Concept Map
(accepted in 2006, and updated in 2008).
This map illustrates where smart growth
development exists or could occur in our
region. The map was used to prioritize
transportation investments in the 2030 RTP,
and to identify locations for TransNet Smart
Growth Incentive Program funding. It also has
been used by local jurisdictions as a tool for
local plan updates and the development of
specific plans that locate more housing and
employment near transit stations and along
major (high frequency) bus routes. Many of
these land use plan changes have occurred
over the past five or six years and some are
still in progress. These plan changes are
reflected in the land use pattern of the SCS.
The Smart Growth Concept Map is included
in Technical Appendix 9 entitled, Additional
SCS Background Material. Because the Smart
Growth Concept Map has not been updated
since 2008, it does not include some of the
concepts and recommended actions that are
contained in the 2050 RTP and its SCS.
Therefore, SANDAG plans to update the map
to reflect the changes that have been made to
local land use plans (and are contained in the
SCS), and the regional transportation network
after the adoption of the 2050 RTP.

SANDAG 2050 Regional Transportation Plan 3-7
The 2050 Regional
Growth Forecast
projects that the
region will grow by
another 1.25 million
people by 2050.
Nearly 400,000 new
homes and 500,000
new jobs will be
added during this
time frame.
A Sustainable Land Use Pattern “Each metropolitan planning organization
shall prepare a sustainable communities
strategy, subject to the requirements of Part
450 of Title 23 of, and Part 93 of Title 40 of,
the Code of Federal Regulations, including the
requirement to utilize the most recent
planning assumptions considering local
general plans, and other factors.”
(Government Code Section 65080(2)(B))
“Identify the general location of uses,
residential densities, and building intensities
within the region.” (Government Code
Section 65080(b)(2)(B)(i))
In 2008, the San Diego region included about
3.1 million people, 1.1 million homes, and
1.5 million jobs. Most of the homes and jobs
are located within the western third of the
region, and in areas served by public transit.
The 2050 Regional Growth Forecast projects
that the region will grow by another
1.25 million people by 2050. Nearly 400,000
new homes and 500,000 new jobs will be
added during this time frame (Figure 3.1). The
base year for the 2050 RTP is 2008, the year
the data collection effort began to prepare
the regional growth forecast (2008-2050).
The San Diego region has made great strides
in planning for more compact, higher density,
and walkable development located near
transit and in the incorporated areas of the
region already served by water, sewer, and
other public facilities. Evidence of the region’s
success can be found in the 2050 Regional
Growth Forecast, which is the foundation of
the SCS land use pattern. The SCS land use
pattern accommodates 79 percent of all
housing and 86 percent of all jobs within the
Urban Area Transit Strategy Study Area where
the greatest investments in public transit are
being made (see Urban Area Transit Strategy
Study Area Map in Technical Appendix 7).
About 80 percent of new housing in the
region will be attached multifamily. The SCS
land use pattern also protects and preserves
about 1.3 million acres of land, more than
half the region’s land area. These open space
lands include habitat conservation areas,
parks, steep slopes, floodplains, and wetlands.
This information is documented in Table 3.2.
Source: SANDAG 2050 Regional Growth Forecast
Figure 3.1 – 2050 Regional Population, Jobs, and Housing Forecast
In m
illio
ns

3-8 Chapter 3: Forging a Path for More Sustainable Living
Table 3.2 – 2050 Regional Growth Forecast Projections
2008 to 2050 Change
2008 2020 2035 2050 Numeric Percent
Total Population 3,131,552 3,535,000 4,026,131 4,384,867 1,253,315 40%
Household Population 3,033,985 3,405,068 3,873,175 4,210,591 1,176,606 39%
Group Quarters Population 97,567 129,932 152,956 174,276 76,709 79%
Jobs 1,501,080 1,619,615 1,813,372 2,003,038 501,958 33%
Civilian Jobs 1,411,811 1,515,346 1,709,103 1,898,769 486,958 34%
Military Jobs 89,269 104,269 104,269 104,269 15,000 17%
Total Housing Units 1,140,654 1,262,488 1,417,520 1,529,090 388,436 34%
Single Family 692,382 728,566 755,477 761,699 69,317 10%
Multiple Family 405,023 493,243 624,419 732,832 327,809 81%
Mobile Homes 43,249 40,679 37,624 34,559 -8,690 -20%
Households 1,074,896 1,200,966 1,357,084 1,467,026 392,130 36%
Vacancy Rate 5.8% 4.9% 4.3% 4.1% 0.0 -29%
Household Size 2.82 2.84 2.85 2.87 0.05 2%
Total Acres 2,727,197 2,727,197 2,727,197 2,727,197 0 0%
Residential 335,895 403,440 544,868 634,498 298,603 89%
Employment 88,177 91,286 95,610 99,905 11,728 13%
Parks and Constrained Lands 1,539,657 1,540,164 1,540,966 1,541,314 1,656 0%
Vacant Land 386,266 327,972 209,005 136,183 -250,083 -65%
Distribution of Projected Housing Growth
2008 2020 2035 2050
Percent of Regional
Change 2008-2050
Numeric Regional
Change 2008-2050
Region 1,140,654 1,262,488 1,417,520 1,529,090 100% 388,436
Urban Area Transit Strategy 900,342 989,075 1,108,835 1,205,613 79% 305,271
Distribution of Projected Job Growth
2008 2020 2035 2050
Percent of Regional
Change 2008-2050
Numeric Regional
Change 2008-2050
Region 1,501,080 1,619,615 1,813,372 2,003,038 100% 501,958
Urban Area Transit Strategy 1,301,242 1,394,320 1,554,630 1,712,639 82% 411,397
Note: The 2050 Regional Growth Forecast represents a combination of economic and demographic projects, existing land use plans and policies, as well as potential land use plan changes that may occur in the region between 2030 and 2050 (data shown in italics). In general, growth between 2008 and 2030 is based on adopted land use plans and policies, and growth between 2030 and 2050 includes alternatives that may, in some cases, reach beyond existing adopted plans.
Source: SANDAG 2050 Regional Growth Forecast

SANDAG 2050 Regional Transportation Plan 3-9
2050 Regional Growth Forecast and Establishing the SCS Land Use Pattern Our region’s 2050 Regional Growth Forecast
is the foundation of the SCS land use pattern,
and it was used to plan the 2050 RTP
transportation network. This forecast extends
to 2050, allowing our region to incorporate
all transportation projects and programs that
voters approved in the TransNet Ordinance.
The Ordinance authorizes a half-cent sales
tax, and the 40-year extension (2008 to 2048)
was approved by San Diego region voters in
2004 to help pay for important transportation
improvements in the region. The growth
forecast is based on economic and
demographic projections out to 2050, existing
local land use plans and policies, and
reasonably anticipated changes to local plans
and policies. It estimates how much and
where future growth is likely to occur, and it
serves as the land use pattern for the SCS.
The 2050 Regional Growth Forecast was the
result of a collaborative effort among
demographers, planners, and policy makers.
A multi-step process was followed that
involved the input and review of a wide range
of local, regional, and subject-area experts.
The first step in the forecast process was to
develop growth projections for the region’s
population, jobs, housing, and other
demographic and economic characteristics.
These projections were developed using the
Demographic and Economic Forecasting
Model (DEFM). DEFM uses demographic
assumptions including age and ethnicity-
specific birth rates, death rates, and migration
trends (domestic and international). It also
uses economic assumptions including labor
force participation, labor productivity, and
unemployment rates. Input, assumptions, and
results from DEFM were reviewed twice by a
panel of subject-area experts, including
representatives from local universities,
economic and workforce development
agencies, resource providers, public sector
partners, and key industries. The panel
represented several areas of expertise ranging
from economic and demographic trends to
housing and resource issues. Further details
about DEFM can be found in the 2050
Regional Growth Forecast Process and Model
Documentation in Technical Appendices 2
and 15, respectively.
These regionwide projections were then used
to develop neighborhood level growth
forecasts that distributed population, housing,
and employment growth projections among
the 19 jurisdictions. The neighborhood level
growth forecasts also considered local land
use data, which was developed through

3-10 Chapter 3: Forging a Path for More Sustainable Living
extensive collaboration between SANDAG and
the region’s 18 cities and the County of
San Diego, as well as with other land use
agencies such as tribal governments and the
Department of Defense. The local land
use data incorporated information on
existing development, general plans,
constraints to development (e.g., flood
plains, steep slopes, habitat preserves,
historic districts, building height restrictions,
and zoning), and permitted projects in the
development pipeline.
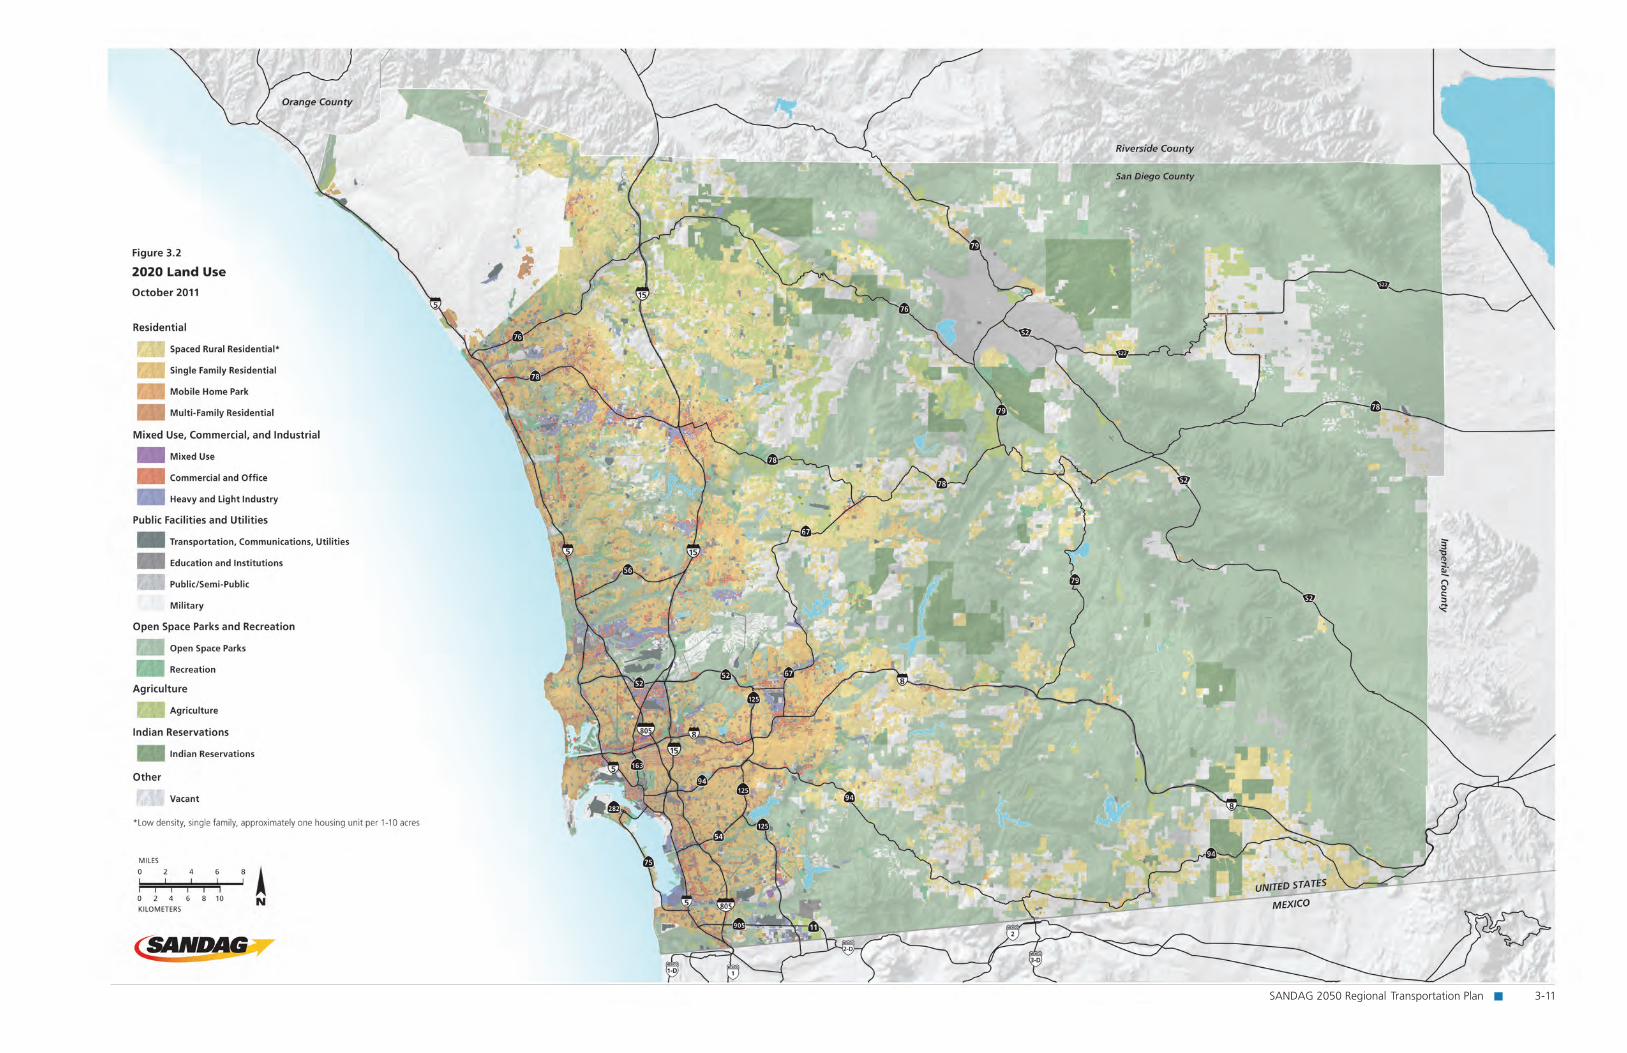
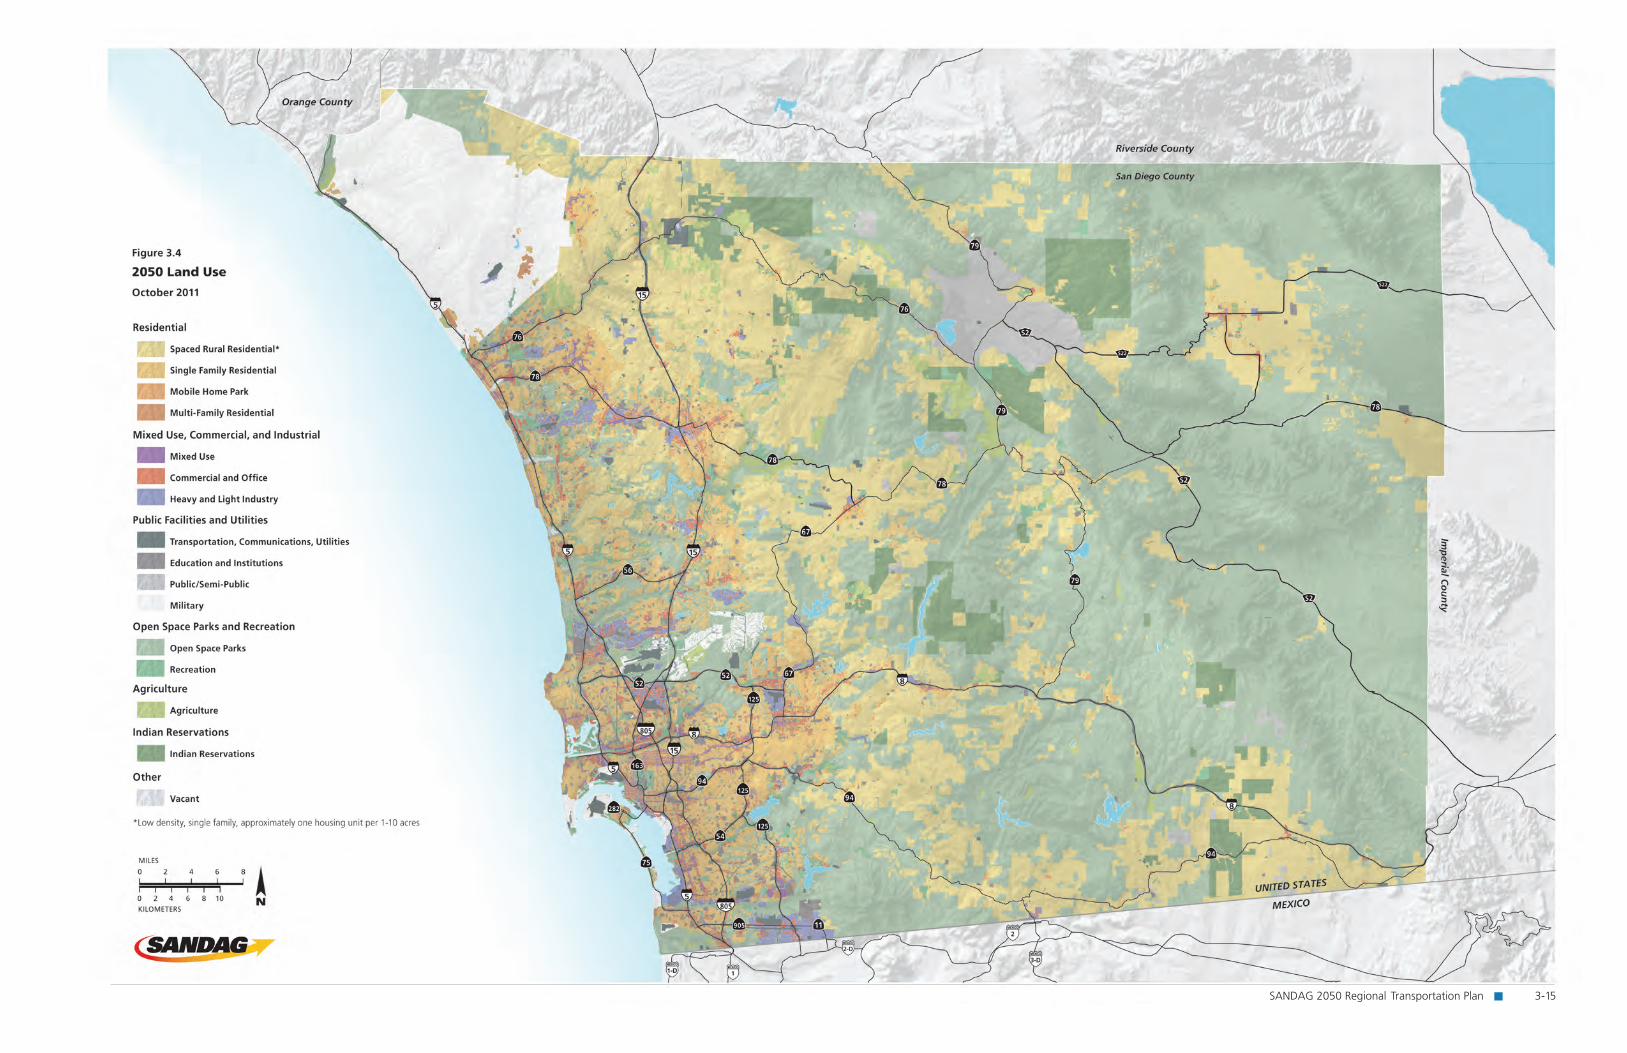
SANDAG has prepared maps that identify the
general location of land uses in the region.
The maps also show residential densities and
commercial development types (Figures 3.2,
3.3, and 3.4 for 2020, 2035, and 2050,
respectively). The maps for 2020 and 2035
also are provided at a subregional level in
Appendix D.
Neighborhood level growth forecasts take
into consideration a neighborhood’s proximity
to existing job centers (along with travel time
estimates and information on local
commuting choices) as well as historical
development patterns. How land in a
neighborhood is used today, how it’s
expected to be developed, how close the
neighborhood is to job centers, and historical
patterns of land use all offer clues to how a
neighborhood is expected to grow.
For the last step, each jurisdiction’s staff
reviewed model results. The final forecast was
adjusted based on local feedback to ensure
that the most current land use information
and assumptions including types of use,
densities, and intensities were correctly
identified and included. In addition to
working with local jurisdiction staff, SANDAG
conducted workshops and made
presentations to city councils and the County
Board of Supervisors to obtain input on the
land use assumptions used in the subregional
forecast. This latest growth forecast looks out
40 years to 2050. This is further into the
future than any previous forecast and extends
two years beyond the life of the TransNet
Extension Ordinance.
SANDAG 2050 Regional Transportation Plan 3-11

3-12 Chapter 3: Forging a Path for More Sustainable Living

SANDAG 2050 Regional Transportation Plan 3-13

3-14 Chapter 3: Forging a Path for More Sustainable Living
SANDAG 2050 Regional Transportation Plan 3-15

3-16 Chapter 3: Forging a Path for More Sustainable Living

SANDAG 2050 Regional Transportation Plan 3-17
The SCS land use
pattern for the
San Diego region
contributes to
reducing GHG
emissions, meeting
our GHG targets and
reducing VMT.
During the past ten years, development
patterns and local plans have aligned more
closely with the goals and objectives of the
RCP, which include focusing more on urban
infill and redevelopment and improving
accessibility to jobs, housing, education and
recreation opportunities. Thus, the SCS land
use pattern for the San Diego region
contributes to reducing GHG emissions,
meeting our GHG targets, and reducing VMT.
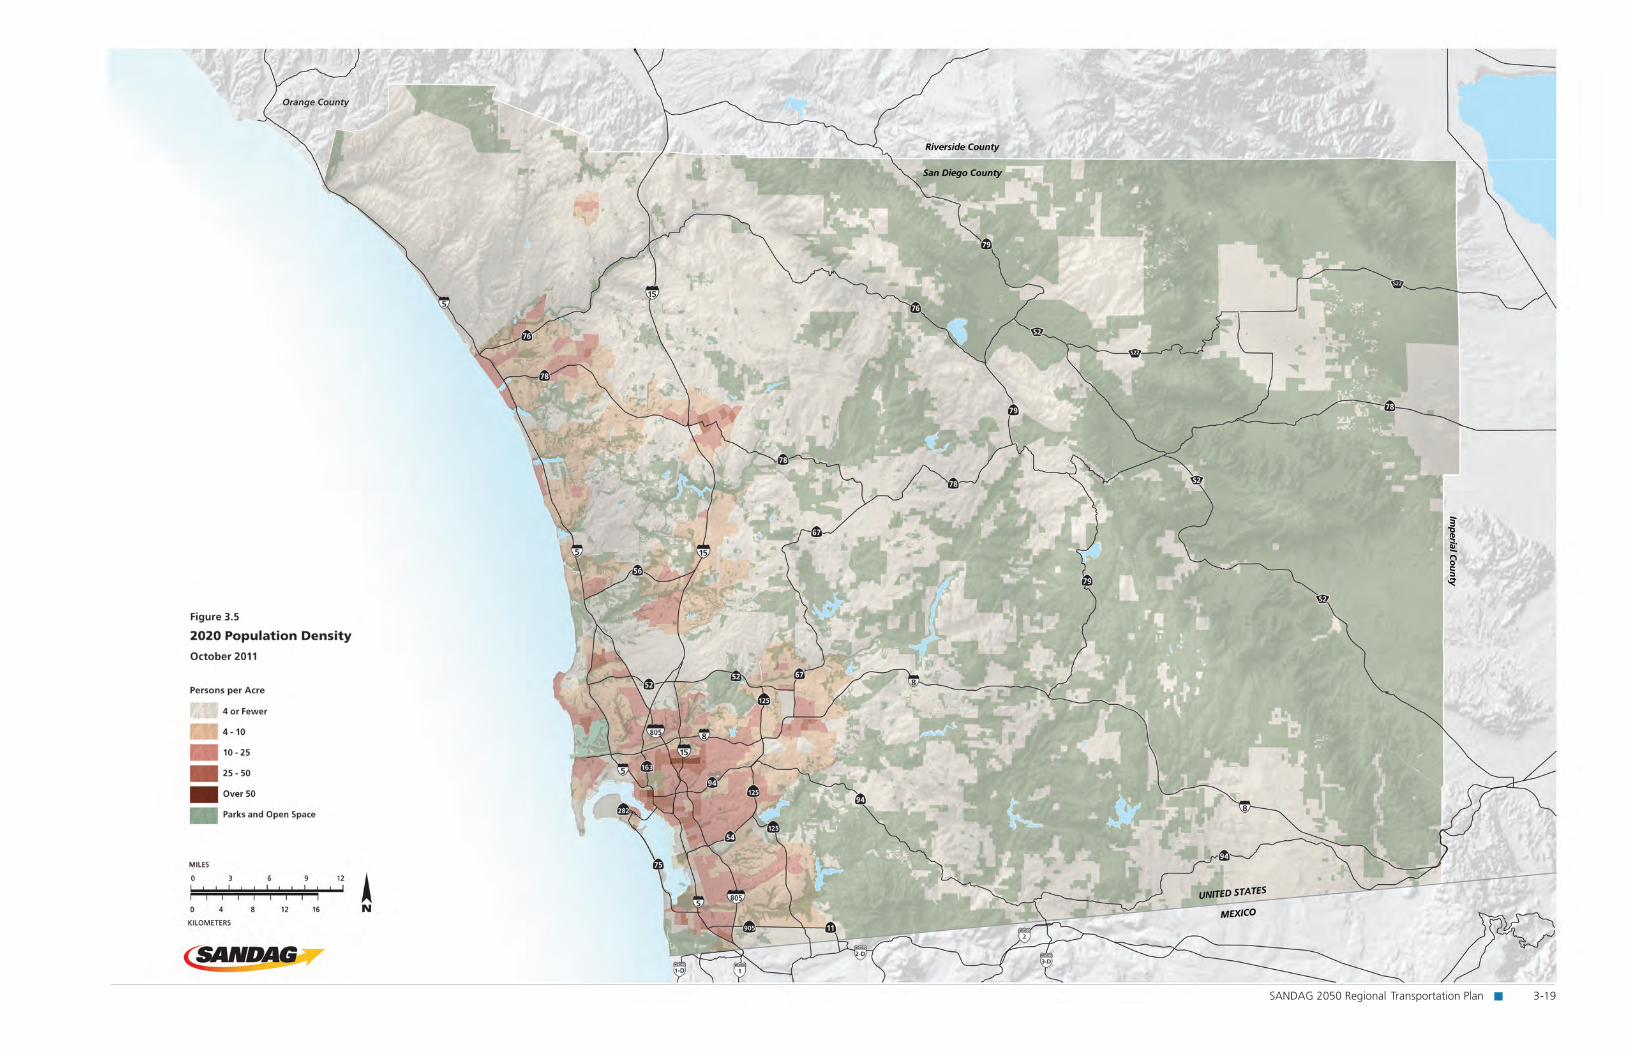
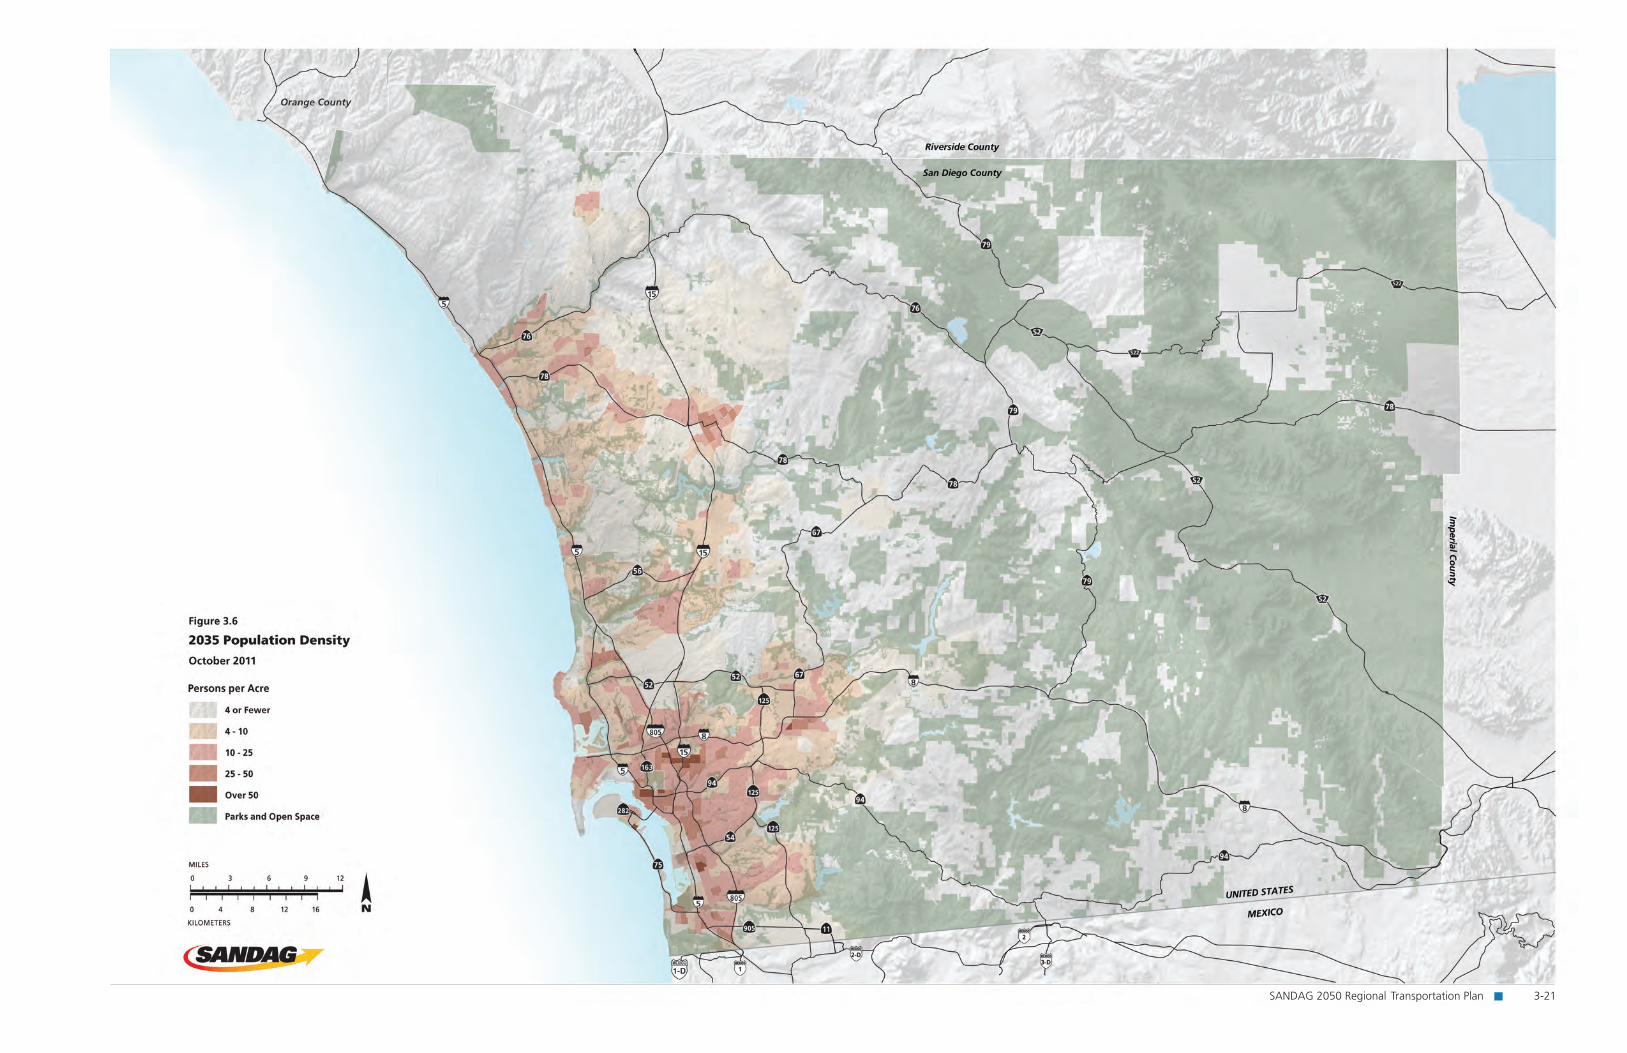
Figures 3.5, 3.6, and 3.7 depict the
2050 Regional Growth Forecast and SCS land
use pattern by showing population densities
of the region (persons per by acre) in 2020,
2035, and 2050, respectively. Together the
maps show that population growth will be
concentrated in the western third of the
region and along major transportation
corridors. The maps also show the extensive
system of habitat areas, open space, and
parkland that the region is preserving for the
future. These natural resources are described
in more detail later in this chapter.
Table 3.2 provides detailed numerical
information about the 2050 Regional Growth
Forecast, which shows the projected changes
in population, housing, and employment
between 2008 (the base year), 2020, 2035,
and 2050. It shows a breakdown of how
many acres are planned for residential,
employment, parks and preserved
open spaces.

3-18 Chapter 3: Forging a Path for More Sustainable Living
SANDAG 2050 Regional Transportation Plan 3-19

3-20 Chapter 3: Forging a Path for More Sustainable Living
SANDAG 2050 Regional Transportation Plan 3-21

3-22 Chapter 3: Forging a Path for More Sustainable Living

SANDAG 2050 Regional Transportation Plan 3-23

3-24 Chapter 3: Forging a Path for More Sustainable Living

SANDAG 2050 Regional Transportation Plan 3-25
Figure 3.8 shows the aging of the region’s population between 2008 and 2050. The
number of people aged 65 and older is
expected to increase by 143 percent. The
number of people older than 85 is projected
to increase by 214 percent. The aging of the
population is a significant demographic trend,
and the 2050 RTP/SCS places more attention
on transportation for seniors, people with
limited means, and individuals with
disabilities. These specialized services are
coordinated with transit services. The
2050 RTP/SCS includes an expansion of the
Senior Mini-Grant program and other
specialized transportation grant programs to
meet this need.
Figure 3.9 shows that the number of homes
located within one half-mile of public transit
services will increase from 45 percent in 2008
to 64 percent in 2050. This increase is based
on new transit services, detailed in Chapter 6
and also on the fact that approximately
80 percent of new growth will be in the
urban areas. Figure 3.10 shows the changes
in housing capacity that have occurred over
time in the SANDAG growth forecasts. The
projected increase in housing capacity is
dramatic for areas with densities between 20
and 39.9 dwelling units per acre and 40-plus
dwelling units per acre. The increases reflect
extensive work by local jurisdictions to update
general and specific plans to accommodate
future growth and development in the
urbanized areas of the region where existing
and planned public transit is located.
Source: SANDAG 2050 Regional Growth Forecast
Figure 3.8 – Population by Age2008 and 2050

3-26 Chapter 3: Forging a Path for More Sustainable Living
2008
Within 1/2 Mile of Transit
Not Within
1/2 Mile of Transit 55%
2050
Not Within 1/2 Mile of Transit
36%
Within 1/2 Mile of Transit
64%
Figure 3.9 – Housing Near Public Transit
Source: SANDAG 2050 Regional Growth Forecast
Figure 3.10 – Housing Capacity (Number of Existing Plus Additional Housing Units Planned)
Source: SANDAG Regional Growth Forecasts
Figures 3.11 through 3.13 (employment
density) and Figures 3.14 through 3.16
(housing density) show that most growth in
housing and employment is expected to occur
in incorporated cities in the western third of
the region in the years 2020, 2035, and 2050,
respectively. The California Transportation
Commission’s Regional Transportation Plan
Guidelines (Guidelines) provide that density
and clustering of land uses are “typically
measured by the number of dwelling units,
shops, and/or employees per acre or square
mile, floor area ratio (FAR), and other similar
measures.” (Guidelines, p. 134) In order to
identify intensity for non-residential land uses,
SANDAG has relied upon the best available
information, which is employment density or
jobs per acre.

SANDAG 2050 Regional Transportation Plan 3-27

3-28 Chapter 3: Forging a Path for More Sustainable Living

SANDAG 2050 Regional Transportation Plan 3-29

3-30 Chapter 3: Forging a Path for More Sustainable Living

SANDAG 2050 Regional Transportation Plan 3-31

3-32 Chapter 3: Forging a Path for More Sustainable Living

SANDAG 2050 Regional Transportation Plan 3-33

3-34 Chapter 3: Forging a Path for More Sustainable Living

SANDAG 2050 Regional Transportation Plan 3-35

3-36 Chapter 3: Forging a Path for More Sustainable Living

SANDAG 2050 Regional Transportation Plan 3-37

3-38 Chapter 3: Forging a Path for More Sustainable Living

SANDAG 2050 Regional Transportation Plan 3-39
The SCS land use
pattern accommodates
the estimated 388,000
new homes that will
be needed regionwide
over the next 40 years
to serve a projected
growth in population
of 1.25 million people.
Welcoming Everyone Who Chooses to Live Here: Housing the Region’s Projected Growth in Population “Identify areas within the region sufficient to
house all the population of the region,
including all economic segments of the
population, over the course of the planning
period of the regional transportation plan
taking into account net migration into the
region, population growth, household
formation and employment growth.”
(Government Code Section 65080(b)(2)(B)(ii))
The SCS land use pattern accommodates the
estimated 388,000 new homes that will be
needed regionwide over the next 40 years to
serve a projected growth in population of
1.25 million people.
After the 2030 RTP and 2030 Regional
Growth Forecast were adopted, changes to
local general plans resulted in a significant
increase in residential capacity regionwide.
The 2030 Regional Growth Forecast projected
a shortfall of nearly 100,000 homes by the
year 2030 (which was addressed by projecting
significant interregional commuting between
San Diego County and Riverside, Orange, and
Imperial Counties, as well as Baja California,
Mexico). But the 2050 Regional Growth
Forecast and SCS land use pattern contain
sufficient residential capacity (more than
435,000 housing units) to accommodate the
region’s projected growth in population of
1.25 million people. The 2050 Regional
Growth Forecast and SCS estimate that
interregional commuting will be minimal,
driven only by the proximity of neighboring
regions to some job centers, and personal
choices. It is estimated that an additional
15,000 households will include residents who
commute into the region for work. Nearly half
of these households will be located in Baja
California, Mexico and much of the remainder
will be in Riverside County.
The SCS land use pattern addresses the needs
of all economic segments of the population.
About 84 percent of the projected 388,000
new homes to be built by 2050 will be
attached, multifamily units – with a planned
capacity of more than 225,000 units at 30 or
greater dwelling units per acre, and almost
75,000 units with a housing density of 20 to
29 dwelling units per acre. This capacity for
planned housing development, particularly for
multifamily development, will help the region
accommodate the projected housing needs
for residents of all income levels.
Accommodating the Eight-year Regional Housing Needs Assessment “Identify areas within the region sufficient to
house an 8-year projection of the regional
housing need for the region.” (Government
Code Section 65080(b)(2)(B)(iii))
“Consider the state housing goals.”
(Government Code Section 65080(b)(2)(B)(vi))

3-40 Chapter 3: Forging a Path for More Sustainable Living
SANDAG is required by state law to
complete a Regional Housing Needs
Assessment (RHNA) in consultation with
the California Department of Housing and
Community Development (HCD), in order to
determine the region’s housing needs in four
income categories – very low, low, moderate,
and above moderate. This process occurs
before each housing element cycle, which
SB 375 changed from a five-year to an
eight-year cycle.
In the past, the RHNA was completed
separately from the RTP. SB 375 now links the
RHNA and RTP processes to better integrate
housing, land use, and transportation
planning. Integrating both processes helps
ensure that the state’s housing goals are met.
The San Diego region received its RHNA
Determination from the California
Department of Housing and Community
Development for the fifth housing element
cycle (2013-2020), as shown in Table 3.3,
following consultation with SANDAG.
SANDAG worked with the local jurisdictions
to identify RHNA allocation options that meet
the four goals of housing element law as
described below. The reports including
background information regarding the RHNA
are included in Appendix D.
1. Increasing the housing supply and the mix
of housing types, tenure, and affordability
in all cities and counties within the region
in an equitable manner, which shall result
in all jurisdictions receiving an allocation of
units for low- and very low-income
households.
It allocates RHNA numbers in all four
income categories to each of the region’s
19 jurisdictions, thus addressing the objective
of promoting socioeconomic equity
throughout the region. Table 3.4
demonstrates the mix of housing types
planned for in the region by jurisdiction and
subregion in four density categories.
2. Promoting infill development and
socioeconomic equity, the protection of
environmental and agricultural resources,
and the encouragement of efficient
development patterns.
It utilizes the forecasted pattern of
development from the 2050 Regional Growth
Forecast, which incorporates policies in local
plans that call for higher density housing to
be concentrated in urbanized areas adjacent
to transit and that protect environmental and
agricultural resources. It also demonstrates
that the region’s local land use plans have
significantly increased the region’s multifamily
housing capacity and ability to accommodate
the housing needs of all income levels during
the next housing element cycle and out to the
horizon year of the 2050 RTP. Table 3.4
Table 3.3 – RHNA Determination by Income Category January 1, 2010 – December 31, 2011 (RHNA Projection Period)
Income Categories % Units
Very Low 22.5% 36,450
Low 17.1% 27,700
Moderate 18.9% 30,610
Above Moderate 41.5% 67,220
Total 100 % 161,980
Source: California Department of Housing and Community Development (HCD)

SANDAG 2050 Regional Transportation Plan 3-41
The region has more
than enough housing
capacity in a variety of
density ranges to
accommodate the
RHNA allocations as
well as the population
projections to 2050.
demonstrates the significant housing capacity,
particularly in the 20 dwelling units per acre
or greater density range, for which local
jurisdictions have planned in the future.
3. Promoting an improved intraregional
relationship between jobs and housing.
It promotes an intraregional relationship
between jobs and housing because the
2050 Regional Growth Forecast distributes
housing and employment growth at a
jurisdiction level using a model that considers
proximity to job centers, travel times, and
commuting choices, as well as land use plans.
Figure 3.23: 2050 Transit Network and Higher
Density Land Uses, shows the relationship of
higher density land uses (residential,
employment, and mixed use) to planned high
quality transit corridors in the 2050 RTP/SCS.
This map also is included in Chapter 3 of the
2050 RTP/SCS.
4. Allocating a lower proportion of housing
need to an income category when a
jurisdiction already has a
disproportionately high share of
households in that income category, as
compared with the most recent decennial
United States census.
It also moves toward improving the current
distribution of lower-income households in
the region to reduce over-concentration.
Appendix D includes a comparison of the
RHNA very low and low income allocations
considered during the RHNA process and the
regional (40 percent) and jurisdiction
percentages of existing lower income
households based on U.S. Census data
(Column (a)). Column (c) is the RHNA
allocation of lower income housing by
jurisdiction as a percentage of their total
RHNA. It shows that the RHNA moves most
jurisdictions closer to the regional percentage
of lower income households with the
exception of the city of Del Mar and the
Unincorporated area of the County. The small
size of Del Mar (population just over 4,000)
and the rural nature and lack of infrastructure
in the Unincorporated area of the County
resulted in RHNA allocations with a lower
percentage of lower income housing than
the regional percentage of lower income
households.
The RHNA also moves toward improving the
current distribution of lower income
households in the region. This is shown in
Appendix D, (RHNA Report Table 4).
The RHNA Plan allocates the RHNA
Determination by jurisdiction. Based on the
RHNA Plan each jurisdiction will need to
identify adequate sites to address its RHNA
allocations in the four income categories
when updating its housing element. Housing
elements are due no later than 18 months
after the SANDAG Board adopts the
2050 RTP, or April 27, 2013.
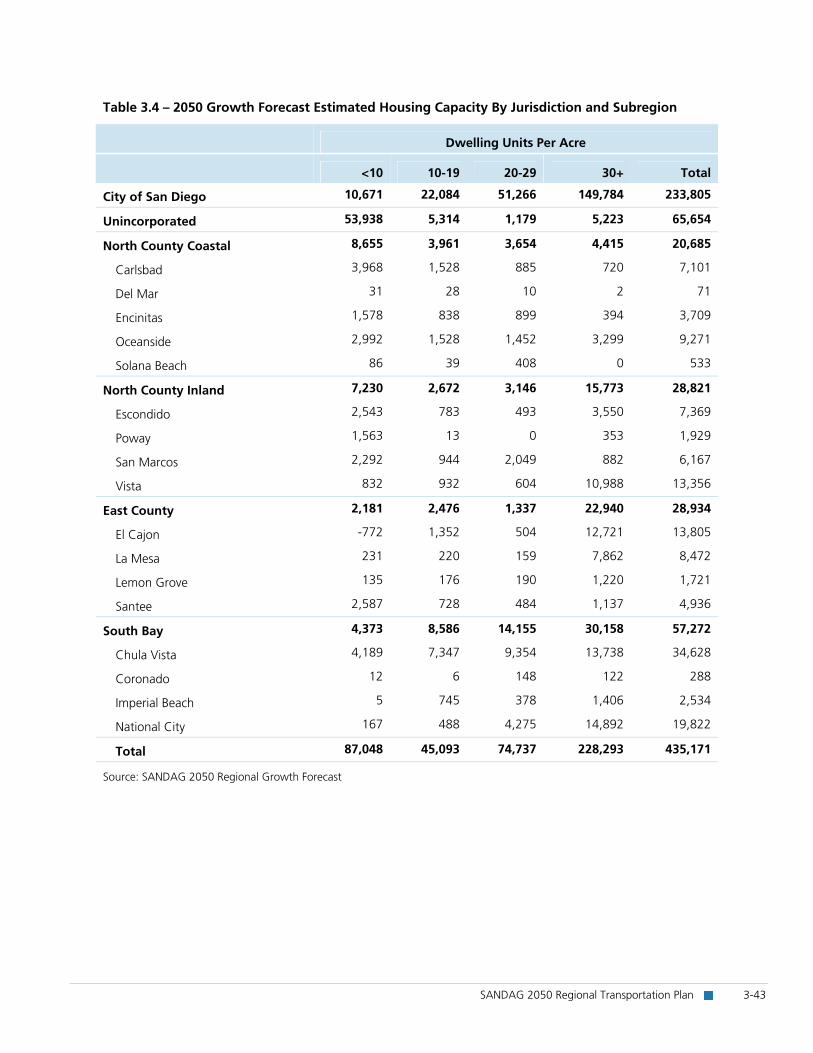
Table 3.4 shows that the region has more
than enough housing capacity in a variety of
density ranges to accommodate the RHNA
allocations as well as the population
projections to 2050. This table provides
housing capacity information based on the
2050 Regional Growth Forecast for the City of
San Diego, the Unincorporated County, and
each city grouped by subregion. In addition to
housing capacity based on local general plans,
the housing capacity in the 2050 growth
forecast includes projected changes to
adopted general plans in some jurisdictions.
This “stretch” or “visionary” capacity was
based on input from the local jurisdictions and
partner agencies for the period of 2035 to
2050 (beyond the time period for the RHNA).
Local land use inputs for the 2035 to 2050
period include draft plan updates, rezoning,
future redevelopment (based on existing
plans), mixed-use development at transit
stations, and redevelopment within Smart

3-42 Chapter 3: Forging a Path for More Sustainable Living
Growth Opportunity Areas shown on the
Smart Growth Concept Map (See Technical
Appendix 9).
SB 375 requires consistency between the
RHNA and SCS – that is, that the SCS land use
pattern can accommodate the RHNA
Determination for the fifth housing
element cycle.
Any changes to land use plans or zoning that
occur during the updates of housing elements
by local jurisdictions as a result of the RHNA
will be reflected in the next regional growth
forecast and RTP. This will ensure that land
use changes resulting from the RHNA and the
housing element process will be considered in
future updates of these two key planning
documents. The goal is to ensure consistency
between future land use and transportation
plans through an iterative process.
SANDAG 2050 Regional Transportation Plan 3-43
Table 3.4 – 2050 Growth Forecast Estimated Housing Capacity By Jurisdiction and Subregion
Dwelling Units Per Acre
<10 10-19 20-29 30+ Total
City of San Diego 10,671 22,084 51,266 149,784 233,805
Unincorporated 53,938 5,314 1,179 5,223 65,654
North County Coastal 8,655 3,961 3,654 4,415 20,685
Carlsbad 3,968 1,528 885 720 7,101
Del Mar 31 28 10 2 71
Encinitas 1,578 838 899 394 3,709
Oceanside 2,992 1,528 1,452 3,299 9,271
Solana Beach 86 39 408 0 533
North County Inland 7,230 2,672 3,146 15,773 28,821
Escondido 2,543 783 493 3,550 7,369
Poway 1,563 13 0 353 1,929
San Marcos 2,292 944 2,049 882 6,167
Vista 832 932 604 10,988 13,356
East County 2,181 2,476 1,337 22,940 28,934
El Cajon -772 1,352 504 12,721 13,805
La Mesa 231 220 159 7,862 8,472
Lemon Grove 135 176 190 1,220 1,721
Santee 2,587 728 484 1,137 4,936
South Bay 4,373 8,586 14,155 30,158 57,272
Chula Vista 4,189 7,347 9,354 13,738 34,628
Coronado 12 6 148 122 288
Imperial Beach 5 745 378 1,406 2,534
National City 167 488 4,275 14,892 19,822
Total 87,048 45,093 74,737 228,293 435,171
Source: SANDAG 2050 Regional Growth Forecast

3-44 Chapter 3: Forging a Path for More Sustainable Living
The SCS land use
pattern identifies
protected parklands
and open space,
natural resource areas,
and farmland in the
region.
Protecting Resource Areas and Farmland: A key element of the Sustainable Communities Strategy “Gather and consider the best practically
available scientific information regarding
resource areas and farmland in the region.”
(Government Code Section 65080(b)(2)(B)(v))
San Diegans share a strong attachment to the
region’s open spaces. When asked what they
like most about the San Diego region, natives
and newcomers alike consistently cite the
enviable climate, beaches, bays, urban
canyons, local mountains, and deserts.
In addition to identifying areas where
development is projected to occur, the
SCS land use pattern identifies protected
parklands and open space, natural resource
areas, and farmland in the region. These
parklands and open space, natural resource
areas, and farmland were identified using the
best practically available scientific information.
This includes the SANDAG Land Information
System database, SANDAG Conserved Lands
database, San Diego Geographic Information
Source (SanGIS) database, Multiple Species
Conservation Program (MSCP), and the North
County Multiple Habitat Conservation
Program (MHCP).
Of the 2.7 million acres within the San Diego
region, about half (50.6 percent) have been
conserved as parks or open space (see
Table 3.5). These acres are included in the
SCS land use pattern. These lands range from
public use parks, such as Mission Bay and
Anza Borrego State Park, to rural open space
such as the Otay Mountain Wilderness Area
and U.S. Forest Service Lands. These areas do
not include military areas such as Camp
Pendleton and Marine Corps Air Station
Miramar, which contain undeveloped land
that is not accessible to the public and not
considered conserved as open space. Figures
3.14 through 3.16 (housing density) show the
location of these parks and open space lands.
The natural environment in the San Diego
region includes three general geographic
areas: the coast, the mountains, and the
desert. Most people live and work in the
western portion of the region. Although
nearly 24 percent of the western portion of
the region is not in its original natural state
(about 19 percent is developed, 4 percent is in

SANDAG 2050 Regional Transportation Plan 3-45
agricultural production and 1 percent is
disturbed habitat), the remaining 76 percent
is made up of natural habitats. Of these,
30 percent are covered by chaparral,
8 percent by coastal sage scrub, 5 percent by
grasslands, and 33 percent by other types of
vegetation (including those found in dunes,
marshes, oak and eucalyptus woodlands,
riparian scrub, and coniferous forests), as
shown in Figure 3.17 (San Diego Regional
Generalized Vegetation).
Protecting the Region’s Natural Habitats The San Diego region has conserved natural
habitats for the last two decades. Regional
planners have focused considerable effort on
four habitat conservation plans (HCP): the
Multiple Species Conservation Program
(MSCP) South, finalized in 1998; the Multiple
Habitat Conservation Program (MHCP),
finalized in 2003; the North County MSCP,
anticipated for completion in 2012; and the
East County MSCP, which is expected to
begin after the North County MSCP is
adopted. The SCS land use pattern
incorporates finalized habitat plans as well as
the conservation of other sensitive resource
lands such as steep slopes, wetlands, and
floodplains as reflected in plans by local
jurisdictions. These local and regional plans
shown on Figure 3.18 ensure the conservation
of plant and animal species, and natural
habitats through low density zoning,
conservation easements, and land purchases.
Six jurisdictions (the cities of Carlsbad, Chula
Vista, La Mesa, Poway, San Diego, and the
southern portion of the County of San Diego),
have approved habitat conservation plans and
signed implementing agreements that
collectively cover 20 percent of our region.
Seven jurisdictions (the cities of Encinitas,
Escondido, Oceanside, San Marcos, Santee,
Vista, and the northern portion of the County
of San Diego) are working on agreements
that cover another 73 percent of our region.
Seven jurisdictions (the cities of Coronado,
Del Mar, El Cajon, Imperial Beach, Lemon
Grove, National City, and Solana Beach),
which collectively cover slightly more than 1
percent of our region, are not pursuing
agreements because they have limited natural
habitats within their boundaries. The
remaining 6 percent of our region is military
land conserved by Integrated Natural
Resource Management Plans, which are
developed under voluntary, cooperative
agreements among a Department of Defense
installation, the U.S. Fish and Wildlife Service,
and the California Department of Fish
and Game.
As part of the SANDAG participation in
planning for the conservation of regional
habitats, SANDAG developed a database of
conserved lands in 2010 (SANDAG Conserved
Lands database, 2010). This database, which
is regularly updated and available to the
public, serves as the basis for monitoring
habitat conservation
(http://www.sandag.org/resourcemaps).
Table 3.5 – Park Land and Open Space in the San Diego Region
Ownership Type Acreage
Public Designated Park 996,170
Public Open Space 278,673
Private Conserved Lands 92,013
Total: 1,366,828
Source: SANDAG 2050 Regional Growth Forecast and SANDAG Conserved Lands Database

3-46 Chapter 3: Forging a Path for More Sustainable Living

SANDAG 2050 Regional Transportation Plan 3-47

3-48 Chapter 3: Forging a Path for More Sustainable Living

SANDAG 2050 Regional Transportation Plan 3-49

3-50 Chapter 3: Forging a Path for More Sustainable Living

SANDAG 2050 Regional Transportation Plan 3-51
Conserved habitat lands and land proposed
for habitat conservation totals 61 percent of
the region, as shown in Figures 3.19 and
3.20. This includes lands in each of the
habitat conservation areas (Figure 3.18). It is
anticipated that all conserved lands would be
protected by the year 2030 in accordance
with the approved conservation plans and
signed implementing agreements. Figure 3.21
illustrates wetlands in our San Diego region.
The regional habitat conservation plans in the
San Diego region are designed to provide an
umbrella of protection for multiple species by
conserving their habitats and the linkages that
allow them to travel between habitats. The
HCPs were designed under the State’s Natural
Communities Conservation Planning program.
Even though the umbrella protection was
afforded to most species and habitats,
additional protections are required to cover
species not included in the regional habitat
plans (e.g., Tidewater goby (Eucyclogobius
newberryi)). These additional protections also
are needed while experts continue to study
whether the habitat plans adequately protect
species (e.g., Hermes copper butterfly
(Lycaena thornei)). In most cases, the
distribution and abundance of these species
are unknown. While conservation,
management, and monitoring efforts
provided under the regional HCPs are
expected to help these species, additional
regulatory protections exist for them. An
analysis of project impacts to all biological
resources is still required under the California
Environmental Quality Act (CEQA) for
sensitive species, sensitive habitat (including
wetlands), and wildlife movement.
Federal or state permits also may be required
under the Clean Water Act, the California Fish
and Game Code, and/or the Porter-Cologne
Water Quality Act based upon the project-
specific impact analysis. In addition, local
jurisdictions may have their own mitigation
requirement for species (also known as
species-specific mitigation) that are not
included in the HCPs. Regional HCPs,
therefore, provide an umbrella of protection
through regional habitat conservation without
taking away existing protection by other local,
state, or federal regulations.
TransNet Environmental Mitigation Program “The metropolitan planning organization shall
consider financial incentives for cities and
counties that have resource areas or
farmland.” (Government Code Section
65080(b)(4)(C))
In 1987, San Diego County voters approved
TransNet, a half-cent sales tax to fund a
variety of transportation improvements
throughout the region. The initial 20-year,
$3.3 billion program expired in 2008.
However, in November 2004, 67 percent of
the region’s voters supported the extension of
TransNet for another 40 years to 2048. The
extension is expected to generate an
additional $14 billion for highway, transit, and
local road projects, as well as other
transportation improvements.
Figure 3.19 – Land Conserved
Conserved Habitat Lands (2011)
Proposed Conserved Habitat Lands*
Camp Pendleton and MCAS Miramar
Other Lands
* Lands in North and East County Multiple Species Conservation Plan (MSCP) are in the planning process and not adopted.
47%
6%
33%
14%

3-52 Chapter 3: Forging a Path for More Sustainable Living
The Environmental Mitigation Program (EMP)
was created as part of the TransNet Extension
Ordinance, and it goes beyond traditional
mitigation programs. (“Mitigation” is the
effort to compensate for the loss of native
habitat – which is disturbed by new
development – through the preservation
and/or restoration of another native habitat.
Mitigation occurs after all methods to avoid
and/or minimize impacts have been
exhausted.)
SANDAG employs the EMP to help fill the
mitigation needs resulting from major
transportation infrastructure improvement
projects and programs identified in the RTP.
SANDAG intends to satisfy the mitigation
requirements for these projects
comprehensively, rather than on a project by
project basis, to maximize opportunities for
acquiring land early and restoring habitats. In
turn, this funding enables SANDAG to help
implement regional habitat conservation plans
by targeting key acquisition areas for
conservation, management and monitoring.
As of September 2011, about 1,393 acres
have been acquired using EMP funds.
Additional Protection for Rare, Threatened, Endangered, and CEQA-Sensitive Species CEQA Guidelines Appendix G requires an
evaluation of the potential impacts to
sensitive species, sensitive habitats, wetlands
including riparian habitats, wildlife movement
and migration, and the impacts to adopted
regional habitat conservation plans. This
includes the Natural Communities
Conservation Plan and other local policies and
plans for biological conservation. Prior to the
development of any native habitat in the San
Diego region, a biological impact assessment
is required by all local jurisdictions subject to
the CEQA. The purpose of the assessment is
to determine consistency with the regional
HCPs and assess any impacts to species and
habitats not covered by these plans. This
includes wetland resources such as
U.S. waters.
Protecting the Region’s Farmlands The Farmland Mapping and Monitoring
Program (FMMP), administered by the Division
of Land Resource Protection at the California
Department of Conservation, produces maps
and statistical data to analyze impacts to
California’s agricultural resources. To
characterize existing and potential farmland,
agricultural lands are rated according to soil
quality and irrigation status. FMMP maps are
updated every two years using aerial
photographs, a geographic information
system, public review, and field
reconnaissance. Lands important for
agriculture are placed in one of four
categories of productivity established by the
United States Department of Agriculture
(USDA). These lands are evaluated according
to the specific qualities of the soil, slope of
the land, degree of wetness, flooding hazards
and other factors. The FMMP identifies about
223,000 acres of land as “Important
Agricultural Lands,” as shown in Figure 3.22
and described in Table 3.6.
These lands also are reflected in the SCS land
use pattern, and they are not threatened
because of low-density zoning, or the
purchase of land for conservation easements.
In the SCS land use pattern, 95 percent of the
region’s existing agricultural land is expected
to remain available for agriculture.
Thirty-three percent of the region’s
agricultural land is planned for agricultural use
only, and 62 percent is planned as low-
density, rural residential land that allows and
often encourages agricultural use. Figure 3.22
includes agricultural preserves such as the
San Pasqual Valley in the City of San Diego
and areas under Williamson Act contracts.
The California Land Conservation Act
SANDAG 2050 Regional Transportation Plan 3-53
commonly referred to as the Williamson Act
enables local governments to enter into
contracts with private landowners to restrict
specific parcels of land to agricultural or
related open space use.
Considering Mineral Resource Areas The California State Mining and Geology
Board has designated some lands to be areas
of statewide or regional significance for
construction aggregate resources. Aggregate
materials include sand, gravel, and crushed
stone. They are key ingredients in concrete
and asphalt, as well as for constructing and
maintaining the physical framework of
buildings and infrastructure. According to the
California Geologic Survey, aggregate supply
sources in the San Diego region have dropped
from 48 mines in 1980 to 27 mines in 1995.
The number of significant and active mines
has since declined to only 16. The California
Geologic Survey projects a 40 percent
shortfall in the statewide supply of aggregate
material needed to meet demand over the
next 50 years and an 83 percent shortfall in
the region’s supply of aggregate material. As
supplies decrease, importing aggregate from
other regions or countries will increase.
SANDAG, in cooperation with Caltrans
District 11, completed the San Diego Region
Aggregate Supply Study in January 2011 to
examine the supply issues related to
aggregate. (The study is available at
www.sandag.org/aggregate.) The purpose of
the study was to provide background
information, as well as the tools necessary to
begin developing a framework to address
future projected shortfalls of this important
resource. The California Department of
Conservation classifies lands into four Mineral
Resource Zones (MRZs). MRZ-1 includes areas
where no significant mineral deposits are
present, or where there is little likelihood they
are present. MRZ-2 includes areas where
geologic information indicates that significant
mineral deposits are present, or where there is
a high likelihood they are present. MRZ-3
includes areas that contain mineral deposits,
but where their significance to the region or
state cannot be evaluated because detailed
data is lacking. MRZ-4 includes areas where
geologic information does not rule out the
presence or absence of mineral resources.
Areas with the greatest potential for
aggregate sources (MRZ-2 classified) are
largely designated in local general plans as
Military, Open Space and Industrial, and have
been considered as such in the SCS land use
pattern. Information contained in the San
Diego Region Aggregate Study will be used by
planners to help manage the region’s
aggregate resources.

3-54 Chapter 3: Forging a Path for More Sustainable Living

SANDAG 2050 Regional Transportation Plan 3-55

3-56 Chapter 3: Forging a Path for More Sustainable Living

SANDAG 2050 Regional Transportation Plan 3-57
Table 3.6 – USDA Important Farmland Acreage
USDA Important Farmland Category 2008 Acreage
Prime Farmland 7,754
Land with the best combination of physical and chemical features able to sustain long term agricultural production. This land has the soil quality, growing season, and moisture supply needed to produce sustained high yields. Land must have been used for irrigated agricultural production at some time during the four years prior to the mapping date.
Farmland of Statewide Importance 10,411
Land similar to Prime Farmland but with minor shortcomings, such as greater slopes or less ability to store soil moisture. Land must have been used for irrigated agricultural production at some time during the four years prior to the last FMMP mapping date.
Unique Farmland 51,975
Land of lesser quality soils used for the production of the State’s leading agricultural crops. This land is usually irrigated, but may include non-irrigated orchards or vineyards as found in some climatic zones in California. Land must have been cropped at some time during the four years prior to the mapping date.
Farmland of Local Importance 153,186
Land of importance to the local agricultural economy as determined by each county’s board of supervisors and a local advisory committee. In San Diego County, this category is defined as land that meets all the characteristics of Prime and Statewide, with the exception of irrigation. They are farmlands not covered by the above categories but are of significant economic importance to the county. They have a history of good production for locally adapted crops. The soils are grouped in types that are suited for truck crops (such as tomatoes, strawberries, cucumbers, potatoes, celery, squash, romaine lettuce, and cauliflower) and soils suited for orchard crops (avocados and citrus).
Important Farmland Total: 223,326
Source: U.S. Department of Agriculture

3-58 Chapter 3: Forging a Path for More Sustainable Living

SANDAG 2050 Regional Transportation Plan 3-59

3-60 Chapter 3: Forging a Path for More Sustainable Living

SANDAG 2050 Regional Transportation Plan 3-61

3-62 Chapter 3: Forging a Path for More Sustainable Living

SANDAG 2050 Regional Transportation Plan 3-63
An important part of
the Revenue
Constrained
Transportation
Network is a
significant investment
in public transit (rail
and bus), as well as
facilities that
encourage walking
and bicycling as forms
of active
transportation.
Investing in a Transportation Network that Provides Residents and Workers with Transportation Options that Reduce Greenhouse Gas Emissions: The 2050 RTP Transportation Network “Identify a transportation network to service
the transportation needs of the region.”
(Government Code Section 65080(b)(2)(B)(iv))
The 2050 RTP and its SCS are based upon
four pillars of transportation planning to serve
the transportation needs of our region.
They are a Revenue Constrained
Transportation Network (that is, a network
funded by financial resources expected
between now and 2050); Transportation
Demand Management (TDM) measures;
Transportation System Management (TSM)
measures; and pricing measures. Taken
together, these four pillars will provide
residents and workers with alternatives to
driving alone, and they will help the region
meet or exceed its state-mandated targets for
reducing GHG emissions. Each of these four
components is explained in detail in the
following chapters: transportation network
(Chapter 6), TDM (Chapter 8), TSM
(Chapter 7), and pricing (Chapters 6 and 7).
The GHG emissions reductions per capita
shown in Tables 3.1 and 3.7 do not include
the use of alternative fuels. Also, they do not
consider the benefits of California’s low
carbon fuel standard program, which calls for
a reduction of at least 10 percent in the
carbon intensity of California's transportation
fuels by 2020. They also do not consider the
benefits due to increases in vehicle efficiency
(“Pavley” regulations that reduce GHG
emissions in new passenger vehicles).
Although SANDAG is not able to take credit
for these transportation measures toward
meeting the state-mandated GHG emissions
targets for the region pursuant to SB 375,
SANDAG recognizes the role that regional
and local governments can play in
accelerating the deployment of alternative
fuel vehicles and fueling and recharging
stations. Therefore, SANDAG has been active
in this area, which in turn helps the state
meet its overall reduction target for
greenhouse gases.
An important part of the Revenue
Constrained Transportation Network, which is
described more fully in Chapter 6, Table 6.3,
is a significant investment in public transit (rail
and bus), as well as facilities that encourage
walking and bicycling as forms of active
transportation. The aim of these investments
is to significantly increase the attractiveness of
public transit, walking, and bicycling –
particularly in areas that are planned for more
compact and mixed-use development.
Investments in our local streets and roads,
including access to regional airports; goods
movement projects; and TDM and TSM
projects and programs also are integral to the
overall transportation network.
The overarching goal of the public transit
investments detailed in the 2050 RTP
(Chapter 6) is to create a world-class transit

3-64 Chapter 3: Forging a Path for More Sustainable Living
Investments that
promote bicycling and
walking also are an
important part of the
Revenue Constrained
Transportation
Network.
system for the San Diego region by 2050 that
connects our homes to the region’s major
employment centers and other destinations.
Achieving this vision means making public
transit a more appealing option for many trips
and reducing the impact of vehicle travel on
the environment and on public health.
Specific goals include:
Making public transit more time-
competitive with automobile travel
Maximizing the role of public transit within
the broader transportation system
Reducing vehicle miles traveled and
lowering greenhouse gas emissions
throughout our region
Investments that promote bicycling and
walking also are an important part of the
Revenue Constrained Transportation Network.
A regional bicycle network, estimated to cost
about $419 million (in 2010 dollars) is part of
the San Diego Regional Bicycle Plan, approved
by the SANDAG Board on May 28, 2010. It is
included in the 2050 RTP. The Plan can be
found in Technical Appendix 13 and at
www.sandag.org/bicycle.This Plan provides a
vision for a diverse regional bicycle system of
interconnected bicycle corridors, support
facilities, and programs to make bicycling
more practical and desirable to a wider cross-
section of people in our region. This vision is
intended to guide the development of the
regional bicycle system through the year
2050. In addition, funding estimated at
$1.789 billion is included in the 2050 RTP for
local bicycle and local and regional pedestrian
projects. An additional $700 million is
included for a Safe Routes to Transit program
to ensure safe pedestrian and bicycle access
to transit stations. The Active Transportation
Program and the nearly $600-million Smart
Growth Incentive Program, total nearly
$3.1 billion (in 2010 dollars) in the 2050 RTP.
Providing for a range of transportation
options in the region’s transportation network
will be greatly facilitated by adopting a
“Complete Streets” approach to the project
development. The complete streets approach
affords policy makers, planners and engineers
with the opportunity to carefully evaluate and
accommodate the needs motorists,
pedestrians, cyclists, transit vehicles and
transit users, the young and old, and the able-
bodied and physically challenged through the
entire project development process. This
ensures that the needs of all users of the
public right of way are properly
accommodated based on informed decisions
about existing and future demand, and that
proper accommodations are designed into the
project from the outset.
The Complete Streets Act of 2008 requires
local jurisdictions in California to plan for the
needs of all transportation system users with
every major revision to general plan local
circulation elements, and the region’s
TransNet Extension Ordinance requires
accommodation of bicyclists and pedestrians
in most TransNet funded projects. Changes to
local policies and project development
procedures will be necessary to comply with
these requirements, and SANDAG can
support this process through incentives and
technical assistance. In combination with the
smart growth development and urban design
practices supported by the RTP and RCP, this
will make it easier for the public to choose a
means of travel that reduces vehicle miles
traveled and greenhouse gas emissions.
Considering TransNet Projects in the SCS “Nothing in this section requires projects
programmed for funding on or before
December 31, 2011, to be subject to the
provisions of this paragraph if they (iii) were
specifically listed in a ballot measure prior to
December 31, 2008, approving a sales tax

SANDAG 2050 Regional Transportation Plan 3-65
increase for transportation projects.”
(Government Code Section 65080(b)(2)(L))
The TransNet Extension Ordinance as it was
approved by the voters in November 2004
includes specific transportation projects.
Based upon this provision of SB 375, the
projects identified in TransNet need not be
variables in reaching the GHG targets
established by CARB. These TransNet projects
have been identified in the Revenue
Constrained Transportation Network detailed
in Chapter 6, Table 6.3.
Transportation Demand Management Measures TDM measures are important in helping the
region reduce GHG emissions by improving
the efficiency of our transportation system.
These measures help reduce or eliminate
vehicle trips during peak periods of demand.
They typically offer programs and incentives
to encourage the use of modes of
transportation other than driving alone, or to
encourage people to shift their trips to times
when demand on the transportation system is
low. Examples of current TDM measures are
employer-sponsored transportation benefits,
regional transit and vanpool subsidies, and
carpool and biking incentives.
The TDM measures that complement the
2050 RTP transportation network (see
Chapter 8) include:
Expanded marketing of the SANDAG
iCommute program
Expanded vanpool and carpool incentive
programs
New resources for teleworking
Expanded bike locker program and new
bike stations
New bike sharing and carsharing programs
Expanded SchoolPool programs
New buspool program in coordination
with regional military bases
Transportation System Management Measures TSM measures also help reduce GHG
emissions by helping to maximize the
efficiency of existing and future transportation
facilities. A combination of programs –
including signal and ramp metering
coordination and optimization; improved
performance monitoring; and advanced
vehicle and roadside communication
platforms – will increase the ability of
operators to monitor the performance of the
transportation system, manage our system
better, and improve efficiency. TSM measures
that complement the 2050 RTP transportation
network (see Chapter 7) include expanded:
Traveler information services
Improvements to the timing of traffic
signals
Ramp metering

3-66 Chapter 3: Forging a Path for More Sustainable Living
Management of arterials, freeways, and
transit/Trolley corridors
Bottleneck/auxiliary lane projects
Incident management (e.g., Freeway
Service Patrol)
Pricing Measures Pricing strategies also are used to reduce the
demand on our transportation system. The
long-established strategy of varying prices
within corridors with Managed Lanes, such
as the managed or express lanes in the I-15
Corridor, is included in the 2050 RTP. These
High Occupancy Toll (HOT) lanes are operated
in ways that incentivize the use of public
transit and sharing rides, both of which
contribute to reducing greenhouse
gas emissions.
Meeting Targets for Reducing Greenhouse Gas Emissions “Set forth a forecasted development pattern
for the region, which, when integrated with
the transportation network, and other
transportation measures and policies, will
reduce greenhouse gas emissions from
automobiles and light trucks to achieve, if
there is a feasible way to do so, the
greenhouse gas emission reduction targets
approved by the state board.” (Government
Code Section 65080(b)(2)(B)(vi))
On September 23, 2010, CARB set targets for
lowering greenhouse gas emissions in the
San Diego region. They call for a 7 percent
reduction, per capita, in greenhouse gas
emissions from passenger vehicles by 2020
(compared with 2005); and a 13 percent
reduction by 2035 through land use and
transportation planning.
The San Diego region will meet these targets,
shown in Table 3.1, by focusing housing and
employment growth in urbanized areas;
protecting sensitive habitat and open space;
and investing in a transportation system that
provides residents and workers with
transportation options. The determination
that SANDAG will meet the CARB GHG
reduction target is based upon modeling
methodology which is described further
below.
The process to develop the plan was based
upon modeling and the use of smart growth
and sustainable development principles that
have been standard planning practice in the
region for some time along with an extensive
public outreach process.
Figure 3.23, shows the 2050 RTP transit
network and the areas of the region with the
highest residential, employment and mixed-
use densities as well as the planned open
space areas. The land use data illustrated on
this map were used to identify the most
appropriate locations for public transit
investments to support the higher density
development assumed in the SCS land use
pattern. This figure also illustrates that more
than half the region’s land area remains in
open space.

SANDAG 2050 Regional Transportation Plan 3-67
FIGURE 3.23

3-68 Chapter 3: Forging a Path for More Sustainable Living
In evaluating the performance of the RTP/SCS,
SANDAG used an enhanced four-step
transportation model. Four-step models have
been the standard in transportation modeling
since the late 1950s, and they are used by
nearly every Metropolitan Planning
Organization (MPO) in the United States for
the development of transportation plans,
corridor studies, Federal Transit
Administration New Starts proposals, and air
quality analyses. The traditional four steps of
this model are:
1. Trip generation
2. Trip distribution
3. Mode choice
4. Traffic (route) assignment
Output from the four-step model includes
total vehicle miles traveled in the region and
other GHG factors such as vehicle speed and
congestion. The model outputs take into
account the forecasted land use pattern, the
revenue constrained multimodal
transportation network, and the
implementation of telework programs. These
outputs are converted into total GHG
emissions in the region using the CARB
Emission Factors (EMFAC 2007) model.
The regional transportation model inputs
include the land use, motorized network,
TSM, and TDM assumptions in the SCS. All of
the SCS inputs interact and fuse with one
another in the transportation model, which
makes it difficult to identify the individual
contribution of each component to the overall
GHG reductions. For example, modeling each
component individually and summing results
will yield a different result than modeling the
components collectively due to the mutual
benefits of the components working together.
SANDAG includes reductions in GHG
emissions using off-model factors to account
for the following programs: Safe Routes to
School; regional vanpool, carpool, and
buspool programs; and pedestrian and bicycle
network improvements. Unlike the
transportation model that combines various
factors into one summarized output, the off-
model measures are calculated separately.
Each off-model strategy was developed with
its own unique calculation methodology
based on a review of best practices across the
country. Documentation of this methodology
is included in Technical Appendix 15.
SANDAG also contracted with a consultant to
validate the methodology of the off-model
calculations.
The off-model GHG reduction benefits are
then subtracted from the model GHG outputs
to determine the projected GHG emissions for
the region. Per capita emissions are calculated
using total projected GHG emissions divided
by the regional population. For this analysis,
and to determine if the SCS achieves the GHG
targets pursuant to SB 375, only emissions
from four CARB vehicle classifications are
included in this calculation. They are: Light
Duty Auto, Light Duty Truck 1, Light Duty
Truck 2, and Medium Duty Truck.
The SANDAG transportation model also
evaluates VMT and CO2 emissions for all
vehicles, which include passenger vehicles
covered under SB 375 as well as heavy duty
trucks, public buses, and motorcycles. Table
3.7 below provides additional model output
information to further explain the emission
reductions (tons per capita) for SB 375 vehicle
classes and all vehicle classes and for the
horizon years of 2020, 2035 and 2050.
SB 375 requires that SANDAG demonstrate
how emission reduction targets will be met
for 2020 and 2035, not 2050.

SANDAG 2050 Regional Transportation Plan 3-69
So why do GHG reductions decrease over
time? There are several factors that cause this
decrease. First, in the early years of the RTP,
the region makes significant investments in
the transportation network, including major
transit investments, during a recessionary
economic cycle when fewer people are driving
to jobs and more people choose to use other
transportation options. As a result, there are
higher initial reductions from the 2005 base
year. By 2020 and 2035 it is assumed that the
economy improves and more residents are
driving to jobs. Additionally, in the later years
of the plan, after the urbanized areas have
been developed according to local general
plans, development will gradually move
toward more remote areas where fewer
transportation options are available. This
growth is likely to result in an increased
demand for driving.
The results shown for 2050 are best estimates
based on historical and current empirical
observations in the region and do not reflect
attitude changes about transportation. Such
changes may occur as a result of significant
investments in other transportation options
and changes to local land use plans that
could result in greater densification of our
urban areas.
In addition, the GHG modeling for 2050 uses
emission factors for the year 2040 (EMFAC
2007 includes emissions factors through
2040 only) and assumes no technological
Table 3.7 – Results of GHG Emissions and VMT Reductions – 2050 SANDAG Regional Transportation Plan
Vehicle Miles Traveled Per Capita
Change from 2005 Change from 2008
SB 3751 All2 SB 3751 All2 SB 3751 All2
2005 25.4 27.6 - - - -
2008 24.4 25.6 -4% -7% - -
2020 22.3 23.6 -12% -14% -9% -8%
2035 22.8 24.3 -10% -12% -7% -5%
2050 23.6 25.2 -7% -8% -3% -2%
Carbon Dioxide (CO2) - Tons Per Capita
Change from 2005 Change from 2008
SB 3751 All2 SB 3751 All2 SB 3751 All2
2005 26.0 31.3 - - - -
2008 24.9 28.0 -4% -10% - -
2020 22.4 25.8 -14% -18% -10% -8%
2035 22.6 26.7 -13% -15% -9% -5%
2050 23.5 27.8 -10% -11% -6% -1% 1 Cars and light duty trucks only 2 All vehicles
Source: SANDAG Travel Demand Model
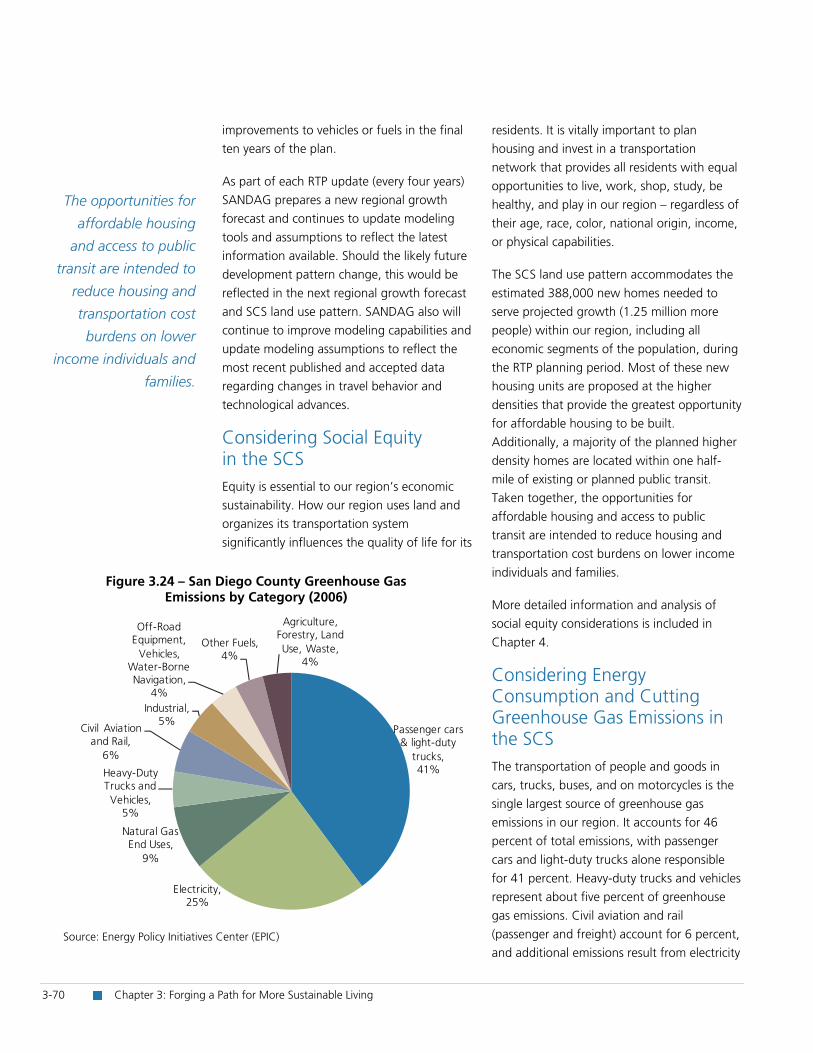
3-70 Chapter 3: Forging a Path for More Sustainable Living
The opportunities for
affordable housing
and access to public
transit are intended to
reduce housing and
transportation cost
burdens on lower
income individuals and
families.
Passenger cars & light-duty
trucks,41%
Electricity,25%
Natural Gas End Uses,
9%
Heavy-Duty Trucks and Vehicles,
5%
Civil Aviation and Rail,
6%
Industrial, 5%
Off-Road Equipment,
Vehicles, Water-Borne Navigation,
4%
Other Fuels, 4%
Agriculture, Forestry, Land Use, Waste,
4%
Source: Energy Policy Initiatives Center (EPIC)
Figure 3.24 – San Diego County Greenhouse Gas Emissions by Category (2006)
improvements to vehicles or fuels in the final
ten years of the plan.
As part of each RTP update (every four years)
SANDAG prepares a new regional growth
forecast and continues to update modeling
tools and assumptions to reflect the latest
information available. Should the likely future
development pattern change, this would be
reflected in the next regional growth forecast
and SCS land use pattern. SANDAG also will
continue to improve modeling capabilities and
update modeling assumptions to reflect the
most recent published and accepted data
regarding changes in travel behavior and
technological advances.
Considering Social Equity in the SCS Equity is essential to our region’s economic
sustainability. How our region uses land and
organizes its transportation system
significantly influences the quality of life for its
residents. It is vitally important to plan
housing and invest in a transportation
network that provides all residents with equal
opportunities to live, work, shop, study, be
healthy, and play in our region – regardless of
their age, race, color, national origin, income,
or physical capabilities.
The SCS land use pattern accommodates the
estimated 388,000 new homes needed to
serve projected growth (1.25 million more
people) within our region, including all
economic segments of the population, during
the RTP planning period. Most of these new
housing units are proposed at the higher
densities that provide the greatest opportunity
for affordable housing to be built.
Additionally, a majority of the planned higher
density homes are located within one half-
mile of existing or planned public transit.
Taken together, the opportunities for
affordable housing and access to public
transit are intended to reduce housing and
transportation cost burdens on lower income
individuals and families.
More detailed information and analysis of
social equity considerations is included in
Chapter 4.
Considering Energy Consumption and Cutting Greenhouse Gas Emissions in the SCS The transportation of people and goods in
cars, trucks, buses, and on motorcycles is the
single largest source of greenhouse gas
emissions in our region. It accounts for 46
percent of total emissions, with passenger
cars and light-duty trucks alone responsible
for 41 percent. Heavy-duty trucks and vehicles
represent about five percent of greenhouse
gas emissions. Civil aviation and rail
(passenger and freight) account for 6 percent,
and additional emissions result from electricity
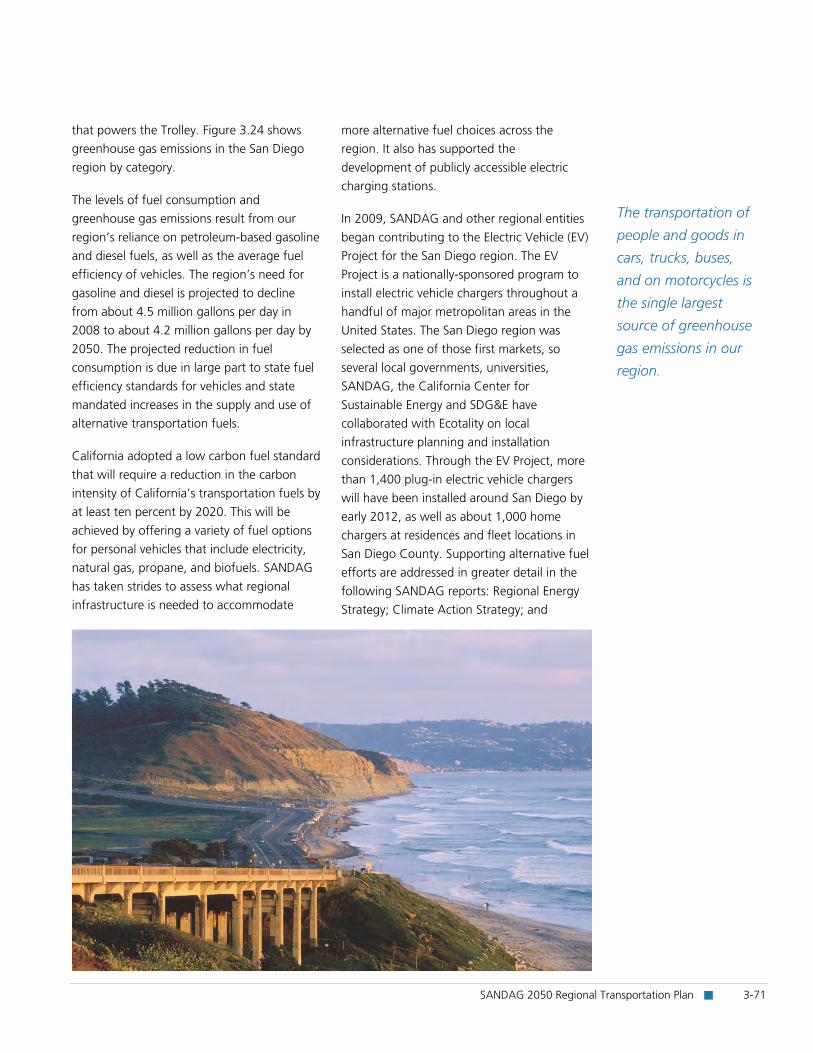
SANDAG 2050 Regional Transportation Plan 3-71
The transportation of
people and goods in
cars, trucks, buses,
and on motorcycles is
the single largest
source of greenhouse
gas emissions in our
region.
that powers the Trolley. Figure 3.24 shows
greenhouse gas emissions in the San Diego
region by category.
The levels of fuel consumption and
greenhouse gas emissions result from our
region’s reliance on petroleum-based gasoline
and diesel fuels, as well as the average fuel
efficiency of vehicles. The region’s need for
gasoline and diesel is projected to decline
from about 4.5 million gallons per day in
2008 to about 4.2 million gallons per day by
2050. The projected reduction in fuel
consumption is due in large part to state fuel
efficiency standards for vehicles and state
mandated increases in the supply and use of
alternative transportation fuels.
California adopted a low carbon fuel standard
that will require a reduction in the carbon
intensity of California’s transportation fuels by
at least ten percent by 2020. This will be
achieved by offering a variety of fuel options
for personal vehicles that include electricity,
natural gas, propane, and biofuels. SANDAG
has taken strides to assess what regional
infrastructure is needed to accommodate
more alternative fuel choices across the
region. It also has supported the
development of publicly accessible electric
charging stations.
In 2009, SANDAG and other regional entities
began contributing to the Electric Vehicle (EV)
Project for the San Diego region. The EV
Project is a nationally-sponsored program to
install electric vehicle chargers throughout a
handful of major metropolitan areas in the
United States. The San Diego region was
selected as one of those first markets, so
several local governments, universities,
SANDAG, the California Center for
Sustainable Energy and SDG&E have
collaborated with Ecotality on local
infrastructure planning and installation
considerations. Through the EV Project, more
than 1,400 plug-in electric vehicle chargers
will have been installed around San Diego by
early 2012, as well as about 1,000 home
chargers at residences and fleet locations in
San Diego County. Supporting alternative fuel
efforts are addressed in greater detail in the
following SANDAG reports: Regional Energy
Strategy; Climate Action Strategy; and

3-72 Chapter 3: Forging a Path for More Sustainable Living
Regional Alternative Fuels, Vehicles, and
Infrastructure Report for the San Diego
Region.
Meeting Federal Air Quality Requirements “Allow the regional transportation plan to
comply with the federal Clean Air Act.”
(Government Code Section
65080(b)(2)(B)(viii))
SANDAG and the U.S. Department of
Transportation (DOT) must make a
determination that the RTP and the Regional
Transportation Improvement Program (RTIP)
conform to the state implementation plan
(SIP) for air quality. Conformity to the SIP
means that transportation activities will not
create new air quality violations, worsen
existing violations, or delay the attainment of
the national ambient air quality standards.
Analyses for Carbon Monoxide, and for
Reactive Organic Gases and Nitrogen Oxides
as precursors to Ozone, were conducted for
the 2050 RTP. These analyses demonstrate
that the 2050 RTP conforms to the SIP. This
process is documented in Appendix B.
Climate Change Impacts and Adaptation The transportation sector has been identified
as a key contributor of greenhouse gases, but
also is threatened by the impacts of continued
climate change. The climate of the San Diego
region is expected to change, even under the
most optimistic scenarios for reducing
greenhouse gas emissions. Potential impacts
include more frequent and intense heat
waves, more frequent and intense wildfires,
degraded air quality, fresh water shortages,
rising sea levels and higher storm surges, the
loss of native plant and animal species, and a
higher demand for electricity during peak
periods. Developing and implementing
measures to help the region adapt to these
potential changes will be critical in protecting
the regional transportation network.
More frequent hot days and prolonged
periods of extreme heat would increase the
risk of buckling highways and railroad tracks.
This could lead to increased and more
frequent maintenance costs, premature
deterioration, or even the failure of
transportation infrastructure. More frequent
and severe wildfires that are followed by
rainfall would increase the risk of mudslides.
This could disrupt major infrastructure such as
roadways and rail lines. Rising sea levels and
stronger storm surges would likely impact
high-density urban areas, ports, airports, and
other vital lines of coastal transportation.
Existing fortifications may need to be
enhanced as sea levels rise and storm surges
intensify, and areas not previously considered
at risk may need to be protected. Preparing
transportation infrastructure for climate
change impacts is a new priority as future
projects are designed and our current system
is maintained.
The tools and methodologies for evaluating
and adapting to such impacts are still in the
early stages of development and will require
ongoing monitoring.
Considering Public Health in the SCS According to the U.S. Centers for Disease
Control and Prevention (CDC), the percentage
of Californians that is obese increased from
less than 10 percent in 1985 to nearly
25 percent in 2008. The San Diego County
Health and Human Services Agency (HHSA)
reports that in 2007, 33 percent of county
residents were overweight and nearly
22 percent were obese.

SANDAG 2050 Regional Transportation Plan 3-73
Evidence suggests that land use and
transportation planning policies affect public
health. Epidemiological studies have shown
that people who live in compact, mixed-use
communities have more opportunities to walk
and they are less likely to be obese and
hypertensive, compared with people who live
in communities in which automobiles are
primarily used to get around. Land use
patterns in many communities today make
driving a necessity, and they discourage
walking and bicycling. A decrease in walking
and bicycling results in a decrease in daily
physically activity. This contributes significantly
to the epidemic in obesity, especially among
children. Childhood obesity in the U.S. more
than tripled during the last 30 years. In our
San Diego region, more than one in four
children are obese. As with the adults, poor
nutrition and a lack of physical activity are
cited as the primary causes.
In light of growing evidence that links land
use patterns and transportation infrastructure
with public health outcomes, community
planners and public health practitioners in San
Diego and around the country have begun to
collaborate to develop strategies that improve
health and wellness through smarter
development. The SCS land use pattern is
moving our San Diego region toward a
healthier future by focusing on improving the
connection between land use and
transportation. The result is more walkable
communities, more people bicycling, and
more people using public transit.
Strategies related to public health are
described in more detail in Social Equity and
Environmental Justice (Chapter 4), in Systems
Development (Chapter 6), and Demand
Management (Chapter 8).
Promoting Sustainability through Incentives and Collaboration: SANDAG Policies and Programs that Support the SCS “Neither a sustainable communities strategy
nor an alternative planning strategy regulates
the use of land, nor, except as provided by
subparagraph (J), shall either one be subject
to any state approval. Nothing in a sustainable
community’s strategy shall be interpreted as
superseding the exercise of land use authority
of cities and counties within the region.”
(Government Code Section 65080(b)(2)(K))
This SCS does not regulate or supersede the
exercise of land use authority of the region’s
cities or the County of San Diego. SANDAG
has adopted a number of policies and
programs that support the SCS and provide
information and funding to assist local
jurisdictions in planning for and monitoring
sustainability in their communities.
3-74 Chapter 3: Forging a Path for More Sustainable Living
Policies, programs, and guidelines that
SANDAG has adopted over the past few years
that support the SCS include:
Regional Comprehensive Plan: Sets forth a
regional strategy for smart growth and
sustainable development in the San Diego
region
Smart Growth Concept Map: Identifies
existing, planned, and potential smart
growth opportunity areas in our region
TransNet Smart Growth Incentive Program:
Provides funds to local jurisdictions that
are engaged in smart growth planning and
smart growth capital investments
TransNet Environmental Mitigation
Program: Provides funding for mitigating
local and regional transportation projects,
as well as additional funding for acquiring,
managing, and monitoring natural
habitats in ways that support our region’s
habitat conservation programs
TransNet/Transportation Development Act
Active Transportation Program: Provides
funding for bicycle, pedestrian, and traffic
calming planning and capital improvement
projects
Healthy Works: Provides grant funding
from the American Recovery and
Reinvestment Act (ARRA) through the
Centers for Disease Control (CDC) and
County of San Diego to help local
jurisdictions and non-profit organizations
plan healthy communities by integrating
public health considerations into planning
efforts and promoting Safe Routes to
School programs and strategies
Supplemental Funding Potential: A
collaborative effort led by a Quality of Life
Steering Committee and Working Group
to identify the needs and possible funding
mechanisms for four infrastructure areas:
habitat conservation, shoreline
preservation, water quality enhancement,
and public transit
Climate Action Strategy: A guide to help
policymakers consider climate change as
they make decisions to meet the varied
needs of our region’s growing population,
maintain and enhance the region’s quality
of life, and promote economic stability
Regional Energy Strategy: An energy policy
guide for policymakers and staff of
member agencies as the region strives to
meet the energy needs of a growing
population and expanding housing stock
while also enhancing our region’s quality
of life and economic stability
Regional Alternative Fuels, Vehicles, and
Infrastructure Report for the San Diego
Region: A guide to help local governments
and other regional stakeholders make
informed decisions regarding alternative
fuel and vehicle technologies for a variety
of fleet applications, and to identify
regional and local government actions that
can support alternative fuel vehicles
Smart Growth Design Guidelines: These
guidelines address the importance of
design in maintaining and enhancing
community character and in creating great
public places
Trip Generation for Smart Growth and
Parking Strategies for Smart Growth:
These studies identify trip generation rates
and parking demands associated with
smart growth developments
RCP Performance Monitoring: A
mechanism used to track progress in the
implementation of the RCP

SANDAG 2050 Regional Transportation Plan 3-75
Consultation with the Local Agency Formation Commission “In preparing a sustainable communities
strategy, the metropolitan planning
organization shall consider spheres of
influence that have been adopted by the local
agency formation commissions within its
region.” (Government Code Section
65080(b)(2)(G))
SANDAG considered spheres of influence that
have been adopted by the Local Agency
Formation Commission (LAFCO) within our
region during the development of the SCS. A
sphere of influence is defined as a plan for the
probable physical boundaries and service area
of a local government agency, as determined
by LAFCO. All territory proposed for
annexation to an incorporated city is required
to be included in the city’s sphere of influence
and be located within the city’s general plan.
LAFCO is responsible in our region for
assisting the state legislature with promoting
orderly development and growth while
fulfilling many regional priorities. These
include: accommodating growth within or
through the expansion of local agency
boundaries, extending necessary government
services, preserving open space and prime
agricultural lands, and promoting the
provision of housing for residents of all
incomes.
LAFCO also is a member of the Regional
Planning Technical Working Group, which
provides coordination on regional planning
issues among member agencies. Members of
the working group include the planning or
community development director from each
of the 18 cities and the County of San Diego,
as well as representatives from other single-
purpose regional agencies.
In the development of the 2050 Regional
Growth Forecast, LAFCO and SANDAG
consulted regularly and exchanged written
correspondence regarding sphere of influence
determinations, impacts of proposed
jurisdictional changes, and factors considered
in the review of proposals. The 18
incorporated cities and the County of San
Diego were asked about sphere of influence
issues during the 2050 Regional Growth
Forecast land use input process. Adjustments
were made to sphere-area land use inputs
requested by the local jurisdictions and
confirmed by the County of San Diego.
Reducing Government Regulations: Streamlining the Process for the California Environmental Quality Act (CEQA) Provisions in SB 375 include opportunities for
streamlining the CEQA process, when certain
conditions are met, as an incentive for
implementing projects that are consistent
with this SCS. Generally, there are two types
of projects for which CEQA requirements can
be streamlined, once the MPO adopts an
RTP and SCS that meet the greenhouse gas
targets established by the California Air
Resources Board:
Residential/mixed use projects streamlining
(Public Resources Code Section 21159.28)
Transit priority projects streamlining (Public
Resources Code Sections 21155-21155.3)
SB 375 includes specific requirements for the
CEQA streamlining. The discussion below
provides a general outline of the
requirements.
Residential/Mixed-Use Projects Consistent with the SCS If a residential or mixed use project is
consistent with the land use designation,
density, building intensity, and other
3-76 Chapter 3: Forging a Path for More Sustainable Living
applicable policies assumed for the SCS, the
lead agency for the project would still be
required to conduct an environmental review
pursuant to CEQA. But reviews for those
projects would not be required to repeat
growth inducing impacts analyses or the
discussion of how cars and light trucks could
increase greenhouse gas emissions, because
that discussion was already included in the
environmental impact report (EIR) for the
2050 RTP and SCS. Similarly, if an EIR were
being prepared for a residential/mixed use
project, the alternatives section of that EIR
would not be required to include a reduced
density alternative to reduce greenhouse gas
emissions. For purposes of this provision, a
residential/mixed use project is defined as a
project in which at least 75 percent of the
square footage is devoted to residential uses.
Transit Priority Projects The second type of CEQA streamlining is for
Transit Priority Projects. A Transit Priority
Project (TPP) is eligible for CEQA streamlining
provisions if it meets certain criteria. It would
be up to the local agency to determine if a
project qualifies as a TPP. For a local
jurisdiction to determine that a project is a
TPP, the project must be consistent with the
general use designation, density, building
intensity, and applicable policies identified in
an approved SCS. In addition, a TPP that is
eligible for CEQA streamlining also must be:
1) 50 percent residential, 2) with a minimum
density of 20 dwelling units per acre, and 3)
within a half-mile of a major transit stop or
high-quality transit corridor (defined as having
15-minute frequencies during peak periods)
that is included in the 2050 RTP. Figure 3.25
indicates the areas where CEQA streamlining
may be available for Transit Priority Projects if
the other two criteria listed above also can be
demonstrated for a proposed project.
If a project meets these criteria, it may be
analyzed under a new environmental
document created by SB 375, called the
Sustainable Communities Environmental
Assessment (SCEA), or through an EIR for
which the content requirements have been
reduced as described below:
The SCEA, which is similar to a Mitigated
Negative Declaration (MND), would need
to include an analysis of all significant
environmental effects, as well as
mitigation measures to reduce those
impacts to an insignificant level
If an EIR were prepared for a TPP, the
document would not need to include an
analysis of cumulative impacts, or of
greenhouse gas emissions from cars and
light duty trucks. In addition, project
alternatives – as required in EIRs – need
not address reduced density or off-site
location alternatives
If additional criteria can be met, a TPP may be
eligible for a new CEQA exemption created
with the adoption of SB 375. Projects that
meet all the required criteria are known as
sustainable communities projects. This new
exemption is intended to provide CEQA relief
for TPP projects that are consistent with the
SCS. A sustainable communities project (as
defined in SB 375), must meet the criteria
outlined above for TPP projects, and it also
must generally comply with an extensive list
of conditions in the law. These are detailed in
Appendix D.
It is not known how many projects in the
San Diego region would meet the criteria to
qualify for the CEQA exemption. It would be
up to the local agency to determine if a
project qualifies for the exemption at the time
it is proposed.

SANDAG 2050 Regional Transportation Plan 3-77
FIGURE 3.25

3-78 Chapter 3: Forging a Path for More Sustainable Living
It should also be noted that proponents of
these types of projects are still required to pay
development fees or in-lieu fees, as specified
in SB 375. However, another new provision of
SB 375/SB 575 enables a local jurisdiction to
adopt a uniform set of traffic mitigation
measures for transit priority projects (Public
Resources Code Section 21155.3). These are
detailed in Appendix D.
Conclusion Achieving sustainability will require living and
working in ways that protect and sustain the
region’s vital social, environmental, and
economic resources. The 2050 RTP and its
SCS will guide the San Diego region toward a
more sustainable future by focusing housing
and job growth in urbanized areas, protecting
sensitive habitat and open space, and
investing in a transportation network that
provides residents and workers with
transportation options that will help reduce
greenhouse gas emissions. Implementing this
plan will require close collaboration among
and between SANDAG, local jurisdictions,
member agencies and regional stakeholders.
It is anticipated that with each RTP (every four
years) there will be new opportunities to help
reduce GHG emissions.
Key achievements of the 2050 RTP/SCS are
summarized below:
Meets state greenhouse gas reduction
targets
$214 billion in transportation investments
planned
$4.4 billion annually in projected regional
output
Creates 35,600 jobs per year in the
San Diego region
Accommodates projected population
growth in San Diego County
Preserves more than half of our land as
open space, parkland and habitat
Provides 156 new miles of trolley service
New trolley tunnel in downtown
San Diego
Expands and speeds up COASTER service
in the North Coast Corridor
More than double transit service miles,
increased transit frequency in key corridors
130 miles of managed lanes to facilitate
carpools, vanpools, and premium bus
service
$2.7 billion for regional and local bicycle
and pedestrian projects and programs
Creates new carpool and telework
incentive programs to reduce solo driving
Provides housing to meet projected
population growth in San Diego County
84 percent of new housing units built in
San Diego County will be multifamily
Nearly three-quarters of multifamily
housing will be built on redevelopment or
infill sites
Homes and jobs within one-half of a mile
of transit nearly doubles
Calls for equitable distribution of
investment throughout the region

SANDAG 2050 Regional Transportation Plan 3-79
The following actions support the Plan’s Forging a Path for More Sustainable Living Chapter recommendations:
The actions included in this chapter as well as those throughout the 2050 RTP will implement the SCS.
Actions Responsible Parties
RCP Update
1. Incorporate the concepts and recommended actions of the 2050 RTP into the next update of the RCP, including alternative land use scenarios.
SANDAG
2. Prepare a regional Transit Oriented Development strategy as part of the RCP update. SANDAG
3. Refine indicators that are used to monitor progress toward the implementation of the RCP so they include additional measures that address sustainability, greenhouse gas reductions and public health considerations.
SANDAG
4. Continue to engage lower income and minority communities in regional planning and programming efforts.
SANDAG
5. Update the Smart Growth Concept Map to reflect the changes to local land use plans contained in the 2050 Regional Growth Forecast and to the regional transportation network.
SANDAG and local jurisdictions
6. Expand the smart growth strategy in the RCP to include climate change principles that emphasize petroleum reduction, energy efficiency, water efficiency, and renewable energy.
SANDAG and local jurisdictions
Smart Growth Tools and Model Enhancements
7. Provide additional guidance on SB 375 CEQA streamlining provisions. SANDAG and local jurisdictions
8. Use the updated Smart Growth Concept Map as a basis for allocating smart growth incentives, prioritizing transit service enhancements, and seeking additional smart growth funds.
SANDAG, MTS, NCTD and local jurisdictions
9. Refine the selection criteria for the TransNet Smart Growth Incentive Program so it reflects the 2050 RTP and its SCS.
SANDAG and local jurisdictions
10. Consider health principles in the evaluation criteria for existing grant programs, such as the Smart Growth Incentive Program and the Bicycle, Pedestrian, and Neighborhood Safety Program.
SANDAG and local jurisdictions
11. Consider greenhouse gas reductions/climate change principles in the evaluation criteria for existing grant programs, such as the Smart Growth Incentive Program.
SANDAG and local jurisdictions
12. Continue to make enhancements to travel demand models to improve GHG and VMT estimates.
SANDAG

3-80 Chapter 3: Forging a Path for More Sustainable Living
Actions Responsible Parties
Habitat
13. Coordinate and cooperate throughout the region on the planning and implementation of future transportation infrastructure and habitat preserves.
SANDAG, MTS, NCTD, Caltrans, and local jurisdictions
14. Design future infrastructure projects in a way that protects wildlife corridors and habitat linkages in designated habitat conservation plans. In urban areas, design project to meet the needs of all potential users by following complete street development principles.
SANDAG, MTS, NCTD, Caltrans, and local jurisdictions
15. Continue to secure and distribute regional funding for acquiring habitats, and for ongoing land management and monitoring in accordance with the approved habitat plans.
SANDAG
16. Manage and monitor the TransNet Environmental Mitigation Program. SANDAG and wildlife agencies
Transit Oriented Development
17. Pursue joint development opportunities to promote the construction of sustainable housing and mixed-use projects at existing and planned transit stations.
SANDAG and local jurisdictions
Active Transportation/Public Health
18. Continue to collaborate with the region’s public health professionals to enhance how SANDAG addresses public health issues in its regional planning, programming, and project development activities.
SANDAG and County Health and Human Services Agency
Energy/Climate Adaptation
19. Implement the Regional Energy Strategy and the Climate Action Strategy, in coordination with state and local jurisdiction efforts.
SANDAG and local jurisdictions
20. Support the increased use of clean, alternative fuels in SANDAG and local jurisdiction-owned vehicle fleets, and the vehicle and equipment fleets of contractors and funding recipients, such as the vehicle fleet for the SANDAG Vanpool Program or for local jurisdiction waste haulers.
SANDAG and local jurisdictions
21. Support planning and infrastructure development for alternative fueling stations and plug-in electric vehicle (EV) chargers.
SANDAG and local jurisdictions
22. Develop or facilitate a regional approach to long-term planning for alternative fuel infrastructure that includes the continued development of public-private strategic alliances.
SANDAG and local jurisdictions
23. Monitor research and independent assessments of the impact that increasing the use of clean, alternative fuels would have on gas tax revenues.
SANDAG
24. Integrate alternative fuel considerations into the development of the regional transportation network by, for example, integrating infrastructure for electric vehicle charging into regional park-and-ride lots and transit stations.
SANDAG, MTS, and NCTD
25. Work with San Diego Gas & Electric and other stakeholders to mitigate the potential impacts of electric vehicles on the electric grid.
SANDAG and local jurisdictions
26. To the extent possible, address climate adaptation issues in the design of new projects, and when improvements are made to existing infrastructure.
SANDAG, Caltrans, and local jurisdictions
27. Seek funding to develop healthy community or active design guidelines that integrate smart growth, sustainability, walking and bicycling, parking, and street design.
SANDAG

SANDAG 2050 Regional Transportation Plan 3-81
Actions Responsible Parties
Infrastructure Funding
28. Continue to refine the Quality of Life Funding Strategy and determine the appropriate time to seek voter approval.
SANDAG
Public Involvement
29. Evaluate the feasibility of developing preliminary maps that identify transportation infrastructure that could be vulnerable to environmental changes to climate change, including precipitation, heat, and sea level rise.
SANDAG, Caltrans, Port of San Diego, and local jurisdictions
Legislation
30. Support legislation that provides financial incentives for smart growth projects that provide more affordable housing near transit, and that addresses fiscal reform issues consistent with the SCS and smart growth principles in the RCP.
SANDAG, MTS, and NCTD
31. Through the development review process, continue to provide comments to local jurisdictions that encourage development patterns that promote walking, bicycling, and access to public transit in existing and potential smart growth areas and in or near major public facilities such as colleges and hospitals, and that encourage reconfiguration of the public right of way to create complete streets.
SANDAG, MTS, and NCTD

3-82 Chapter 3: Forging a Path for More Sustainable Living


![[Global HR Forum 2014] Forging a New Path for Jobs into Our Symbiotic Future](https://static.fdocuments.us/doc/165x107/558cda6ad8b42ad0118b45a9/global-hr-forum-2014-forging-a-new-path-for-jobs-into-our-symbiotic-future.jpg)