Chapter 3 Biological diversity · the area of primary forest, on forest area designated for the...
20
37 Chapter 3 Biological diversity OVERVIEW ‘Biological diversity’ encompasses the variety of existing life forms, the ecological roles they perform and the genetic diversity they contain (FAO, 1989). In forests, biological diversity allows species to adapt continuously to dynamically evolving environmental conditions, to maintain the potential for tree breeding and improvement (to meet human needs for goods and services and changing end-use requirements), and to support their ecosystem functions. While timber production often dominated the way in which forests were managed in the twentieth century, new pressures in the twenty-first century drive a more balanced approach, calling for delivery of multiple goods and services. The process towards sustainable forest management is now considered consistent with the conservation of biological diversity. Assessing, monitoring and reporting on biological diversity are important activities aimed at guiding sustainable forest management. Monitoring of biological diversity and of the changes caused by forestry practices is important in assessing the effectiveness of management and the cumulative changes brought about by forest use. However, there are conceptual and practical difficulties in doing so. These are not unique to biological diversity per se, but are general inventory problems related to target parameters that are complex and highly variable. The values derived from biological diversity are associated with different scales that require different assessment methodologies. These include ecosystems, landscapes, species, populations, individuals and genes. Varying and complex interactions exist among all these levels. Because biological diversity encompasses the complexity of all life forms, assessment and monitoring are only possible for specific aspects or particular, defined goals. There is no single, objective measure of biological diversity, only proxy measures appropriate for specified and, by necessity, restricted purposes. Species richness, for example, has a very wide natural variation from boreal to tropical forests. For policy and monitoring purposes, it is the change in biodiversity that is important, which implies identifying a few relevant indicators and then monitoring them over time. So far this has not been achieved for forest ecosystems on a wide scale (i.e. national or continental), but FRA 2005 has attempted to establish a baseline for forest ecosystems worldwide, and to provide input into wider biodiversity monitoring work. Most local forest inventories are conducted to estimate harvestable volumes of wood and sometimes non-wood forest products, rather than to monitor biological diversity. An immediate need exists to categorize and substantially improve the understanding of biological diversity with a view to measuring trends, particularly on regional scales. In this respect, the work carried out in the framework of criteria and indicators processes, which all address biological diversity, is an important contribution. The variables measured in FRA 2005 with relevance to forest biological diversity include: • area of primary forests; • forest area designated for conservation of biodiversity; • composition of forests; • number of native tree species; • threatened forest tree species.
Transcript of Chapter 3 Biological diversity · the area of primary forest, on forest area designated for the...
37
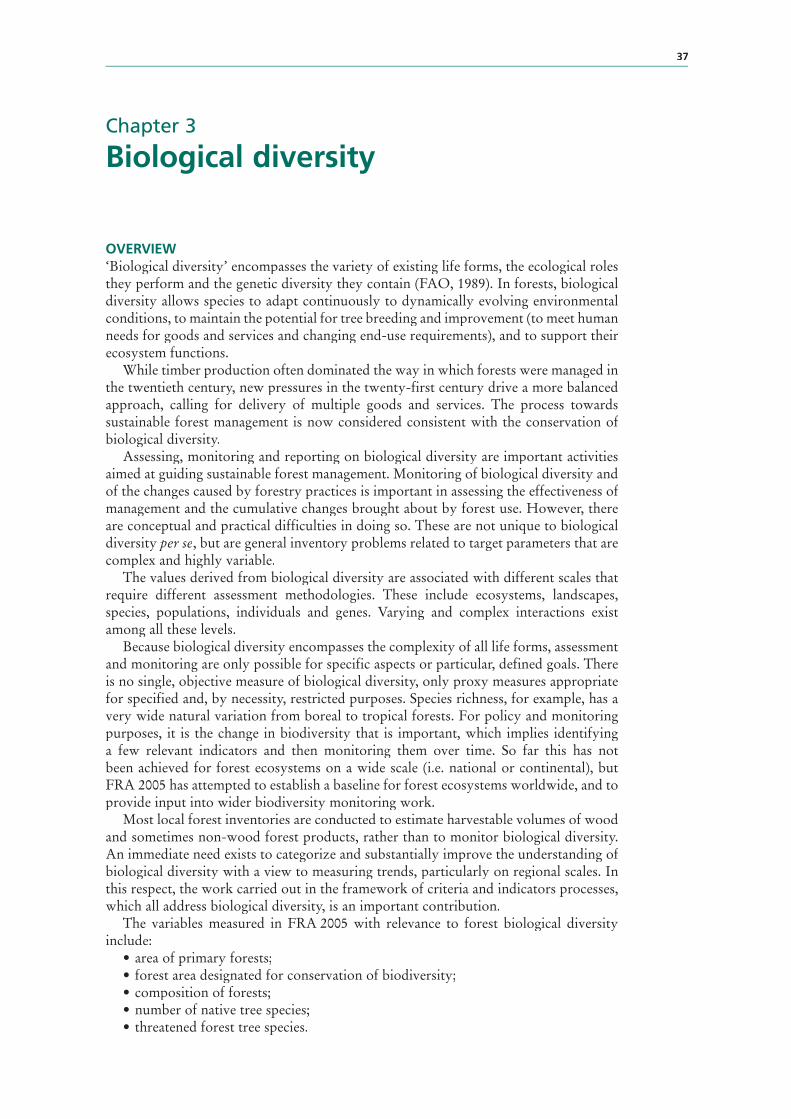
Chapter 3
Biological diversity
OVERVIEW‘Biological diversity’ encompasses the variety of existing life forms, the ecological roles they perform and the genetic diversity they contain (FAO, 1989). In forests, biological diversity allows species to adapt continuously to dynamically evolving environmental conditions, to maintain the potential for tree breeding and improvement (to meet human needs for goods and services and changing end-use requirements), and to support their ecosystem functions.
While timber production often dominated the way in which forests were managed in the twentieth century, new pressures in the twenty-first century drive a more balanced approach, calling for delivery of multiple goods and services. The process towards sustainable forest management is now considered consistent with the conservation of biological diversity.
Assessing, monitoring and reporting on biological diversity are important activities aimed at guiding sustainable forest management. Monitoring of biological diversity and of the changes caused by forestry practices is important in assessing the effectiveness of management and the cumulative changes brought about by forest use. However, there are conceptual and practical difficulties in doing so. These are not unique to biological diversity per se, but are general inventory problems related to target parameters that are complex and highly variable.
The values derived from biological diversity are associated with different scales that require different assessment methodologies. These include ecosystems, landscapes, species, populations, individuals and genes. Varying and complex interactions exist among all these levels.
Because biological diversity encompasses the complexity of all life forms, assessment and monitoring are only possible for specific aspects or particular, defined goals. There is no single, objective measure of biological diversity, only proxy measures appropriate for specified and, by necessity, restricted purposes. Species richness, for example, has a very wide natural variation from boreal to tropical forests. For policy and monitoring purposes, it is the change in biodiversity that is important, which implies identifying a few relevant indicators and then monitoring them over time. So far this has not been achieved for forest ecosystems on a wide scale (i.e. national or continental), but FRA 2005 has attempted to establish a baseline for forest ecosystems worldwide, and to provide input into wider biodiversity monitoring work.
Most local forest inventories are conducted to estimate harvestable volumes of wood and sometimes non-wood forest products, rather than to monitor biological diversity. An immediate need exists to categorize and substantially improve the understanding of biological diversity with a view to measuring trends, particularly on regional scales. In this respect, the work carried out in the framework of criteria and indicators processes, which all address biological diversity, is an important contribution.
The variables measured in FRA 2005 with relevance to forest biological diversity include:
• area of primary forests;• forest area designated for conservation of biodiversity;• composition of forests;• number of native tree species;• threatened forest tree species.

Global Forest Resources Assessment 200538
These variables include measures both of policy response (e.g. areas designated for conservation of biodiversity) and of outcome (e.g. number of threatened species). Both are needed, but the fundamental difference between these two concepts should be borne in mind.
In recent years, the Global Forest Resources Assessments have increased their focus on forest biodiversity. FRA 2005 gathered and compiled relevant information at landscape and species levels, while addressing some structural and compositional aspects. At the ecosystem level, FRA 2005 provides information on the area of forests and – more specifically – on the area of primary and other forests managed for the conservation of biological diversity (including protected areas), thus complementing FRA 2000 data on the proportion of forests in protected areas. At the species level, FRA 2000 highlighted the global lack of estimates of the number of tree species by country, with the exception of endangered tree species. FRA 2005 thus focused on assessment of the number of both native and endangered forest tree species at the country level. In addition, country reports included lists of the ten most common tree species (measured by their share of total growing stock), thus providing important information on the tree species composition of forests.
Many countries lack the capacity to report on biological diversity. In particular, there is generally less knowledge with respect to biological diversity in tropical forests compared with the other biomes. In FRA 2005, countries were better able to report on the area of primary forest, on forest area designated for the conservation of biodiversity and on threatened tree species than on the other variables reported in this chapter (Figure 3.1). However, these data alone are insufficient to provide a reliable picture of broader trends in forest biological diversity.
KEY FINDINGSAlthough a large number of countries have reported on the characteristics of their forests, information on the area of primary forest is not readily available. Proxy values have often been used, including the area of natural forest over a certain age or the area of forest with protected area status. This makes a detailed analysis of status and trends difficult. The
FIGURE 3.1Information availability – biological diversity
Note: Figures present number of countries in each category.
Percentage of total forest area
Area of primary forest
Area designated primarily for conservation of biodiversity
Total area designated for conservation of biodiversity
Composition of growing stock
Number of native forest tree species
Threatened forest tree species
Information available for all years Information available for latest year Information not available for latest year
0 10 20 30 40 50 60 70 80 90 100
168 556
163 579
79 1455
70 14712
133 97
192 37

Biological diversity 39
results suggest, however, that the total area of primary forests exceeds 1.3 billion hectares or 36 percent of all forests, and that the ten countries with the largest area of primary forest account for 88.2 percent of the total area of primary forest in the world.
Information was unavailable for many of the countries in the Congo Basin, the second largest expanse of tropical forest, which should be kept in mind when analysing the findings.
Great variation exists in terms of the distribution of primary forest, with limited areas reported from the Caribbean, Eastern and Southern Africa, Europe (not including the Russian Federation), North Africa and the arid zones of Western and Central Asia. The largest expanse of primary forest is found in South America (the Amazon Basin). Countries in North and Central America and the Russian Federation have also classified a relatively high proportion of their forests as primary.
The estimated annual net decrease in primary forests of 6 million hectares is alarmingly high. This decrease reflects not only a complete loss of these forests, but also changes within the forest, for instance when primary forests move into the category of modified natural forests due to selective logging. Some countries, notably in Europe and Japan, are reporting an increase in their areas of primary forests, because natural forests have been set aside as ‘no intervention’ areas.
In 2005, globally, more than 400 million hectares of forests, or 11 percent of total forest area, were designated for the conservation of biological diversity as the primary function. The area of forest devoted to conservation of biodiversity has increased by at least 96 million hectares, or 32 percent, since 1990. This increasing trend is evident in all regions and subregions except Northern, Eastern and Southern Africa.
Information on the total area of forest that has conservation of biological diversity designated as one of the functions and management objectives is of considerable interest to the forest conservation community, but information was lacking from many countries. To improve the potential value of this variable, it would be worth refining and simplifying its estimation. This might improve the level of reporting, which was especially low in Africa and Oceania.
Forest composition is a valuable indicator of biological diversity. Although a significant number of countries reported on the composition of their forests in terms of growing stock, information was unavailable for many countries, which makes a detailed analysis of the value of the indicator difficult.
There is also great variation in terms of forest tree species diversity, from limited numbers of individual species in boreal ecosystems to high species richness per area unit in Central and South America, South and Southeast Asia, and Western and Central Africa. Boreal forests tend to harbour the lowest species diversity. On average, the ten most common tree species in a country account for 76 percent of total growing stock. The exceptions by region are found in Central America, South and Southeast Asia and Western and Central Africa, where percentages range from 22 to 47 percent. In Europe and Western and Central Asia, the ten most common tree species account for more than 90 percent of total growing stock.
Information was missing from many countries in South America (including Brazil) and from most of the countries in the Congo Basin, both areas of known high species diversity.
The combined list of the ten most common tree species from all countries contained 445 different species. Five genera (Pinus, Quercus, Picea, Abies and Fagus) make up almost one-third of the number of species reported as being most common. This may be influenced by the fact that Asia and Europe are over-represented, in terms of the number of countries that reported on this topic, relative to their total forest area. No change in the relative importance of different species was found between 1990 and 2000; nor were major changes noticed in the share of growing stock occupied by the three most common species.
Global Forest Resources Assessment 200540
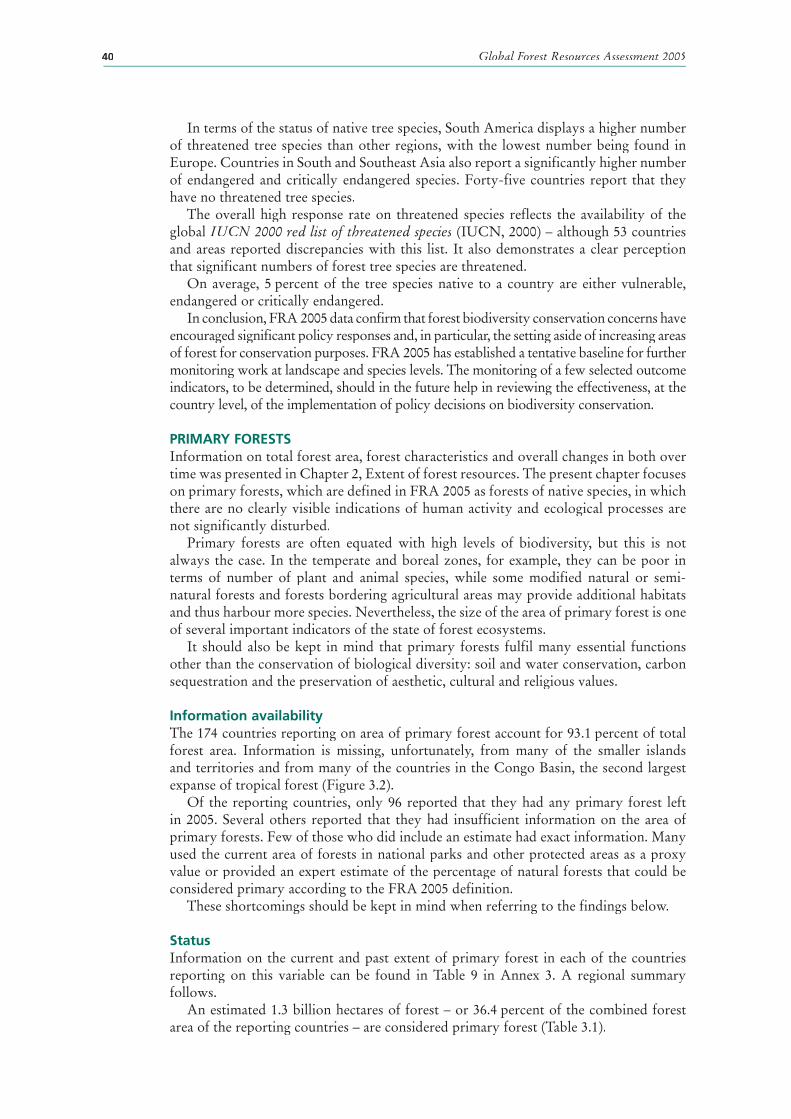
In terms of the status of native tree species, South America displays a higher number of threatened tree species than other regions, with the lowest number being found in Europe. Countries in South and Southeast Asia also report a significantly higher number of endangered and critically endangered species. Forty-five countries report that they have no threatened tree species.
The overall high response rate on threatened species reflects the availability of the global IUCN 2000 red list of threatened species (IUCN, 2000) – although 53 countries and areas reported discrepancies with this list. It also demonstrates a clear perception that significant numbers of forest tree species are threatened.
On average, 5 percent of the tree species native to a country are either vulnerable, endangered or critically endangered.
In conclusion, FRA 2005 data confirm that forest biodiversity conservation concerns have encouraged significant policy responses and, in particular, the setting aside of increasing areas of forest for conservation purposes. FRA 2005 has established a tentative baseline for further monitoring work at landscape and species levels. The monitoring of a few selected outcome indicators, to be determined, should in the future help in reviewing the effectiveness, at the country level, of the implementation of policy decisions on biodiversity conservation.
PRIMARY FORESTSInformation on total forest area, forest characteristics and overall changes in both over time was presented in Chapter 2, Extent of forest resources. The present chapter focuses on primary forests, which are defined in FRA 2005 as forests of native species, in which there are no clearly visible indications of human activity and ecological processes are not significantly disturbed.
Primary forests are often equated with high levels of biodiversity, but this is not always the case. In the temperate and boreal zones, for example, they can be poor in terms of number of plant and animal species, while some modified natural or semi-natural forests and forests bordering agricultural areas may provide additional habitats and thus harbour more species. Nevertheless, the size of the area of primary forest is one of several important indicators of the state of forest ecosystems.
It should also be kept in mind that primary forests fulfil many essential functions other than the conservation of biological diversity: soil and water conservation, carbon sequestration and the preservation of aesthetic, cultural and religious values.
Information availabilityThe 174 countries reporting on area of primary forest account for 93.1 percent of total forest area. Information is missing, unfortunately, from many of the smaller islands and territories and from many of the countries in the Congo Basin, the second largest expanse of tropical forest (Figure 3.2).
Of the reporting countries, only 96 reported that they had any primary forest left in 2005. Several others reported that they had insufficient information on the area of primary forests. Few of those who did include an estimate had exact information. Many used the current area of forests in national parks and other protected areas as a proxy value or provided an expert estimate of the percentage of natural forests that could be considered primary according to the FRA 2005 definition.
These shortcomings should be kept in mind when referring to the findings below.
StatusInformation on the current and past extent of primary forest in each of the countries reporting on this variable can be found in Table 9 in Annex 3. A regional summary follows.
An estimated 1.3 billion hectares of forest – or 36.4 percent of the combined forest area of the reporting countries – are considered primary forest (Table 3.1).

Biological diversity 41
Forty-five percent of the total area of primary forest reported is found in South America, followed by North and Central America (23.3 percent) and Europe (19.7 percent – almost all of it in the Russian Federation).
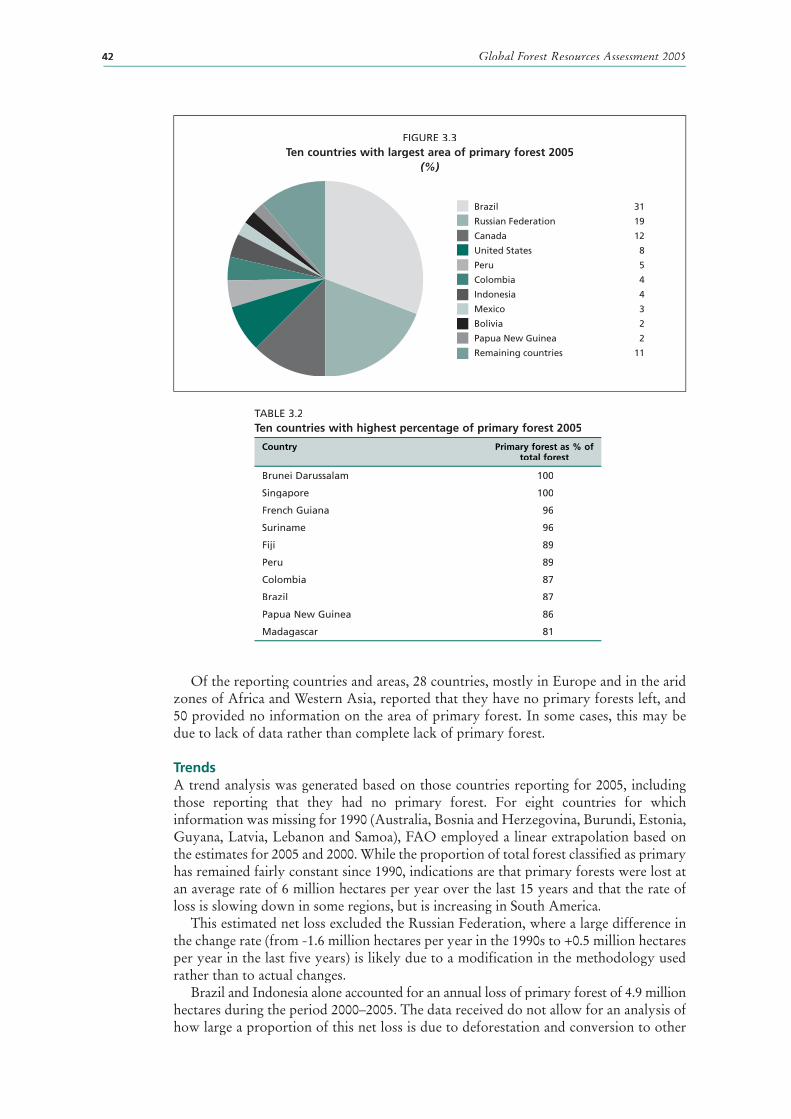
The ten countries with the largest area of primary forest account for 89.1 percent of the total area of primary forest in the world (Figure 3.3).
Twenty countries report that their primary forest is at least 50 percent of their total forest area, and ten countries have classified more than 80 percent of their forests as primary (Table 3.2).
FIGURE 3.2Information availability – area of primary forest
Percentage of total forest area
Eastern and Southern Africa
Northern Africa
Western and Central Africa
East Asia
South and Southeast Asia
Western and Central Asia
Europe
Caribbean
Central America
North America
Oceania
South America
World
Information available for all years Information available for latest year Information not available for latest year
0 10 20 30 40 50 60 70 80 90 100
TABLE 3.1Area of primary forest 2005
Region/subregion Information availability Area of primary Primary forest as % forest of total forest area
Countries Forest area % of total (1 000 ha)ha)ha reporting (1 000 ha)ha)ha forest area Average Range
Eastern and Southern Africa 18 214 589 94.7 12 241 5.7 0-81
Northern Africa 12 117 193 89.4 13 919 11.9 0-20
Western and Central Africa 17 99 566 35.8 11 510 11.6 0-45
Total Africa 47 431 347 67.9 37 669 8.7 0-81
East Asia 5 244 862 100.0 21 808 8.9 6-46
South and Southeast Asia 17 283 126 100.0 62 908 22.2 1-100
Western and Central Asia 23 43 579 100.0 2 810 6.4 0-72
Total Asia 45 571 567 100.0 87 526 15.3 0-72
Total Europe 36 983 907 98.3 263 948 26.8 0-32
Caribbean 12 4 090 68.5 60 1.5 6-59
Central America 7 22 411 100.0 9 139 40.8 2-70
North America 4 677 464 100.0 302 456 44.6 34-53
Total North and Central America 23 703 965 99.7 311 656 44.3 2-70
Total Oceania 11 203 455 98.6 35 275 n.s. n.s.-89
Total South America 12 783 827 94.3 601 689 76.8 10-96
World 174 3 678 069 93.1 1 337 763 36.4 0-100
Global Forest Resources Assessment 200542
Of the reporting countries and areas, 28 countries, mostly in Europe and in the arid zones of Africa and Western Asia, reported that they have no primary forests left, and 50 provided no information on the area of primary forest. In some cases, this may be due to lack of data rather than complete lack of primary forest.
TrendsA trend analysis was generated based on those countries reporting for 2005, including those reporting that they had no primary forest. For eight countries for which information was missing for 1990 (Australia, Bosnia and Herzegovina, Burundi, Estonia, Guyana, Latvia, Lebanon and Samoa), FAO employed a linear extrapolation based on the estimates for 2005 and 2000. While the proportion of total forest classified as primary has remained fairly constant since 1990, indications are that primary forests were lost at an average rate of 6 million hectares per year over the last 15 years and that the rate of loss is slowing down in some regions, but is increasing in South America.
This estimated net loss excluded the Russian Federation, where a large difference in the change rate (from -1.6 million hectares per year in the 1990s to +0.5 million hectares per year in the last five years) is likely due to a modification in the methodology used rather than to actual changes.
Brazil and Indonesia alone accounted for an annual loss of primary forest of 4.9 million hectares during the period 2000–2005. The data received do not allow for an analysis of how large a proportion of this net loss is due to deforestation and conversion to other
FIGURE 3.3Ten countries with largest area of primary forest 2005
(%)
TABLE 3.2Ten countries with highest percentage of primary forest 2005
Country Primary forest as % of total forest
Brunei Darussalam 100
Singapore 100
French Guiana 96
Suriname 96
Fiji 89
Peru 89
Colombia 87
Brazil 87
Papua New Guinea 86
Madagascar 81
Brazil 31
Russian Federation 19
Canada 12
United States 8
Peru 5
Colombia 4
Indonesia 4
Mexico 3
Bolivia 2
Papua New Guinea 2
Remaining countries 11

Biological diversity 43
uses and how much is due to the opening up of primary forests to selective logging and other human activities or to severe natural disasters, which could lead to some forests being classified as ‘modified natural forests’.
A number of countries registered positive change rates in the area of primary forests (see Table 9 in Annex 3), including several western European countries and Japan. In most of these cases, the countries have been setting aside natural forest areas in which no intervention should take place. With time, these areas evolve into forests in which there are no clearly visible indications of human activity and ecological processes are not significantly disturbed, meeting the definition of primary forests used in FRA 2005. For example, Japan and some of the European countries classified all natural forests over a certain age or size as primary forests if no interventions had been conducted over the last 25 years.
FOREST AREA DESIGNATED FOR CONSERVATION OF BIODIVERSITYThe setting aside and management of land as protected areas is a key part of ongoing global efforts to conserve biological diversity. The amount of land set aside for conservation is an important indicator of progress, and the monitoring of this variable provides valuable information to conservation practitioners. The data on protected areas that were gathered, analysed and presented in FRA 1990 and 2000 are complemented by the data on area of forest designated for conservation in FRA 2005.
The primary global source of data is the World Database on Protected Areas (WDPA), which is managed by the World Conservation Monitoring Centre (WCMC) of the United Nations Environment Programme (UNEP) and funded by the WDPA Consortium. The WDPA and the analysis of the data it contains are useful in understanding global trends in protected areas.
FRA 1990 (FAO, 1993) presented data in a table entitled Distribution of protected areas. It documented the number of protected areas and the total area under protection in developing countries in Africa, Asia and Latin America and in developed countries in Asia, Europe, the former Union of Soviet Socialist Republics (USSR), North America and Oceania.
FRA 2000 (FAO, 2001b) presented regional and global data on forests in protected areas and on the proportion of forest in protected areas in tropical, subtropical, temperate and boreal zones. The estimate in FRA 2000 that 12.4 percent of total forest area was in protected areas was of obvious interest. The relatively low proportion of boreal forest in protected areas was also significant. These findings should be compared with the contemporary World Wide Fund for Nature (WWF)/IUCN goal of establishing an ecologically representative network of protected areas covering at least 10 percent of the world’s forest area by the year 2000 (WWF and IUCN, 1998).
For FRA 2005, information was requested from countries and areas on two measures of the area designated for conservation of biodiversity:
• forest area designated primarily for conservation of biodiversity;• total forest area designated for conservation of biodiversity.Areas designated for conservation of biodiversity, whether as the primary or a
subsidiary function, include areas outside protected areas. At the same time, some forests in protected areas may be designated for the conservation of soil and water resources or a cultural heritage. So the estimated area of forest designated for conservation of biodiversity is not necessarily equivalent to the area of forest in protected areas.
Information availabilityFor FRA 2005, Figures 3.4 and 3.5 show that there was a striking difference in all regions in the percentage of countries or areas that provided information on the two measures of the area of forest designated for conservation of biological diversity.
A plausible explanation for the large difference in response rates is that the calculation of the total area designated for conservation is rather complex and different methodologies

Global Forest Resources Assessment 200544
are used at the national level. In Africa, eight forest-rich countries, accounting for 62 percent of the continent’s total forest cover, did not report on this measure. As a result, the estimate of the total area designated for conservation was less than half that of the area with conservation as the primary function, which is an anomalous result.
In South America, on the other hand, although only three out of 15 countries and areas reported on this measure, they account for 69 percent of the continent’s total forest
FIGURE 3.4Information availability – area of forest designated primarily for conservation of biodiversity
Percentage of total forest area
Eastern and Southern Africa
Northern Africa
Western and Central Africa
East Asia
South and Southeast Asia
Western and Central Asia
Europe
Caribbean
Central America
North America
Oceania
South America
World
Information available for all years Information available for latest year Information not available for latest year
0 10 20 30 40 50 60 70 80 90 100
FIGURE 3.5Information availability – total area of forest designated for conservation of biodiversity
Percentage of total forest area
Eastern and Southern Africa
Northern Africa
Western and Central Africa
East Asia
South and Southeast Asia
Western and Central Asia
Europe
Caribbean
Central America
North America
Oceania
South America
World
Information available for all years Information available for latest year Information not available for latest year
0 10 20 30 40 50 60 70 80 90 100

Biological diversity 45
area. The estimate of the total area designated for conservation was nearly three times the area having conservation as the primary function, which is consistent with what would logically be expected.
StatusThe data provided by countries on forest area designated primarily for biodiversity conservation show that, globally, more than 400 million hectares of forest – or 11.2 percent of total forest area of the reporting countries – are designated as having conservation of biodiversity as their primary function (Table 3.3).
The biggest area of forest designated for conservation of biodiversity is found in South America, followed by North America, while Central America and Western and Central Africa have the highest percentage of their forests designated primarily for conservation. Europe and Western and Central Asia have the lowest percentage of forests designated primarily for conservation.
Although the percentage of forest designated primarily for conservation is not exactly equal to the percentage of forest in protected areas, many countries used the area of forests in protected areas as a proxy value. It is thus not surprising to find that the global figure for this measure, 11.2 percent, is not significantly different from the estimate in FRA 2000 of the percentage of forest in protected areas, which was 12.4 percent.
The total area of forest designated for conservation is an interesting measure (Table 3.4) because it gives an indication of the area in which conservation is a consideration in land management, without necessarily being the priority, as might often be the case outside protected areas. It is logical to expect that this area will be larger than the area in which conservation is the primary function.
A comparison of Tables 3.3 and 3.4 confirms the expectation that the area designated for conservation would be larger than the area with conservation designated as the primary function. This comparison must be treated with caution, however, owing to the low response rates in Africa, Europe and Oceania for this variable.
TrendsFor FRA 2005, countries were asked to make retrospective estimates for 1990 and 2000 for the two measures of forest area designated for conservation.
TABLE 3.3Area of forest designated primarily for conservation of biodiversity 2005
Region/subregion Information availability Area designated primarily for conservation Countries Forest area % of total reporting (1 000 ha)000 ha)000 ha forest area 1 000 ha % of forest area
Eastern and Southern Africa 16 211 181 93.2 20 158 9.5
Northern Africa 13 125 667 95.9 13 036 10.4
Western and Central Africa 15 118 280 42.6 41 390 35.0
Total Africa 44 455 129 71.6 74 585 16.4
East Asia 5 244 862 100.0 11 479 4.7
South and Southeast Asia 17 283 126 100.0 57 290 20.2
Western and Central Asia 23 43 579 100.0 2 772 6.4
Total Asia 45 571 567 100.0 71 541 12.5
Total Europe 36 991 192 99.0 37 776 3.8
Caribbean 9 3 489 58.4 704 20.2
Central America 7 22 411 100.0 8 482 37.8
North America 4 677 464 100.0 79 741 11.8
Total North and Central America 20 703 364 99.6 88 927 12.6
Total Oceania 14 203 467 98.6 29 366 14.4
Total South America 13 831 540 100.0 119 742 14.4
World 172 3 756 260 95.0 421 936 11.2

Global Forest Resources Assessment 200546
The estimates provided for the percentage of forest area designated primarily for conservation are summarized in Table 3.5. The figures in this table suggest that the area of forest devoted to biodiversity conservation has increased by at least 96 million hectares, or 32 percent, since 1990. This increasing trend is evident in all regions and subregions except Northern, Eastern and Southern Africa.
According to the 2003 United Nations list of protected areas (Chape et al., 2003), which deals with all ecosystems, the area of land within protected areas grew by 53 percent from 1992 to 2003. The difference between this figure and the finding of FRA 2005 may be due to larger rates of increase in ecosystems other than forests.
TABLE 3.5Trends in area of forest designated primarily for conservation of biodiversity 1990–2005
Region/subregion Information availability (all 3 years) Area of forest designated Annual change rate (1 000 ha) (%) Countries Forest area % of total
reporting (1 000 ha) ha) ha forest area 1990 2000 2005 1990–2000 2000–2005
Eastern and Southern Africa 15 198 343 87.6 15 294 15 165 15 101 -0.08 -0.08
Northern Africa 13 125 667 95.9 14 441 13 515 13 036 -0.66 -0.72
Western and Central Africa 15 118 280 42.6 37 068 37 232 41 390 0.04 2.14
Total Africa 43 442 291 69.6 66 803 65 912 69 528 -0.13 1.07
East Asia 5 244 862 100.0 10 338 10 847 11 479 0.48 1.14
South and Southeast Asia 17 283 126 100.0 46 725 52 540 57 290 1.18 1.75
Western and Central Asia 21 43 272 99.3 1 744 2 126 2 761 2.00 5.37
Total Asia 43 571 259 99.9 58 807 65 513 71 531 1.09 1.77
Total Europe 34 984 468 98.3 18 402 33 877 36 760 6.29 1.65
Caribbean 9 3 489 58.4 622 675 704 0.83 0.83
Central America 7 22 411 100.0 7 873 8 660 8 482 0.96 -0.42
North America 4 677 464 100.0 69 745 70 384 79 741 0.09 2.53
Total North and Central America 20 703 364 99.6 78 240 79 720 88 927 0.19 2.21
Total Oceania 11 39 593 19.2 6 709 7 968 7 948 1.73 -0.05
Total South America 12 816 436 98.2 69 463 108 103 119 591 4.52 2.04
World 163 3 557 412 90.0 298 424 361 092 394 283 1.92 1.77
Note: As some countries did not report a complete series, figures for 2005 are slightly different from those presented in Table 3.3.
TABLE 3.4Total area of forest designated for conservation of biodiversity 2005
Region/subregion Information availability Total area designated for conservation Countries Forest area % of total reporting (1 000 ha)000 ha)000 ha forest area 1 000 ha % of forest area
Eastern and Southern Africa 3 42 529 18.8 10 272 24.2
Northern Africa 3 3 876 3.0 1 380 35.6
Western and Central Africa 6 71 350 25.7 27 150 38.1
Total Africa 12 117 754 18.5 38 802 33.0
East Asia 5 244 862 100.0 119 078 48.6
South and Southeast Asia 17 283 126 100.0 147 298 52.0
Western and Central Asia 12 17 507 40.2 8 580 49.0
Total Asia 34 545 495 95.4 274 955 50.4
Total Europe 22 133 854 13.4 88 219 65.9
Caribbean 3 524 8.8 130 24.9
Central America 1 4 294 19.2 2 827 65.8
North America 2 310 137 45.8 310 135 100.0
Total North and Central America 6 314 955 44.6 313 092 99.4
Total Oceania 7 10 235 5.0 8 719 85.2
Total South America 3 544 501 65.5 318 335 58.5
World 84 1 666 795 42.2 1 042 122 62.5

Biological diversity 47
The trends in the total area designated for conservation are summarized in Table 3.6. There was an estimated 24 percent increase in the world figure for total forest area designated for conservation between 1990 and 2005. However, the reliability of the estimate is reduced by the small areas reported for Africa, Europe and Oceania.
COMPOSITION OF FORESTSInformation on growing stock composition offers a proxy indicator that aids better understanding and monitoring of the dynamics of the relative abundance of forest tree species. The ten most common species in terms of growing stock have been listed and their contribution to total growing stock documented for 1990 and 2000. FRA 2005 attempts to estimate the rate of change of forest tree composition among the ten most abundant species, and to assess whether such information may be useful in documenting the factors implicated in these changes at the global level.
Information availabilityInformation on the species represented in growing stock is poor: only 82 countries and areas, accounting for 60 percent of total forest area, provided quantitative information on the ten most common species. Regions or subregions with the highest response rates were Asia, Europe and North America (Figure 3.6).
StatusTable 3.7 shows the percentage of growing stock of the three and the ten most common tree species.
The relative importance of growing stock of a species depends on many environmental and silvicultural factors. In natural and semi-natural forests, the percentage of growing stock represented by a given number of tree species is expected to be inversely correlated to tree species richness (and the number of tree species present in the area). Figure 3.7 shows that the percentage of growing stock occupied by the three most common tree species (native or introduced) is a reasonable predictor of the growing stock occupied by the ten most common (native or introduced) species at the country level.
TABLE 3.6Trends in total area of forest designated for conservation of biodiversity 1990–2005
Region/subregion Information availability (all 3 years) Area of forest designated Annual change rate (1 000 ha) (%) Countries Forest area % of total
reporting (1 000 ha) ha) ha forest area 1990 2000 2005 1990–2000 2000–2005
Eastern and Southern Africa 3 42 529 18.8 10 273 10 273 10 272 0 n.s.
Northern Africa 2 2 322 1.8 863 1 179 1 276 3.17 1.59
Western and Central Africa 6 71 350 25.7 23 628 24 005 27 150 0.16 2.49
Total Africa 11 116 200 18.3 34 764 35 457 38 698 0.20 1.76
East Asia 5 244 862 100.0 81 185 105 727 119 078 2.68 2.41
South and Southeast Asia 17 283 126 100.0 130 606 148 547 147 298 1.30 -0.17
Western and Central Asia 11 17 371 39.9 8 186 8 138 8 576 -0.06 1.06
Total Asia 33 545 358 95.4 219 978 262 411 274 952 1.78 0.94
Total Europe 21 133 187 13.3 78 529 89 304 88 010 1.29 -0.29
Caribbean 3 524 8.8 138 130 130 -0.60 0
Central America 1 4 294 19.2 2 754 2 857 2 827 0.37 -0.21
North America 2 310 137 45.8 310 137 310 137 310 135 0 n.s.
Total North and Central America 6 314 955 44.6 313 029 313 124 313 092 n.s. n.s.
Total Oceania 6 10 064 4.9 8 024 8 561 8 644 0.65 0.19
Total South America 2 485 761 58.4 137 695 180 623 259 595 2.75 7.52
World 79 1 605 526 40.6 792 018 889 481 982 990 1.17 2.02
Note: As some countries did not report a complete series, figures for 2005 are slightly different from those presented in Table 3.4.

Global Forest Resources Assessment 200548
Great variation exists in terms of species diversity, with limited numbers of individual species and high species richness per area unit in Central and South America, South and Southeast Asia and Western and Central Africa. Boreal forests of the Northern Hemisphere tend to harbour the lowest species diversity. At the country level, Congo, Viet Nam, Myanmar, Panama, Ghana, Madagascar, Indonesia and India (listed in ascending order) report that the ten most common tree species represent less
TABLE 3.7Percentage of growing stock occupied by the most common tree species 2000
Region/subregion Information Three most common Ten most common availability tree species tree species
Countries Forest % total Aver. % Min. % Max. % Aver. % Min. % Max. % reporting area forest growing growing growing growing growing growing (1 000 ha)000 ha)000 ha area stock stock stock stock stock stockstock stockstock
Eastern and Southern Africa 6 40 294 17.1 54 12 100 69 23 100
Northern Africa 5 77 981 57.4 64 23 88 76 31 100
Western and Central Africa 5 40 129 14.1 24 10 44 43 18 71
Total Africa 16 158 404 24.2 48 10 100 63 18 100
East Asia 4 218 842 97.0 57 29 93 79 64 100
South and Southeast Asia 10 266 914 89.8 31 7 67 47 19 87
Western and Central Asia 11 39 062 89.7 77 60 94 94 80 99
Total Asia 25 524 818 92.6 55 7 93 73 19 100
Total Europe 30 979210 98.1 70 34 93 92 65 100
Caribbean 2 238 4.2 36 33 39 69 63 76
Central America 1 4 307 18.1 10 10 10 22 22 22
North America 2 612 428 90.3 29 25 33 59 48 70
Total North and Central America 5 616 973 87.2 28 10 39 56 22 76
Total Oceania 2 44 0.0 41 38 44 77 72 81
Total South America 4 117 758 13.8 37 28 50 60 48 79
World 82 2 397 208 60.1 56 7 100 76 18 100
FIGURE 3.6Information availability – composition of growing stock
Percentage of total forest area
Eastern and Southern Africa
Northern Africa
Western and Central Africa
East Asia
South and Southeast Asia
Western and Central Asia
Europe
Caribbean
Central America
North America
Oceania
South America
World
Information available for all years Information available for latest year Information not available for latest year
0 10 20 30 40 50 60 70 80 90 100

Biological diversity 49
FIGURE 3.7Average growing stock of the ten most common forest tree species as function of growing
stock occupied by the three most common species¹
3 species – % of total growing stock
0 10 20 30 40 50 60 70 80 90 1000
10
20
30
40
50
60
70
80
90
100
10 s
pec
ies
– %
of
tota
l gro
win
g s
tock
¹ One square = one country/area.
than 30 percent of total growing stock, indicating high species diversity. Information was missing from many countries in South America (including Brazil) and from most countries in the Congo Basin, both areas of known high species diversity.
Figure 3.8 displays a loose relationship between two tree species diversity surrogates: total number of native tree species and growing stock composition. Introduced species are included in the data set for the growing stock composition.
Among the ten most common species, 445 different taxa have been reported by 88 countries. Asia and Europe are over-represented in the data set, which includes incomplete reports. A significant number of taxa were reported at the genus level without indication of species. Most countries provided Latin names. Five genera (Pinus, Quercus, Picea, Abies and Fagus) make up almost a third of the species reported. Figure 3.9 shows the distribution of the 25 most common genera, which represent 64 percent of all taxa reported.
TrendsEighty-two countries provided time series (sometimes incomplete) on changes in the relative share of growing stock occupied by the ten main species from 1990 to 2000. No change in the relative ranking of tree species was observed in the data set. No significant change in the share of growing stock occupied by the three main species was seen in the data series from the 56 countries and areas providing complete series. In 1990 and 2000, this share accounted for 53 percent of growing stock, on average, although individual countries and areas varied by +/-5 percent.

Global Forest Resources Assessment 200550
FIGURE 3.9Twenty-five most common tree genera reported¹
CedrusPseudotsugaPterocarpusCombretum
EucalyptusDipterocarpus
TiliaNothofagus
SalixJuniperus
TerminaliaAcacia
AcerLarix
Alnus Fraxinus Carpinus
ShoreaPopulus
FagusBetulaAbiesPicea
QuercusPinus
0 2 4 6 8 10 12
% of all taxa reported
¹ Among the ten most common species reported by 88 countries.
FIGURE 3.8Percentage of growing stock represented by the three most common forest tree species
as function of number of native tree species
No. of native tree species
0 10 100 1 000 10 0000
10
20
30
40
50
60
70
80
90
100
3 sp
ecie
s –
% o
f to
tal g
row
ing
sto
ck

Biological diversity 51
NUMBER OF NATIVE TREE SPECIESEstimates of number of species by taxonomic group, by country, are available in the literature, with the notable exception of trees. FRA 2005 is a first attempt to systematically record the number of native forest tree species by country and area at the global level. The definition of a tree is complex; for example there is no universally adopted relative classification of shrubs and trees. The definition of forests used for FRA 2005 includes bamboo, palm and other woody species. In addition, in some cases where a species has been present in a country for many centuries, it is impossible to ascertain whether it is native or was introduced.
Information availabilityGlobally, 132 countries and areas accounting for 88 percent of total forest area provided data on the number of native tree species. High response rates were noted in Europe, East Asia, North America, Northern Africa and South America. The lowest response rates were in island states and territories of the Caribbean and Oceania (Figure 3.10).
National data were based on forest inventory lists, flora, national biodiversity reports and discussions with botanists and taxonomists. National forest inventories tend to group species according to their commercial value or to list genera rather than species, making species recording difficult and undervaluing species richness. Some countries reported that a number of native species were under identification or not identified. By default, some areas have reported the total number of plants in the country. A number of countries have undertaken desk studies of available literature and many synonyms were found, making cross-checking difficult.
None of these problems necessarily invalidate the results: identification of tree species present in a country, independently of unsolved taxonomic problems, is notoriously difficult, particularly in mega-diversity areas. The data set was incomplete and its significance in terms of biological diversity will be determined at a later stage. Once these methodological problems are resolved, there is considerable potential for useful information, for instance on the geographical range of species.
FIGURE 3.10Information availability – number of native forest tree species
Percentage of total forest area
Eastern and Southern Africa
Northern Africa
Western and Central Africa
East Asia
South and Southeast Asia
Western and Central Asia
Europe
Caribbean
Central America
North America
Oceania
South America
World
Information available Information not available
0 10 20 30 40 50 60 70 80 90 100

Global Forest Resources Assessment 200552
StatusTable 3.8 shows the average number of native tree species for the reporting countries and the range within each region. Individual countries reporting on this topic ranged from a minimum of three native species to a maximum of 7 780. Figure 3.11 illustrates the number of native forest tree species per country.
TABLE 3.8Native forest tree species
Region/subregion Information availability No. of native tree species by country
Countries Forest area % of total Aver. Min. Max. reporting (1 000 ha)ha)ha forest area
Eastern and Southern Africa 10 94 220 40.1 1 076 60 5 000
Northern Africa 12 125 851 92.6 327 12 1 739
Western and Central Africa 11 211 730 74.4 703 140 2 243
Total Africa 33 431 801 65.9 679 12 5 000
East Asia 3 208 177 92.3 1 625 1 049 2 500
South and Southeast Asia 14 117 159 39.4 1 320 105 3 000
Western and Central Asia 16 37 563 86.2 146 20 534
Total Asia 33 362 899 64.0 778 20 3 000
Total Europe 36 993 477 99.5 63 3 280
Caribbean 5 3 194 56.0 409 76 722
Central America 6 23 513 98.6 1 236 117 4 000
North America 4 677 971 100.0 596 21 1 130
Total North and Central America 15 704 678 99.6 790 21 4 000
Total Oceania 3 172 876 83.1 838 121 2 100
Total South America 12 833 428 97.7 1 994 123 7 880
World 132 3 499 159 87.7 671 3 7 880
FIGURE 3.11Number of native forest tree species
<50
50–200
200–1 000
>1 000
No data

Biological diversity 53
South America has the highest average number of native forest tree species per country. Brazil reported the highest number of forest trees in the world (7 880), with high species diversity in the Amazon basin and in the Atlantic coastal forest (Mata Atlantica). High species richness is also reported by countries in Central Africa, Central America, East Asia, Madagascar and South and Southeast Asia. The lowest average number of trees per country is found in Europe, where Iceland and Malta record the lowest number of native tree species – three – of any country with forests. Species diversity in boreal forests is usually relatively low, and vast expanses of such forests in the northern hemisphere are dominated by a small number of tree species. Countries with dry tropical forests tend to have lower species diversity than countries with moist tropical forests. More generally, it is often mentioned that tree species richness increases with decreasing latitude. Unfortunately, knowledge and documentation of species follow the opposite trend, and many native tropical tree species remain unidentified or unrecorded, especially in Central Africa.
FRA 2000 compiled information for temperate and boreal countries on all forest trees, not only native species. The broad regional trends it identified remain valid (Dudley and Solton, 2003). FRA 2000 found the highest levels of temperate and boreal tree diversity in the western part of the Pacific rim, while the lowest levels occured in the boreal regions. In Europe and Central Asia, tree diversity increased towards the south and east.
The absence of an authoritative world list of trees and shrubs is a serious impediment to assessing and monitoring one of the most basic components of forest biodiversity – tree species richness at the national level. Several ongoing global taxonomic initiatives are expected to ease this limitation in the years to come. At the country level, in addition to taxonomic issues, the development of flora and tree recognition guides will help species identification by foresters and conservationists. Lists of native tree species provide a useful background to lists of endangered tree species, as absolute numbers for the latter are of limited value without some indication of the total number of species.
THREATENED FOREST TREE SPECIESFor FRA 2005, countries were asked to report information on the number of forest tree species considered threatened. Precise status categories were suggested for the terms ‘vulnerable’, ‘endangered’ and ‘critically endangered’, using the ranking system of the IUCN red list categories and criteria. For countries and areas with an existing IUCN red data book of threatened plants, such information is accessible. The IUCN red list can be sorted by kingdom, genus and species. ‘Tree’ is not an easily definable group, and at the country level, data had to be gathered on a species by species (or genus by genus) basis. Although IUCN 2000 data are used in FRA 2005, some national reports contain complementary remarks or updates. This is particularly important in the case of discrepancies between IUCN data and national data sources, or when national classification systems are used.
Information availabilityInformation on vulnerable, endangered and critically endangered forest trees was provided by all regions, representing 192 countries and accounting for 99 percent of total forest area. Information was missing primarily from some of the smaller Pacific and Caribbean islands and some countries in Western and Central Africa (Figure 3.12). Fifty-three countries and areas reported discrepancies with the 2000 red list, while a few countries indicated that a national list of threatened trees was under revision. The availability of data is in line with findings from the UNEP-WCMC desk study for FRA 2000, which indicated that contrary to trees per se, for which no global data were available, the availability of global statistics on endangered trees was good.

Global Forest Resources Assessment 200554
StatusOf the 192 reporting countries (Table 3.9), 146 countries and areas reported that one or more tree species are threatened in their jurisdiction. South America and South and Southeast Asia have the highest number of threatened trees, while the lower rates are found in Europe (Figure 3.13).
The overall high response rate is due to the availability of IUCN red lists. It also shows that there is a clear perception that significant numbers of forest trees are under threat and are found in all regions of the world.
TABLE 3.9Threatened tree species
Region/subregion Information No. of critically No. of endangered No. of vulnerable availability endangered tree species tree species tree species
by country by country by countryCountries Forest area % of totalreporting (1 000 ha)ha)ha forest area Aver. Min. Max. Aver. Min. Max. Aver. Min. Max.
Eastern and Southern Africa 18 235 039 100.0 6 0 41 10 0 65 21 0 63
Northern Africa 15 134 947 99.3 0 0 1 1 0 3 5 0 23
Western and Central Africa 20 262 050 92.1 4 0 50 5 0 27 34 0 138
Total Africa 53 632 036 96.4 4 0 50 5 0 65 21 0 138
East Asia 5 225 663 100.0 20 0 67 18 0 45 37 0 96
South and Southeast Asia 16 296 525 99.7 30 0 122 31 0 99 67 2 403
Western and Central Asia 20 42 995 98.7 0 0 1 0 0 2 1 0 5
Total Asia 41 565 183 99.7 14 0 122 14 0 99 31 0 403
Total Europe 39 998 071 100.0 0 0 4 0 0 8 1 0 7
Caribbean 20 5 683 99.6 4 0 23 7 0 50 10 0 62
Central America 7 23 837 100.0 10 0 43 29 6 71 45 18 106
North America 4 677 971 100.0 14 0 55 19 0 69 21 0 60
Total North and Central America 31 707 491 100.0 7 0 55 14 0 71 20 0 106
Total Oceania 15 176 724 84.9 3 0 26 2 0 18 8 0 37
Total South America 13 852 796 100.0 9 0 34 17 0 100 48 0 187
World 192 3 932 299 98.6 6 0 122 8 0 100 20 0 403
FIGURE 3.12Information availability – threatened forest tree species
Percentage of total forest area
Eastern and Southern Africa
Northern Africa
Western and Central Africa
East Asia
South and Southeast Asia
Western and Central Asia
Europe
Caribbean
Central America
North America
Oceania
South America
World
Information available Information not available
0 10 20 30 40 50 60 70 80 90 100

Biological diversity 55
FRA 2005 data on forest cover change, number of native forest trees and number of threatened trees were used to assess the links between loss of forest and number of threatened tree species. No simple relationship was found. Some countries, despite relatively high proportions of remaining natural forests and protected areas, also recorded high levels of risk to individual tree species.
Table 3.10 provides an additional perspective. The number of threatened tree species (the categories ‘critically endangered’, ‘endangered’ and ‘vulnerable’ added together by country) is expressed as a percentage of the total number of native species in individual countries and is then averaged by region and subregion. Representing 87 percent of the global forest area, 126 countries provided data on both native tree species and threatened
TABLE 3.10Threatened tree species as percentage of number of native tree species in individual countries
Region/subregion % of native tree species
Eastern and Southern Africa 11
Northern Africa 3
Western and Central Africa 9
Total Africa 7
East Asia 7
South and Southeast Asia 8
Western and Central Asia 1
Total Asia 4
Total Europe 2
Caribbean 18
Central America 12
North America 5
Total North and Central America 12
Total Oceania 3
Total South America 6
World 5
FIGURE 3.13Average number of threatened forest tree species by region
No. of species
Africa
Asia
Europe
North and Central America
Oceania
South America
0 10 20 30 40 50 60 70 80
Vulnerable tree spp. Endangered tree spp. Critically endangered tree spp.

Global Forest Resources Assessment 200556
forest species. Globally, approximately 5 percent of the world’s native tree species, on average, are reported threatened in their country or territory of origin.
The often-quoted primary direct causes of loss of biodiversity include habitat loss due to land conversion and fragmentation of habitats, alien species invasions and overharvesting of forest resources. The relationship between these factors and biodiversity estimates and surrogates will require further analysis. It is recognized that the value of information on endangered species has some limitations in this regard, owing to the lack of basic data on the distribution and occurrence of most tree species.