Chapter 24B Nutrition, Metabolism, Body Temperature Slides by Barbara Heard and W. Rose. figures...
67
Chapter 24B Nutrition, Metabolism, Body Temperature Slides by Barbara Heard and W. Rose. figures from Marieb & Hoehn 9 th ed. Portions copyright Pearson Education
-
Upload
maximilian-shepherd -
Category
Documents
-
view
229 -
download
4
Transcript of Chapter 24B Nutrition, Metabolism, Body Temperature Slides by Barbara Heard and W. Rose. figures...
Chapter 24B
Nutrition, Metabolism,
Body Temperature
Slides by Barbara Heard and W. Rose.
figures from Marieb & Hoehn 9th ed.
Portions copyright Pearson Education

© 2013 Pearson Education, Inc.
Protein Metabolism
• Proteins deteriorate, so continually broken down and replaced
• Amino acids recycled new proteins or different compound
• Protein not stored in body– When dietary protein in excess, amino acids
• Oxidized for energy • Converted to fat for storage

© 2013 Pearson Education, Inc.
Protein Synthesis
• Amino acids most important anabolic nutrients– Form all proteins; bulk of functional molecules
• Hormonally controlled
• Requires complete set of amino acids – Essential amino acids required in diet
• Synthesize 225 – 450 kg protein during lifetime
© 2013 Pearson Education, Inc.
Catabolic-Anabolic Steady State
• Dynamic state in which– Organic molecules (except DNA) continuously
broken down and rebuilt– Organs have different fuel preferences– Uses nutrient pools
• Stores of amino acids, carbohydrates, fats

© 2013 Pearson Education, Inc.
Nutrient Pools
• Three interconvertible pools– Amino acids– Carbohydrates – Fats
• Amount and direction of conversion directed by liver, adipose tissue, skeletal muscle

© 2013 Pearson Education, Inc.
Amino Acid Pool
• Body's total supply of free amino acids
• Proteins lost in urine, hair, skin cells
• Source for – Resynthesizing body proteins – Forming amino acid derivatives– Gluconeogenesis

© 2013 Pearson Education, Inc.
Carbohydrate and Fat Pools
• Easily interconverted through key intermediates
• Differ from amino acid pool – Fats and carbohydrates oxidized directly to
produce energy; amino acids first converted to carbohydrate
– Excess carbohydrate and fat can be stored; amino acids not stored as protein
© 2013 Pearson Education, Inc.
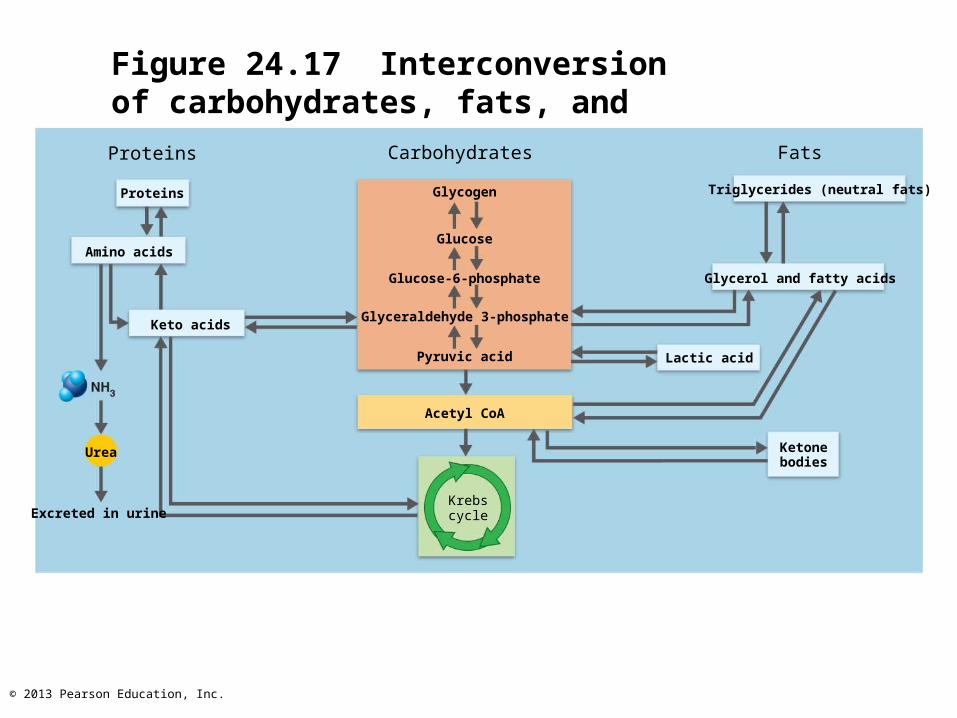
Figure 24.17 Interconversion of carbohydrates, fats, and proteins.
Proteins
Proteins
Amino acids
Urea
Excreted in urine
Carbohydrates
Glycogen
Glucose
Glucose-6-phosphate
Glyceraldehyde 3-phosphate
Pyruvic acid
Acetyl CoA
Krebs cycle
Fats
Triglycerides (neutral fats)
Glycerol and fatty acids
Lactic acid
Ketonebodies
Keto acids

© 2013 Pearson Education, Inc.
Catabolic-Anabolic Steady State of the Body
• Blood concentrations of energy sources equalized between absorptive state and postabsorptive state– Absorptive state during and 3-5 hours after
each meal; absorption of nutrients occurring– Postabsorptive state late morning, late
afternoon, all night; GI tract empty; energy sources supplied by breakdown of reserves

© 2013 Pearson Education, Inc.
Absorptive State
• Anabolism exceeds catabolism
• Nutrients stored
• Carbohydrates– Glucose major cellular energy fuel – Glucose converted in liver to glycogen or fat
• Synthesized fat + protein released to blood for storage by adipose tissue as very low density lipoproteins (VLDLs)
© 2013 Pearson Education, Inc.
Absorptive State
• Triglycerides– Lipoprotein lipase catalyzes lipids of
chylomicrons in muscle and fat tissues– Most glycerol and fatty acids converted to
triglycerides for storage– Triglycerides used by adipose tissue, liver,
and skeletal and cardiac muscle as primary energy source
© 2013 Pearson Education, Inc.
Absorptive State
• Amino acids– Excess amino acids deaminated and used for
ATP synthesis or stored as fat in liver– Most amino acids used in protein synthesis

© 2013 Pearson Education, Inc.
Figure 24.18a Major events and principal metabolic pathways of the absorptive state.
Major metabolic thrust:anabolism and energy storage
Amino acids
Proteins Glycogen
GlucoseGlycerol andfatty acids
Triglycerides
Major energy fuel:glucose (dietary)
Glucose
Liver metabolism:amino acids deaminated and
used for energy or stored as fat
Amino acids
Keto acids
Triglycerides
Major events of the absorptive state

© 2013 Pearson Education, Inc.
Figure 24.18b Major events and principal metabolic pathways of the absorptive state.
Triglycerides
Glycogen
Protein
In liver:
Protein
Glucose
Amino acids
Glycogen
Fattyacids
Triglycerides
Gastrointestinaltract
Glucose
Keto acidsGlyceraldehyde
3-phosphate
Glycerol
Fattyacids
Glucose
Fattyacids
Glucose
In all tissues:
TriglyceridesIn adiposetissue:
Glycerol
In muscle:
Principal pathways of the absorptive state

© 2013 Pearson Education, Inc.
Absorptive State: Hormonal Control
• Absorptive state primarily controlled by insulin
• Insulin secretion stimulated by– Elevated blood levels of glucose and amino
acids– Intestinal GIP and parasympathetic
stimulation
© 2013 Pearson Education, Inc.
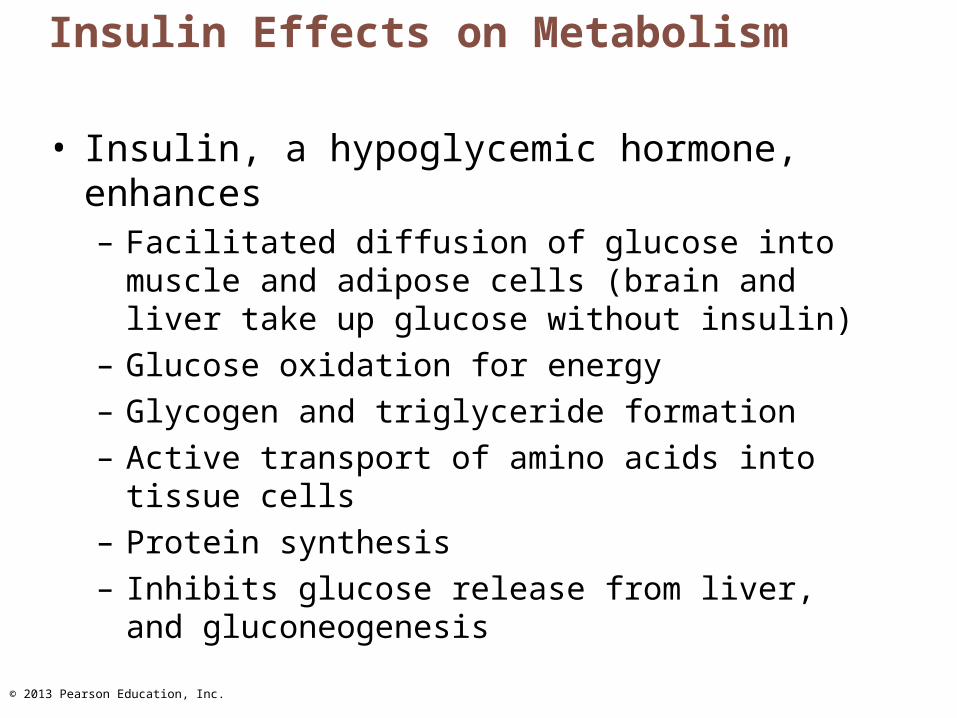
Insulin Effects on Metabolism
• Insulin, a hypoglycemic hormone, enhances– Facilitated diffusion of glucose into muscle and
adipose cells (brain and liver take up glucose without insulin)
– Glucose oxidation for energy– Glycogen and triglyceride formation– Active transport of amino acids into tissue cells– Protein synthesis– Inhibits glucose release from liver, and
gluconeogenesis

© 2013 Pearson Education, Inc.
Homeostatic Imbalance
• Diabetes mellitus– Inadequate insulin production or abnormal
insulin receptors – Glucose unavailable to most body cells – Blood glucose levels high– Glucose lost in urine– Fats and proteins used for energy
metabolic acidosis, protein wasting, weight loss
© 2013 Pearson Education, Inc.
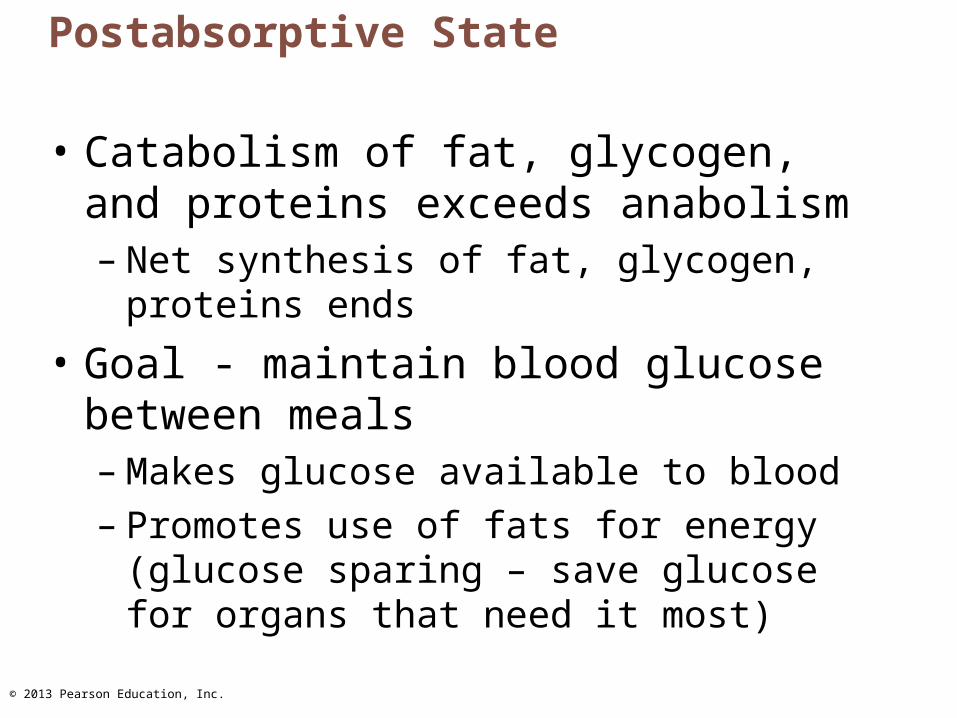
Postabsorptive State
• Catabolism of fat, glycogen, and proteins exceeds anabolism– Net synthesis of fat, glycogen, proteins ends
• Goal - maintain blood glucose between meals– Makes glucose available to blood– Promotes use of fats for energy (glucose
sparing – save glucose for organs that need it most)

© 2013 Pearson Education, Inc.
Sources of Blood Glucose
• Glycogenolysis in liver
• Glycogenolysis in skeletal muscle
• Lipolysis in adipose tissues and liver– Glycerol used for gluconeogenesis in liver
• Catabolism of cellular protein– Major source during prolonged fasting
• Amount of fat in body determines how long can survive without food

© 2013 Pearson Education, Inc.
Figure 24.20a Major events and principal metabolic pathways of the postabsorptive state.
Proteins Glycogen Triglycerides
Amino acids Glucose
Glycerol and fatty acids
Glucose Fatty acidsand ketones
Amino acids
Keto acids
Glucose
Major metabolic thrust:catabolism and replacement of fuels in blood
Major energy fuels:glucose provided by glycogenolysis and
gluconeogenesis; fatty acids, and ketones
Liver metabolism:amino acids converted to glucose
Major events of the postabsorptive state
© 2013 Pearson Education, Inc.
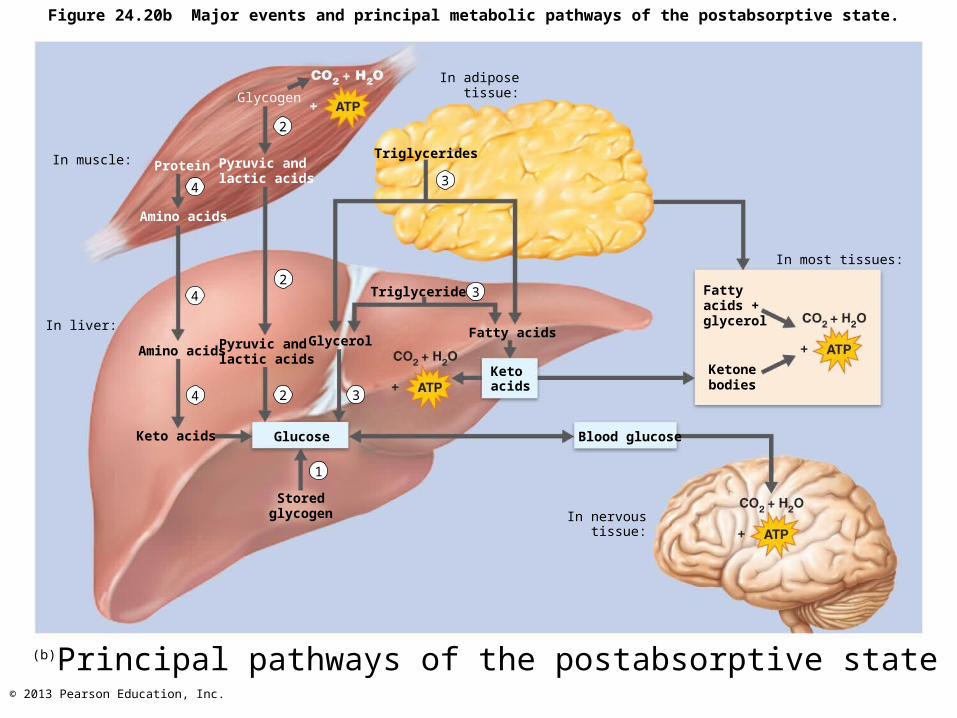
Figure 24.20b Major events and principal metabolic pathways of the postabsorptive state.
In muscle: Pyruvic andlactic acids
Protein
Amino acids
In liver:
Amino acids
Keto acids
Pyruvic andlactic acids
Storedglycogen
Glucose
In adipose tissue:
Triglycerides
Triglycerides
GlycerolFatty acids
Ketoacids
Blood glucose
In nervoustissue:
In most tissues:
Fattyacids +glycerol
Ketonebodies
Principal pathways of the postabsorptive state
4
2
42
4 2 3
1
3
3
Glycogen
(b)

© 2013 Pearson Education, Inc.
Postabsorptive State: Hormonal and Neural Controls
• Glucagon - hyperglycemic hormone– Release stimulated by
• Declining blood glucose• Rising amino acid levels

© 2013 Pearson Education, Inc.
Effects of Glucagon
• Glucagon promotes– Glycogenolysis and gluconeogenesis in the
liver– Lipolysis in adipose tissue fatty acids and
glycerol to blood

© 2013 Pearson Education, Inc.
Postabsorptive State: Hormonal and Neural Controls
• Adipose tissue innervated by sympathetic nervous system– Quickly supplies glucose if blood levels low– Low plasma glucose, fight-or-flight response,
or exercise fat mobilization and glycogenolysis
• Initiated by sympathetic nervous system and epinephrine from adrenal medulla
© 2013 Pearson Education, Inc.
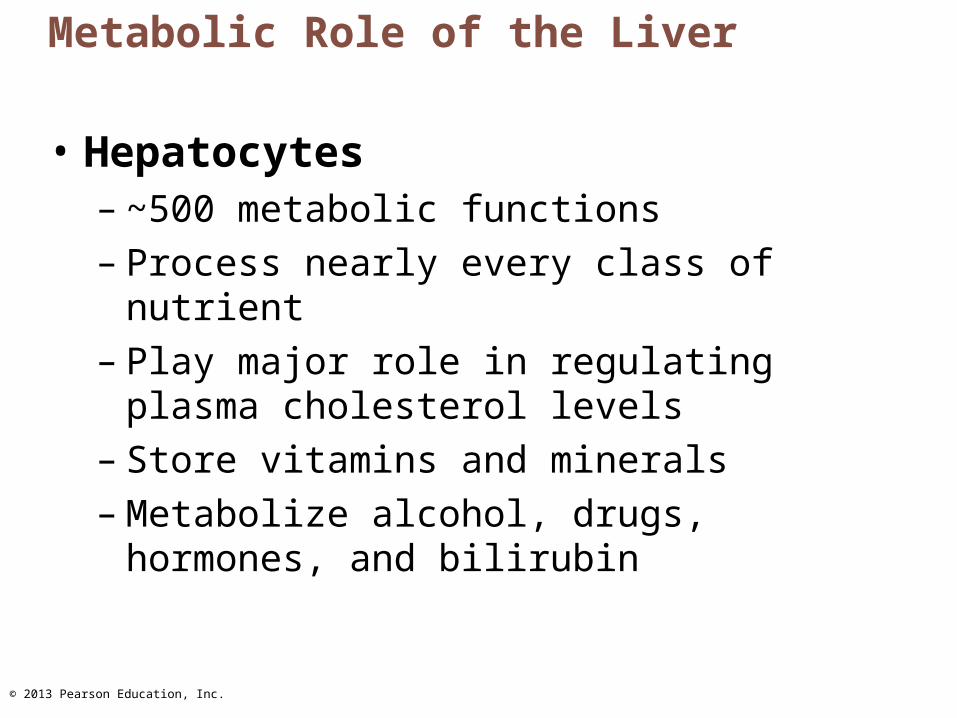
Metabolic Role of the Liver
• Hepatocytes– ~500 metabolic functions– Process nearly every class of nutrient– Play major role in regulating plasma
cholesterol levels– Store vitamins and minerals– Metabolize alcohol, drugs, hormones, and
bilirubin

© 2013 Pearson Education, Inc.
Cholesterol
• Structural basis of bile salts, steroid hormones, and vitamin D
• Major component of plasma membranes• 15% of blood cholesterol ingested; rest
made in body, primarily liver• Lost from body when catabolized or
secreted in bile salts• Part of hedgehog signaling molecule that
directs embryonic development

© 2013 Pearson Education, Inc.
Cholesterol Transport
• Lipoproteins – Transport water-insoluble cholesterol and
triglycerides in blood– Regulate lipid entry/exit at target cells– Contain triglycerides, phospholipids,
cholesterol, and protein• Higher percentage of lipids lower density, hence
VLDLs, LDLs, HDLs
© 2013 Pearson Education, Inc.
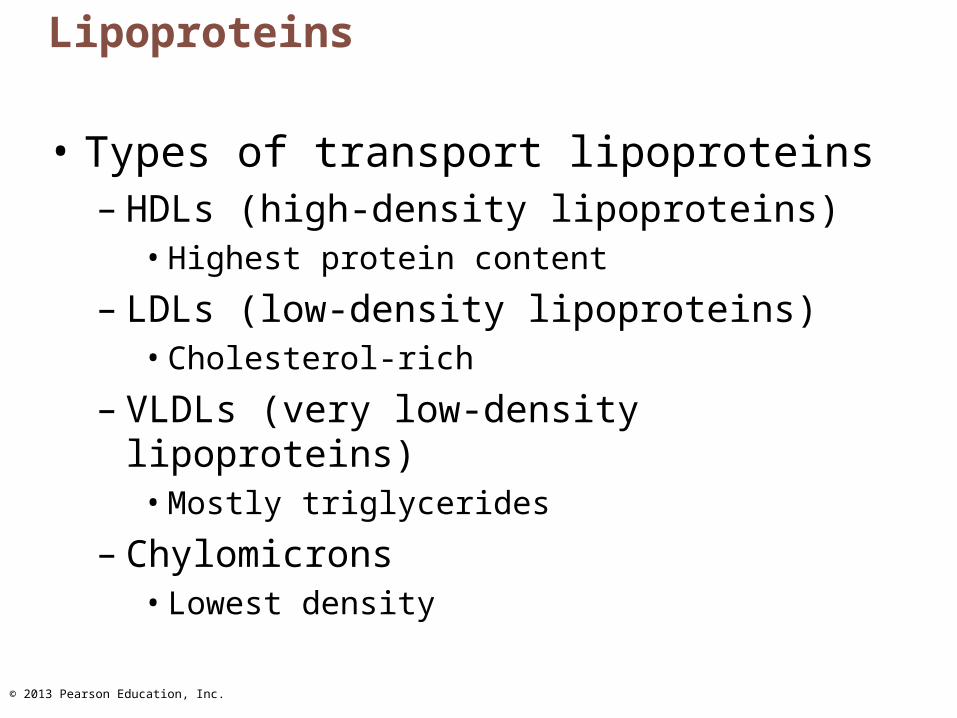
Lipoproteins
• Types of transport lipoproteins– HDLs (high-density lipoproteins)
• Highest protein content
– LDLs (low-density lipoproteins)• Cholesterol-rich
– VLDLs (very low-density lipoproteins)• Mostly triglycerides
– Chylomicrons• Lowest density

© 2013 Pearson Education, Inc.
Figure 24.22 Approximate composition of lipoproteins that transport lipids in body fluids.
From intestine
80–95%
3–6%2–7%
1–2%Chylomicron
55–65%
Made by liver
10%
20%
45%
25%
LDL
Returned toliver
5%
30%
20%
45–50%
HDL
15–20%
10–15%
5–10%
Triglyceride
Phospholipid
Cholesterol
Proteinl
VLDL

© 2013 Pearson Education, Inc.
Lipoproteins
• VLDLs– Transport triglycerides from liver to peripheral tissues
(mostly adipose)
• LDLs– Transport cholesterol to peripheral tissues for
membranes, storage, or hormone synthesis
• HDLs– Transport excess cholesterol from peripheral tissues
to liver to be broken down and secreted into bile– Also provide cholesterol to steroid-producing organs
© 2013 Pearson Education, Inc.
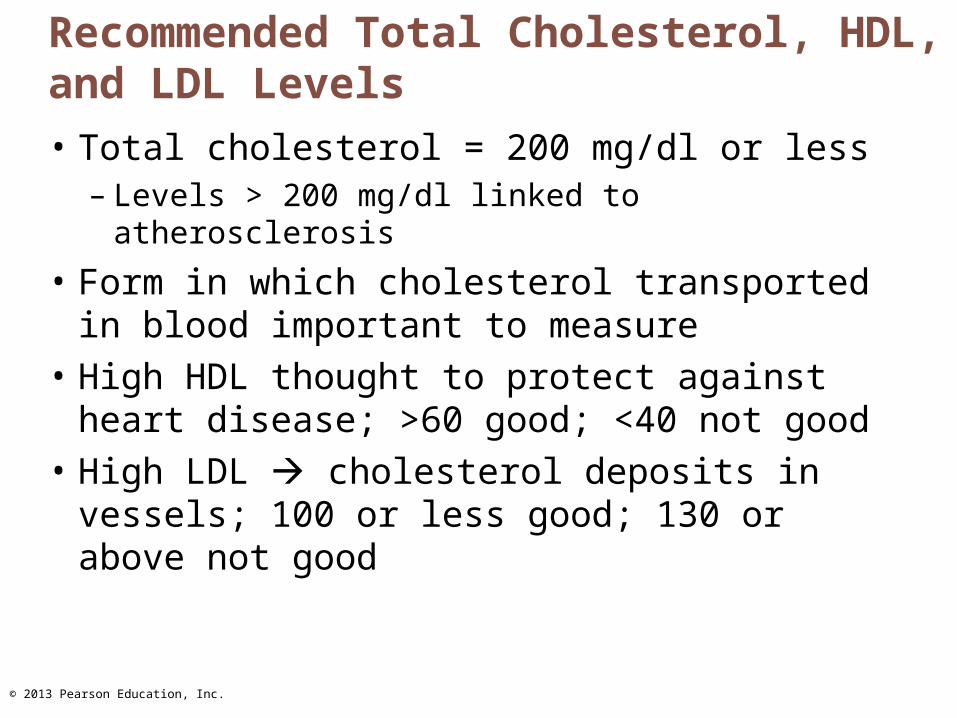
Recommended Total Cholesterol, HDL, and LDL Levels
• Total cholesterol = 200 mg/dl or less– Levels > 200 mg/dl linked to atherosclerosis
• Form in which cholesterol transported in blood important to measure
• High HDL thought to protect against heart disease; >60 good; <40 not good
• High LDL cholesterol deposits in vessels; 100 or less good; 130 or above not good

© 2013 Pearson Education, Inc.
Plasma Cholesterol Levels
• The liver produces cholesterol– At a basal level regardless of dietary
cholesterol intake– In response to saturated fatty acids
© 2013 Pearson Education, Inc.
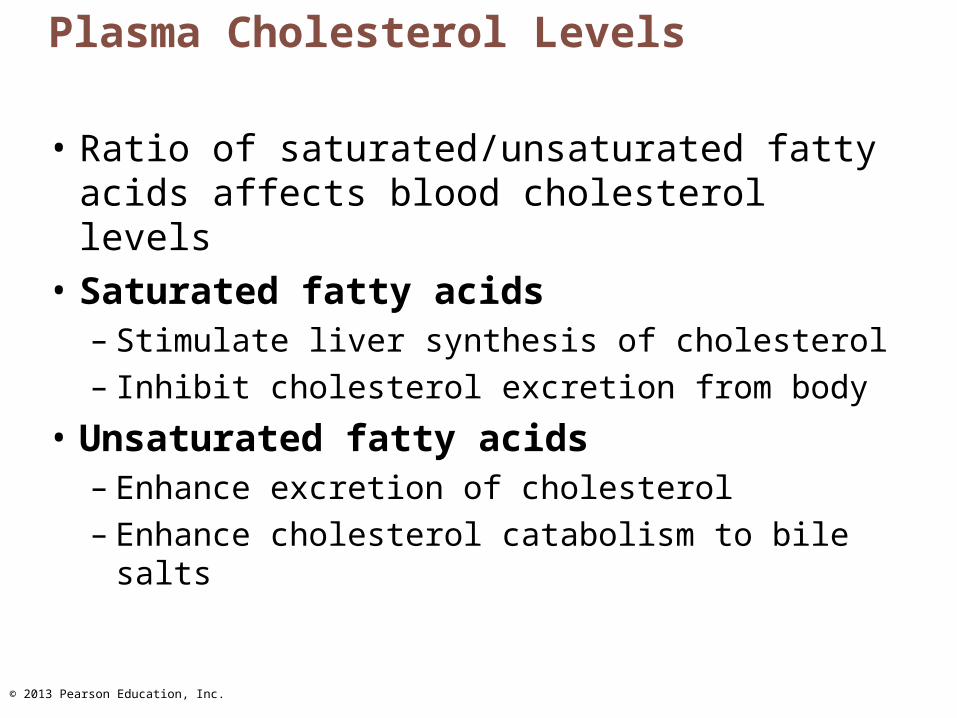
Plasma Cholesterol Levels
• Ratio of saturated/unsaturated fatty acids affects blood cholesterol levels
• Saturated fatty acids– Stimulate liver synthesis of cholesterol– Inhibit cholesterol excretion from body
• Unsaturated fatty acids– Enhance excretion of cholesterol– Enhance cholesterol catabolism to bile salts

© 2013 Pearson Education, Inc.
Plasma Cholesterol Levels
• Trans fats– Healthy oils forced to be solids
• E.g., margarine
– Worse effect on cholesterol levels than saturated fats
– Increase LDLs and reduce HDLs
© 2013 Pearson Education, Inc.
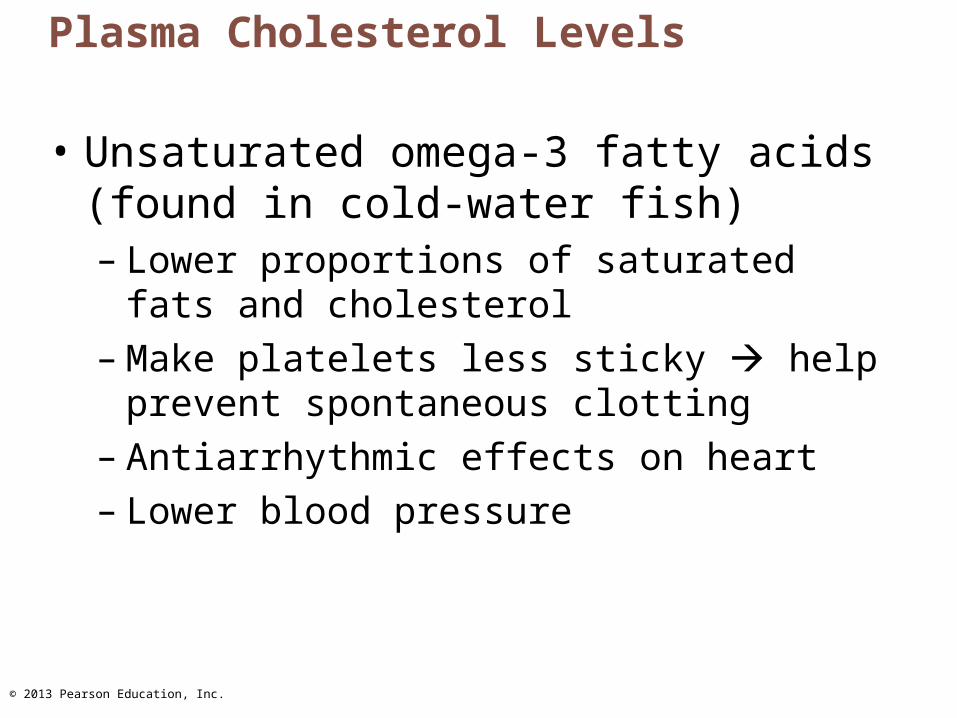
Plasma Cholesterol Levels
• Unsaturated omega-3 fatty acids (found in cold-water fish)– Lower proportions of saturated fats and
cholesterol– Make platelets less sticky help prevent
spontaneous clotting– Antiarrhythmic effects on heart– Lower blood pressure

© 2013 Pearson Education, Inc.
Non-Dietary Factors Affecting Cholesterol
• Stress and cigarette smoking lower HDL levels
• Aerobic exercise and estrogen increase HDL levels and decrease LDL levels
© 2013 Pearson Education, Inc.
Homeostatic Imbalance
• Statins– Cholesterol-lowering drugs– Estimated >10 million Americans take statins

© 2013 Pearson Education, Inc.
Energy Balance
• Bond energy released from food must equal total energy output
• Energy intake = energy liberated during food oxidation
• Energy output– Immediately lost as heat (~60%)– Used to do work (driven by ATP)– Stored as fat or glycogen
© 2013 Pearson Education, Inc.
Energy Balance
• Nearly all energy from food eventually converted to heat - cannot be used to do work
• Heat energy– Warms tissues and blood– Helps maintain homeostatic body temperature– Allows metabolic reactions to occur efficiently
• If energy intake = energy output – weight stable
• If not equal – gain or loss of weight

© 2013 Pearson Education, Inc.
Obesity
• Body mass index (BMI) = W / H2
(W in kg, H in m)
• Considered overweight if BMI 25 to 30
• Considered obese if BMI greater than 30– Higher incidence of atherosclerosis, type 2
diabetes mellitus, hypertension, heart disease, and osteoarthritis
• More adults and children overweight than 20 years ago
© 2013 Pearson Education, Inc.
Regulation of Food Intake
• Various nuclei of hypothalamus– Release peptides influence feeding behavior
• neuropeptide Y (NPY) enhances appetite • pro-opiomelanocortin (POMC) and
cocaine-/amphetamine-regulated transcript (CART) suppress appetite
© 2013 Pearson Education, Inc.
Regulation of Food Intake
• Feeding behavior and hunger regulated by– Neural signals from digestive tract– Bloodborne signals related to body energy stores– Hormones– To lesser extent, body temperature and psychological
factors
• Operate through brain thermoreceptors, chemoreceptors, and others
© 2013 Pearson Education, Inc.
Short-Term Regulation of Food Intake
• Neural signals from GI tract– High protein content of meal increases and
prolongs afferent vagal signals– Distension sends signals along vagus nerve
that suppress hunger center

© 2013 Pearson Education, Inc.
Short-Term Regulation of Food Intake
• Nutrient signals related to energy stores– Increased nutrient levels in blood depress
eating• Rising blood glucose• Elevated blood amino acid levels • Blood levels of fatty acids

© 2013 Pearson Education, Inc.
Short-Term Regulation of Food Intake
• Hormones– Gut hormones (e.g., insulin and CCK) depress
hunger– Glucagon and epinephrine stimulate hunger– Ghrelin (Ghr) from stomach stimulates
appetite; levels peak prior to mealtime
© 2013 Pearson Education, Inc.
Long-Term Regulation of Food Intake
• Leptin– Hormone secreted by fat cells in response to
increased body fat mass– Indicator of total energy stores in fat tissue– Protects against weight loss in times of
nutritional deprivation
© 2013 Pearson Education, Inc.
Long-Term Regulation of Food Intake
• Leptin– Acts on certain neurons in hypothalamus– Suppresses secretion of NPY which is a
potent appetite stimulant– Stimulates expression of appetite
suppressants (e.g., CART peptides)
© 2013 Pearson Education, Inc.
Leptin
• Rising leptin some weight loss; not "magic bullet" for obese patients
• High leptin levels in obese patients; resistant to its action
© 2013 Pearson Education, Inc.
Additional Factors in Regulation of Food Intake
• Temperature – cold activates hunger
• Stress – depends on individual
• Psychological factors
• Sleep deprivation
• Composition of gut bacteria
© 2013 Pearson Education, Inc.
Metabolic Rate and Heat Production
• Metabolic rate– Total heat produced by chemical reactions
and mechanical work of body– Can be measured
• Directly – calorimeter measures heat liberated into water chamber
• Indirectly – respirometer measures oxygen consumption (directly proportional to heat production)

© 2013 Pearson Education, Inc.
Basal Metabolic Rate
• Reflects energy body needs to perform its most essential activities
• Measured in postabsorptive state (npo 12 hours), reclining position, relaxed mentally and physically, room temperature 20-25C
• Recorded as kilocalories per square meter of body surface per hour (kcal/m2/h)– E.g., 70 kg adult BMR = 66 kcal/h
• Influenced by body surface area, age, gender, body temperature, stress, thyroxine
© 2013 Pearson Education, Inc.
Factors that Influence BMR
• BMR increases as ratio of body surface area to volume increases
• Decreases with age
• Males have disproportionately higher BMR
• Increases with temperature or stress
• Thyroxine increases oxygen consumption, cellular respiration, and BMR
• Physical training has little effect on BMR

© 2013 Pearson Education, Inc.
Metabolic Rate
• Total metabolic rate (TMR)– Rate of kilocalorie consumption to fuel all
ongoing activities– Increases with skeletal muscle activity and
food ingestion (food-induced thermogenesis)
• Greatest with protein and alcohol ingestion
© 2013 Pearson Education, Inc.
Regulation of Body Temperature
• Body temperature reflects balance between heat production and heat loss
• At rest, liver, heart, brain, kidneys, endocrine organs generate most heat
• During exercise, heat production from skeletal muscles increases dramatically

© 2013 Pearson Education, Inc.
Regulation of Body Temperature
• Normal body temperature = 37C 5C (98.6F)– Optimal enzyme activity at this temperature
• Increased temperature denatures proteins and depresses neurons– Children <5 convulsions at 41C(106F)– ~43C (109F) - limit for life
• Tissues tolerate low body temperatures
© 2013 Pearson Education, Inc.
Core and Shell Temperature
• Core (organs within skull, thoracic & abdominal cavities) has highest temperature– Rectal temperature best clinical indicator
• Core temperature regulated; fairly constant– Blood - major agent of heat exchange
between core and shell
• Shell (skin) – lowest temperature– Fluctuates between 20C – 40C

© 2013 Pearson Education, Inc.
Mechanisms of Heat Exchange
• Four mechanisms of heat transfer– Radiation - loss of heat by infrared rays– Conduction - transfer of heat by direct
contact– Convection - transfer of heat to surrounding
air– Evaporation - heat loss due to evaporation of
water from body surfaces• Heat absorbed by water during evaporation – heat
of vaporization

© 2013 Pearson Education, Inc.
Mechanisms of Heat Exchange
• Insensible heat loss accompanies insensible water loss from lungs, oral mucosa, and skin– Loss ~ 10% of basal heat production
• Sensible heat loss – when body temperature rises and sweating increases water vaporization

© 2013 Pearson Education, Inc.
Role of the Hypothalamus
• Hypothalamus receives afferent input from– Peripheral thermoreceptors in shell (skin) – Central thermoreceptors (some in
hypothalamus) in core
• Initiates appropriate heat-loss and heat-promoting activities

© 2013 Pearson Education, Inc.
Heat-Promoting Mechanisms
• Constriction of cutaneous blood vessels– Sympathetic nervous system stimulates
• Shivering – heat from skeletal muscle activity
• Increased metabolic rate via epinephrine and norepinephrine– Chemical (nonshivering) thermogenesis -
infants– Brown adipose tissue in adults
• Enhanced thyroxine release - infants

© 2013 Pearson Education, Inc.
Heat-Promoting Mechanisms
• Behavioral modifications (voluntary) measures include– Putting on more clothing– Drinking hot fluids– Changing posture (clasping arms across
chest)– Increasing physical activity (jumping up and
down)

© 2013 Pearson Education, Inc.
Heat-Loss Mechanisms
• Heat-promoting center inhibited
• Dilation of cutaneous blood vessels
• Enhanced sweating
• Voluntary measures include– Reducing activity and seeking a cooler
environment– Wearing light-colored, loose-fitting clothing
© 2013 Pearson Education, Inc.
Homeostatic Imbalance
• Hyperthermia– Elevated body temperature depresses
hypothalamus– Positive-feedback mechanism (heat stroke)
begins at core temperature of 41C increased temperatures
• Skin hot and dry; organs damaged
– Can be fatal if not corrected

© 2013 Pearson Education, Inc.
Homeostatic Imbalance
• Heat exhaustion– Heat-associated collapse after vigorous
exercise– Due to dehydration and low blood pressure– Heat-loss mechanisms still functional– May progress to heat stroke if not cooled and
rehydrated promptly
© 2013 Pearson Education, Inc.
Homeostatic Imbalance
• Hypothermia– Low body temperature from cold exposure
• Vital signs decrease
– Shivering stops at core temperature of 30 - 32C
– Can progress to coma and death by cardiac arrest at ~ 21C
© 2013 Pearson Education, Inc.
Fever
• Controlled hyperthermia
• Due to infection (also cancer, allergies, or CNS injuries)
• Macrophages release cytokines (also called pyrogens)– Cause release of prostaglandins from
hypothalamus

© 2013 Pearson Education, Inc.
Fever
• Prostaglandins reset hypothalamic thermostat higher heat-producing mechanisms – temperature
rises
• Natural body defenses or antibiotics reverse disease process– Cryogens (e.g., vasopressin) reset thermostat
to lower (normal) level heat-loss mechanisms temperature falls