CHAPTER 2.1 Introduction -...
15
Transcript of CHAPTER 2.1 Introduction -...

CHAPTER
Seeing the WorldLike a Geographer 2
<a
2.1 Introduction
In the late summer of 1854, a dreaded disease called cholera struck aneighborhood in London, England. People suddenly began sufferingcramps, vomiting, and terrible thirst. Many died within hours. In just10 days, the disease killed about 500 people. Wagons carried awaycorpses for mass burials.
No one knew how cholera spread or how to stop it. But one doctor,John Snow, had an idea. Snow convinced officials to remove the handlefrom a water pump on Broad Street so that no one could use the pump.Soon the cholera stopped spreading. Snow had guessed correctly that thedisease was spread through polluted drinking water.
By thinking like a geographer, John Snow solved the mystery of howcholera was spread. He had gone door to door to find out where peoplewere dying. Later, he showed his findings on a map of the neighborhood.On the map, Snow made a mark next to each house where people haddied from cholera. The map clearly showed that most of the deaths wereclustered around the Broad Street pump.
John Snow's map is an example of a thematic map. A thematic mappresents information related to only one theme or topic. In this chapter,you will learn how to identify and read different types of thematic maps.You will see how geographers use these tools to make sense of Earth'sphysical and human features.
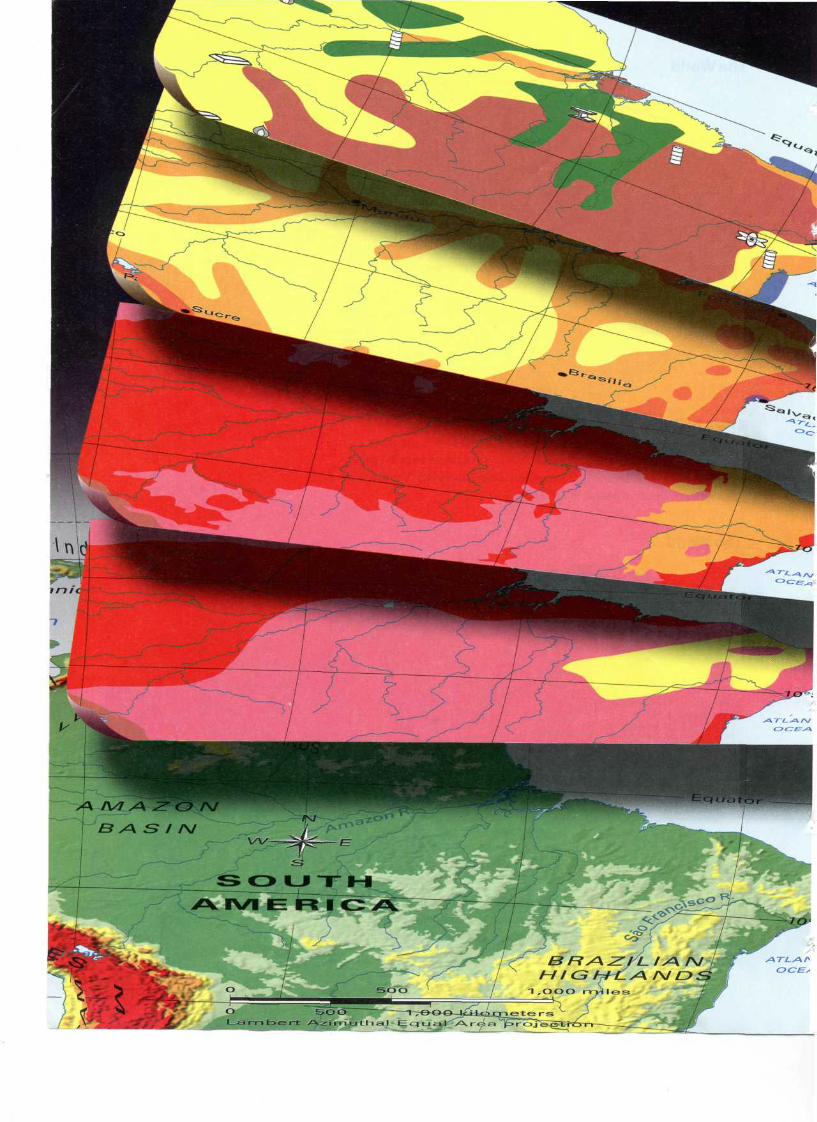
Thematic maps of South America25

The Steep Rock Walls ofCanyon de Chelly
Canyons are a landform found inArizona. Canyon de Chelly was oncehome to Anasazi Indians. They builttheir villages in the steep canyonwalls. You can find Canyon de Chellyon a physical features map of Arizona.
2.2 The Geographic Setting
Thematic maps are all around us. Tune in to a news program andyou're likely to see a weather map showing high and low tempera-tures. To find your way on the local bus system, you might use a mapof bus routes. These maps focus on a specific topic, or theme. Theyshow information about some aspect of physical or human geography.
Thematic Maps Can Show Physical Geography Some thematicmaps focus on physical features. Physical features are natural partsof Earth's surface. They include landforms like mountains, plains, andplateaus. They also include bodies of water. A physical features mapof Earth will show oceans, seas, bays, rivers, and lakes.
Thematic maps can show other aspects of the physical environment.For example, some maps focus on climate, or long-term patterns ofweather. Climate maps show how much rainfall various areas receive.They also show how hot or cold places tend to be in winter and summer.
Climate has a big effect on the types of vegetation, or trees andother plants, that will grow in an area. You can see this by comparinga climate map of the Earth with a vegetation map. A vegetation mapshows the kinds of trees and other plants that grow in various places.In many ways it looks like a climate map, although other factors alsoaffect what will grow where.
Thematic Maps Can Show Human Geography Thematicmaps can also focus on human geography. John Snow's map ofthe cholera deaths near the Broad Street pump is a good example.Another example is a political map. The map on the next page showsthe borders of the 50 U.S. states. It also shows the borders betweencountries. In addition to borders, political maps also show importantcities, such as the capitals of states and countries.
Another type of thematic map shows population density. Thisis the number of people per unit of area, such as a square mile. Thehigher the number, the more crowded an area is. A population densitymap reveals where large numbers of people cluster.
Besides showing where people live, a thematic map can show whatthey do. A map of economic activity focuses on the ways peopleproduce, buy, and sell goods and services. This kind of map mightshow the main types of business and industry in an area. It might alsoshow the natural resources that fuel the area's economy. Naturalresources are useful items found in nature, such as wood, coal, and oil.
A Map's Title and Legend State Its Theme To read a thematicmap, first look at its title. The title states the topic of the map. Thenlook at the map legend. It tells you how to read the map's symbols.On the U.S. political map, the legend shows the symbols for thenational and state capitals. A map legend may also explain how themap uses colors. For instance, a thematic map might use colors toshow differences in elevation or population density.
26 Chapter 2

^ Geoterms
climate the pattern of weather over a long period of time
economic activity any action that relates to the making,buying, and selling of goods and services
landform any natural feature of Earth's surface that has adistinct shape. Landforms include major features such ascontinents, plains, plateaus, and mountain ranges.Theyalso include minor features such as hills, valleys, canyons,and dunes.
physical feature any natural characteristic of Earth's surface,such as landforms and bodies of water
population density the average number of people who livein a unit of area, such as a square mile. Population densitymeasures how crowded an area is.
region an area defined by one or more natural or culturalcharacteristics that set it apart from other areas
thematic map a map that shows a particular theme, or topic
vegetation all the plants and trees in an area
Political Maps
Political maps are one type of thematicmap. These maps help us see wherecountries, states, and important citiesare located. On this map of the UnitedStates, you can see the borders ofyour state. A star marks the state'scapital. A star with a circle around itshows the nation's capital.
120°W 110°W 100°W,
Political Boundaries of the United States
Seeing the World Like a Geographer 27

Landforms and Water Bodies
You will see both landforms andbodies of water labeled on maps.This diagram shows many of thesephysical features.
2.3 Mapping Earth's Physical Features
In the winter, snowboarders look for a snowy mountain to practicetheir sport on. In the summer, vacationers often cool off by a lake orriver. These are just three of the landforms and bodies of water thatyou might see on a physical features map.
Common Landforms Geographers have given names to the manylandforms found on Earth. Some landforms have distinctive shapeswhen viewed from above. A long, narrow peninsula, for example,juts out from a continent into water. Other landforms, like mountains,have distinct shapes when viewed from the ground.
Physical features maps show the shapes of features as seenfrom above. They also show the elevation, or height above sea level,of various features. Usually physical features maps use colors andshading to show changes in elevation.
Bodies of Water Geographers also label bodies of water on physicalfeatures maps. Many kinds of water bodies appear on the continents.For example, rivers flow down from mountains and make their wayto the sea. Lakes are entirely surrounded by land. Other water bodiesare created where oceans and seas meet the continents. A bay is partlyenclosed by a wide, curving stretch of land. A strait is a narrow chan-nel that connects two larger bodies of water.
28 Chapter 2

Physical Features of India
0 250 500 kilometersLambert Azimuthal Equal-Area projection
Chota NagpurPlateau
Bay ofBengal
Deccan
PI a te a u
Elevation
Feet MetersOver 10,000 H Over 3,050
5,001-10,000 LJ 1,526-3,0502,001-5,000 Li 611-1,5251,001-2,000 rn 306-610
0-1,000 M 0-305Below sea level HI Below sea level
Physical Features Maps
This map shows major physicalfeatures in India. The Himalayasare India's highest physical feature.Two long rivers, the Ganges andthe Brahmaputra, flow out of theHimalayas. They form one of theworld's largest river deltas wherethey meet the Bay of Bengal.
Seeing the World Like a Geographer 29

World Climate Zones
Climagraphs for the 12 climatezones found around the worldare shown below.
2.4 Hot, Cold, Wet, Dry: Earth's Climates
Do you check a weather report each morning to see what the day willbe like? Are most days sunny? Or does it rain a lot where you live?Such long-term patterns in weather are called climate.
Climate Zones To study climates, geographers divide Earth intoclimate zones. Each zone has a particular pattern of temperature andprecipitation—rain, snow, or other moisture. This pattern is oftenshown on a climagraph, like those you see below.
A climagraph shows the average temperature and precipitation ina place over a year. The letters along the bottom of the graph stand forthe months of the year. The curved line indicates the average monthlytemperatures. The bars show the average monthly precipitation.
Location Affects Climate Many factors affect a place's climate.One of the most important is latitude. Places in tropical latitudes,close to the equator, get the most direct rays from the sun all year.These areas have hot weather year-round. Places at high latitudes,close to the North and South poles, receive much less sunlight. As aresult, they are very cold.
Another factor affecting climate is elevation, or altitude. Places athigh elevations have colder climates than those lower down. You'lllearn more about the factors that affect climate throughout this book.
30 Chapter 2
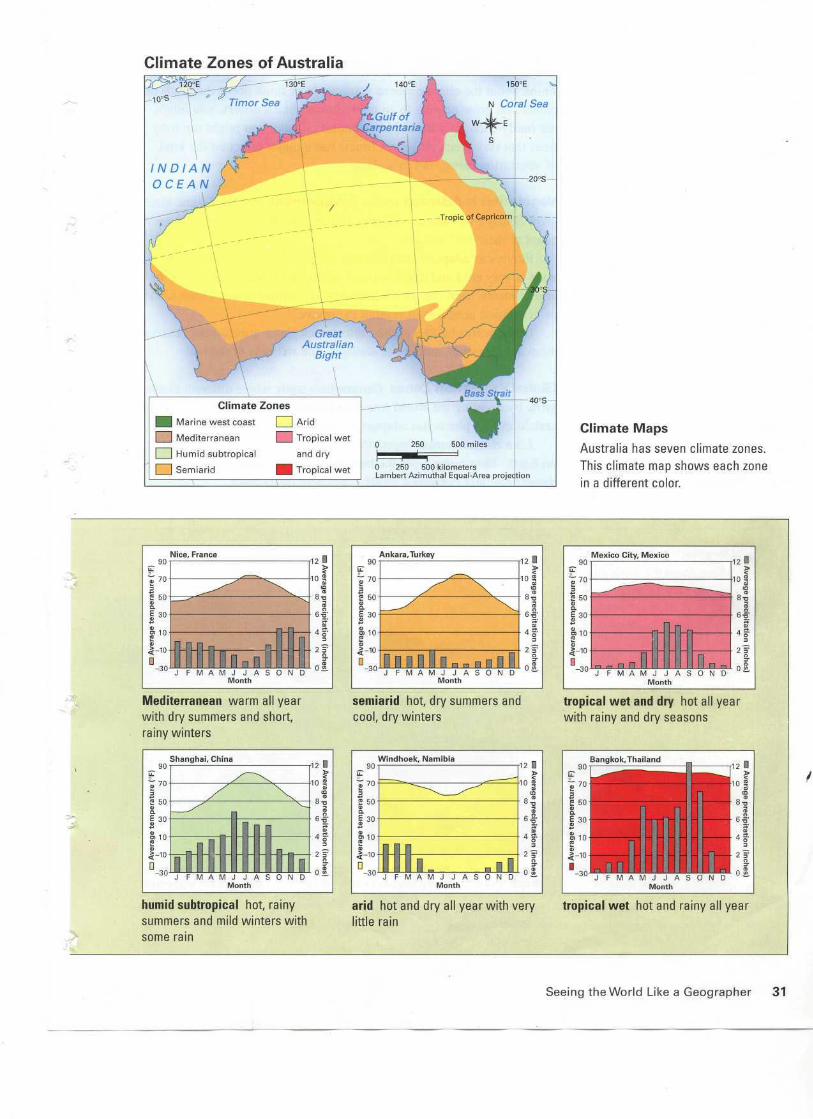
Climate Zones of Australia
_ Tropic of Capricorn L \- -
Climate Maps
Australia has seven climate zones.This climate map shows each zonein a different color.
Seeing the World Like a Geographer 31
2.5 Trees and Other Plants: Earth's Vegetation
Think about the climate where you live. Now think about the kinds ofplants that grow nearby. In an arid climate, like a desert, you mightsee hardy cacti. In a humid continental climate, you might see loftytrees that stay green all year. Climate has a major effect on the kindof vegetation that grows in a place.
Vegetation is Adapted to Its Environment Plants of some kindgrow nearly everywhere on Earth. But in order to survive, plants mustadapt to their environment.
Plants can adapt to even extreme environments. A tundra climatezone is very cold and dry. Yet small plants and bushes grow there. Inarid climates, cacti can go for long periods without water. Other kindsof vegetation need lots of rainfall to survive.
Other factors besides climate affect what plants grow where. Amongthem are elevation, amount of sunlight, and richness of the soil.
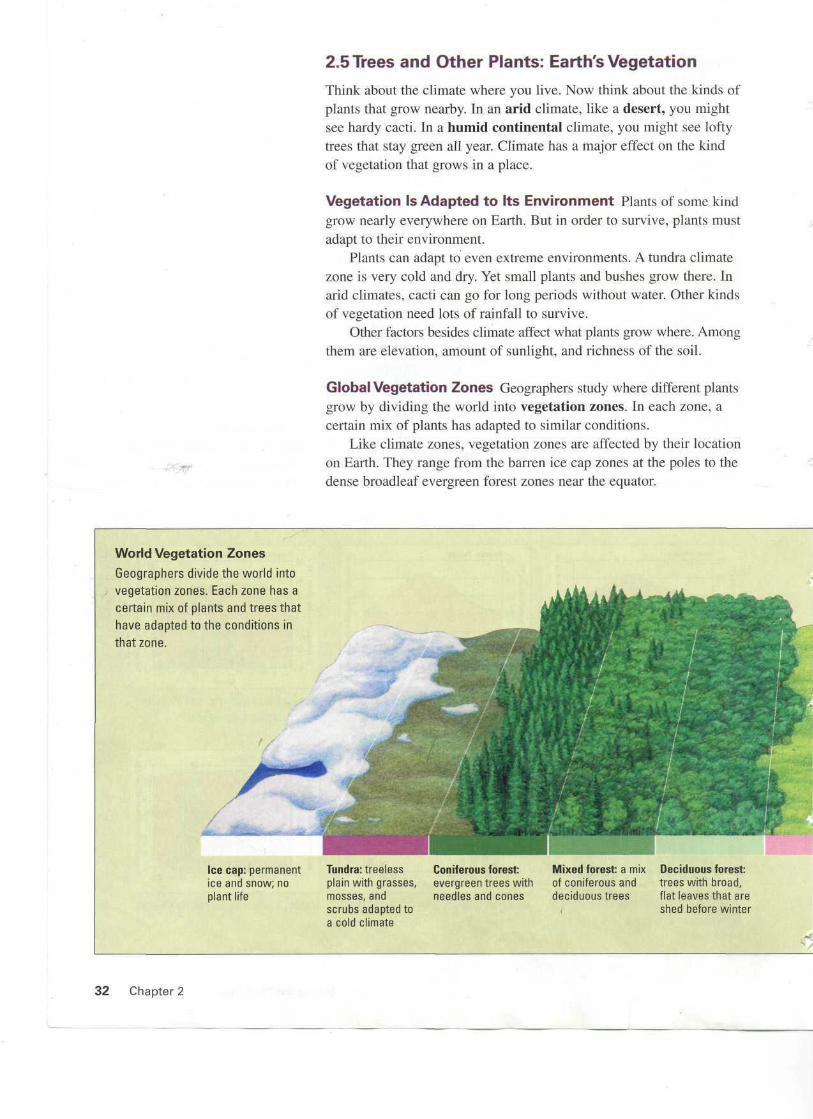
Global Vegetation Zones Geographers study where different plantsgrow by dividing the world into vegetation zones. In each zone, acertain mix of plants has adapted to similar conditions.
Like climate zones, vegetation zones are affected by their locationon Earth. They range from the barren ice cap zones at the poles to thedense broadleaf evergreen forest zones near the equator.
World Vegetation Zones
Geographers divide the world into
vegetation zones. Each zone has a
certain mix of plants and trees that
have adapted to the conditions in
that zone.
Ice cap: permanentice and snow; noplant life
Tundra: treelessplain with grasses,mosses, andscrubs adapted toa cold climate
Coniferous forest:evergreen trees withneedles and cones
Mixed forest: a mixof coniferous anddeciduous trees
Deciduous forest:trees with broad,flat leaves that areshed before winter
32 Chapter 2

Vegetation Zones of North Africa
Vegetation Maps
This map shows the vegetation zones
found in North Africa. Chaparral thrives
beside the Mediterranean Sea. Desert
and desert scrub are found in the dry
Sahara. A narrow band of broadleaf
evergreen forest appears in the
northeast corner of North Africa.
What do you think allows tropical
trees to survive in such an arid region?
Temperate grass- Chaparral: small trees Desert scrub: small Desert: arid regionland: short and tall and bushes adapted trees, bushes, and with few plantsgrasses adapted to to a Mediterranean other plants adapt-cool climates climate ed to a dry climate
Highlands: variesby elevation
Tropical grassland: Broadleaf evergreengrasses and scat- forest: tall trees withtered trees adapted Iar9e leaves thatto a tropical wet remain S^en all yearand dry climate
_
Seeing the World Like a Geographer 33
2.6 Where People Live: Population Density
In 2000, about 8 million people lived in New York City. They werejammed into an area of about 300 square miles. Compare this withthe town of Skwentna, Alaska. There, 111 people were spread outover about 450 square miles. When it comes to crowding, these twoplaces are about as different as they can be. Geographers show thesekinds of differences using population density maps.
Population Density Measures Crowding Population densitytells us how crowded a place is. To calculate the density of a place,divide the number of people there by its land area. The higher theresult, the more crowded the place is. In 2000, New York City hada population density of about 26,000 people per square mile. Incontrast, Skwentna had less than 1 person per square mile.
Population density affects how people live. In Skwentna, housesare spread out. There are no roads. People use airplanes, boats, orsnowmobiles to get to the local store and the post office. Skwentna'sversion of rush hour comes in February, when dogsled racers speedthrough town.
In New York City, people live packed in high-rise apartments.They may have hundreds of neighbors just in their own building.Every day millions of "straphangers" hold on tight as they jostle eachother in the city's crowded subways.
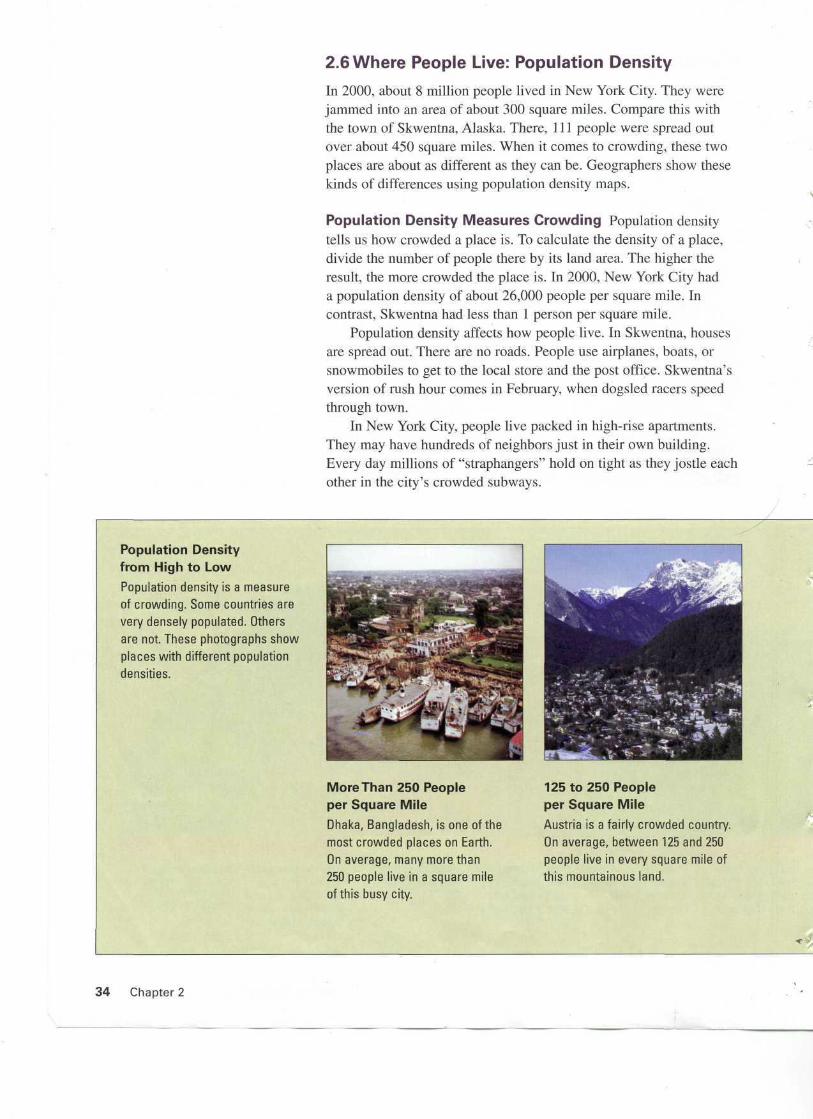
Population Densityfrom High to Low
Population density is a measureof crowding. Some countries arevery densely populated. Othersare not. These photographs showplaces with different populationdensities.
More Than 250 Peopleper Square Mile
Dhaka, Bangladesh, is one of themost crowded places on Earth.On average, many more than250 people live in a square mileof this busy city.
125 to 250 Peopleper Square Mile
Austria is a fairly crowded country.On average, between 125 and 250people live in every square mile ofthis mountainous land.
34 Chapter 2
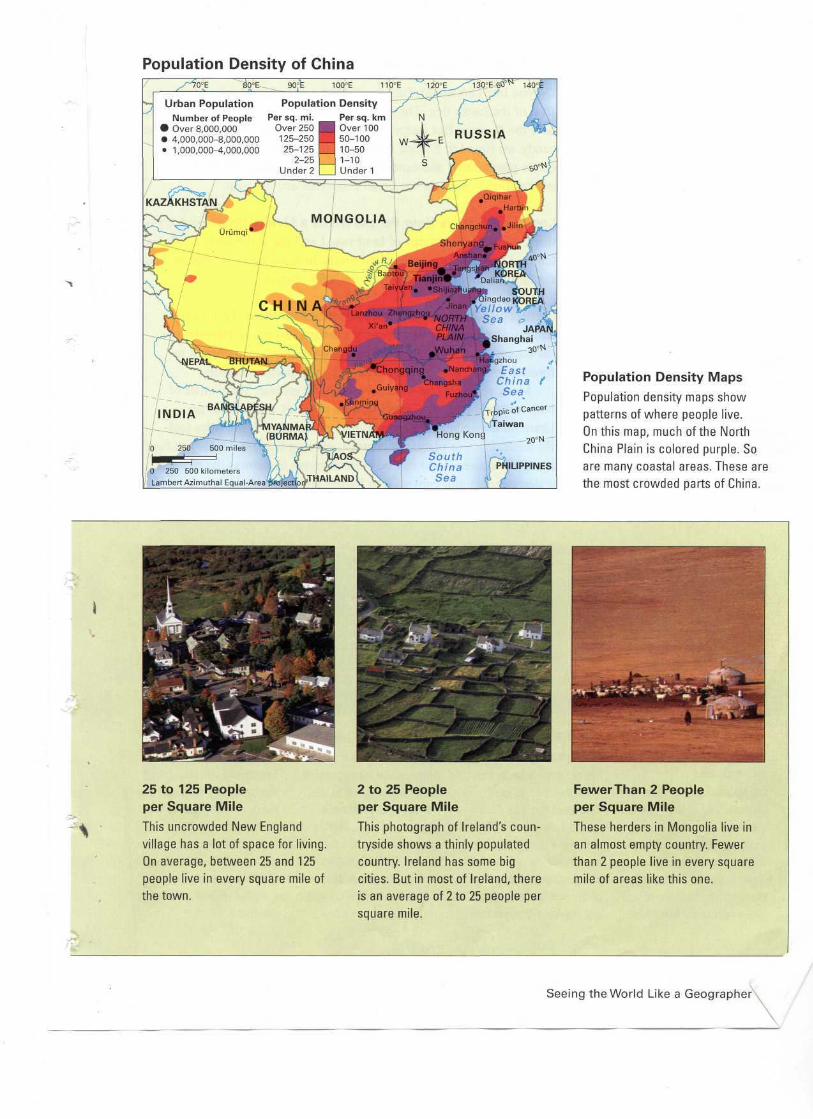
Population Density of China
_,x °̂:E 90°E 100°E 110°E ^"120°E^130°E 60°̂ 140°E
Urban Population Population DensityNumber of People Per sq. mi.
• Over 8,000,000 Over 250 I• 4,000,000-8,000,000 125-250 I• 1,000,000-4,000,000 25-125 I
2-25 IUnder 2 I
Per sq. kmI Over 100I 50-1001 10-50I 1-101 Under!
Population Density Maps
Population density maps show
patterns of where people live.
On this map, much of the North
China Plain is colored purple. So
are many coastal areas. These are
the most crowded parts of China.
—
1~-4
25 to 125 Peopleper Square Mile
This uncrowded New England
village has a lot of space for living.
On average, between 25 and 125
people live in every square mile of
the town.
2 to 25 Peopleper Square Mile
This photograph of Ireland's coun-
tryside shows a thinly populated
country. Ireland has some big
cities. But in most of Ireland, there
is an average of 2 to 25 people per
square mile.
Fewer Than 2 Peopleper Square Mile
These herders in Mongolia live in
an almost empty country. Fewer
than 2 people live in every square
mile of areas like this one.
Seeing the World Like a Geographer

Economic Activity of Europe
Economic Activity Maps
The colors on this map show landuse patterns in Europe. The mostwidespread land use is commercialfarming. The symbols show thelocations of important resourcesin Europe. Where is petroleum, oroil, found in Europe?
~-
Livestock Raisingin Australia
Cattle, sheep, and goatsare raised on hugeranches. More thanhalf of the farmland inAustralia is used forraising sheep and cows.Australian livestockraisers lead the world inproduction of wool forclothing and carpets.
Commercial Fishingin Asia
Many people make theirliving by fishing the world'soceans, lakes, and rivers.The Pacific Ocean yieldsmore than half the worldsupply of fish. In 2000,35 million people workedin the fishing industry.More than 80 percentwere in Asia.
Forestry in theUnited States
Forestry uses trees asa resource for makinghomes, furniture, andpaper. In 2003, the UnitedStates was the leadingsupplier of wood in theworld. The United Statesalso used up more forestresources than any othercountry.
Trade andManufacturingin Ireland
Manufacturing turnsresources into goods tosell. In this Irish factory,workers assemble com-puters for shipmentaround the world.
Seeing the World Like a Geographer 37

Transportation Region Maps
A region is an area with one or morefeatures that set it apart from otherareas. A feature might be something
physical like climate. Or it might be ahuman feature such as roads and trainlines. The network of routes on this map
defines a transportation region in the
San Francisco Bay Area.
2.8 Organizing Earth's Surface: Regions
As you have learned, geographers use many kinds of maps to makesense of the world. Some of these maps focus on physical geography.Others focus on human geography. All of them reveal interestingpatterns to explore.
Geographers use these patterns to organize the Earth's surfaceinto regions. A region is an area with one or more features that setit apart from other areas. As you'll see, the concept of region allowsgeographers to divide the world in useful ways.
Unique Features Define a Region Think about the communityyou live in. Does it have a business district? A shopping mall? Anindustrial park? A civic center? A residential neighborhood? Each ofthese areas has features that set it apart from other areas. You mightthink of one as a business region, another as a shopping region, andstill another as a housing region. Each region looks different. Eachhas a different purpose. Each has different needs.
38 Chapter 2
San Francisco Bay Area Rapid Transit (BART)
Geographers define regions in several ways. The Sunbelt is aregion defined by physical features. It is a region made up of statesin the southern part of the United States. What sets the Sunbelt apartfrom other regions is its warm, sunny climate. The Corn Belt is aregion defined by human features. It is made up of states in the centerof the country where raising corn is an important economic activity.
•
-
• —
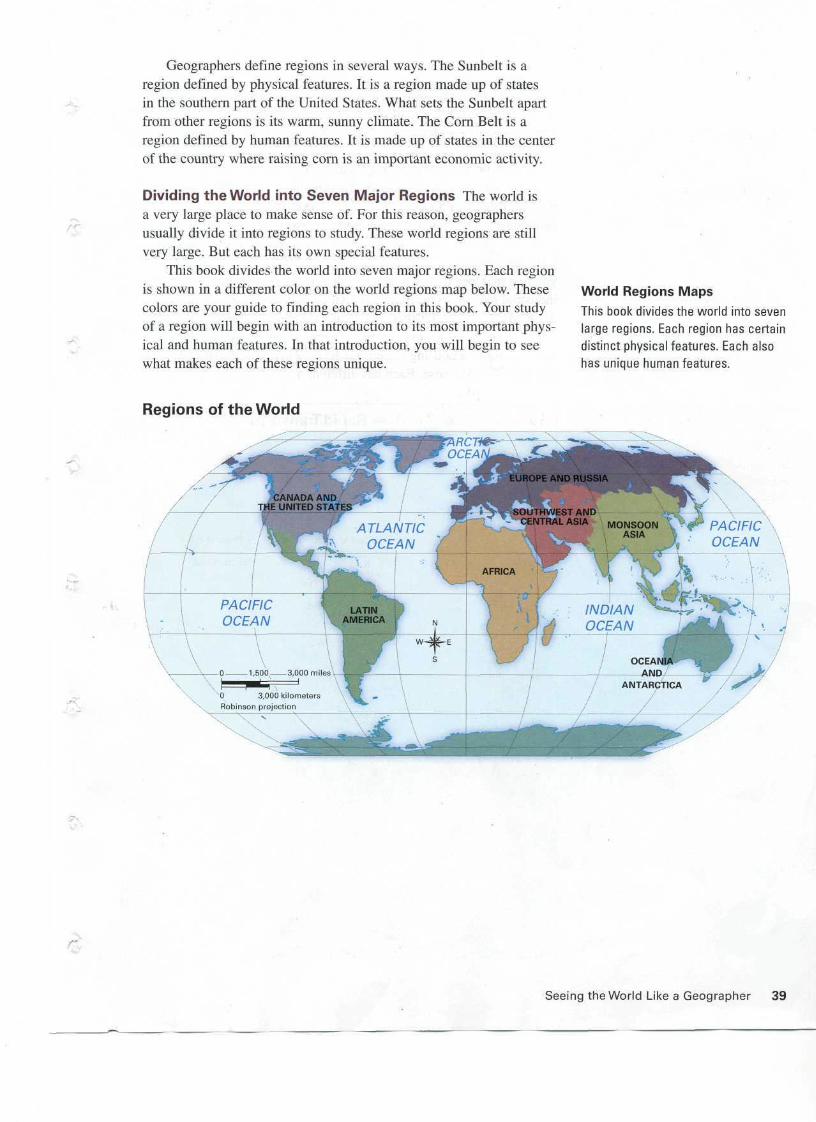
Dividing the World into Seven Major Regions The world isa very large place to make sense of. For this reason, geographersusually divide it into regions to study. These world regions are stillvery large. But each has its own special features.
This book divides the world into seven major regions. Each regionis shown in a different color on the world regions map below. Thesecolors are your guide to finding each region in this book. Your studyof a region will begin with an introduction to its most important phys-ical and human features. In that introduction, you will begin to seewhat makes each of these regions unique.
Regions of the World
World Regions Maps
This book divides the world into sevenlarge regions. Each region has certaindistinct physical features. Each alsohas unique human features.
0 3,000 kilometersRobinson projection
Seeing the World Like a Geographer 39