CHAPTER 2: OVERVIEW OF THE OPERATIONS...
23
2-1 CHAPTER 2: OVERVIEW OF THE OPERATIONS RESEARCH MODELING APPROACH 2.1-1. (a) The rise of electronic brokerage firms in the late 90s was a threat against full-service financial service firms like Merrill Lynch. Electronic trading offered very low costs, which were hard to compete with for full-service firms. With banks, discount brokers and electronic trading firms involved, the competition was fierce. Merrill Lynch needed an urgent response to these changes in order to survive. (b) "The group's mission is to aid strategic decision making in complex business situations through quantitative modeling and analysis" [p.8]. (c) The data obtained for each client consisted of "data for six categories of revenue, four categories of account type, nine asset allocation categories, along with data on number of trades, mutual fund exchanges and redemptions, sales of zero coupon bonds, and purchases of new issues" [p. 10]. (d) As a result of this study, two main pricing options, viz., an asset-based pricing option and a direct online pricing option were offered to the clients. The first targeted the clients who want advice from a financial advisor. The clients who would choose this option would be charged at a fixed rate of the value of their assets and would not pay for each trade. The latter pricing option was for the clients who want to invest online and who do not want advice. These self-directed investors would be charged for every trade. (e) "The benefits were significant and fell into four areas: seizing the marketplace initiative, finding the pricing sweet spot, improving financial performance, and adopting the approach in other strategic initiatives" [p.15]. 2.1-2. (a) This study arose from GM's efforts to survive the competition of the late 80s. Various factors, including the rise of foreign imports, the increase in customer expectations and the pricing constraints, forced GM to close plants and to incur large financial losses. While trying to copy Japanese production methods directly, GM was suffering from "missing production targets, working unscheduled overtime, experiencing high scrap costs, and executing throughput-improvement initiatives with disappointing results" [p. 7]. The real problems were not understood and the company was continuously losing money while the managers kept disagreeing about solutions. (b) The goal of this study was "to improve the throughput performance of existing and new manufacturing systems through coordinated efforts in three areas: modeling and algorithms, data collection, and throughput-improvement processes" [p. 7]. (c) The data collection was automated by using programmable logic controllers (PLCs). The software kept track of the production events including "machine faults and blocking and starving events" [p. 13] and recorded their duration. The summary of this data was then transferred to a centralized database, which converted this to workstation- performance characteristics and used in validating the models, determining the bottleneck processes and enhancing throughput. (d) The improved production throughput resulted in more than $2.1 billion in documented savings and increased revenue.
Transcript of CHAPTER 2: OVERVIEW OF THE OPERATIONS...
2-1
CHAPTER 2: OVERVIEW OF THE OPERATIONS RESEARCHMODELING APPROACH
2.1-1.
(a) The rise of electronic brokerage firms in the late 90s was a threat against full-servicefinancial service firms like Merrill Lynch. Electronic trading offered very low costs,which were hard to compete with for full-service firms. With banks, discount brokers andelectronic trading firms involved, the competition was fierce. Merrill Lynch needed anurgent response to these changes in order to survive.
(b) "The group's mission is to aid strategic decision making in complex businesssituations through quantitative modeling and analysis" [p.8].
(c) The data obtained for each client consisted of "data for six categories of revenue, fourcategories of account type, nine asset allocation categories, along with data on number oftrades, mutual fund exchanges and redemptions, sales of zero coupon bonds, andpurchases of new issues" [p. 10].
(d) As a result of this study, two main pricing options, viz., an asset-based pricing optionand a direct online pricing option were offered to the clients. The first targeted the clientswho want advice from a financial advisor. The clients who would choose this optionwould be charged at a fixed rate of the value of their assets and would not pay for eachtrade. The latter pricing option was for the clients who want to invest online and who donot want advice. These self-directed investors would be charged for every trade.
(e) "The benefits were significant and fell into four areas: seizing the marketplaceinitiative, finding the pricing sweet spot, improving financial performance, and adoptingthe approach in other strategic initiatives" [p.15].
2.1-2.
(a) This study arose from GM's efforts to survive the competition of the late 80s. Variousfactors, including the rise of foreign imports, the increase in customer expectations andthe pricing constraints, forced GM to close plants and to incur large financial losses.While trying to copy Japanese production methods directly, GM was suffering from"missing production targets, working unscheduled overtime, experiencing high scrapcosts, and executing throughput-improvement initiatives with disappointing results" [p.7]. The real problems were not understood and the company was continuously losingmoney while the managers kept disagreeing about solutions.
(b) The goal of this study was "to improve the throughput performance of existing andnew manufacturing systems through coordinated efforts in three areas: modeling andalgorithms, data collection, and throughput-improvement processes" [p. 7].
(c) The data collection was automated by using programmable logic controllers (PLCs).The software kept track of the production events including "machine faults and blockingand starving events" [p. 13] and recorded their duration. The summary of this data wasthen transferred to a centralized database, which converted this to workstation-performance characteristics and used in validating the models, determining the bottleneckprocesses and enhancing throughput.
(d) The improved production throughput resulted in more than $2.1 billion indocumented savings and increased revenue.
2-2
2.1-3.

2-3
2.1-4.
2-4
2.2-1.
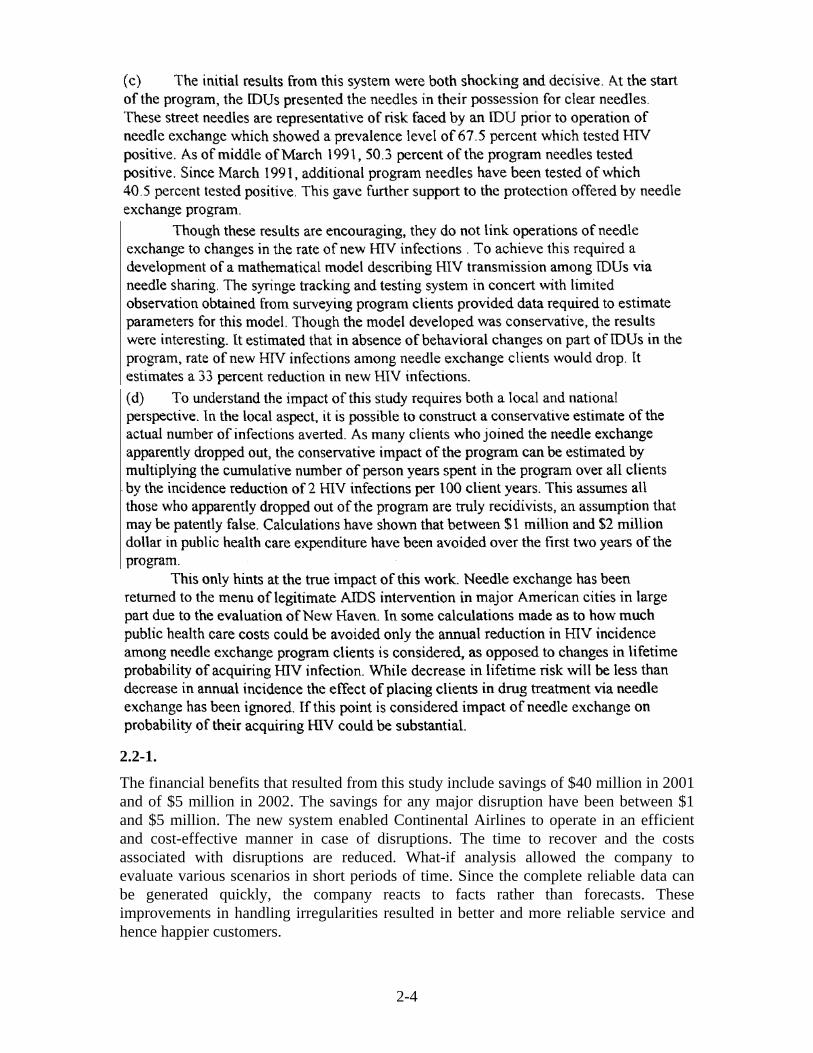
The financial benefits that resulted from this study include savings of $40 million in 2001and of $5 million in 2002. The savings for any major disruption have been between $1and $5 million. The new system enabled Continental Airlines to operate in an efficientand cost-effective manner in case of disruptions. The time to recover and the costsassociated with disruptions are reduced. What-if analysis allowed the company toevaluate various scenarios in short periods of time. Since the complete reliable data canbe generated quickly, the company reacts to facts rather than forecasts. Theseimprovements in handling irregularities resulted in better and more reliable service andhence happier customers.
2-5
2.2-2.
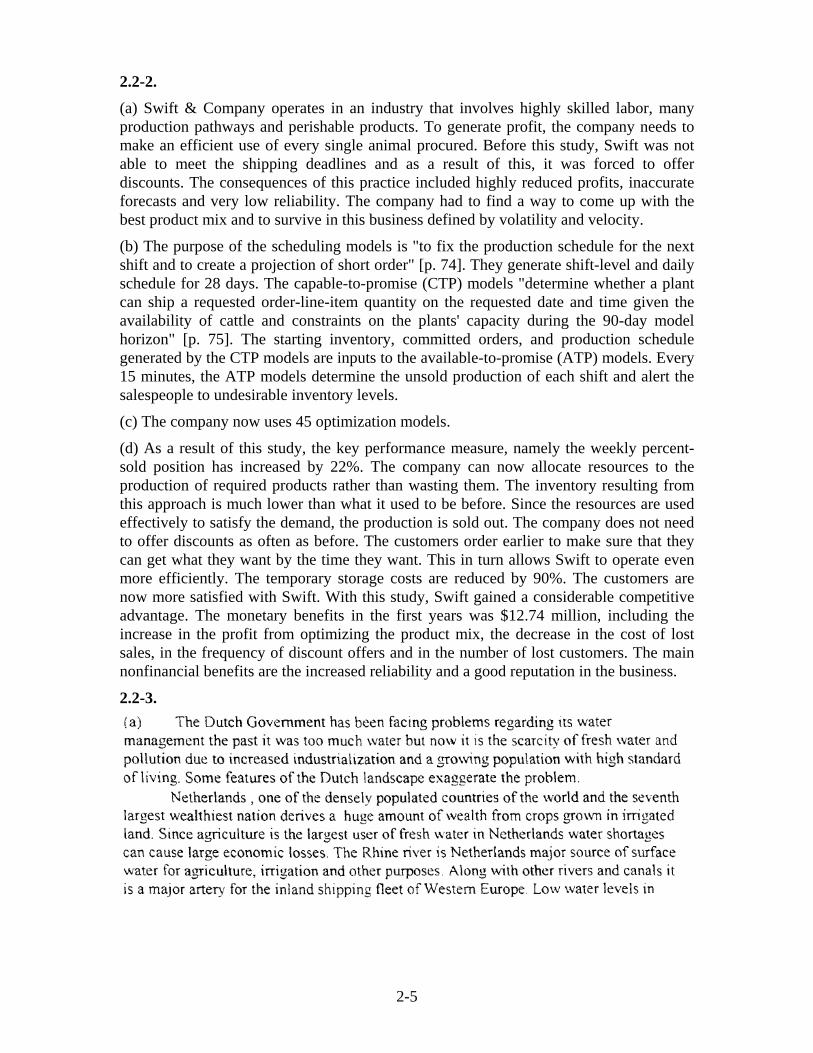
(a) Swift & Company operates in an industry that involves highly skilled labor, manyproduction pathways and perishable products. To generate profit, the company needs tomake an efficient use of every single animal procured. Before this study, Swift was notable to meet the shipping deadlines and as a result of this, it was forced to offerdiscounts. The consequences of this practice included highly reduced profits, inaccurateforecasts and very low reliability. The company had to find a way to come up with thebest product mix and to survive in this business defined by volatility and velocity.
(b) The purpose of the scheduling models is "to fix the production schedule for the nextshift and to create a projection of short order" [p. 74]. They generate shift-level and dailyschedule for 28 days. The capable-to-promise (CTP) models "determine whether a plantcan ship a requested order-line-item quantity on the requested date and time given theavailability of cattle and constraints on the plants' capacity during the 90-day modelhorizon" [p. 75]. The starting inventory, committed orders, and production schedulegenerated by the CTP models are inputs to the available-to-promise (ATP) models. Every15 minutes, the ATP models determine the unsold production of each shift and alert thesalespeople to undesirable inventory levels.
(c) The company now uses 45 optimization models.
(d) As a result of this study, the key performance measure, namely the weekly percent-sold position has increased by 22%. The company can now allocate resources to theproduction of required products rather than wasting them. The inventory resulting fromthis approach is much lower than what it used to be before. Since the resources are usedeffectively to satisfy the demand, the production is sold out. The company does not needto offer discounts as often as before. The customers order earlier to make sure that theycan get what they want by the time they want. This in turn allows Swift to operate evenmore efficiently. The temporary storage costs are reduced by 90%. The customers arenow more satisfied with Swift. With this study, Swift gained a considerable competitiveadvantage. The monetary benefits in the first years was $12.74 million, including theincrease in the profit from optimizing the product mix, the decrease in the cost of lostsales, in the frequency of discount offers and in the number of lost customers. The mainnonfinancial benefits are the increased reliability and a good reputation in the business.
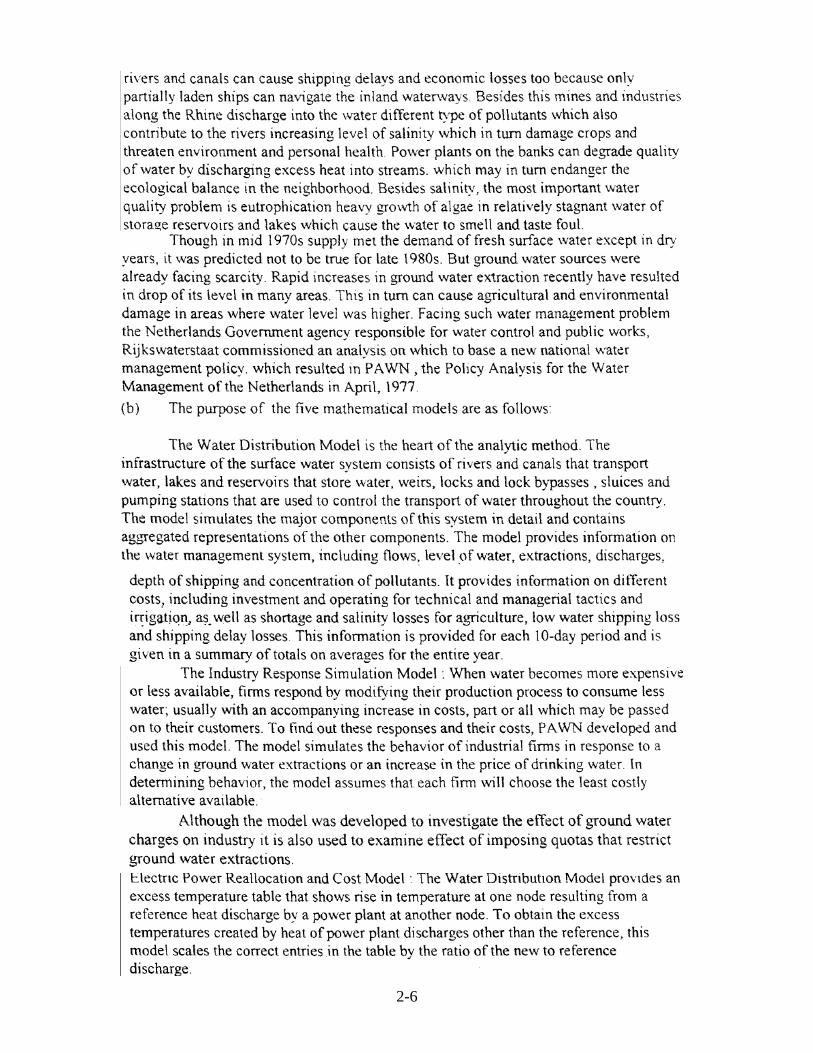
2.2-3.
2-6

2-7
2-8
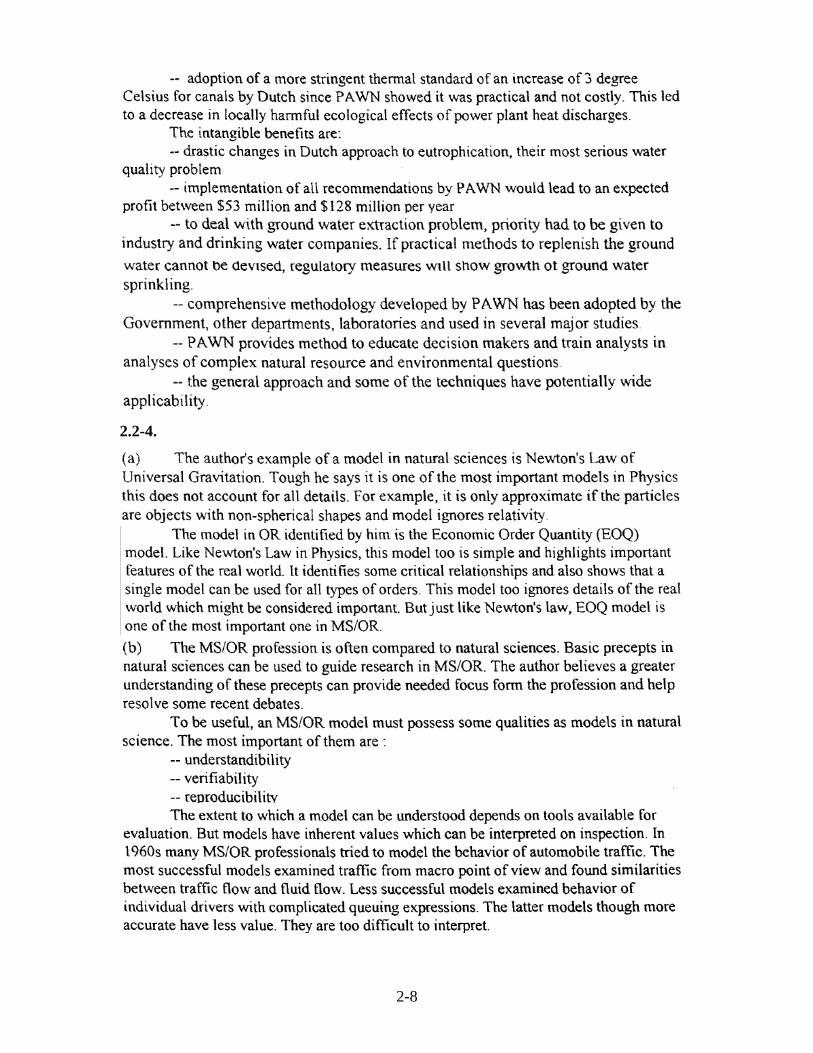
2.2-4.

2-9
2.3-1.
(a) Towards the end of 90s, Philips Electronics faced challenges in coordinating itssupply chains. Decentralized short-term planning was no longer very reliable. The spreadof the information to various branches of the global supply chains was taking a lot oftime and the information was distorted while it was being transferred. To deal with theuncertainty, the companies had to keep high inventory levels.
(b) The ultimate purpose of this study was "to improve competitiveness by improvingcustomer service, increasing sales and margins, and reducing obsolescence andinventories" [p. 38]. To achieve this, the project team aimed at designing a collaborative-planning (CP) process that would improve trust and collaboration between partners andaccelerate decision making.
(c) "The algorithm can generate feasible plans within seconds. In fact, the calculation ofthe plan is hardly noticeable to the people participating in the weekly CP meeting. Thespeed of the algorithm also allows planners to compute multiple plans during themeeting, creating an interactive planning environment. The software environment alsoprovides strong problem-solving support, used extensively during the CP meetings. Onesuch capability is called backward pegging. It exploits the one-to-one relationshipbetween the storage of an end item in some future period and a constraining stock onhand or scheduled receipt of one or more upstream items. Thus, the backward-peggingmechanism makes the actual material bottlenecks in the network visible" [p. 41-42].
(d) The four steps of the collaborative-planning process are gathering data, deciding,escalating and deploying.
(e) This study allowed the companies to solve complex problems quickly, to exploitprofitable opportunities and to enhance trust within the supply chain. The information isnow conveyed to other parties in a shorter time and more accurately. As a result of this,the companies can have accurate information about the availability of material atdifferent stages. This results in the reduction of inventory and obsolescence as well as theability to respond promptly to the changes in market conditions. The benefit fromdecreasing inventory and obsolescence is around $5 million per year in total.Nonfinancial benefits include enhanced flexibility and reliability throughout the chain.
2-10
Pelin G Canbolat
Typewritten Text
2.3-2.

2-11
2-12
2-13
2-14
2-15

2-16
2-17
2-18

2-19
2-20
2-21
2-22
2-23
Pelin G Canbolat
Typewritten Text
2.7-1. Answers will vary. 2.7-2. Answers will vary. 2.7-3. Answers will vary.