
Chapter 2 Materials and methods - Shodhganga : a...
47
Chapter 2 Materials and methods
Transcript of Chapter 2 Materials and methods - Shodhganga : a...

Chapter 2
Materials and methods

TABLE OF CONTENTS
2.1. MATERIALS
2.1.1. Test compounds
2.1.2. Animals
2.1.3. Cell lines
2.1.4. Chemicals
2.1.5. Reagent kits
2.1.6. Tissue culture wares
2.1.7. Instruments
2.1.8. Reagents
2.1.9. Stains
2.1.10. Radioactive materials
2.2. METHODS
2.2.1. Tissue culture
2.2.2. Hematological parameters
2.2.3. Immunological parameters
2.2.4. Antiangiogenic studies
2.2.5. Antimetastatic studies
2.2.6. In vitro apoptotic studies
2.2.7. Gene expression studies
2.2.8. Microarray analysis
2.2.9. Transcription factor profiling
2.2.10. Statistical data analysis

36
2.1. MATERIALS
2.1.1. Test compounds
a) Punarnavine
Isolation of Punarnavine
The alkaloid Punarnavine was isolated from the plant Boerhaavia dffusa Linn.
as per the protocol (Agarwaal and Duttt, 1935). Eight kilogram of dried and finely
powdered, Boerhaavia diffusa Linn. was extracted with boiling ethyl alcohol. The
extract was concentrated to 20% of its volume, and boerhaavic acid was filtered off.
The filtrate was concentrated to dryness leaving 998 grams of sticky material. This
was extracted with hot water and concentrated to yield Potassium nitrate. It was
filtered and the filtrate was made ammoniacal and extracted repeatedly with
chloroform. The chloroform extract was evaporated and the residue from evaporation
was macerated with diethyl ether. It was then evaporated and gave amorphous
Punarnavine. Amorphous Punarnavine was then crystallized from a small volume of
ethyl alcohol and was purified again by recrystallization and preparative TLC (Diethyl
amine + Cyclohexane, 30:70; Rf = 0.87). The overall yield of Punarnavine was 0.01%.
Melting point of crystallized Punarnavine was 236°C. The isolated compound gave
positive results for the alkaloid Punarnavine giving a green color with FeCl3, a
greenish yellow color with concentrated H2SO4, red color with HNO3, no color with
HCl, a black precipitate with KI3, a blue color followed by a blue precipitate with
phosphomolybdic acid and a brown precipitate with Dragendorff's reagent.
b) Glycyrrhizic acid - Sigma Chemicals, St.Louis, USA
c) Ursolic acid - Sigma Chemicals, St.Louis, USA
d) Limonene - Sigma Chemicals, St.Louis, USA

37
2.1.2. Animals
BALB/c mice and Swiss albino mice were taken from small animal breeding
station of Amala Cancer Research Centre. C57BL/6 mice were purchased from
National Institute of Nutrition, Hyderabad, India. The animals were kept in well-
ventilated cages in air-controlled rooms. They were fed with normal mouse chow (Sai
Durga Feeds, Bangalore, India) and water ad libitum. All the animal experiments were
conducted according to the rules and regulations of Animal Ethics Committee, Govt.
of India.
2.1.3 Cell lines
L929 mouse lung fibroblast cells; B16F-10, a highly metastatic mouse
melanoma cells were obtained from National Centre for Cell sciences, Pune, India.
Ehrlich ascites carcinoma (EAC) cells were obtained from Cancer Research Institute,
Mumbai and maintained as ascites tumor in Swiss albino mice. Human umbilical vein
endothelial cells (HUVECs) were isolated from the umbilical cord of neonatal
according to the protocol of Jaffe et al (Jaffe et al., 1973).
2.1.4. Chemicals
Casein
Dulbecco’s Modified Eagles Medium
Fluid Thioglycollate Medium Hi Media Laboratories, Mumbai, India
L-Glutamine
Medium 199
Minimum Essential Medium Hi Media Laboratories, Mumbai,
Trypsin
Foetal Calf Serum : Biological Industries, Kibbutz, Israel.

38
Aprotinin
Benzamidine
Bromophenol blue
Concanavalin – A
Collagenase Type VIII
(From Clostridium histolyticum)
Collagen solution Type I
(From calf skin)
DEPC (Diethylpyrocarbonate)
DTT (Dithiotheritrol)
EDTA Sigma chemicals,
Ethidium bromide St. Louis, USA
ECM-Gel
(from Engelbreth Holrn-Swarm mouse sarcoma)
Gelatin Type A (from Porcine skin)
Guanidinium thiocyanate
γ-GT substrate (r-glutamic acid γ- p-nitroanilide/
L-γ Glutamyl p-nitroanilide)
Glycyl glycine
4, 6 Glucuronic acid lactone
Hydroxyproline

39
Leupeptin
MTT (3-[4,5- Dimethyl-2- thiazol]-2,5-diphenyl Sigma chemicals, St. Louis, USA
tetrazolium bromide)
2-mercaptoethanol
PMSF
Sodium acetate
Sodium citrate
Triton X-100
Acetyl acetone
Acrylamide Sisco Research, Mumbai
1, 4- Bis(phenyloxazol-2yl) Benzene (POPOP) Laboratories,
2,5 Diphenyl oxazole (PPO)
Folins reagent
Glucosamine hydrochloride
HEPES buffer
N,N-Methylene Bisacrylamide
Papain (Extracted from Papaya latex)
Lipopolysaccharide : Difco Laboratories, USA
3H-Thymidine
Sodium Chromate (Na2Cr51
O4) BARC, Mumbai, India.
(Specific Activity > 50mci/mg)
Human recombinant FGF-basic Pepro Tech, USA
Human recombinant VEGF

40
Diffquick stain set : Dade behring, USA.
Crystal violet : Romali, Mumbai, India
Trypan blue
DNase, RNase free water
dNTP mixture Genei, Bangalore, India
Taq DNA polymerase
2.1.5. Reagent Kits
BD Mercury Transfactor Kit : BD Biosciences, USA
Cells to cDNA Kit : Ambion Inc, USA
Gelcode Blue Stain Reagent : Pierce Inc, USA
Mouse ELISA Kits of IL-1β, IL-6, TNF-α,
IL-2 and IFNγ : Endogen Inc, USA
Mouse ELISA Kits of VEGF and TIMP-1 : R&D Systems,USA
CycleTEST PLUS DNA Reagent kit : Becton Dickinson
Immunocytometry Systems, USA
TUNEL assay kit (Apoptag Peroxidase in situ)
Apoptosis detection kit, :CHEMICON International, Inc.
Alkaline Phosphatase kit
Serum Glutamate Pyruvate Transaminase kit Span diagnostics, Surat,
India.
Urea kit
Creatinine kit

41
2.1.6. Tissue Culture Wares
Medium filtering assembly : Millipore, USA
Polycarbonate membrane filter : Whatman, USA
(13 µm, 8 mm, PVP free)
Cellulose syringe filtering apparatus : Sartorius, Germany
Tissue culture flask (25 cm2)
Tissue culture petri dish (90mm). Tarson, India
96-well flat bottom culture plate
Blind well chamber (Modified boyden Chamber) : Nucleopore Cambridge, USA
2.1.7. Instruments
Automatic Gamma Counter : PerkinElmer, USA
Rack Beta Liquid Scintillation Counter : Wallac, Finland
CO2 Incubator : Napco, Canada
Deep Freezer : Remi, Chennai, India
Disc electrophoresis unit : Balaji Scientific Service,
Chennai, India
Electronic Balance : Schimadzu, Japan
ELISA-Reader : Awareness Technology, Gujarat,
Gel Documentation system : Vilber Lourmat, France
High speed cooling centrifuge : Remi, Chennai, India
Inverted Microscope : Leica, Germany
Lyophilizer : Labconco Inc, USA
Minicycler – Thermocycler : MJ Research, USA
Spectrophotometer : Elico, India
42
Spinwin Microcentrifuge : Tarson, India
Submerged electrophoresis unit : Bangalore, Genei, India
Tissue homogenizer : Yorco Scientific
Industrues, Delhi
Transilluminator : Vilber Lourmat, France
Flow cytometer : BD FACS Caliber, USA.
2.1.8. Reagents
a) Phosphate Buffered Saline (PBS)
NaCl - 8.00 g
KCl - 0.20 g
Na2HPO4. 2H2O - 1.44g
KH2PO4 - 0.20g
Distilled Water - 1000ml
pH was adjusted to 7.2 with I N HCl or NaOH
b) PBS-EDTA solution
EDTA - 20mg
PBS - 100ml
Sterilized by autoclave
c) Trypsin solution
Trypsin - 200mg
Glucose - 20mg
PBS-EDTA - 100ml
Sterilized by filtration
d) Alsevier’s solution
Dextrose - 2.05g
Sodium citrate - 0.80g
NaCl - 0.42g
Distilled water - 100ml
pH adjusted to 6.1 with 10% citric acid.
43
e) Griess Reagent
A. 0.1% N- (1-Naphthylethylene diamino dihydrochloride) (NNED)
B. 1% Sulfanilic acid in 5% H3PO4
A+B= 1:1
f) Scintillation Fluid
PPO - 2.5g
POPOP - 0.25g
Naphthalein - 100g
Dioxan - 1000ml
2.1.9. Stains
h) Trypan blue - 100mg
Saline (0.9%) - 100ml
Trypan blue was dissolved in saline by overnight stirring. Any suspended
particles were removed by filtration
i) Eosine - 500mg
Ethanol - 100ml (Final volume)
j) Harris haematoxylin
Haematoxylin - 5g
Ethyl alcohol - 50ml
Potassium alum - 50mg
Potassium iodide - 50mg
Distilled water - 950ml
Haematoxylin was dissolved in alcohol using gentle heat. The alum was
dissolved in distilled water by heating with frequent stirring and keep
overnight at 40C. Alcoholic haematoxylin was added to the alum solution.
The mixture was cooled and potassium was added and filtered.

44
k) Crystal violet
Crystal violet - 50mg
Methanol - 20ml
Distilled water - 80ml
2.1.10. Radioactive materials
3H-Thymidine Board of Radiation
Sodium chromate (Na2Cr51
O4) Isotope Technology, (Specific
activity>50mCi/mg)
BARC, Mumbai, India
2.2. METHODS
2.2.1. Tissue culture
2.2.1.1. Sterilization of glass wares
All glass wares and filtration apparatus used for tissue culture purposes were
soaked in a solution of extran (1%) overnight, cleaned using brush and washed
thoroughly under running water. All the glass wares were rinsed in distilled water and
dried in a hot air oven. These were then autoclaved at a pressure of 15 pounds/square
inch for 15 minutes, dried and used for experiments.
2.2.1.2. Preparation of culture media
DMEM (9.98g/l), MEM (10.3g/l), Medium 199 (12.45g/l) and RPMI
(10.3g/l) were prepared in autoclaved double distilled water; pH adjusted to 7.2 using
sodium bicarbonate; supplemented with L-glutamine (2mM) and filtered under
negative pressure using a 0.22µm cellulose filter. For culture of normal cells such as
endothelial cells, an antioxidant – HEPES (10mM) was also supplemented in the
medium. Sterility of the medium was tested using fluid thyoglycollate medium. For
this 1 ml of the filtered medium was inoculated into 10 ml of sterile thioglycollate
(29.96g/l) and incubated at 37oC for 7 days and checked for visible contamination.
Broad spectrum antibiotics such as penicillin (100units/ml) and streptomycin
(100µg/ml) and foetal calf serum (10%) were added to the medium prior to use.
45
2.2.1.3. Maintenance of L929 cell line in tissue culture
The spent medium was removed from the confluent bottles and the cells were
washed thrice with 2ml of PBS-EDTA. 1 ml of trypsin solution containing 0.02%
EDTA was added and incubated for 3-4 minutes at 370C and the bottles were tapped
to dislodge the cells. MEM (5ml) containing 10% goat serum and antibiotics
(complete medium) was added. Cells were dispersed to single cell suspension by
repeated pipetting and an aliquot of cell suspension was added to fresh tissue culture
bottles containing 10ml of complete medium and incubated at 370C. Cells were
subcultured every week.
2.2.1.4 Maintenance of B16F-10 cell line in tissue culture
The spent medium was removed from confluent bottles and the cells were washed
three times with PBS. 1ml trypsin solution free of EDTA was added and incubated for
3-4 minutes at 370C. Bottles were then tapped to dislodge the cells. DMEM
containing 10% FCS and antibiotics (complete medium) was added and the cells were
dispersed to single cell suspension by repeated pipetting. An aliquot of the cell
suspension was added to fresh bottles containing 10ml of complete medium and
incubated at 370C. The cells were subcultured every week.
2.2.1.5. Isolation and maintenance of Human Umbilical Vein Endothelial Cells
(HUVECs)
Endothelial cells were collected from human umbilical cord vein, by the protocol
proposed by Jaffe et al (Jaffe et al., 1973). A sterile technique was followed in all
manipulations of the cord. The cord was served from the placenta soon after birth,
placed in a sterile container filled with cord buffer, and held at 40C until processing.
The umbilical vein was cannulated with a blunt needle, and the needle was secured by
clamping the cord over the needle with an umbilical cord tie. 1-2ml of 0.2%
collagenase in cord buffer was then infused into the umbilical vein through the needle
and the cord was placed in a water bath containing cord buffer and incubated at 370C
for 15minutes. After incubation, the collagenase solution containing the endothelial
cells was flushed from the cord by perfusion with 30ml of cord buffer. The effluent
was collected in a sterile centrifugal tube containing medium 199 with 20% FCS. The
cells sedimented at 250g for 10minutes and the cell pellet were suspended by
46
trituration in 5ml of fresh medium. The cell suspension was then added to gelatin pre-
coated tissue culture flask. The flasks were then incubated at 370C under 5% CO2.
The cells were fed twice a week with a complete change of fresh culture medium.
Endothelial cells were cultured in medium 199 containing FCS (20%), penicillin
(100U/ml), streptomycin (100µg/ml), L-glutamine (2mM), HEPES (10mM) and
VEGF (2ng/ml). On reaching confluence the cells were subcultured by conventional
trypsinisation. These cells were used for experiments from 3rd
passage to 6th
passage.
2.2.1.6. Preparation of cells for in vitro studies
For experiments 70-80% confluent cultures were used .Monolayer cells were
washed three times with PBS and the cells were harvested by mechanical dislocation
using a cell scraper. Cell number was adjusted and the viability was checked by
trypan blue exclusion method (Kuttan et al., 1985). Cell suspension with more than
95% viability was used for experiments.
2.2.1.7. Long term in vitro cytotoxicity studies in tissue culture (Campling et al,
1991)
Cells growing in log-phase were used for this experiment. Cells were seeded
in 96-well flat bottom tissue culture plate (5000cells/well) containing 200µl complete
medium and incubated for 24h at 37°C with 5% CO2 atmosphere. After incubation,
various concentrations of the test compounds were added to the wells and the
incubation was continued for 48h. Before 4h of the completion of incubation, 20µl of
MTT (5mg/ml) was added to each well. After the incubation period the plates were
centrifuged, supernatant was removed and 100µl of DMSO was added to each well.
The plates were then incubated at room temperature for 15 minutes and the optical
density was measured at 570nm with reference of 690nm (Cole, 1986; Campling et al,
1991). The percentage of dead cells was determined using the formula,
% Viable cells = OD of drugs treated ×100.
OD of control
47
2.2.2. Hematological parameters
2.2.2.1. Determination of Haemoglobin (Cheesbrough and McArthur, 1976)
Principle
Ferricyanide forms methaemoglobin with haemoglobin, which is converted to
cyanmethaemoglobin by cyanide, which has absorption at 540nm.
Procedure
0.02 ml of blood was mixed with 5ml of Drabkin’s reagent and allowed to
stand for 5minutes at room temperature. Optical density (OD) was measured against
reagent blank. Haemoglobin content was calculated using the formula,
gm % of Hb = OD of the test x 251x conc. of Std.
OD of Std. 1000
2.2.2.2. Determination of total count of leukocytes (Cheesbrough and McArthur,
1976)
Principle
The cells were diluted in Turk’s fluid, which contains a weak acid (acetic
acid) to lyse RBC and a stain (crystal violet), for staining the leukocytes. The number
of cells in the large four corner squares was counted.
Procedure
Blood (0.02ml) was mixed with 0.38ml of Turk’s fluid and kept at room
temperature for 2-3 minutes. The cells were mixed gently and loaded on to the
haemocytometer, allowed to settle at the bottom of the chamber for 2 minutes and
counted under a microscope using 10X objective. The total WBC counts was
determined using the formula,
Total leukocyte counts/mm3 = No. of cells counted x dilution factor x depth factor
Area counted
where,
Dilution factor = 1/20
Depth = 1/10mm
Area counted = 4sq.mm
Therefore, Total leukocyte counts/mm3 = N x 20 x 10 = N x 50
4
48
2.2.2.3. Differential count of leucocytes (Cheesbrough and McArthur, 1976)
Procedure
A thin film of blood was made by spreading a drop of blood evenly across a
clean glass slide using a glass spreader and air dried. Few drops of Leishman’s stain
was poured over the smear and kept for 3minutes. The stain was diluted with distilled
water and kept for minutes, washed with tap water and allowed to air dry. Various
types of cells were scored using the morphology under oil immersion with 100X
objective and a total of 100 cells were counted.
2.2.3. Immunological parameters
2.2.3.1. Collection and preparation of SRBC (Mehera and Vaidya, 1993)
Sheep blood was freshly collected from the slaughter house in equal volumes of
sterile Alsever’s solution and stored at 40C for not more than one week. Cells were
washed three times with PBS (pH 7.2). Supernatant was discarded and the pellet was
suspended in Hanks balanced salt solution (HBSS).
2.2.3.2. Preparation of anti SRBC antibody (Moudgil and Singh,1997)
A young healthy rabbit was injected intradermally with 2% SRBC in saline
which was mixed with Freunds complete adjuvant in a ratio of 1%. A booster dose
was given four weeks after the initial dose. Next day after the booster dose, blood was
collected and serum separated; heat inactivated and checked the antibody titre by the
haemagglutination method (Singh et al., 1984). According to the antibody titre value,
serum was diluted and used for the experiments.
2.2.3.3. Preparation of spleen cells
All the procedures were done under sterile condition. The animals were
sacrificed, an incision was made on the left side just below the rib and spleen was
removed with out any adherent tissue. Spleen was cut into small pieces and teased
over a stainless steel mesh in cold PBS or HBSS. Clumps were allowed to settle in a
centrifuge tube, kept in ice bath for 2minutes. Supernatant was collected, washed
three times with HBSS and resuspended in RPMI-1640 medium at required
concentrations.
49
2.2.3.4. Preparation of bone marrow cells
All the procedures were done under sterile conditions. Mice were sacrificed by
cervical dislocation and fixed on a board with fore and hind limbs fully stretched. The
skin and flesh overlying the limbs were removed and the femur was exposed. The
shaft of the femur was separated from both ends and the bone marrow was flushed out
of the cavity by passing a jet of medium with 2% FCS through the ends of the shaft
using a 26G needle and syringe. Flushed bone marrow was made into a single cell
suspension by repeated pipetting. It was then centrifuged and suspended at required
cell concentrations in RPMI-1640 medium.
2.2.3.5. Preparation of thymus cells
All the procedures were done under sterile conditions. Animals were sacrificed
by cervical dislocation. The skin was cleaned and body was incised at the upper part
above the heart. Bilobed thymus was detached, suspended in HBSS, and processed the
same way for spleen and the thymocytes were suspended in RPMI-1640 medium
containing 10%foetal calf serum.
2.2.3.6. Preparation of peritoneal macrophages
Peritoneal macrophages were elicited by injecting 0.2ml of 5% sodium caesinate
solution. After five days animals were sacrificed by cervical dislocation. All the
procedures were done under sterile conditions. Mice were fixed on a board, skin was
removed and the peritoneum was exposed. The peritoneal cavity was distended by
injecting 5ml of PBS or HBSS. The peritoneal cavity was gently prodded and the
peritoneal fluid containing macrophages was aspirated. The cells were washed and
suspended in RPMI-1640 to the desired cell concentrations.
2.2.3.7. Determination of circulating antibody titre (Singh et al., 1984).
Principle
The non-agglutinated SRBC will settle to the bottom of the well as a clear
‘button’ while agglutinated cells settle as a diffused ‘mat’. The maximum dilution of
anti-sera at which clear agglutination observed gives the titre of the antibody
Procedure
Anti-sera (0.1ml) were serially diluted in round bottom 96-well tissue culture
plates containing 0.1ml PBS/well (pH 7.2). 0.1ml of trypsinized SRBC was added to

50
each well, mixed gently and incubated at room temperature for 3hours. The dilution at
which clear agglutination seen was noted.
2.2.3.8. Determination of antibody forming cells (Jerne and Nordin, 1963)
Principle
Antibody produced by the lymphoid cells from animals immunized with SRBC
cause lysis of red cells in its vicinity (plaques) in a semi-solid support in the presence
of complement
Procedure
0.5 ml of Agarose (0.5%) was distributed into tubes kept at 450C and 0.05ml
SRBC (7%) and 0.05ml spleen cells (8x10⁶ cells/ml) were added and mixed well. The
contents were poured over a glass slide, spread in an area of 10cm2 and the gel was
allowed to solidify. The slides were kept in an incubation rack filled with fresh rabbit
serum (1:10 diluted with PBS, pH 7.2) as a source for complement and incubated for
1hour at 370C. The number of plaques were counted using a colony counter and
represented as plaque forming cells/106 spleen cells.
2.2.3.9. Assay for lymphocyte, thymocyte and bone marrow cell proliferation
(Justo et al, 2003)
Principle
Mitogens can stimulate resting lymphocytes to undergo a series of biochemical
and physical changes and are converted to blast-like cells. This process leads to cell
division and can be quantitated by 3H thymidine incorporation assay.
Procedure
All the techniques were sterile during the experiment. Spleen cells/thymus
cells/bone marrow cells (5x10⁴) were incubated with and with out mitogens in a final
volume of 200µl of RPMI-1640 medium in 96-well flat bottom titre plates
supplemented with 10% FCS and antibiotics in a humidified atmosphere containing
5% CO2 at 370C for 48 h. The concentrations of the mitogens added were; PHA-
2.5µg/ml; Con-A-10µg/ml; PWM- 10µg/ml and LPS-10µg/ml. 1µCi of 3H thymidine
was added to each well and incubated further for 18 h under the same conditions.
After incubation, DNA was precipitated using 10% perchloric acid and pellets were
dissolved in 0.5 ml of 0.5N NaOH. Then the contents were transferred to 5ml
51
scintillation fluid, kept overnight in dark. Counts per minutes (CPM) was measured in
a liquid scintillation counter.
2.2.3.10. 51
Cr-release assay (Kim et al., 1980)
51Cr-release assay was used to determine the cytotoxicity mediated by immune
effector cells such as natural killer cells and cells expressing Fc receptors (ADCC)
and was performed in round bottom titre plates.
Principle
51
Cr binds to cytoplasmic proteins after diffusing through the cell membrane
and is released only when the cell membrane is sufficiently damaged.
Labeling of target cells
The target cells, K-562 (106) and SRBC (10
7) were washed twice in RPMI-1640
and were resuspended in few drops of FCS. 100µCi of Na251
CrO4 was added and
incubated at 370C for I h on a shaker. The cells were washed in medium twice and
allowed to incubate in large volumes (5ml) of medium for 1h at 40C. Cells were
washed twice in medium and resuspended in complete medium at a concentration of
1x10⁵ cells/ml.
2.2.3.11. Determination of Natural Killer cell mediated cytotoxicity (Gupta, 1983)
Labeled target cells (K-562, 0.1ml) and equal volumes of various dilutions of
spleen cells (to yield effector: target ratios of 100:1, 50:1, and 25:1) were added to 96-
well round bottom titre plates. Final volume was adjusted to 0.2ml with RPMI-1640
supplemented with 10% FCS and incubated at 370C for 4 h. Titre plates were
centrifuged for 15 minutes, supernatant (100µl) was collected and radioactivity
measured in a gamma ray spectrometer.
The following control tubes were kept along with each experiment.
Spontaneous release (SR) - wells contained only target cells and medium.
Total release (TR) - wells contained target cells, medium and 0.1 ml of 1N
HCl.
Calculations
% Lysis = Experimental release- Spontaneous release x 100
Total release - Spontaneous release

52
2.2.3.12. Determination of antibody-dependent cellular cytotoxicity
(ADCC)(Gupta, 1983)
0.1ml of labeled SRBC (target cells) and 0.1ml of spleen cells (effector cells)
were added to get effector-target ratios of 100:1, 50:1 and 25:1.
0.05ml of anti-sera against SRBC was added and incubated at 370C for 4h. The
final volume was made up to 0.2ml with complete medium and the 4 h 51
Cr release
assay was performed as explained above.
2.2.3.13. Determination of antibody-dependent complement-mediated
cytotoxicity (Kuttan et al, 1985)
Principle
When tumor cells are incubated with specific antibodies in presence of
complement, the classical pathway will be activated leading to the lysis of target cells.
Procedure
Antiserum was diluted in RPMI-1640 to get 1:1, 1:2 and 1:4 dilutions of the
antibody and 0.1 ml of the serum was mixed with 106 EAC cells. 0.05ml of 1:10
diluted fresh rabbit serum as a source of complement was added and the final volume
was made up to 2ml and incubated at 370C for 3h. The cells were centrifuged and 1
ml of the supernatant was discarded and cytotoxicity was assessed by trypan blue
exclusion method (Kuttan et al., 1985).
2.2.3.14. Determination of α-naphthyl acetate esterase activity (Bancroft and
Cook, 1984)
The enzyme hydrolyses the substrate to form an invisible primary reaction
product. The complex is coupled with the diazonium salt to produce coloured final
reaction product.
Procedure
Animals were sacrificed by cervical dislocation. Skin and flesh removed from
the thigh of the animal and femur bone was taken out. Bone marrow cells were
flushed out from femur into PBS containing 10% goat serum using a syringe. Cells
were counted and thin smears prepared on glass slides. The smear was air dried and
fixed using 37% formaldehyde. Slides were incubated in a reaction buffer containing
pararosaniline, sodium nitrate and α-naphthyl acetate at room temperature. Smear

53
slides were counterstained with haematoxylin for 2 minutes. α–esterase positive cells
take up a yellowish brown colour and cells were counted under microscope using oil
immersion.
2.2.4. Antiangiogenic studies
2.2.4.1. Antiangiogenic studies in vivo
The antiangiogenic activities of the test materials were studied in C57BL/6
mice. Angiogenesis was induced by injecting 1x10⁶ B16F-10 melanoma cells
intradermaly on the shaven ventral skin of the mice. The angiogenesis induced
animals were sacrificed on 9th
day after tumor inoculation. The ventral skin was cut
removed, washed in PBS and the number of tumor directed capillaries per cm2 around
the tumor was counted using dissection microscope (Kishi et al., 2000).
Blood of these angiogenesis induced animals were collected at two time points
viz. day 1 and day 9, from the caudal vein in an aseptic manner. Serum was separated
by centrifugation and used for cytokine profiling. Cytokines such as IL-1β, IL-2, IL-6,
TNF-α, GM-CSF, VEGF and an endogenous inhibitor of MMPs- TIMP-1 were
assayed using respective ELISA kits.
2.2.4.2. Antiangiogenic studies in vitro
a) Rat aortic ring assay (Ngg et al, 2003)
Rat aortic ring assay was used as the in vitro angiogenesis study model. Dorsal
aorta from a freshly sacrificed Sprague Dawley rat was cut removed in a sterile
manner, rinsed in ice cold PBS to remove blood and any membranous tissue. It was
then cut into ~1mm thick transverse sections using surgical blades. Each segment was
placed in a collagen pre-coated 96-well tissue culture plate. The rings were incubated
for 24 h at 37ºC in medium, afterwards exchanged for medium with VEGF. The rings
were further incubated for six days and then analyzed by phase contrast microscopy
for any microvessel out growth from the aorta and photographs were taken.
b) Endothelial cell motility assay (Guo et al., 2002)
Endothelial cells (HUVECs) were grown to confluence in 96-well tissue
culture plates coated with gelatin. A clear area was then scraped in the monolayer and
fresh medium along with or without the test compounds were added. The culture were
further incubated for 24h and then fixed using methanol and stained with crystal

54
violet. Migration of cells into the wounded area was evaluated with an inverted
microscope and photographed.
c) Tube formation assay (Gupta et al., 2002)
ECM gel (25µl) was added to 96-well plate and incubated at 37ºC for 30
minutes. Endothelial cells were added to the solidified gel and further incubated for
48h in 5% CO2 atmosphere in 199 medium supplemented with 2ng/ml VEGF and
2ng/ml FGF. Various concentrations of test compounds were added and along with
this three wells were kept without any treatment and was the control. Supernatant was
then removed, cells were fixed and stained using Diff-Quick stain set. Tube formation
was examined and the area of the capillary –like structure formed was photographed
using an inverted microscope.
d) Collagen matrix invasion assay (Albini et al., 1987)
Invasion of collagen matrix by tumor cells was carried out using modified
Boyden chambers (Blind well chambers) as described by Albini et al (Albini et al.,
1987).The lower compartment of the chamber was filled with fresh medium with
VEGF and a polycarbonate filter coated with 25µg Type I collagen was placed above
this. HUVECs (105
cells/150 µl medium 199) were then seeded on to the upper
chamber in the presence and absence of different concentrations of test compounds
and incubated at 370C in 5% CO2 atmosphere for 10 h. After the incubation period the
cells on the upper side of the filter was removed by a cotton swab. The filter was then
fixed in methanol for 1minute and stained for 3minutes with crystal violet. Cells
migrating to the lower surface of the polycarbonate filters were counted in 10 fields
under a microscope. Results were calculated as % inhibition of invasion using the
formula,
% inhibition of invasion = 100- mean no. of migratory cells in test x 100
mean no. of migratory cells in control

55
2.2.5. Antimetastatic studies
2.2.5.1. In vivo antimetastatic studies
a) Determination of the metastatic potential of B16F-10 melanoma cells in
animal model
Studies on the metastatic ability of tumor cells (in vivo) were done in C57BL/6
mice. Pulmonary colony forming ability of B16F-10 cells was carried out as described
by Fidler et al (Fidler et al., 1978). C57BL/6 mice were injected with B16F-10 cells
(1x10⁶) through the lateral tail vein. Animals were sacrificed on 21
st day. Metastasis
of the lungs were determined by counting the metastatic foci on the surface of the
lungs; measuring biochemical parameters such as lung collagen hydroxyproline, lung
uronic acid, lung hexosamine, serum sialic acid, and serum γ-glutamyl transpeptidase;
histopathological analysis of lungs and determining the rate of survival.
b) Estimation of protein (Lowry et al., 1951)
Principle
This assay relies on the formation of protein copper complex and reduction of
Phosphomolybdate-Phosphotungstate reagent (Folin Ciocaltaeu reagent) by tyrosine
and tryptophan residues of protein
Reagents
Solution A
Sodium potassium tartarate - 1ml (2%)
CuSO4 - 1ml (1%)
Na2CO3 - 98ml (2% in 0.1N NaOH)
Solution B
Folin’s phenol reagent - 1N, diluted 1:1 with distilled water
Procedure
20µl sample and different concentrations of standard BSA (150µg, 100µg, 50µg
and 25µg) were made up to 1.2ml with distilled water. To this, 6ml of solution A was
added and then incubated at room temperature for 10minutes. 300µl solution B was
then added to the vortex mixed reaction mixture, incubated at room temperature for
30minutes. Optical density read at 660nm.

56
c) Estimation of Hydroxyproline (Bergman and Loxley, 1970)
Principle
Hydroxyproline present in samples were oxidized by chloramines T. The
coloured product is more stable in the presence of high concentrations of isopropanol.
Reagents
1. Oxidant solution
Sodium acetate - 5.7g
Trisodium citrate - 3.75g
Citric acid - 0.55g
Isopropanol - 38.5ml
Distilled water - 61.5ml
2.Ehrlisch’s reagent
p-dimethyl amino benzaldehyde - 4.4g
Perchloric acid - 10.2g (60%)
Isopropanol - 25ml (Final volume)
3. Chloramine T - 1.75g/25ml oxidant solution prepared on
the day of use
Procedure
Lung tissue (1g) was homogenized using 4ml isotonic saline and hydrolyzed in
6 N HCl. The tubes were sealed and incubated at 1100C for 24 h. 1ml hydrolysate was
neutralized with KOH then made up to 5ml with H2O. To 0.5ml neutralized sample
2.5ml isopropanol and 1ml oxidant solution was added by mixing and kept at room
temperature for 4 minutes. 2ml Ehrlisch’s reagent was added to the tubes and
incubated at 600C in water bath for 21minutes. Then the tubes were kept at room
temperature for 1h. The absorbance was taken at 560nm.
d) Extraction and estimation of Uronic acid
Extraction of uronic acid from the tissue was carried out according to the
method of Schiller et al (Schiller et al., 1961). Digestion of the tissue was carried out
with crude papain (10mg/g dry weight of tissue) in 5ml of 0.5M acetate buffer of pH
5.5 containing 0.005 M cysteine and 0.005 M disodium salt of EDTA at 650C for 24
57
h. An aliquot of the sample containing approximately 5-15 mg uronic acid was taken
for estimation. Uronic acid was estimated by the method of Bitter and Muir (Bitter
and Muir, 1962).
Procedure
Aliquote (5ml) of sulphuric acid reagent (prepared with 0.025M sodium
tetraborate in conc. H2SO4) was taken in tubes and cooled at 40C for some time. 1ml
of sample or standard glucaronolactone solution containing 5-20mg was layered on
the acid. Tubes were closed with ground glass stoppers and the rack was shaken first
gently and then vigorously. Tubes were kept in a boiling shaking-water bath for
10minutes and cooled at room temperature. 0.2ml of carbazole reagent (0.125%
carbazole in absolute alcohol) was added and the tubes were shaken heated in a
boiling water bath for 15minutes and cooled. The pink colour thus developed was
read at 530nm.
Uronic acid content of the tissues were expressed as µg/100mg wet weight.
Reagents
Sulphuric acid reagent - 0.952g sodium tetraborate in 100ml of
Con.H2SO4 (0.025M)
Carbazole reagent - 0.125g carbazole in 100g absolute alcohol.
Acetate Buffer (0.1M) - Solution A. 0.2M solution of acetic
acid + Solution B. 0.2M solution of sodium
acetate.
e) Estimation of Hexosamine (Elson and Morgan, 1933)
Lyophilized tissue samples (5mg) were hydrolyzed with 2N HCl (5ml) at 1000C
for 6h. HCl was then removed by evaporation; the residue was dissolved in water and
made up to a known volume.
Preparation of 2% acetyl acetone in 0.5M Na2CO3.
2ml of acetyl acetone in 100ml of 0.5M Na2CO3.
Preparation of Ehrlisch’s reagent
Dissolve 1.33g of p-dimethyl aminobenzaldehyde (PDAB) in 100ml of 1:1
ethanol: conc. HCl.

58
Principle
The amino sugars (hexosamines) occurs in α or β pyranose form in many
structura polysaccharides. Hexosamines have reducing properties with phenyl
hydrazine but not osazones, because the C-OH has been replaced by NH2.
Procedure
Aliquots containing 10-15µg hexosamine were treated with 1ml of freshly
prepared 2% acetyl acetone in 0.5N Na2CO3 in capped tubes and kept in boiling water
bath for 15minutes. After cooling in tap water, 5ml of 95% ethanol and 1ml of
Ehrlisch’s reagent (1.33% p-dimethylaminobenzaldehyde in 1:1 ethanol: Conc.HCl
mixture) were added and mixed thoroughly. The purple red colour developed was
read after 30minutes at 530nm. Water blank and standard glucosamine solutions of
various concentrations were also treated similarly to get a standard curve.
Hexosamine contents of tissues were expressed as µg/100mg dry weight.
f) Estimation of protein bound serum Sialic acid (Skoza and Mohos, 1976)
Principle
Acid hydrolysis of serum for liberation of sialic acid forms a coloured
compound with thiobarbituric acid.
Reagents
1. H2SO4 - 0.2N
2. Periodic acid - 25µM or 62.5 mM H2SO4
3. Sodium arsenite - 0.2% or 0.5M HCl
4. Thiobarbituric acid - 0.6% (pH 9.0)
5. Dimethyl sulphoxide
Procedure
200µl of sample was mixed with equal volume of 0.2N H2SO4 and hydrolyzed
for 1h at 800C. To this hydrolysate 50µl periodic acid (25µM) was added and
incubated for 30minutes at 370C. To this reaction mixture 50µl of sodium arsenite was
added, followed by 100µl of thiobarbituric acid and was heated in a boiling water bath
for 7.5minutes. After heating, 400µl of DMSO was added to intensify the colour and
read at 549nm and 532nm
59
g) Estimation of γ-glutamyl transpeptidase (Szasz, 1976)
Principle
γ-glutamyl transpeptidase catalyses the transfer of γ-glutamyl moiety of a γ-
glutamyl donor to a variety of acceptors.
2γ- (glutamyl-p-nitroanilide) γ-glutamyl- γ-glutamyl-p-nitroanilide + acceptor
γ- glutamyl acceptor + p-nitroaniline
Reagents
L- γ-glutamyl-p-nitroanilide - 2.5mM
Glycyl glycine - 20mM
Tris-HCl (pH 8.0) - 0.05M
NaCl - 75mM
Procedure
The standard assay mixture contained (1ml) 0.05M Tris HCl, 75mM NaCl,
2.5mM/L- γ-glutamyl-p-nitroanilide and 20mM glycyl glycine along with 25µl
sample. The rate of release of p-nitroaniline was measured at an optical density of 410
nm using a spectrophotometer.
h) Histopathological Analysis
The tissue was fixed in 10% neutral formalin for at least 4h. The tisues were
dehydrated in alcohol series, cleaned in xylene and embedded in paraffin. About 5-
6µm thick sections were taken on a glass slide and stained with haematoxylin and
eosin and visualized under the microscope for histological changes (Culling, 1976)
i) Determination of the rate of survival
Animals were injected with B16F-10 melanoma cells (1x10⁶) intravenously. The
mortality of the animals was noted and the percentage increase in life span (% ILS)
was calculated from the formula,
%ILS = T- C x 100
C
where, ‘T’ is the number of days the drug treated
animals survived and ‘C’ is the number of days the control animals survived.
60
2.2.5.2. In vitro antimetastatic studies
a) Collagen matrix invasion assay (Albini et al., 1987)
Invasion of collagen matrix by tumor cells was carried out using modified
Boyden chambers (Blind well chambers) as described by Albini et al (Albini et al.,
1987).The lower compartment of the chamber was filled with serum free fresh
medium with VEGF from B16F-10 cell culture and a polycarbonate filter coated with
25µg Type I collagen was placed above this. B16F-10 melanoma cells (105
cells/150
µl DMEM) were then seeded on to the upper chamber in the presence and absence of
different concentrations of test compounds and incubated at 370C in 5% CO2
atmosphere for 10 h. After the incubation period the cells on the upper side of the
filter was removed by a cotton swab. The filter was then fixed in methanol for
1minute and stained for 3minutes with crystal violet. Cells migrating to the lower
surface of the polycarbonate filters were counted in 10 fields under a microscope.
Results were calculated as % inhibition of invasion using the formula,
% Inhibition of invasion = 100- mean no. of migratory cells in test x 100
mean no. of migratory cells in control
b) Tumor cell motility assay
B16F-10 cells (1x10⁵/0.15ml) were seeded on the upper compartment of blind
well chamber, containing polycarbonate filter without collagen coating. Chambers
were incubated at 370C for 24 h. Migrated cells were collected from the lower
chamber and counted using a haemocytometer. Results were calculated as,
% Motility = Mean no.of migrating cells in test x 100
Mean no.of migrating cells in control
c) Tumor cell adhesion assay (Inokuchi et al., 1990)
Principle
Transformed cells have higher adhesive attachment rates to a variety of
homotypic or heterotypic cell susbstrates. Metastatic cells are always found to have
higher rates of homotypic attachment (Nicolson et al., 1978).

61
Procedure
B16F-10 melanoma cells (5x10³ cells/well) were added to 96-well flat bottom
titre plates, pre coated with collagen type I (25µg/well) and incubated for 5 h at 370C
in 5% CO2 atmosphere. After incubation, medium was removed and the wells were
washed with PBS. Adhering cells were fixed with 5% formaldehyde and stained using
crystal violet for 20minutes each. The cells were counted under an inverted
microscope.
d) Gelatin Zymography (Billings et al., 1991)
Principle
Proteases of tumor cell lysate were initially resolved on SDS- poly acrylamide
gels, which were incorporated with gelatin. Following incubation of the gel in the
activation buffer, protease separated on the gel will breakdown the gelatin and appears
as transparent zones or clearings against a dark back ground (upon staining).
Reagents
i) 0.25M sucrose- 0.01M Tris-HCl buffer, pH 7.4
Sucrose - 85.87g
Tris-HCl - 1.21g
Double Distilled water - 1000ml (Final volume)
ii) 0.1M Tris-HCl, pH-8.0, 10mM CaCl2
CaCl2. 2H2O - 1.47g
Tris - 12.1g
Double Distilled water - 1000ml (Final volume)
pH adjusted with Conc.HCl
iii) Trypsin solution
Trypsin -75µg/ml in 0.1M Tris-HCl, with 10mM CaCl2, pH 8.
iv) Activation buffer (0.1M Tris-HCl, 10mM CaCl2, pH 7.8)
Tris HCl - 12.1g
CaCl2.2H2O - 1.47g
Double Distilled water - 1000ml (Final volume)

62
v) Preparation of gels
Resolving Gel
11% Polyacrylamide gels with 0.1%SDS and 0.6% gelatin
29.2% acrylamide + 0.5% bisacrylamide - 11ml
0.1M Tris-HCl, pH 8.8 - 1.2ml
20% SDS - 0.15ml
20% Ammonium per sulphate - 0.10ml
Gelatin (180mg/2ml distilled water,
heated to dissolve) - 2ml
Double Distilled water - 6.505ml
TEMED - 0.045ml
Mix and pour at room temperature.
5% Stacking gel
29.2% acrylamide +0.5% bis acrylamide - 1.67ml
0.1M Tris-HCl, pH 8.8 - 1.75ml
20%SDS - 0.10ml
20% Ammonium per sulphate - 0.10ml
Double Distilled water - 6.36ml
TEMED - 0.02ml
Mix and pour above the resolving gel at room temperature
vi) Sample buffer (2x)
Glycerol - 1ml
1M Tris-HCl, pH 6.8 - 0.25ml
20% SDS - 1ml
Bromophenol blue - 1.65mg
(Tracking dye)
Made up to 5ml with double distilled water
vii) Running buffer
Tris base - 3g
SDS - 2g
Glycine - 14.2g

63
Made up to 1L with double distilled water
viii) 2% Triton X-100
Triton X-100 - 2ml
0.1M Tris HCl, pH 7.8 - 100ml (Final volume)
ix) 10mM EDTA solution
EDTA- Na2 - 372.24mg
0.1M Tris-HCl, pH 7.8 - 1000ml (Final volume)
Procedure
Gelatin Zymography was followed according to the procedure of Billings et al
(Billings et al., 1991) with some modification. The medium from sub-confluent (70%)
bottles of B16F-10 tumor cells were removed, cells were then washed with serum free
medium and incubated in serum free medium (DMEM) at 370C for 24 h.
After the incubation, medium was collected, centrifuged, and supernatant was
used for zymographic analysis. After determining the protein concentration,
supernatant (equvalent to 50µg protein) containing the proteases were activated with
trypsin (75µg/ml, 5µl trypsin solution for 100µg protein) in the presence and absence
of test compounds in 0.1 M Tris-HCl, 10mM CaCl2 buffer (pH-8.0) and incubated for
1 h at room temperature.. Trypsin treated and untreated samples (equivalent to 50µg
protein) were mixed with an equal volume of 2X sample buffer and loaded on to
0.1%SDS -11% polyacrylamide gels containing 0.1% gelatin. Electrophoresis was
carried out at 40C with constant current of 2mA/tube until the tracking dye
(Bromophenol blue) reached the periphery of the gels. The gels were then washed
with 2% Triton X-100 on a shaker at 20-250C for three changes of 30 minutes each, to
remove the SDS which could interfere with proteolytic activity. This was followed by
2 h washing with activation buffer and the gels were finally incubated in the same
buffer at 370C for 18 h. Gels were then fixed and stained with Gelcode Blue stain
reagent for 2 h and clear bands were visualized against a dark back ground.
2.2.6. In Vitro Apoptotic Studies
2.2.6.1. Cell cycle analysis
One million logarithmically growing B16F-10 cells -suspended in DMEM
with 10% FCS-were seeded in a culture flask. These cells were incubated for 10 hours
64
at 370C in CO2 atmosphere with and without test compounds. After incubation the
cells were washed in PBS and analyzed for cell cycle changes in flow cytometer using
Becton-Dickson kit as per the manufacture’s protocol.
2.2.6.2. Morphological Analysis
To detect the morphological changes, B16F-10 melanoma cells (5000/well)
were incubated in the presence and absence of test compounds at 370C in 5% CO2
atmosphere for 48 h. The cells were washed thrice with PBS, centrifuged and the cell
pellets were suspended in PBS and cell smear was prepared and stained with
haematoxylin and eosin. Apoptosis was characterized by the morphological changes
such as chromatin condensation, nuclear condensation, cellular membrane blebbing
and formation of apoptotic bodies.
2.2.6.3. Extraction of DNA for DNA-ladder Analysis
Reagents
a) Cytoplasm Extraction Buffer
Tris-HCl pH 7.5 - 10mM
NaCl - 150mM
MgCl2 - 5mM
Triton X-100 - 0.5 %
b) DNA Lysis Buffer
Tris-HCl pH 7.5 - 10mM
NaCl - 400mM
EDTA - 1mM
MgCl2 - 5mM
Triton X-100 - 1%
c) Tris-EDTA Buffer
Tris-HCl, pH 8.0 - 10mM
EDTA - 1mM
One million B16F-10 cells were incubated in the presence and absence of test
compounds at 370C in 5% CO2 atmosphere for 48 h. The cells were washed thrice
with PBS, centrifuged and the cell pellets were incubated with 1 ml of cytoplasm

65
extraction buffer on ice for 20 minutes, and pelleted by centrifugation. The pellet was
resuspended in DNA lysis buffer for 20 minutes on ice and then centrifuged at 10,000
rpm for 10min at 4oC. The supernatant obtained was incubated overnight with RNase
(2µg/ml) at room temperature and then with proteinase K (50µg/ml) for 2 h at 370C.
DNA was extracted using phenol-chloroform (1:1) and precipitated with ice-cold
100% ethanol. The DNA precipitate was centrifuged at 10,000 rpm for 15 minutes
and the pellet was air dried and dissolved in 50µl of Tris-EDTA buffer. Purity and
quantification of the DNA was carried out by monitoring the ODs at 260 and 280nm.
The extracted DNA was resolved on 1.5% agarose gels.
2.2.6.4. TUNEL assay
TUNEL assay was done to detect apoptosis via DNA fragmentation using
Apoptag Peroxidase in situ Apoptosis detection kit, CHEMICON International, Inc.
B16F-10 melanoma cells (5000/well) were incubated in the presence and absence of
test compounds at 370C in 5% CO2 atmosphere for 48 h. The cells were washed in
PBS and stained as per manufacturer’s protocol.
2.2.7. Gene Expression Studies
2.2.7.1. Cell to cDNA Synthesis
Gene expression analyses were carried out by RT-PCR method. Cells to
cDNATM
II kit from Ambion Inc, U.S.A., were used for producing cDNA from
mammalian cells in culture without isolating mRNA. The cDNA produced is
specifically intended for use in the polymerase chain reaction (PCR). RT-PCR is one
of the main methods used for measuring mRNA levels from a small number of cells.
Materials provided in the kit
1 x PBS - 40ml
Cell Lysis Buffer - 10ml
DNase I (2 U/µl) - 200µl
10 X RT Buffer - 500µl
M-MLV Reverse Transcriptase - 100µl

66
RNase inhibitor (10 U/µl) - 100µl
dNTP (2.5 mM each d NTP) - 400µl
Oligo (dT)18 Primers - 50µM
Nuclease Free water - 3.5ml.
Principle
In the cells to cDNA II kit, a crude cell lysate is subjected to RT-PCR without
purifying the RNA. Cells from tissue culture were washed in PBS and then heated in
cell lysis buffer. This treatment has two important effects. First it raptures the cells,
releasing the RNA into the cells lysis buffer. The heating step also inactivates
endogenous RNases, protecting the RNA from degradation. Next the crude cell lysate
is treated with DNase I to degrade genomic DNA and the mixture is heated a second
time to inactivate the DNase-I. At this point the cell lysate is ready for reverse
transcription and PCR were carried out using two step RT- PCR strategy.
Procedure
B16F-10 melanoma cells (2x10⁴cells/well) were seeded in the 96-well flat
bottom titre plate using serum free DMEM supplemented with antibiotics (penicillin
100 units/ml and streptomycin 100µg/ml) and incubated for 4 h at 37oC in 5% CO2
atmosphere. After incubation medium was removed and the cells were washed with
ice cold PBS. Ice cold cell lysis buffer (100µl) was added to the cells and incubated
for 15 minutes at 75oC in a water bath. The cell lysate was then transferred to 200µl
nuclease free microcentrifuge tubes. To this 2 µl DNase-1 was added and incubated
for 15 minutes at 37oC. DNase was inactivated by heating at 75
oC for 5 minutes.
Following reagents were assembled in nuclease free microcentrifuge tubes
Components Amount
Cell lysate containing total RNA 10µl
dNTP Mix 4µl
Oligo (dT)18 2µl
Nuclease free water 16µl
67
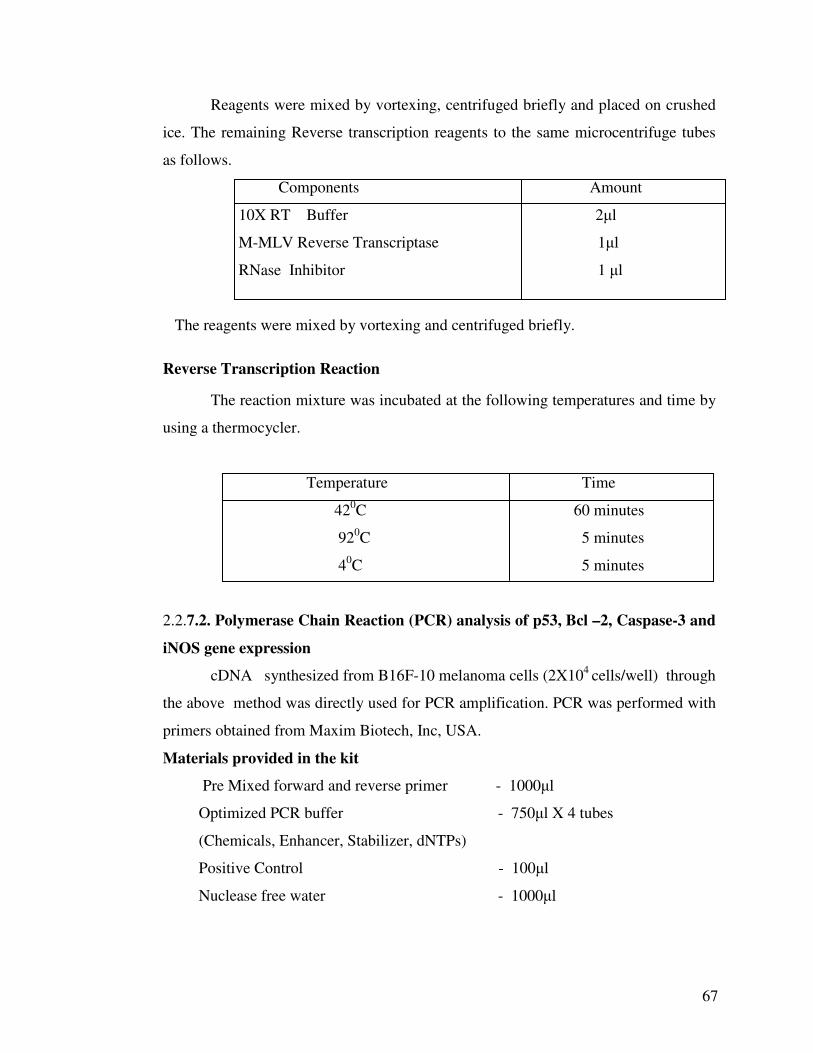
Reagents were mixed by vortexing, centrifuged briefly and placed on crushed
ice. The remaining Reverse transcription reagents to the same microcentrifuge tubes
as follows.
Components Amount
10X RT Buffer 2µl
M-MLV Reverse Transcriptase 1µl
RNase Inhibitor 1 µl
The reagents were mixed by vortexing and centrifuged briefly.
Reverse Transcription Reaction
The reaction mixture was incubated at the following temperatures and time by
using a thermocycler.
Temperature Time
420C 60 minutes
920C 5 minutes
40C 5 minutes
2.2.7.2. Polymerase Chain Reaction (PCR) analysis of p53, Bcl –2, Caspase-3 and
iNOS gene expression
cDNA synthesized from B16F-10 melanoma cells (2X10⁴
cells/well) through
the above method was directly used for PCR amplification. PCR was performed with
primers obtained from Maxim Biotech, Inc, USA.
Materials provided in the kit
Pre Mixed forward and reverse primer - 1000µl
Optimized PCR buffer - 750µl X 4 tubes
(Chemicals, Enhancer, Stabilizer, dNTPs)
Positive Control - 100µl
Nuclease free water - 1000µl

68
Procedure
All the reagents were thawed before starting the experiments, mixed
thoroughly and centrifuged briefly. All the reagents were taken in nuclease free
microcentrifuge tubes according to the protocol of primer kit as follows.
Master mixture preparation
250µl each of pre-mixed primers were added to each tube of optimized PCR
buffer. This master mixture was aliquoted and used for preparation of reaction
mixture as follows for further PCR amplification.
Components Amount (µl)
Master Mixture 40
Taq DNA polymerase 0.2
cDNA sample 10
Reaction mixture was vortexed and centrifuged briefly before and after adding
the cDNA sample. PCR thermal cycling was performed according to the protocol of
Maxim Biotech, Inc at the following conditions.
Steps Conditions Temperature Duration (minutes)
i Initial Denaturation 960C 1
ii Denaturation 940C 1
iii Annealing 580C 1
iv Extension 720C 1
v Go to step ii and repeat 35 cycles
vi Final extension 720C 10
vii Store at 40C
2.2.7.3. Tissue to cDNA synthesis
Isolation of RNA from the tissue
Isolation of RNA from tissue follows the method of Chomczynski and Sacchi
(1987).100mg of the lung from treated and untreated metastasis bearing C57BL/6

69
mice was minced and homogenized in 1mL of denaturing solution (Guanidinium
thiocyanate 4M, 25mM sodium citrate, pH 7.0, 0.1M β-mercaptoethanol, prepared in
DEPC treated de-ionized water). The contents were transferred into a polypropylene
tube and 0.1ml of 2M sodium acetate (pH 4.0) was added and mixed well by inverting
the tube. After the mixing 1ml of water saturated phenol was added to each tube and
the contents were mixed well. This was followed by the addition of 0.2ml of
chloroform-isoamyl alcohol (49:1) and the mixture was kept at -200C for 5 minutes.
The contents in the each tube were centrifuged at 12000 rpm for 30 min at 40C. The
aqueous phase was transferred into a new vial and mixed with 1ml of isopropanol and
placed again at -200C for 1 h. The vials were centrifuged again at 12000 rpm for 20
minutes at 40C and the supernatant was discarded from each vial. The pellet so
obtained was dissolved in 300µl of denaturing solution and mixed with 500µl of
isopropanol again. Further the mixture was kept at -200C for 30 minutes. The vials
were centrifuged at 12000 rpm for 30 minutes at 40C and the supernatant was
discarded. The pellet was resuspended in 1ml of 75% ethanol, the contents were
vortexed for few seconds and incubated at room temperature for 15 minutes. The
mixture was centrifuged again at 12000 rpm for 10 minutes at 40C and the supernatant
was discarded. The pellet was air dried. Finally dissolved the pellet in 100µl of DEPC
water and stored at-700C. The RNA isolated was used for the preparation of cDNA.
Preparation of cDNA
The cDNA was prepared from RNA by RT-PCR as described below. 10µl of
the RNA sample was taken and it was denatured at 950C for 5minutes.

70
Preparation of the reaction mixture for RT-PCR:
Reagents Quantity per sample
---------------------------------------------------------------------
10X PCR buffer 2 µl
25mM MgCl2 2 µl
10mM dNTPs 2 µl
Oligo dT 1 µl
RNase inhibitor 1 µl
AMV RT 1 µl
DEPC water 7 µl
----------------------------------------------------------------------
Total 16 µl
The contents were centrifuged and 5µl of denatured RNA sample was added.
The mixture was vortexed and centrifuged and cDNA was synthesized using a mini
thermocycler.
Reverse transcription reaction
The reaction mixture was incubated at the following temperatures and time by
using a thermocycler.
Temperature Time (minutes)
420C 60
920C 5
40C 5
After the reaction contents vials were stored at -700C.
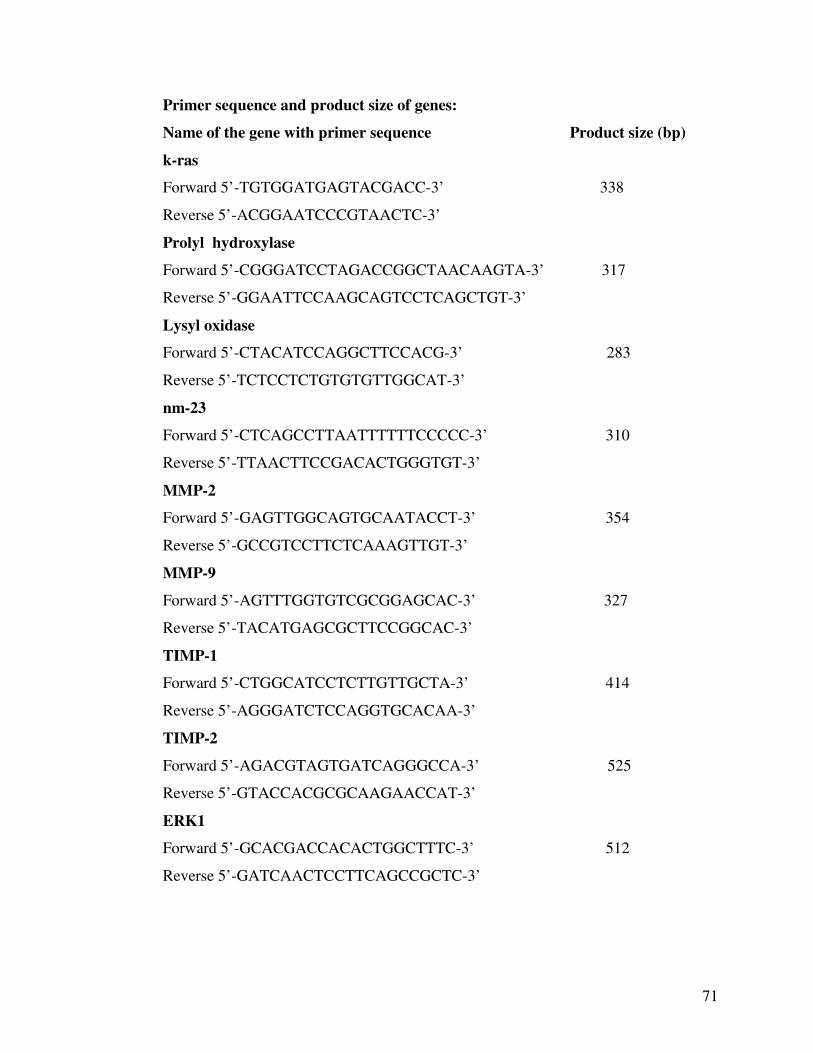
The cDNA prepared by the above described protocol was used for the analysis
of expression of the following genes. Their primer sequence and expected product
size is given below.
71
Primer sequence and product size of genes:
Name of the gene with primer sequence Product size (bp)
k-ras
Forward 5’-TGTGGATGAGTACGACC-3’ 338
Reverse 5’-ACGGAATCCCGTAACTC-3’
Prolyl hydroxylase
Forward 5’-CGGGATCCTAGACCGGCTAACAAGTA-3’ 317
Reverse 5’-GGAATTCCAAGCAGTCCTCAGCTGT-3’
Lysyl oxidase
Forward 5’-CTACATCCAGGCTTCCACG-3’ 283
Reverse 5’-TCTCCTCTGTGTGTTGGCAT-3’
nm-23
Forward 5’-CTCAGCCTTAATTTTTTCCCCC-3’ 310
Reverse 5’-TTAACTTCCGACACTGGGTGT-3’
MMP-2
Forward 5’-GAGTTGGCAGTGCAATACCT-3’ 354
Reverse 5’-GCCGTCCTTCTCAAAGTTGT-3’
MMP-9
Forward 5’-AGTTTGGTGTCGCGGAGCAC-3’ 327
Reverse 5’-TACATGAGCGCTTCCGGCAC-3’
TIMP-1
Forward 5’-CTGGCATCCTCTTGTTGCTA-3’ 414
Reverse 5’-AGGGATCTCCAGGTGCACAA-3’
TIMP-2
Forward 5’-AGACGTAGTGATCAGGGCCA-3’ 525
Reverse 5’-GTACCACGCGCAAGAACCAT-3’
ERK1
Forward 5’-GCACGACCACACTGGCTTTC-3’ 512
Reverse 5’-GATCAACTCCTTCAGCCGCTC-3’
72
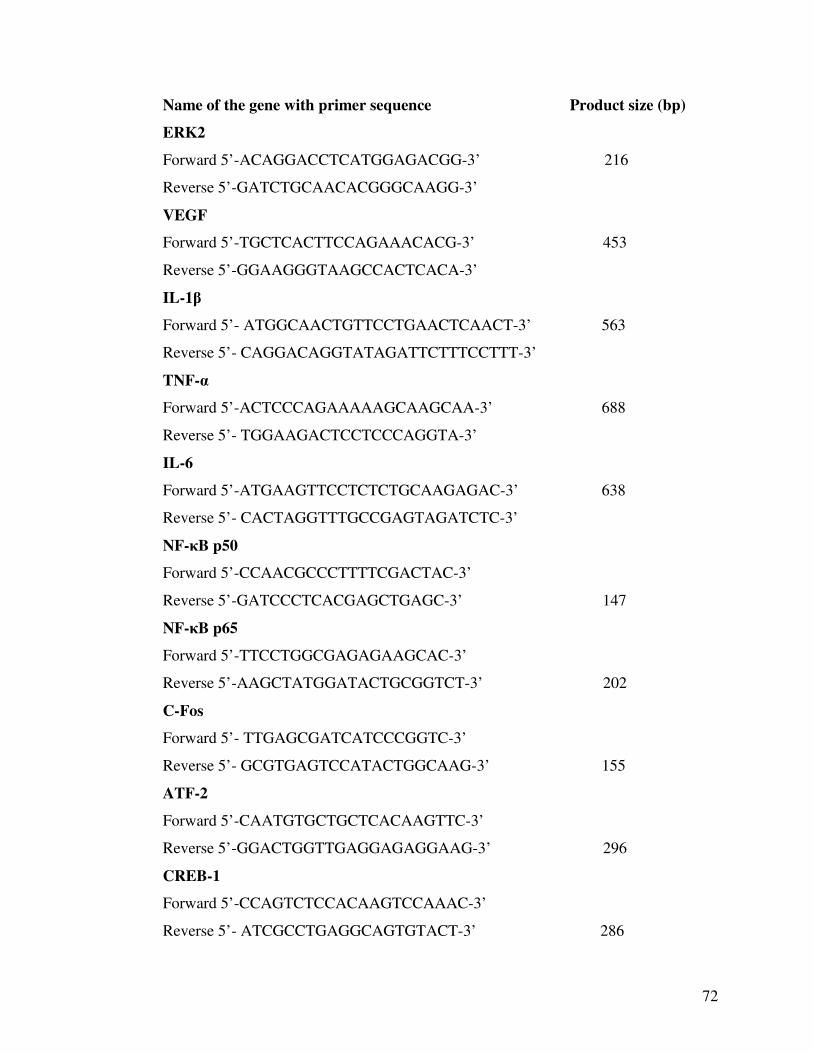
Name of the gene with primer sequence Product size (bp)
ERK2
Forward 5’-ACAGGACCTCATGGAGACGG-3’ 216
Reverse 5’-GATCTGCAACACGGGCAAGG-3’
VEGF
Forward 5’-TGCTCACTTCCAGAAACACG-3’ 453
Reverse 5’-GGAAGGGTAAGCCACTCACA-3’
IL-1β
Forward 5’- ATGGCAACTGTTCCTGAACTCAACT-3’ 563
Reverse 5’- CAGGACAGGTATAGATTCTTTCCTTT-3’
TNF-α
Forward 5’-ACTCCCAGAAAAAGCAAGCAA-3’ 688
Reverse 5’- TGGAAGACTCCTCCCAGGTA-3’
IL-6
Forward 5’-ATGAAGTTCCTCTCTGCAAGAGAC-3’ 638
Reverse 5’- CACTAGGTTTGCCGAGTAGATCTC-3’
NF-κB p50
Forward 5’-CCAACGCCCTTTTCGACTAC-3’
Reverse 5’-GATCCCTCACGAGCTGAGC-3’ 147
NF-κB p65
Forward 5’-TTCCTGGCGAGAGAAGCAC-3’
Reverse 5’-AAGCTATGGATACTGCGGTCT-3’ 202
C-Fos
Forward 5’- TTGAGCGATCATCCCGGTC-3’
Reverse 5’- GCGTGAGTCCATACTGGCAAG-3’ 155
ATF-2
Forward 5’-CAATGTGCTGCTCACAAGTTC-3’
Reverse 5’-GGACTGGTTGAGGAGAGGAAG-3’ 296
CREB-1
Forward 5’-CCAGTCTCCACAAGTCCAAAC-3’
Reverse 5’- ATCGCCTGAGGCAGTGTACT-3’ 286

73
Name of the gene with primer sequence Product size (bp)
Bid
Forward 5’-GCCGAGCACATCACAGACC-3’
Reverse 5’-TGGCAATGTTGTGGATGATTTCT-3’ 226
Bax
Forward 5’-CCGGCGAATTGGAGATGAACT-3’
Reverse 5’- CCAGCCCATGATGGTTCTGAT-3’ 229
Caspase 8
Forward - 5' TGCTTGGACTACATCCCACAC 3'
Reverse - 5' TGCAGTCTAGGAAGTTGACCA 3' 169
GAPDH (Glyceraldehyde 3 phosphate
dehydrogenase)
Forward 5’-TGCTGGCGCTGAGTACGTCGT-3’ 527
Reverse 5-’GTGGAGGAGTGGGTGTCGCTG-3’
Amplification of cDNA by RT-PCR for the analysis of the expression of genes during
the progression of metastasis
Reagents Quantity per sample
----------------------------------------------------------------
10X PCR buffer 2.0 µl
25mM MgCl2 0.4 µl
10mM dNTPs 0.4 µl
Primer (forward and reverse) 2.0+2.0 µl
Taq DNA polymerase 0.1µl
Molecular biology grade water 11.1 µl
-----------------------------------------------------------------
Total 18µl
The contents were vortexed and centrifuged and 2µl of the cDNA was added.
(The cDNA was diluted 1:1 and from the diluted cDNA preparation 2µl was taken for
the RT-PCR analysis).

74
The following PCR reaction profile was followed in the minicycler
940C - 2 minutes
940C - 1 minute
550C - 1 minute 39 cycles
720C - 1 minute
720C - 10 minutes
100C - Hold for 10 minutes
8 µl of the amplified sample was subjected to electrophoresis in an agarose gel
(1.5%) containing 0.5µg/mL ethidium bromide at 70V for 2 h in TE buffer (10mM
Tris HCl and 1mM EDTA, pH 10.0).
2.2.7.4. Detection of PCR products
10 µl of each PCR product resolved on 1.5% agarose gel electrophoresis.
Reagents
10 X TEB
Tris-HCl, pH 8.3 - 21.6g
EDTA - 0.372g
Boric acid - 11g
Made upto 200ml using double distilled water.
10X Loading dye
Bromophenol blue - 0.05%
TEB 10X pH 8.3 - 1ml
Glycerol - 100µl
i. Sufficient electrophoresis buffer (1X TEB buffer 0.08m Tris-phosphate and
0.002M EDTA) was used to fill the electrophoresis tank.
ii. Edges of a the clean, dry, plastic gel tray was sealed with sealing tape and
the comb was placed.
iii. Agarose powder (2%) added to the electrophoresis buffer and heated the

75
slurry in a boiling water bath or gas flame until the agarose dissolved and
the slurry became visible.
iv. Ethidium bromide was added to a final concentration of 5µg/ml to the
slurry, then poured to the sealed gel tray and allowed to cool for 30-45
minutes and the gel tray placed in the electrophoresis tank after removing
the sealing tape.
v. 10µl of PCR products mixed with 2µl of 10X gel loading buffer and loaded
into the wells.
vi. The samples were resolved at 100v until the dye has migrated up to the ¾th
length of the gel.
vii. The gels were examined using a gel-documentation system.
2.2.8. Microarray analysis
Logarithmically growing B16F-10 melanoma cells (1x 10⁷) were
incubated for 4 hours at 37°C in 5% CO2 atmosphere in the presence and absence of
test compounds and analyzed the gene expression profile using Agilent’s Mouse Array
slides. The total RNA and cRNA was purified using Qiagen’s RNeasy minikit. RNA
quality was checked using Bioanalyzer. Labeling was done by T7 promoter based-
linear RNA using Agilent’s low input RNA linear amplification Kit one color.
Hybridization was done using Agilent’s insitu hybridization kit. Normalization was
done using GeneSpring GX using the recommended Per Chip and Per Gene
Normalization. Data analysis was done using GeneSpring GX version 7.3 and
Microsoft Excel
2.2.9. Transcription factor profiling
Transcription Factor profiling was done with BD Mercury TransFactor kit
obtained from BD Biosciences (Shen et al., 2002). This kit provides rapid, high
throughput detection of specific transcription factor activities in cell extracts. Using
an enzyme-linked immunosorbent assay (ELISA)-based format, the Transfactor Kits
detect DNA binding by specific transcription factors. This method is faster, easier and
more sensitive than electrophoretic mobility shift assays (EMSA) and does not require
the use of radioactivity.

76
Principle
Each Transfactor kit was provided in a 96-well format with oligonucleotides
containing the consensus binding sequences for each transcription factor coated on the
wells. When cell extracts containing the transcription factors are incubated in the
wells, the DNA bind to their consensus sequences. A specific primary antibody was
then used to detect bound transcription factors. A horse radish peroxidase conjugated
secondary antibody was used to detect the bound primary antibody. The enzymatic
product was measured with standard micro titre plate reader.
Materials provided in the kit
Transfactor plate
Transfactor Rack
Primary antibody
Secondary antibody
Wild-Type competitor Oligos
TMB substrate
10 X Transfactor Buffer
Blocking Reagent
Stop solution (Na azide)
Transfactor ELISA procedure
Cytosolic and Nuclear Extract Preparation
The following procedure was used to prepare cytosolic or nuclear extracts
from cell line culture (Dignam et al 1983). This procedure is designed for extraction
from 1 × 10⁷ cells, which is roughly equivalent to three 15 cm tissue culture plates at
80% confluency. All steps were performed at 4oC unless otherwise specified.
Reagents were kept at 4oC during the procedure, and should not be used until fully
defrosted. Tubes and reagents were kept on ice when not centrifuging. All reagents
were centrifuged at 4oC in a pre-cooled rotor.

77
Materials Required
10 X Pre Lysis - Buffer
100mM HEPES (pH 7.9)
15mM MgCl2
100mM KCl
Pre -Extraction Buffer
20mM HEPES (pH 7.9)
1.5mM MgCl2
0.42M NaCl
0.2mM EDTA
25% (v/v) glycerol
Protease Inhibitor Cocktail
Aprotinin (1mg/ml) – 5µl
Leupeptin (1mg/ml) – 5µl
PMSF (100mM in Isopropanol) – 5µl
DTT (100mM in D.W.) – 10µl
Benzamidine (1mg/ml) – 5µl
Triton × 100 (10% in D.W) – 10µl
Tris pH 7.4 (1M) – 20µl
NaCl (5M) – 50µl
EDTA (0.5M) – 5µl
EGTA (10mg/ml) – 5µl
Make up this cocktail into 1ml and store at – 220C.
1 X Lysis Buffer
10 X Pre-Lysis buffer – 150µl
0.1 M DTT – 15µl
Protease inhibitor cocktail – 15µl
DD H2O – 1.32µl

78
a. Cell Lysis
1. Cells were collected after incubation using a cell scraper, and transferred to a
clean centrifuge tube , centrifuged for 5 minutes at 450 x g. Supernatant was
decanted.
2. The cell pellet were rinsed with ice cold PBS and centrifuged for 5 minutes at
450 x g and supernatant were decanted.
3. Cell pellet volume was estimated using a micropipette and this volume was
used in subsequent step of this procedure.
4. Five times volume of lysis buffer to the cell pellet volume was added to the
cell pellets.
5. The cell pellets were resuspended gently with out the formation of foam and
incubated for 15 minutes on ice.
6. The cell suspension was centrifuged for 5 minutes at 420 × g and the
supernatants were discarded and the cell pellet resuspended in a volume of
lysis buffer equal to twice the cell pellet volume.
b. Cell Disruption
1. Cell suspension in the lysis buffer was filled in a syringe with narrow gauge
needle (No. 27).
2. All air from the syringe removed as fully as possible.
3. The cell suspension ejected with a rapid stroke. The steps 1-3 were repeated
for 10 times.
4. The disrupted cell suspensions were centrifuged at 10000-11000 × g for 20
minutes.
5. Transfer the supernatant was transferred to a fresh tube and this fraction is
known as the cytosolic fraction.
c. Nuclear Extraction
1. Nuclear extraction buffer by mixing the following reagents as follows,
Pre- extraction Buffer – 147µl
0.1 M DTT – 1.5µl
Protease inhibitor cock-tail – 1.5µl
79
2. The crude nuclear pellet obtained in Step b.5 (above) suspended in a volume
of nuclear extraction buffer equal to two-third (2/3) of the cell pellet volume
3. The nuclei were disrupted by using a fresh syringe as step b.1 - b.3.
4. Nuclear suspension were allowed to shake gently for 30 min at 4OC
5. The nuclear suspension was centrifuged at 20000-21000 × g for 5 min.
6. The supernatant were transferred to a clean, chilled test tube and this fraction
is the nuclear extract.
7. The protein concentration of the nuclear extract was measured by Bradford
method.
8. The supernatant was aliquoted in small vials and stored at – 70
0C.
d. Determination of protein concentration of the nuclear extract by Bradford
Method
This is a rapid, simple and sensitive method for the estimation of proteins in a
sample extract. The colour development was virtually complete in 2 minutes and the
colour was stable for 1 h. The procedure is based on the interaction of a dye,
Coomassie Brilliant Blue with proteins. The unbound dye has an absorbance
maximum at 465 nm. However on interaction with proteins the dye turns blue and its
absorbance at 595 nm the amount of protein in a sample solution can be quantitatively
estimated.
Materials and Reagents
Bradford Reagent.
100mg of Coomassie brilliant blue G250 was dissolved in 50ml of ethanol,
100ml of 85% phosphoric acid was added and made upto IL with water.
Procedure
0.1ml of sample solution was made up to the volume of 1ml with 0.1M phosphate
buffer (pH 7.5). 5ml of Bradford reagent was added to the sample and mixed
thoroughly. Absorbance was recorded at 595nm against the blank and the protein
concentrations were determined from the standard curve.
e. Transfactor ELISA Procedure
Assay wells were incubated with 150µl of 1X Transfactor buffer for 15 minutes at
room temperature. Nuclear extracts (6µl) were made up to 50µl with 1X Transfactor

80
buffer and added to the assay wells and incubated 60 minutes at room temperature.
Wells were washed with 1X Transfactor buffer and incubated with 100µl primary
antibody at room temperature for 60 minutes, then washed with 1X Transfactor buffer
and incubated with 100µl of secondary antibody at room temperature for 30 minutes.
Wells are washed with 1X Transfactor buffer and incubated with 100µl of TMB
substrate to each well and incubated at room temperature for 10 minutes. After seeing
the blue colour development the reaction were stopped by adding 100ml of sodium
azide stop solution. Absorbance was measured at 655 nm.
2.2.10. Statistical Data Analysis
All data were expressed as mean ± S.D. Statistical analysis was done by Student’s
‘t’ test and Kruskal-Wallis test (nonparametric ANOVA-Dunn’s multiple comparison
test) using Graphpad InStat version 3.00 for Windows 95, GraphPad Software, San
Diego, California, USA.


![shodhganga.inflibnet.ac.inshodhganga.inflibnet.ac.in/bitstream/10603/19617/13/13_chapter2.pdf · [Netzahuatl-Muñoz et al. 2012]. Terminalia catappa (almond tree) biomass acts as](https://static.fdocuments.us/doc/165x107/5ecbad41dfc2e458d25c4aca/netzahuatl-muoz-et-al-2012-terminalia-catappa-almond-tree-biomass-acts-as.jpg)