Chapter 2: Market Insight Disclaimer: All logos, photos, etc. used in this presentation are the...
30
Chapter 2: Market Insight Disclaimer: • All logos, photos, etc. used in this presentation are the property of their respective copyright owners and are used here for educational purposes only an Sorger 2015. www.StephanSorger.com ; Marketing Analytics: Market Insight C
-
Upload
geoffrey-leonard -
Category
Documents
-
view
216 -
download
1
Transcript of Chapter 2: Market Insight Disclaimer: All logos, photos, etc. used in this presentation are the...

Chapter 2:
Market Insight
Disclaimer:• All logos, photos, etc. used in this presentation are the property of their respective copyright owners and are used here for educational purposes only
© Stephan Sorger 2015. www.StephanSorger.com; Marketing Analytics: Market Insight Ch. 2.1

Outline/ Learning Objectives
Topic Description
Terminology Know the difference between markets and products
Data Sources Assemble your go-to list of data sources
Sizing Practice sizing with reports, top-down, and bottom-up
Trends Find trends using PESTLE & Porter 5 Forces techniques
© Stephan Sorger 2015. www.StephanSorger.com; Marketing Analytics: Market Insight Ch. 2.2
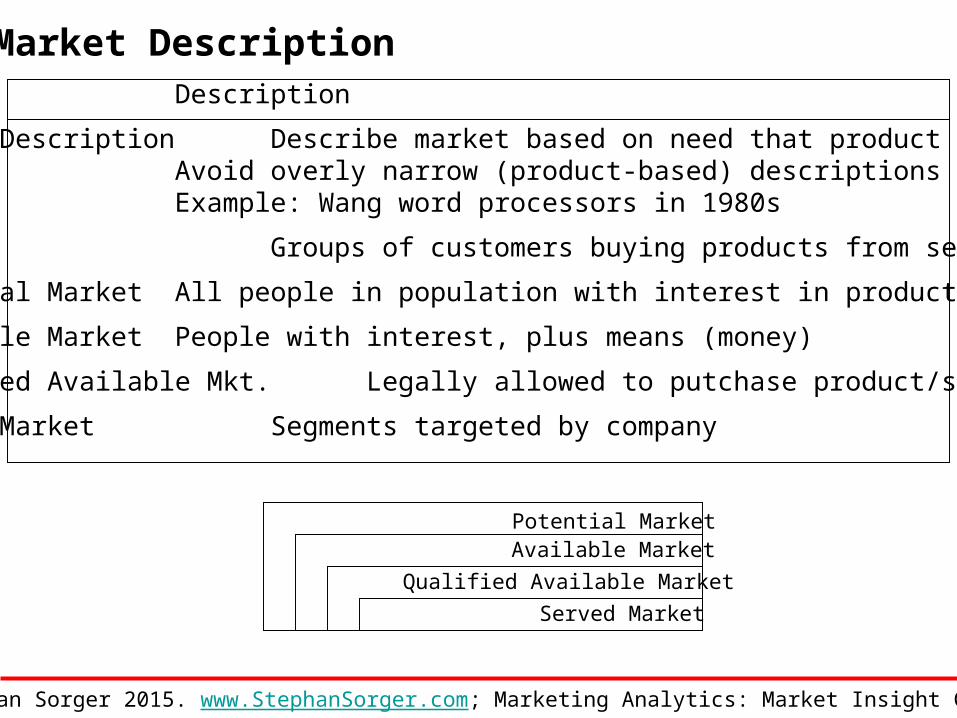
Topic Description
Market Description Describe market based on need that product fulfillsAvoid overly narrow (product-based) descriptionsExample: Wang word processors in 1980s
Market Groups of customers buying products from sellers
Potential Market All people in population with interest in product/service
Available Market People with interest, plus means (money)
Qualified Available Mkt. Legally allowed to putchase product/service
Served Market Segments targeted by company
Market Description
Served Market
Potential MarketAvailable Market
Qualified Available Market
© Stephan Sorger 2015. www.StephanSorger.com; Marketing Analytics: Market Insight Ch. 2.3
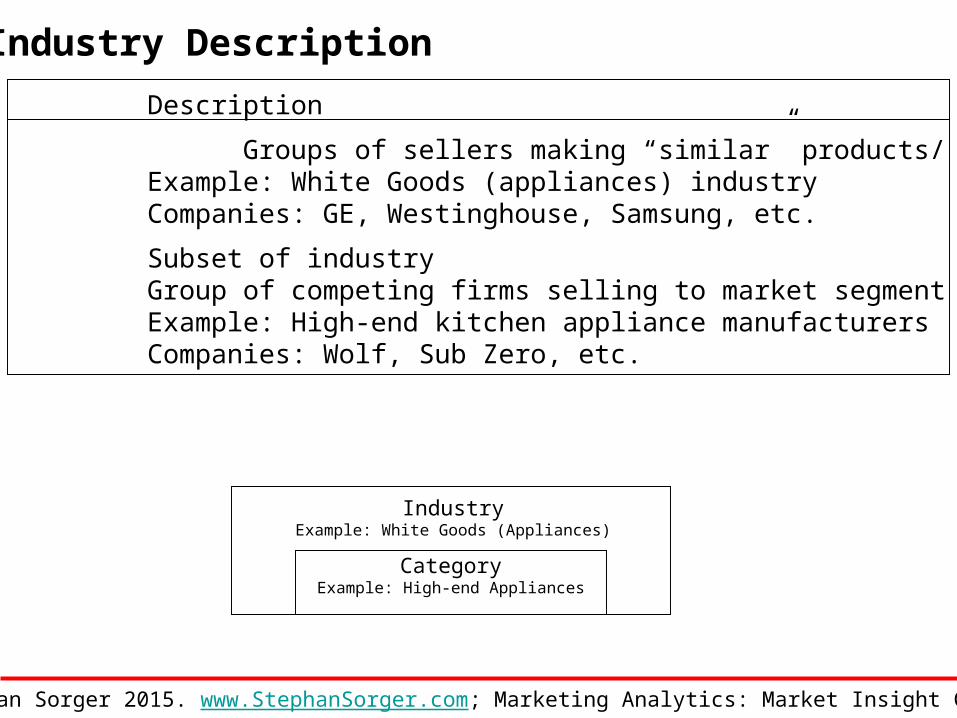
Topic Description
Industry Groups of sellers making “similar” products/ servicesExample: White Goods (appliances) industryCompanies: GE, Westinghouse, Samsung, etc.
Category Subset of industryGroup of competing firms selling to market segmentExample: High-end kitchen appliance manufacturersCompanies: Wolf, Sub Zero, etc.
Industry Description
IndustryExample: White Goods (Appliances)
CategoryExample: High-end Appliances
© Stephan Sorger 2015. www.StephanSorger.com; Marketing Analytics: Market Insight Ch. 2.4

Market Data Sources
Secondary Research
Government DataAnalyst Reports
Business and Trade Publications
Other Sources
Commissioned ReportsB2C: Retail Salespeople
B2B: Company Salespeople
Surveys
Primary Research
© Stephan Sorger 2015. www.StephanSorger.com; Marketing Analytics: Market Insight Ch. 2.5

Government Data
Government Data
U.S. Census Bureau: Census every 10 years, plus New American Community estimatesU.S. Bureau of Labor and Statistics: Data on employment, productivity, inflation, etc.
U.S. Bureau of Economic Analysis: Data on national GDP, regional GDP, personal income,..
Local Chambers of Commerce: Data on local area
© Stephan Sorger 2015. www.StephanSorger.com; Marketing Analytics: Market Insight Ch. 2.6
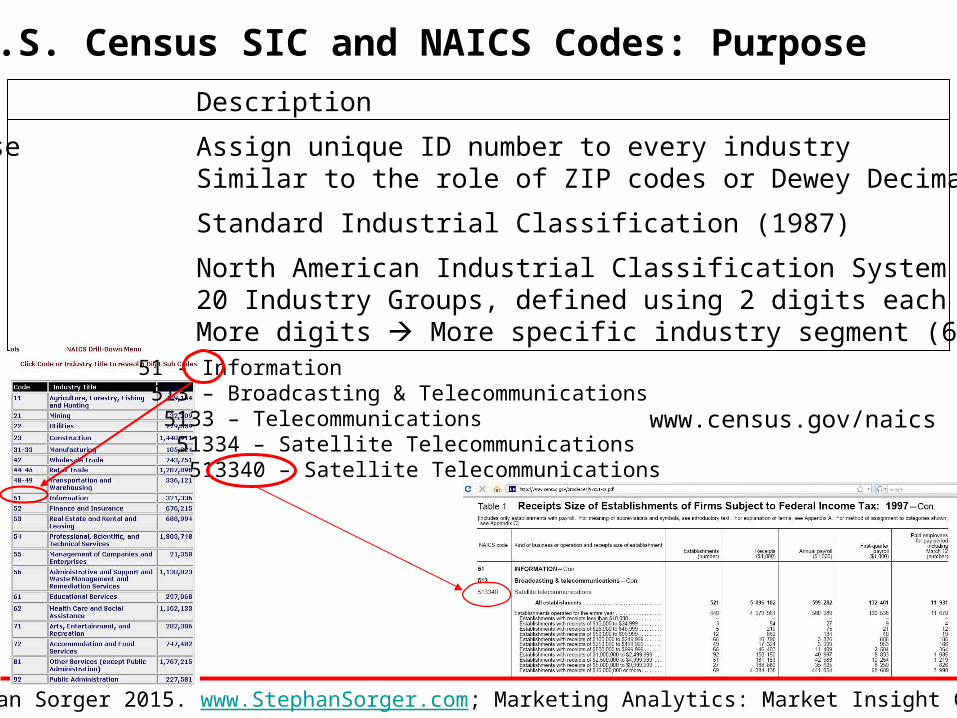
Topic Description
Purpose Assign unique ID number to every industrySimilar to the role of ZIP codes or Dewey Decimal
SIC Standard Industrial Classification (1987)
NAICS North American Industrial Classification System (1997)20 Industry Groups, defined using 2 digits eachMore digits More specific industry segment (6 max)
U.S. Census SIC and NAICS Codes: Purpose
51 - Information 513 – Broadcasting & Telecommunications 5133 – Telecommunications 51334 – Satellite Telecommunications 513340 – Satellite Telecommunications
www.census.gov/naics
© Stephan Sorger 2015. www.StephanSorger.com; Marketing Analytics: Market Insight Ch. 2.7
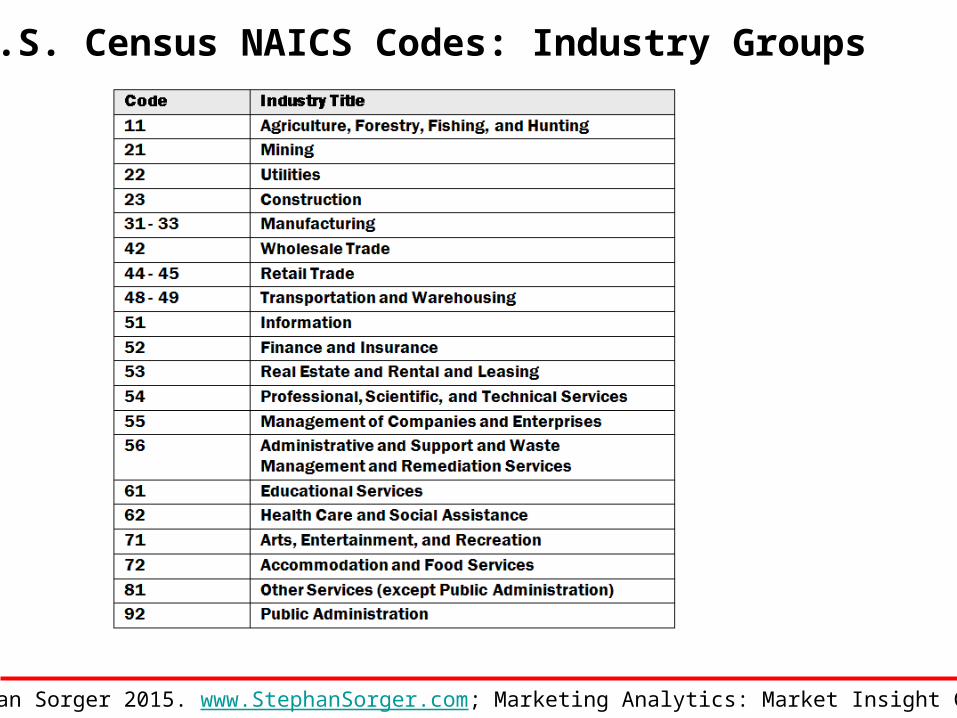
U.S. Census NAICS Codes: Industry Groups
© Stephan Sorger 2015. www.StephanSorger.com; Marketing Analytics: Market Insight Ch. 2.8

U.S. Census NAICS Codes: Industry Example
© Stephan Sorger 2015. www.StephanSorger.com; Marketing Analytics: Market Insight Ch. 2.9
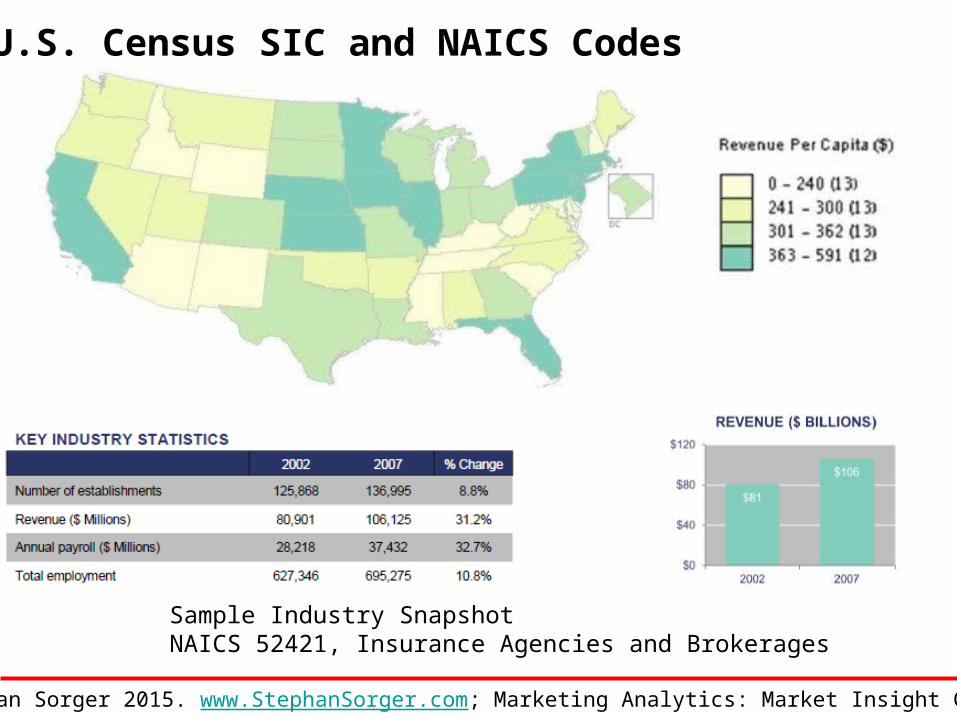
U.S. Census SIC and NAICS Codes
Sample Industry SnapshotNAICS 52421, Insurance Agencies and Brokerages
© Stephan Sorger 2015. www.StephanSorger.com; Marketing Analytics: Market Insight Ch. 2.10

Data Source Description
Analyst Reports Available published market reports by industry analystsAnalysts cover popular markets and publish reportsOften cover market size, growth rate, and trendsExpensive: $1,000+ per report; $10,000+ subscriptionB2C: Arbitron, Dun & Bradstreet, NielsenB2B: Forrester, Gartner, IDC
Commissioned Specialty firms can conduct custom market researchGet exactly the data you needSlow; Can take weeks to get the dataVery expensive: $15,000+ per report
Market Sizing: Data Sources: Reports
Just some of manyB2C analyst firms
© Stephan Sorger 2015. www.StephanSorger.com; Marketing Analytics: Market Insight Ch. 2.11
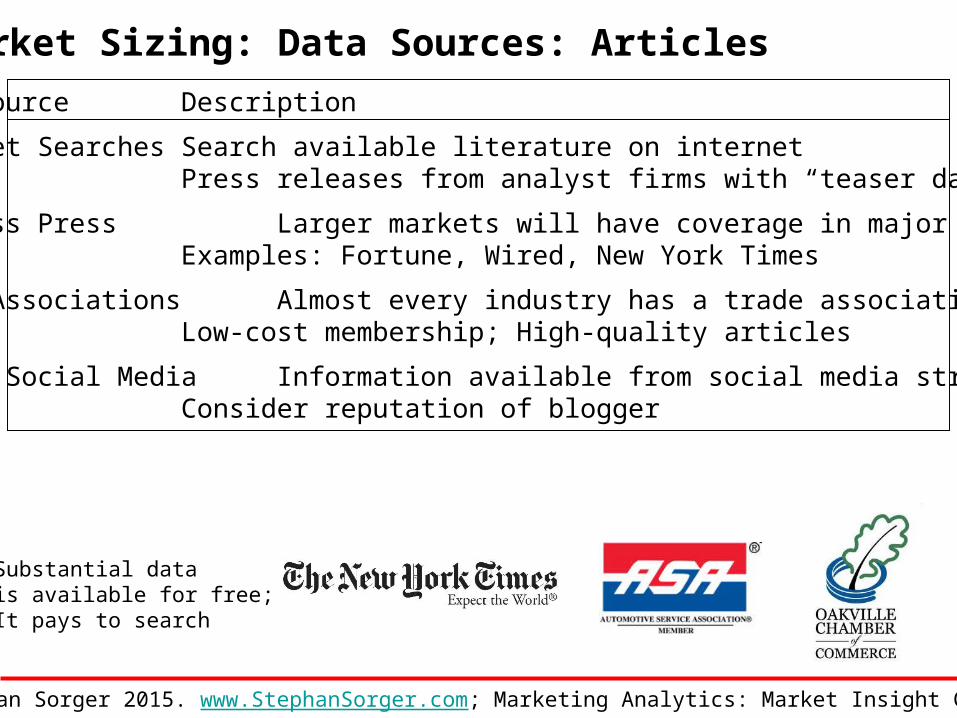
Data Source Description
Internet Searches Search available literature on internetPress releases from analyst firms with “teaser data”
Business Press Larger markets will have coverage in major mediaExamples: Fortune, Wired, New York Times
Trade Associations Almost every industry has a trade associationLow-cost membership; High-quality articles
Blogs, Social Media Information available from social media streamConsider reputation of blogger
Market Sizing: Data Sources: Articles
Substantial datais available for free;It pays to search
© Stephan Sorger 2015. www.StephanSorger.com; Marketing Analytics: Market Insight Ch. 2.12

Market Sizing: Stakeholders
Channel Partners
Financial Services
Marketing Departments
Operations Departments
Stakeholdersfor
Market Sizing
- Investigate new markets- Calculate market share
- Products manufacturing: how many units to make- Service delivery: how many people to hire
- Number of units to move through channel
-VC: Large and growing market-- $500M - $1B
© Stephan Sorger 2015. www.StephanSorger.com; Marketing Analytics: Market Insight Ch. 2.13
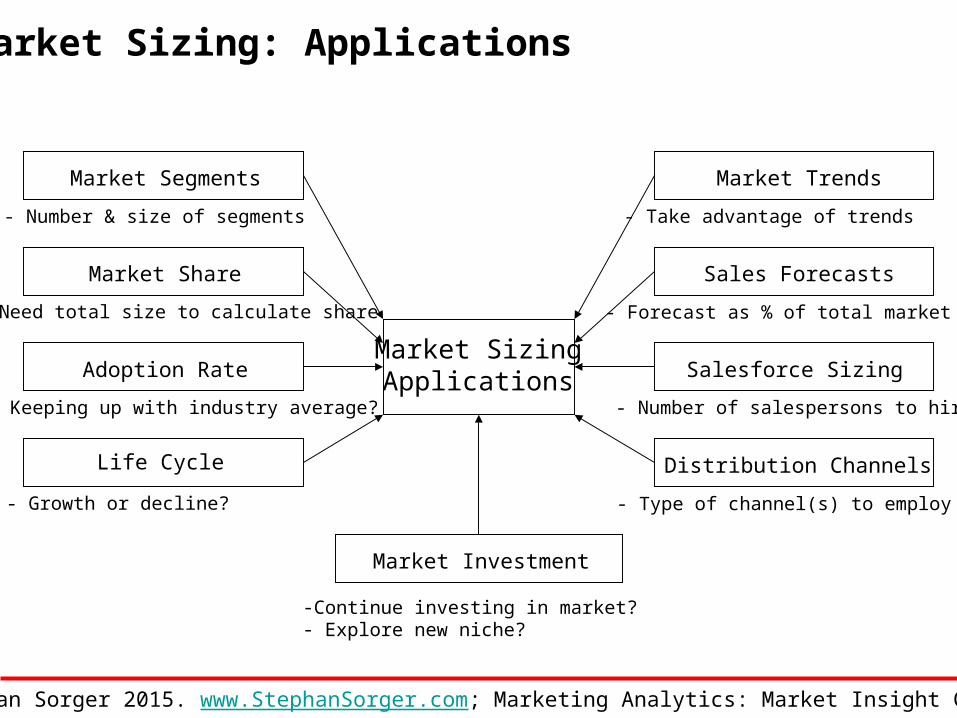
Market Sizing: Applications
Market SizingApplications
Market Trends
Sales Forecasts
Salesforce Sizing
Distribution Channels
Market Segments
Market Share
Adoption Rate
Life Cycle
Market Investment
-Continue investing in market?- Explore new niche?
- Number & size of segments
- Need total size to calculate share
- Keeping up with industry average?
- Growth or decline?
- Take advantage of trends
- Forecast as % of total market
- Number of salespersons to hire
- Type of channel(s) to employ
© Stephan Sorger 2015. www.StephanSorger.com; Marketing Analytics: Market Insight Ch. 2.14

Market Sizing Approach: Top Down
* Factor 1 =
General Market
Objective Market
Intermediate Market 1
* Factor 2 = Intermediate Market 2
* Factor 3 =
© Stephan Sorger 2015. www.StephanSorger.com; Marketing Analytics: Market Insight Ch. 2.15

Market Sizing Approach: Top Down
Example General Market/ Population Values
© Stephan Sorger 2015. www.StephanSorger.com; Marketing Analytics: Market Insight Ch. 2.16
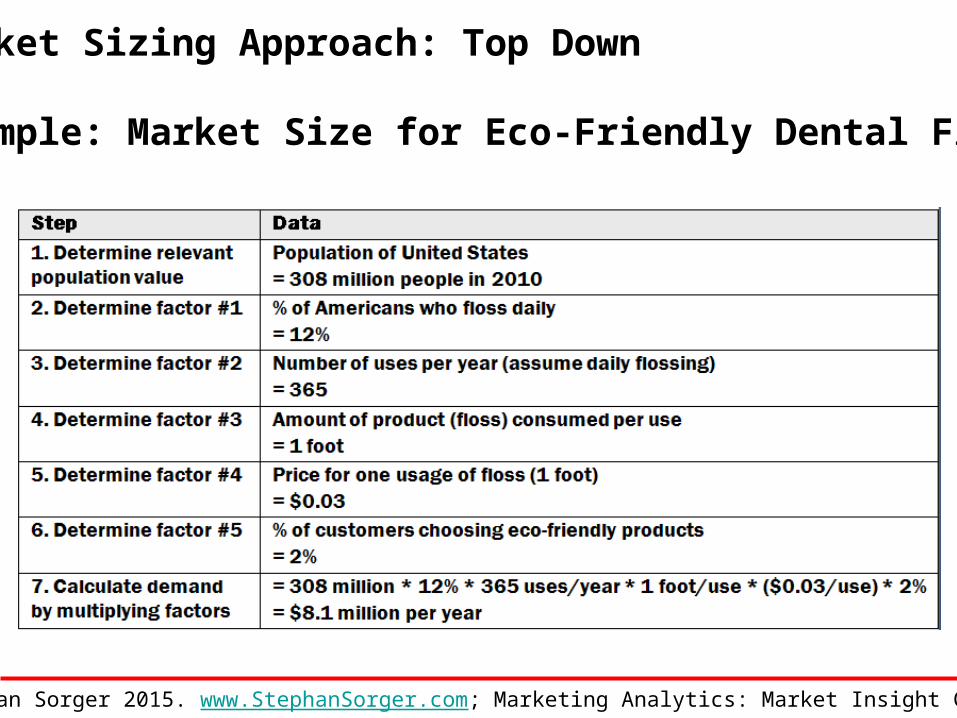
Market Sizing Approach: Top Down
Example: Market Size for Eco-Friendly Dental Floss
© Stephan Sorger 2015. www.StephanSorger.com; Marketing Analytics: Market Insight Ch. 2.17
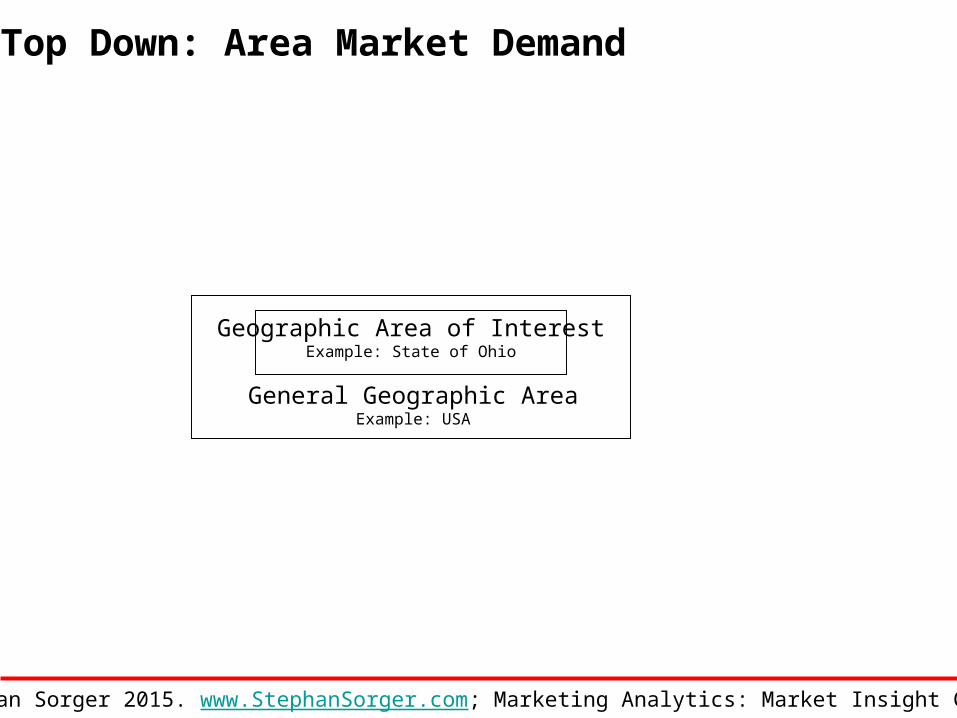
Top Down: Area Market Demand
General Geographic AreaExample: USA
Geographic Area of InterestExample: State of Ohio
© Stephan Sorger 2015. www.StephanSorger.com; Marketing Analytics: Market Insight Ch. 2.18

Top Down: Area Market Demand
Multiple-Factor Index ExampleEco-friendly floss market for state of Ohio
© Stephan Sorger 2015. www.StephanSorger.com; Marketing Analytics: Market Insight Ch. 2.19

Bottom Up
Add up sales from each potential market segment
Sub-Segment 1 Sub-Segment 2 Sub-Segment 3
Market
Example: Total demand for TBM (tunnel boring machines)
Municipalities Major Construction CompaniesBechtel, etc.
International sales
© Stephan Sorger 2015. www.StephanSorger.com; Marketing Analytics: Market Insight Ch. 2.20

Bottom Up: Niche Market Process
© Stephan Sorger 2015. www.StephanSorger.com; Marketing Analytics: Market Insight Ch. 2.21
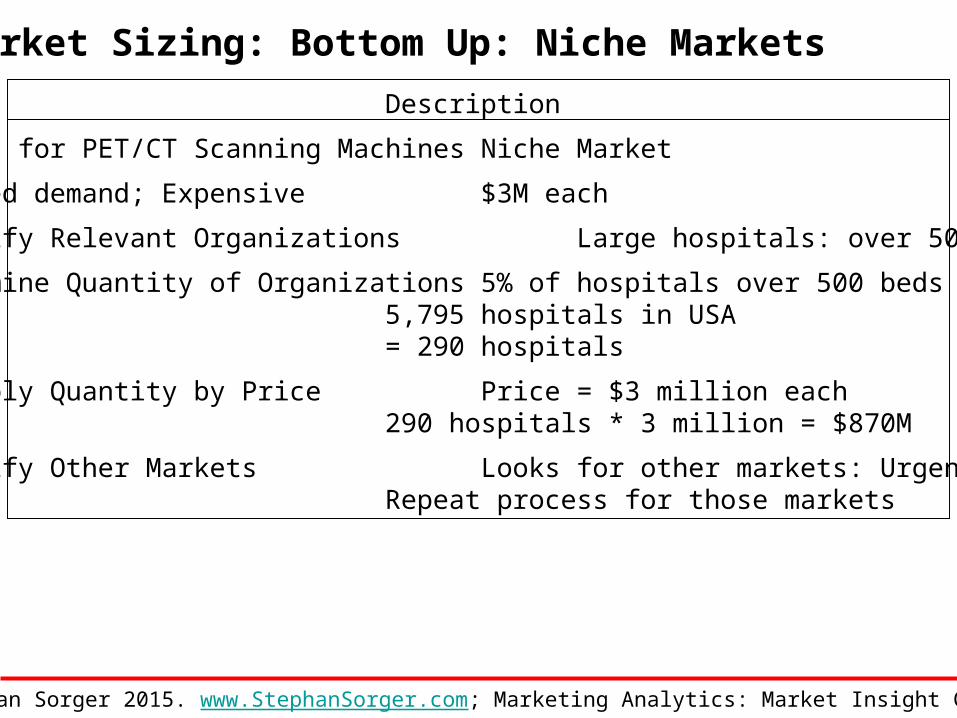
Topic Description
Market for PET/CT Scanning Machines Niche Market
Limited demand; Expensive $3M each
Identify Relevant Organizations Large hospitals: over 500 beds
Determine Quantity of Organizations 5% of hospitals over 500 beds5,795 hospitals in USA= 290 hospitals
Multiply Quantity by Price Price = $3 million each290 hospitals * 3 million = $870M
Identify Other Markets Looks for other markets: Urgent CareRepeat process for those markets
Market Sizing: Bottom Up: Niche Markets
© Stephan Sorger 2015. www.StephanSorger.com; Marketing Analytics: Market Insight Ch. 2.22
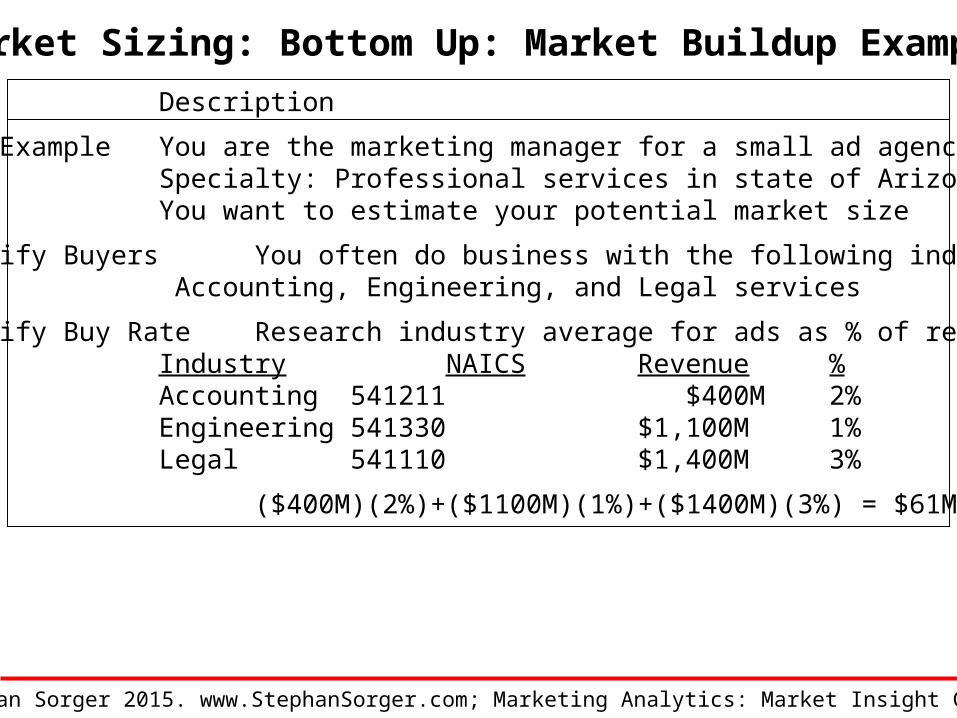
Topic Description
Buildup Example You are the marketing manager for a small ad agencySpecialty: Professional services in state of ArizonaYou want to estimate your potential market size
1. Identify Buyers You often do business with the following industries: Accounting, Engineering, and Legal services
2. Identify Buy Rate Research industry average for ads as % of revenue:Industry NAICS Revenue %Accounting 541211 $400M 2%Engineering 541330 $1,100M 1%Legal 541110 $1,400M 3%
3. Sum ($400M)(2%)+($1100M)(1%)+($1400M)(3%) = $61M
Market Sizing: Bottom Up: Market Buildup Example
© Stephan Sorger 2015. www.StephanSorger.com; Marketing Analytics: Market Insight Ch. 2.23

Market Sizing: Bottom Up: Limited Distribution
Channel 1
Aggregate Market
Channel 2 Channel 3 Channel 4 Channel 5 Channel 6
Individual Customers
Example: Only 39 Ferrari dealerships in entire United States of America
© Stephan Sorger 2015. www.StephanSorger.com; Marketing Analytics: Market Insight Ch. 2.24

PESTLE Trend Analysis
Economic Forces
Social Forces
Technological Forces
Legal Forces
Environmental Forces
Political Forces
PESTLETrend Analysis
Present Future
Fast Forwardinto Future
© Stephan Sorger 2015. www.StephanSorger.com; Marketing Analytics: Market Insight Ch. 2.25
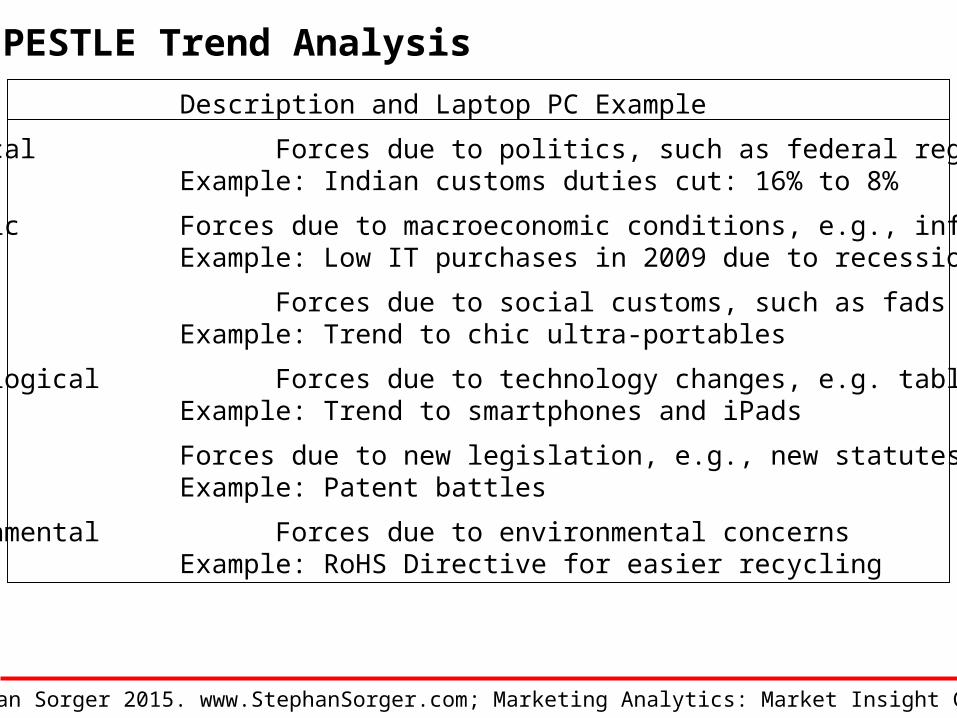
Force Description and Laptop PC Example
Political Forces due to politics, such as federal regulationsExample: Indian customs duties cut: 16% to 8%
Economic Forces due to macroeconomic conditions, e.g., inflationExample: Low IT purchases in 2009 due to recession
Social Forces due to social customs, such as fadsExample: Trend to chic ultra-portables
Technological Forces due to technology changes, e.g. tablet PCsExample: Trend to smartphones and iPads
Legal Forces due to new legislation, e.g., new statutesExample: Patent battles
Environmental Forces due to environmental concernsExample: RoHS Directive for easier recycling
PESTLE Trend Analysis
© Stephan Sorger 2015. www.StephanSorger.com; Marketing Analytics: Market Insight Ch. 2.26
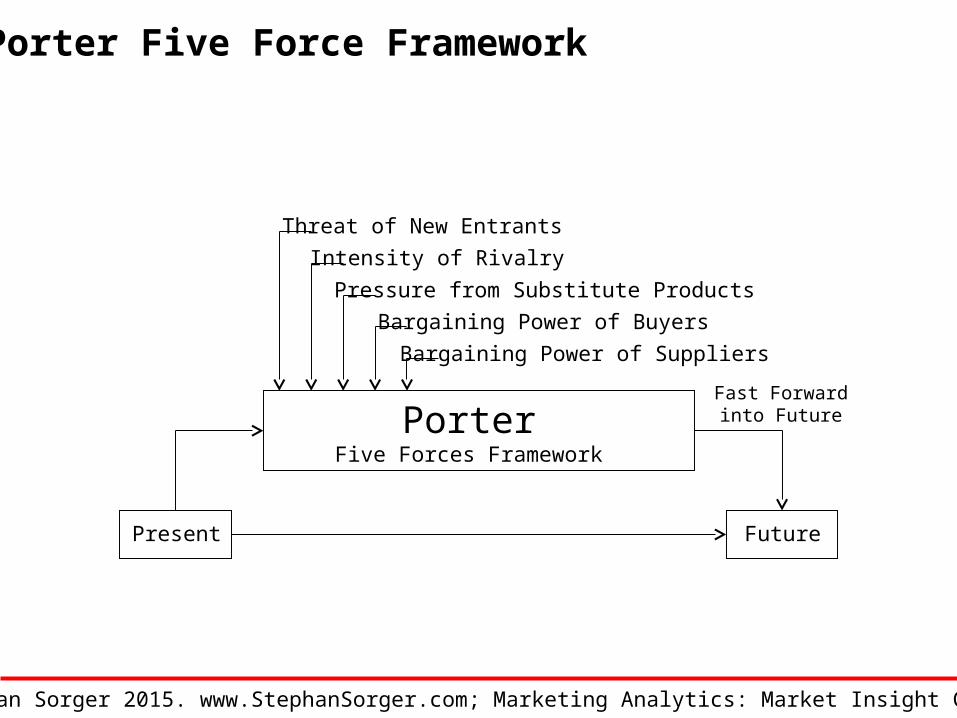
Porter Five Force Framework
Threat of New Entrants
Intensity of Rivalry
Pressure from Substitute Products
Bargaining Power of Buyers
Bargaining Power of Suppliers
PorterFive Forces Framework
Present Future
Fast Forwardinto Future
© Stephan Sorger 2015. www.StephanSorger.com; Marketing Analytics: Market Insight Ch. 2.27
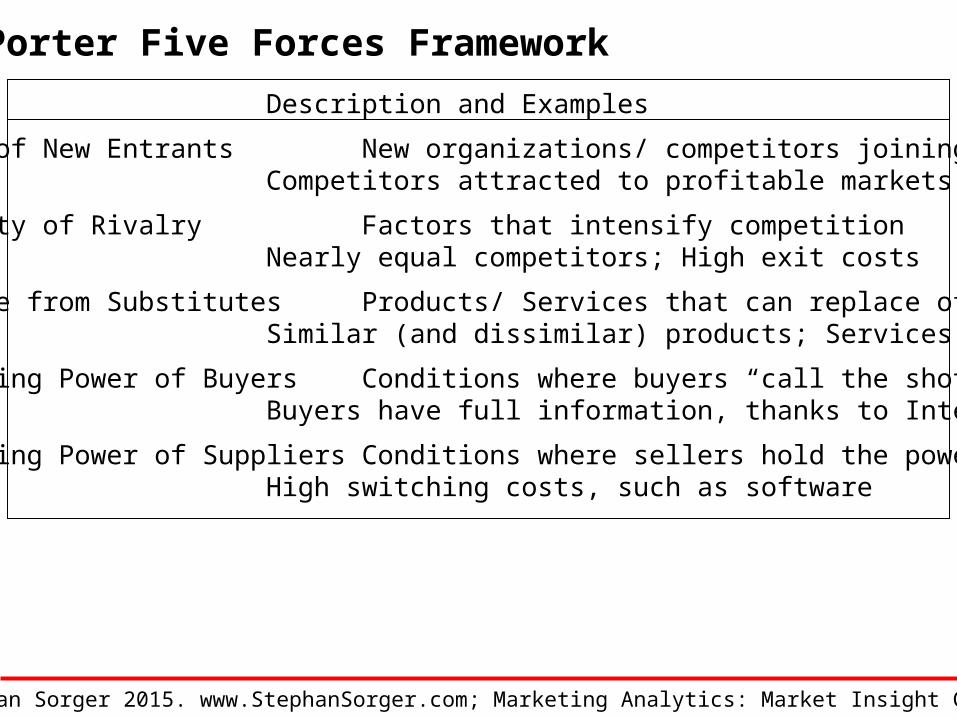
Force Description and Examples
Threat of New Entrants New organizations/ competitors joining industryCompetitors attracted to profitable markets
Intensity of Rivalry Factors that intensify competitionNearly equal competitors; High exit costs
Pressure from Substitutes Products/ Services that can replace offeringSimilar (and dissimilar) products; Services
Bargaining Power of Buyers Conditions where buyers “call the shots” Buyers have full information, thanks to Internet
Bargaining Power of Suppliers Conditions where sellers hold the powerHigh switching costs, such as software
Porter Five Forces Framework
© Stephan Sorger 2015. www.StephanSorger.com; Marketing Analytics: Market Insight Ch. 2.28

Porter Five Force Framework: Groupon in 2012Threat of New Entrants
Intensity of Rivalry
Pressure from Substitute Products
Bargaining Power of Buyers
Bargaining Power of Suppliers
PorterFive Forces Framework
Present Future
Fast Forwardinto Future
Not good: Few barriers to entry
Not good: LivingSocial, Amazon, Google, etc.
Not good: Many substitutes: FatWallet, etc.
Not good: Undifferentiated services
Not good: Not essential to buyers
© Stephan Sorger 2015. www.StephanSorger.com; Marketing Analytics: Market Insight Ch. 2.29

Check for Understanding
Topic Description
Terminology Know the difference between markets and products
Data Sources Assemble your go-to list of data sources
Sizing Practice sizing with reports, top-down, and bottom-up
Trends Find trends using PESTLE & Porter 5 Forces techniques
© Stephan Sorger 2015. www.StephanSorger.com; Marketing Analytics: Market Insight Ch. 2.30