CHAPTER 2 LITERATURE REVIEW -...
30
7 CHAPTER 2 LITERATURE REVIEW 2.1 Aquifer systems Water resources of earth can be classified as surface water and ground water in which groundwater is the main source for the domestic, agricultural and industrial needs. Groundwater is an important part of the hydrologic cycle. Various components of a hydrological cycle are shown in Fig. 2.1 Fig. 2.1: The hydrological cycle (Source: From website water.com) Precipitation, Infiltration, Evapotranspiration (Evaporation + Transpiration), Surface Runoff and Groundwater flow are the major components of a hydrological cycle (Todd and Mays, 2005; Viessman and Lewis, 2007). Once water from precipitation enters into the subsurface by infiltration it percolates down through different layers of soil material
Transcript of CHAPTER 2 LITERATURE REVIEW -...

7
CHAPTER 2
LITERATURE REVIEW
2.1 Aquifer systems
Water resources of earth can be classified as surface water and ground water in which
groundwater is the main source for the domestic, agricultural and industrial needs.
Groundwater is an important part of the hydrologic cycle. Various components of a
hydrological cycle are shown in Fig. 2.1
Fig. 2.1: The hydrological cycle (Source: From website water.com)
Precipitation, Infiltration, Evapotranspiration (Evaporation + Transpiration), Surface
Runoff and Groundwater flow are the major components of a hydrological cycle (Todd
and Mays, 2005; Viessman and Lewis, 2007). Once water from precipitation enters into
the subsurface by infiltration it percolates down through different layers of soil material

8
or water bearing formation (also called as aquifers) to reach the rock material that is
saturated with water. Water under the earth is stored in the void spaces between these
rock particles in different layers. These voids or interstices act as conduits for water
transmission and also as reservoirs to store water and are governed by the geological
processes that decides the porosity of the rock material. Water under the earth can be
broadly divided into two layers or zones, zone of aeration and saturation (Fig 2.2). The
layer just below the surface is called zone of aeration or vadose zone or unsaturated zone
where gaps (interstices) between soil particles are filled with both air and water. Below
this layer is the zone of saturation, a huge storehouse of water where all the voids are
filled with water. The boundary between these two layers is defined as water table or
phreatic surface and marks upper surface of the zone of saturation.
Fig. 2.2: Divisions of subsurface water (Source: “Ground Water Resources in Time
of Drought” October issue ROCKTALK, Colorado Geological Survey)
A belt of soil moisture exits within the zone of aeration from which plants draw
their moisture (Leet and Judson, 1959; Todd and Mays, 2005). Water in this area is held
by molecular attraction and water present in this soil-water zone depends predominantly
on recent precipitation. During the periods of ground-water recharge water gets added to
this zone in excess of the amount that can be held by molecular attraction, and the excess
percolates downward to the water table through voids of the vadose zone. An

9
intermediate belt of vadose water (zone) lies between the soil moisture layer and the
capillary fringe (Fig 2.2). Water in this zone moves downward through the interstices of
the rock material during groundwater replenishment to add to the water table. Thickness
of this vadose zone may vary from a few centimeters (or even zero) to hundreds to metres
depending upon the topography, geology and climate etc. In between the intermediate
belt and the water table lies the capillary fringe (zone) in which water is held up from the
zone of saturation by capillary force. The capillary fringe may be very thin (or even
absent) in coarse grained materials, but it may be several metres thick in fine-grained
materials (Todd and Mays, 2005). Water table is pseudo surface below which the pore
spaces in soil are saturated with water. This is known as zone of saturation.
Fig. 2.3: A cross-sectional view of unconfined and confined aquifer (Source:
From website geocities)
Water entering the groundwater reservoirs either by natural recharge or by artificial
means flows out due to gravity or when extracted by wells etc. These aquifers may be
defined as unconfined or confined. In an unconfined aquifer water table varies depending
upon the recharge and discharge (natural or by pumping) processes. Wells tapping the
water from unconfined aquifers can be used to measure groundwater levels (depth to
water table) and its variation with time and space. Such an aquifer is shown in Fig.2.3.
These are also sometimes called as water table or phreatic aquifers. Typically an

10
unconfined aquifer does not have any confining layer (of impermeable material) between
it and the surface. On the other hand in a confined aquifer groundwater is confined by
impermeable strata and is under pressure greater the atmospheric pressure. If a well is
used to tap water from a confined aquifer, the water level rises above the confining bed
(upto piezometric surface) and even flows out as shown by artesian well and a flowing
well respectively (Fig. 2.3). Piezometric surface is an imaginary level that coincides with
hydrostatic pressure of water in the confined aquifer. Water enters into confined aquifer
from the area where the impermeable layer i.e. confining bed rises to the surface level as
shown by recharge area in Fig. 2.3. Completely confined or unconfined aquifer rarely
occurs (Todd and Mays, 2005). Semiconfined or leaky aquifers are very common where
permeable layer is lies either above or below a semipervious aquitard or semiconfining
layer.
2.2 Groundwater: Its exploitation and sustainability
Groundwater is an important part of the hydrologic cycle as it sustains life. Because of its
several inherent qualities (e.g. consistent temperature, widespread and continuous
availability, excellent natural quality, limited vulnerability, low development cost,
drought reliability, etc.), it has become an immensely important and dependable source of
water supplies in all climatic regions including both urban and rural areas of developed
and developing countries (Todd and Mays, 2005). The principal source of groundwater
recharge is the precipitation. Reservoirs, lakes, stream flows, return flow from irrigated
fields and seepage from canals also contributes to groundwater recharge. Special water
harvesting structures are installed to augment natural recharge in the region. Natural
discharge occurs mostly as flow to the surface from springs and flow to surface water
bodies such as streams, lakes and oceans. Groundwater present near the surface as soil
moisture may also returns to surface by the process of evapotranspiration. However the
major discharge of groundwater by artificial means is through pumping from wells to
cater water requirement for domestic, agricultural and industrial usage.
Increased demand for water has stimulated development of groundwater supply. It
has emerged as one of the principal source of water for irrigation over the past two
11
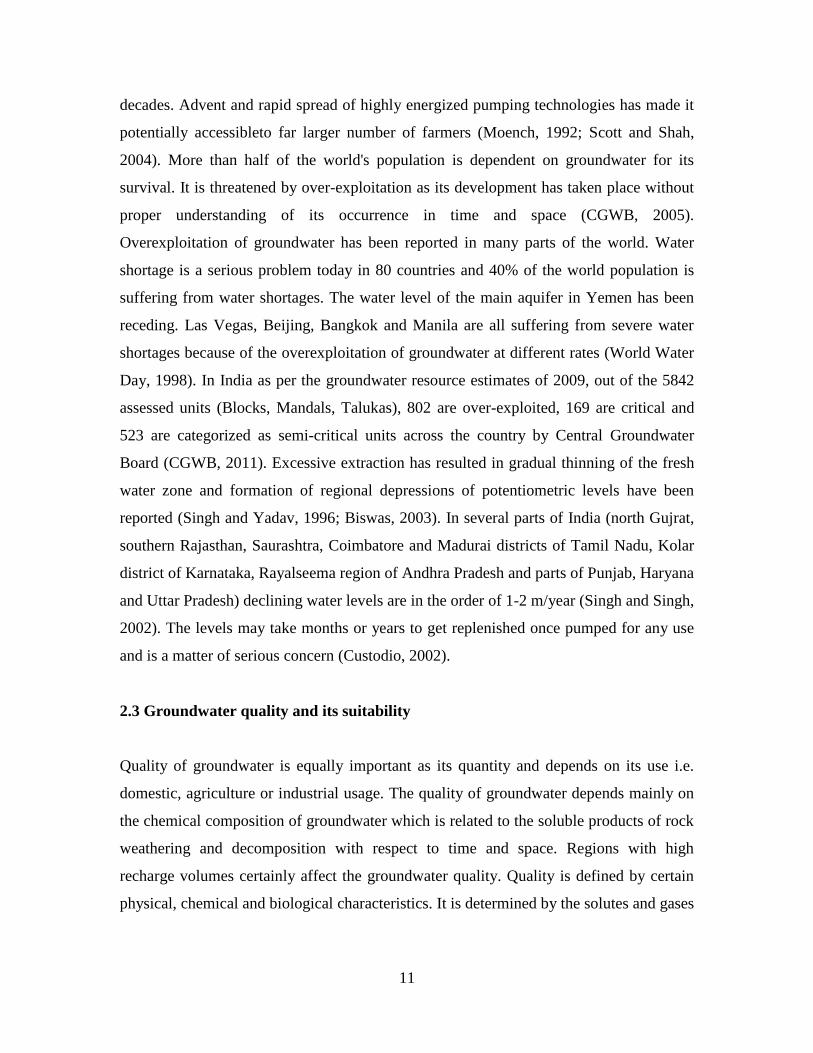
decades. Advent and rapid spread of highly energized pumping technologies has made it
potentially accessibleto far larger number of farmers (Moench, 1992; Scott and Shah,
2004). More than half of the world's population is dependent on groundwater for its
survival. It is threatened by over-exploitation as its development has taken place without
proper understanding of its occurrence in time and space (CGWB, 2005).
Overexploitation of groundwater has been reported in many parts of the world. Water
shortage is a serious problem today in 80 countries and 40% of the world population is
suffering from water shortages. The water level of the main aquifer in Yemen has been
receding. Las Vegas, Beijing, Bangkok and Manila are all suffering from severe water
shortages because of the overexploitation of groundwater at different rates (World Water
Day, 1998). In India as per the groundwater resource estimates of 2009, out of the 5842
assessed units (Blocks, Mandals, Talukas), 802 are over-exploited, 169 are critical and
523 are categorized as semi-critical units across the country by Central Groundwater
Board (CGWB, 2011). Excessive extraction has resulted in gradual thinning of the fresh
water zone and formation of regional depressions of potentiometric levels have been
reported (Singh and Yadav, 1996; Biswas, 2003). In several parts of India (north Gujrat,
southern Rajasthan, Saurashtra, Coimbatore and Madurai districts of Tamil Nadu, Kolar
district of Karnataka, Rayalseema region of Andhra Pradesh and parts of Punjab, Haryana
and Uttar Pradesh) declining water levels are in the order of 1-2 m/year (Singh and Singh,
2002). The levels may take months or years to get replenished once pumped for any use
and is a matter of serious concern (Custodio, 2002).
2.3 Groundwater quality and its suitability
Quality of groundwater is equally important as its quantity and depends on its use i.e.
domestic, agriculture or industrial usage. The quality of groundwater depends mainly on
the chemical composition of groundwater which is related to the soluble products of rock
weathering and decomposition with respect to time and space. Regions with high
recharge volumes certainly affect the groundwater quality. Quality is defined by certain
physical, chemical and biological characteristics. It is determined by the solutes and gases

12
dissolved in the water as well as the matter suspended in and floating on the water (Todd
and Mays, 2005).
Investigations have reported that groundwater is highly susceptible to pollution
from natural and anthropogenic factors (Appelo and Postma, 1996; Jain and Sharma,
2000). In India, overexploitation of groundwater and indiscriminate use of pesticides and
chemicals in agriculture, percolating to ground in many parts of the country has resulted
in deterioration of groundwater quality. Moreover untreated return from industrial and
domestic sectors in the form of effluents and domestic sewage respectively have also
polluted the groundwater (Palaniswami and Ramulu 1994; Mukherjee and Nelliyat,
2007). Therefore assessment of groundwater quality is necessary to determine its
suitability for different uses. A review of the few studies is given below.
A study on groundwater evaluation of Ralegaon Sidhi watershed revealed that
groundwater was slightly saline for irrigation usage (Durbude and Varadrajan, 2007). A
comparative study conducted in Muktsar and Patiala (districts of Panjab) on suitability
evaluation of groundwater for domestic and irrigation use revealed that groundwater
quality of Patiala was better but it may deteriorate in future due the exiting irrigation
practices( Kumar et al., 2007). Chemical analysis of water samples collected from Hisar
City in Haryana revealed that concentrations of magnesium, sodium, sulphate and
chloride were moderately higher than WHO recommendations for drinking water
(Ravindra and Garg, 2007). The groundwater was found to vary between hard and very
hard but under permissible limits of drinking in Sirsa city of Haryana (Mor et al., 2009).
A study revealed that several villages in Chandrapur, Wardha and Yavatmal districts of
Maharashtra have severe problems of fluoride contamination in groundwater. This will
have far reaching impact on human health condition (Sinha et al., 2004). Suitability
analysis was carried out by Goyal et al., 2010 in Kaithal district of Haryana. The study
concluded that the local residents prefer the use of canal water over groundwater for
domestic use as groundwater is found to be hard, alkiine and saline in the major portion
of the district. Groundwater was found to be suitable for irrigation in 67% of the area,
however high values of EC, SAR, SP and RSC values were obtained in the remaining
part of the area.The main reason observed was the heavy application of fertilizers and
their subsequent leaching to water table. Groundwater quality analysis for domestic and

13
irrigation use in district Yamuna Nagar revealed that groundwater was hard in general for
domestic use but with in the safe limits of drinking.Values obtained for EC, SAR, PS and
RSC indicate that quality of groundwater was within the desirable limits to be used for
irrigation. Groundwater recharge by monsoon was attributed to the improvement in the
quality parameters in the post-monsoon period (Sethi et al., 2012).
2.4 Assessment of groundwater resources
For any water resource development and management program the analysis of water
availability and demand in the area is the key issue (Kumar et al., 2002; Sinha et al.,
2004). The assessment of water resources in India dates back to 1901 when first
Irrigation Commission assessed the surface water resources of India as 144 million
hectare metres (CGWB, 1995). The first systematic methodology to estimate the
groundwater resource of India was developed by Groundwater Over-exploitation
Committee in 1979. The committee suggested water level fluctuation method for the
estimation of groundwater resource of an area. Based on the norms suggested by this
committee, India’s gross groundwater recharge was assessed as 47 million hectare metre
(CGWB, 1979). The methodology suggested had certain drawbacks like the non
inclusion of return recharge from irrigated fields while estimating the groundwater
resource and computation of the stage of groundwater development. The methodology
was then redefined by Groundwater Estimation Committee formed by government of
India in 1982. The committee in association with central groundwater board (CGWB)
submitted its recommendation in 1984, commonly known as GEC-84. The new
methodology suggested that the estimation of rainfall recharge should be based on two
approaches – rainfall infiltration factor (RIF) and water level fluctuation ( WLF or WTF)
method and the return flow from irrigated fields should be included in the total recharge.
Further, the stage of groundwater development of an assessment unit was suggested to be
determined solely in terms of its utilization in irrigation sector (CGWB, 1984). The total
replenishable groundwater resource of India was estimated about 432 billion cubic metre.
The methodology was again revised in 1997 incorporating the estimation of groundwater
recharge from rainfall, seepage from canals, ponds, tanks and water conservation

14
structures and return flow from irrigated fields. Present status of groundwater
development is now computed on the basis of the gross draft for irrigation, domestic and
industrial sectors. Also long term trend of water level became one of the criteria for
categorization of assessment units apart from the stage of groundwater development
along with the level of groundwater utilization (CGWB, 1997). Based on the norms of
this committee, dynamic groundwater resource of India was estimated as 433 bcm as on
March 2011 (CGWB, 2014).
Writings of Vedas indicate the use of groundwater for irrigation since long back
in 300B.C. (Raghunath, 2007). The importance of the groundwater resource in India can
be realized by the fact that about 50% of the total irrigated area is dependent upon
groundwater and about 60% of irrigated food production depends on irrigation from
groundwater (Shah et al., 2000). The exponential increase in the number of tubewells
during last four decades has resulted in overdraft of groundwater (Singh and Yadav,
1996). Groundwater resources in India are showing increasing indications of over
development (Scott and Shah, 2004). Various investigations performed in India are
reviewed below.
Dasgupta and Sikdar (1992) estimated groundwater resources in the upper
catchment of the Sali River basin, Bankura district, West Bengal and found that stage of
groundwater development varied between 13 to 17 percent and there was enough scope
of groundwater extraction without disturbing the groundwater balance of the region .
Pawar et al., (1997) did assessment of groundwater resources of two blocks,
Falakata and Madrihat, of Jalpaiguri district, West Bengal to assess groundwater potential
using water balance equation. From the study it was revealed that the both the blocks had
plentiful unutilized groundwater resources as the available groundwater extracting
structures were being underutilized.
Sikdar and Bhattacharya (2000) worked on assessment and management of
groundwater resources in Puruliya district of West Bengal. On the basis of groundwater
assessment and long term trend analysis phased construction of water harvesting structure
in the study area was suggested to combat expected fall in groundwater table in he coing
ears and to manage the groundwater resources on a sustainable basis.

15
Gaur (2001) did the groundwater budgeting of a small watershed of Amba Bai
village of Jhansi district in Uttar Pradesh by applying GEC, 1997 norms and found that
exiting stage of groundwater development was 91.8% which needs to be preserved.
Kumar et al., (2002) conducted a study on the assessment of water resource
potential, availability and demand of the IARI watershed, New Delhi, by estimating
surface runoff and groundwater recharge using Curve Number (CN) method and EC-
1997 guidelines. The study revealed that although there was no scarcity of water within
the watershed however fresh water resources were inadequate to meet the water demand.
Use of treated sewage water for irrigation was suggested.
Sharda et al., (2006) used water table fluctuation (WTF) and chloride mass
balance (CMB) methods for the estimation of groundwater recharge from water storage
structures in two micro watershed of Kheda district in Gujrat, India. The study revealed
that a minimum of 104.3 mm cumulative rainfall was required to generate 1 mm of
recharge from the water storage structures. An empirical linear relationship was found in
the chloride concentration with the rise or fall of water table in the study area.
Sethi et al., (2008) did the trend analysis based on the present groundwater use
and future requirements in Munijhara watershed of Orrisa. It was revealed from the study
that if the preventive measures are not taken up to rationalize the rate of groundwater
draft with groundwater recharge, this watershed will be depleted of the only source of
irrigation i.e. groundwater in the near future.
Aggarwal et al., (2009 a & b) estimated the water requirement for crops on the
basis of evapotranspiration in Jalandhar and Hoshiapur districts of Punjab. The study
revealed that the existing cropping pattern was the major factor responsible for higher
water demand leading to water deficit. The study emphasized on the needs to grow crops
which have lesser water requirements and to adopt efficient irrigation methods and water
conservation techniques.
Chatterji et al., (2009) evaluated the dynamic groundwater resources of national
capital territory (NCT), Delhi using GEC, 1997 methodology. The study revealed that out
of the nine districts seven districts were overexploited as the stage of groundwater
development exceeded 100% and only two districts, North and Central were in the safe
range of groundwater development. The study also suggested that rainwater harvesting
16
methods should be adopted in the hydrogeologically suitable areas to augment the
depleting groundwater resources in the overexploited districts.
Singh and Sharma (2010) assessed availability and demand of water resources at
block level during Kharif and Rabi seasons in Rewari district, Haryana. It was found that
the available water was not adequate to meet the total crop water demand during Rabi
season however during the Kharif season crops it was surplus. Scientific and rational
conservation methods like design of suitable recharge structures to bridge the gap
between water availability and demand were suggested.
Singhal et al., (2010) in Pathri Rao watershed of Haridwar district, Uttrakhand
conducted a study and found decline in waster table during both pre and post monsoon
period. The study revealed that this may be due to over- exploitation of groundwater
resources in the study area. Authors suggested suitable artificial recharge sites to
accelerate the groundwater recharge and to arrest the further decline in groundwater
levels.
Gontia and Patil (2012) conducted a remote sensing and GIS based assessment of
groundwater recharge through rainfall and water harvesting structures in Jamka
watershed of Saurashtra region, Gujarat. The analysis concluded that groundwater
recharge by rainfall varies between 11 to 16 percent of annual rainfall and water
harvesting structures contribute about 39 percent of the total recharge.
Ganguli (2012) did assessment of groundwater resources and their sustainability
in municipal area of Chandernagore and Hoogly-Chinsurah, West Bengal using GEC-97
guidelines and revealed that area falls under semi critical zone and recommended the
construction of water harvesting structures in the apartments.
2.5 Groundwater recharge
Imprudent exploitation of groundwater resources may often result in undesirable and
irreversible consequences and thus demand better and simplified means of recharge
predictions at micro level (Gaur, 2001). Although a huge quantity of surface water is
available in India, the topography and other constraints has limited its beneficial use to
only 50 percent (Jothiprakash et al., 2003; Das, 2011). Therefore in such situations

17
recharge by artificial means becomes more relevant where precipitation is seasonal. Also
replenishment of aquifer by natural recharge is often inadequate to meet the increasing
water demand of groundwater resources.
Harvesting of surface water is the most common practice being practiced in the
country since ancient times of Harappan civilization. In southern peninsular region tanks
and ponds constructed hundreds of years ago are still in use. However decline in the
maintenance of these structures is being reported due administrative, technical and social
reasons (Athavale, 2003). Also water from the basin drains out into rivers and is not
available for use during non- monsoon perod. Thus there is need to direct the surface
runoff to aquifer by constructing suitable artificial recharge structures according to terrain
conditions. Direct and indirect methods are the two broad categories for artificially
augmenting the groundwater recharge. The necessity of artificial recharge in India was
recognized more than four decades ago (Karanth, 1963). Systematic application of
artificial recharge is still at an initial stage as evaluation of groundwater potentials by
these augmenting structures have not been done scientifically. Artificial recharge studies
in India have mainly concentrated on the mechanism of recharge but recently a number of
studies also focused on site selection process using hydrogeological parametres and
integrated approach of remote sensing and GIS techniques (Anbazhagan and
Ramaswamy, 2002).
2.6 Remote Sensing and GIS in groundwater hydrology
Groundwater being a subsurface phenomenon, its assessment (occurrence and movement)
is based on indirect analysis of some directly observable features like topography,
lithology, geological structures, depth of weathering, extent of fractures, primary and
secondary porosity, drainage pattern, geomorphology, slope, land use/land cover, and
climate and their hydrological characteristics (Mukherjee, 1996; Jaiswal et al., 2003;
Javed and Wani, 2009). In-situ hydrogeological experiments and surveys help in
groundwater exploration, but are time consuming and costlier for spatial and temporal
investigations. In recent, remote sensing has been increasingly employed to replace
traditional on-site experimentation and exploration. The reason being that not only it

18
provides unparalleled synoptic view of the region as a whole for data observation but also
saves time and money (Saraf and Choudhury, 1998; Murthy, 2000; Tweed et al., 2007).
Advent of satellite remote sensing and geographic information system has added a new
dimension in the field of groundwater investigations. e.g. the upper boundary of a
shallow aquifer is strongly influenced by features at or near the surface, the information
about which is provided by remote sensing (Meijerink, 1996). This is due to the fact that
the surface features such as geology, landforms, soils, land use/land cover, surface water
bodies, etc. which are the indicators of groundwater existence can be easily derived from
a satellite imagery (Bobba et al., 1992; Das et al., 1997; Ravindran and Jeyaram 1997;
Meijerink, 2000; Jha and Pieffer, 2006). The earth observing devices both on spacecraft
as well as on aircraft provide most up-to-date, accurate and detailed spectral, spatial and
temporal informations on the hydrogeological conditions of large and inaccessible areas
within a short time. This advantage of remote sensing has made it a very handy and
useful tool in exploration, evaluation and management of groundwater resources.
Reviews presented on applications of remote sensing in groundwater hydrology by
Farnsworth et al., (1984), Waters et al., (1990), Engman and Gurney (1991) and
Meijerink (2000) indicate that remote sensing has been widely used as a tool, mostly to
complement standard geophysical techniques. Aerial photographs, multispectral scanner
images, radar images operating in different parts of the electromagnetic spectrum,
airborne geophysical methods etc. are the various common techniques of remote sensing
used in groundwater studies.
Applications of remote sensing in groundwater exploration using aerial
photographs, visible and near-infrared satellite images dates back to 1960 with limited
success (Engman and Gurney, 1991). With the advent of high resolution multi-spectral
satellite sensors, the use of satellite imagery for targeting groundwater prospects
increased manifolds in late 1980s (Waters et al., 1990; Engman and Gurney, 1991;
Meijernik, 2000; Jackson, 2002). Generally, the satellite data (aerial photographs or
satellite imagery) is analyzed prior to ground surveys and fieldwork, because it may
eliminate areas of potentially low water-bearing strata and may also indicate promising
areas for intensive field investigations, thus minimizing the field data collection (Revzon
et al., 1983). Therefore it is an ideal tool for generating spatial information needs.

19
However, the use of remote sensing technology involves large amount of spatial
data management and requires an efficient system to handle such data. The Geographical
Information Systems (GIS) technology provides suitable alternatives for efficient
management of large and complex databases. It has emerged as an efficient tool for
manuplating and storing large volumes of data, integrating spatial and non-spatial
information within the same georeferencing scheme for analyzing and solving various
spatial problems (Moore et al., 1991; Goodchild, 1993; Meijerink et al., 1994). It has also
emerged as an effective tool for decision making in several areas including engineering
and environmental fields (Stafford, 1991; Goodchild, 1993). In early nineties and mid-
nineties the reviews presented on application of GIS in hydrology and water management
by authors such as Zhang et al., (1990), DeVantier and Feldman (1993), Ross and Tara
(1993), Schultz (1993), Deckers and Te Stroet (1996), and Tsihrintzis et al., (1996)
indicate that application were essentially in a modeling dominated context. It is reported
that use of geographic information systems in groundwater studies dates back to 1987,
but its use for surface-water modeling has been more prevalent because the available
standardized GIS coverages are primarily of the land surface and only a few standardized
coverages of hydrogeologic properties are available (Watkins et al., 1996). Watkins et al.,
(1996) presented an overview of GIS applications in groundwater flow modeling and on
the other hand, Pinder (2002) provided step-by-step procedures for groundwater flow and
transport modeling using GIS technology.
Remote sensing and GIS are now established tools for natural resources and
environmental studies. During the last few years, research has been going on to integrate
both the tools. As the demand for spatial information grows there is an ever increasing
synergy between remote sensing and geographical information systems where remote
sensing data can be used as data set in GIS. Integration of the two technologies has proved
to be an efficient tool in groundwater studies (Saraf and Jain, 1993; Krishnamurthy et al.,
1996; Punithavathi et al., 2011). An integrated approach of remote sensing and GIS
techniques is successfully used by several investigators to delineate groundwater
potential zones both in India and abroad (Saraf and Jain, 1993; Jankowski, 1995;
Chaudhary et al., 1996; Krishnamurty et al., 1996; Shahid et al., 2000; Senser et al., 2005;
Ravi Shankar and Mohan, 2006; Solomon and Quiel, 2006; Chowdhury et al., 2009).

20
These studies commonly made use of the thematic layers such as geology,
geomorphology, soil, topographic slope, drainage pattern, lineament density etc. Some
researchers integrated remote sensing, GIS and geoelctrical techniques to delineate
groundwater potential zones (Murthy, 2000; Shahid and Nath, 2002; Srivastava and
Bhattacharya, 2006). They conducted geoelectrical surveys to derive thematic layers of
subsurface parametres such as aquifer resistivity, depth and thickness of aquifer, clay
layers etc. Comprehensive literature survey on applications of RS and GIS techniques in
groundwater studies is succinctly described in the following sections.
2.6.1 Hydrogeological indicators derived from remote sensing
Remote sensing data provide accurate spatial information and are cost-effective
compared with conventional methods of hydrogeological surveys. Digital enhancement
of satellite data improves maximum extraction of information useful for groundwater
studies. The various hydrologeologic clues that can be extracted from remote sensing are
geology, geomorphology, structures (lineaments, fault zones etc.), vegetation, drainage
(density and pattern), soil properties, land use, soil moisture, recharge and discharge areas
etc. Detection of occurrence and movement of groundwater from remote sensing data
depends upon the spectral properties of earth surface features. Electromagnetic radiation
when incident on an object is either reflected, absorbed or transmitted, the proportion of
the three being different for different objects as well as the sensors. The spectral properties
of the materials depend on the physical and physiological nature. The most important are
vegetation, soil and water properties.
The spectral reflectance properties of a leaf which is the major contributor to the
reflected energy from a vegetation canopy in the visible and infrared region is a function of
the leaf pigments, the leaf cell morphology, internal refractive index discontinuities and the
water content (Raines and Canny, 1980). The reflectance from a leaf primarily depends
on the pigments and proportion of chlorophyll, internal cell structure and the water
content, any change in these due to any reason (e.g. change in species, disease,
senescence etc.) can give a different spectral response to the incident radiations. A plant
leaf typically has a low reflectance in the visible spectral region because of the strong

21
absorption by chlorophyll, a relatively high reflectance in the near- infrared because of
the internal scattering and relatively low reflectance in the infrared beyond 1.3 µm
because of strong absorption by water (Knipling, 1970). Pigments are the main
determinants controlling the spectral responses of leaves in the visible wavelengths
(Gaussman, 1977). Reduced concentrations of chlorophyll are indicative of plant stress
(Curran et al., 1991). On the other hand, cellular structure and water content of leaves are
the main determinants in the near and mid-infrared wavelengths as shown in Fig. 2.4.
Similarly due to plant senescence, plant tissues break down and there is chlorophyll
degradation, high reflectance is observed in the visible region. In general, lower the water
content of a plant higher the reflectance in the middle infrared, with reflectance peak
between moisture absorption band at around 1.6 µm and 2.2 µm (Belward, 1991).
Several researchers have extensively studied soil reflectance properties in the
visible and IR region, both in field and laboratory (Bowers and Hanks, 1965; Cipra et al.,
1971; Condit, 1972; Stoner and Baumgardner, 1981). Reflectance property of soil mainly
Fig. 2.4: Typical reflectance sensitivities as controlled by leaf pigments, cell
structure and water content (Adapted from Gaussman, 1977)

22
depends upon the moisture, texture and structural arrangement and is very little affected
by chemical composition (Mulders, 1987). With increase in soil moisture reflectance in
the visible region decreases due to total internal reflection with in soil and soil appears
darker.Effect of varying soil moisture on reflectance is shown in Fig. 2.5. The reflectance
curve dips at 1.4 µm, 1.9 µm and 2.7 µm due to water absorption band and at 2.2 µm due
to presence of hydroxyl absorption band. Also it was observed that soil reflectance
increases with decrease in particle size (Bowers and Hanks, 1965). Further it has been
observed that structure dominates over texture (Colwell et al., 1983). Rougher soil
surface has lesser reflectance because of aggregation of reflectance.
The presence of suspended sediment, living organisms, dissolves organic matter
and other particles can affect remotely sensed signal by changing the scattering and
absorption properties of water. The reflectance of pure water generally decreases
uniformly from visible to infrared with a peak at 0.55 µm. Adding sediment to water
(turbid water) will increase its reflectance through the visible spectrum Fig. 2.6. This helps in
detecting sediment load in water and monitoring water quality from remote sensing data.
Drainage is one of the simplest parameter, which can be extracted through remote
sensing. It gives the most recent and accurate information and the seasonal changes can
also be mapped using multi date data. Astaras (1985) used Landsat imagery for mapping
of drainage features for quantitative analysis in the Olympus-Pieria mountain area.
Astaras et al., (1990) performed a multi-sensor analysis using Landsat-3, RBV, TM
images and SPOT PLA stereo pairs in Central Macedonia for drainage extraction.
Drainage pattern and texture reflect the permeability of the underlying lithology and
provide an important indication of groundwater condition (Charon, 1974; Salman, 1983;
Mishra S., 2013). High drainage density is the result of impervious lithology at or near the
surface indicating low percolation of water into groundwater and unfavourable recharge
conditions (Anbazhagan et al., 2005; Ravi Shankar and Mohan, 2005; Chowdhury et al.,
2010). Identification of hydrologically significant lineaments is another important
application, especially in hard rock terrains where large amount of groundwater can be
obtained from wells along fractures (Saraf and Choudhury, 1998).

23
Fig. 2.5: Silt loam reflectance spectra for various moisture contents (Adapted from
Bowers and Hanks, 1965)
Fig. 2.6: Spectral curve of water with different concentrations of suspended
sediment (Adapted from Farooq S., 2011)

24
2.6.2 Land use/ land cover from remote sensing data
Land use information is essential for the comprehensive land-use planning and an
integrated management of natural resources (Singh and Roy, 1989; Asselman and
Middelkoop, 1995; Zhu, 1997) to ensure sustainability of land and to achieve social
equity, economic efficiency and environmental sustainability. Also it is a desired input
for many agricultural, geological, hydrological and ecological models. The study of any
natural calamity such as landslide hazard zonation (Gupta et al., 1999; Saha et al., 2002)
highly depends on the availability of accurate and up to date land cover information. The
benefits of satellite-based remote sensing in land use / land cover mapping, monitoring
and change detection as well as providing up to date information within short time at less
cost and efforts were recognized long ago by several researchers. Many studies and
surveys have used remote sensing techniques to acquire land use / land cover information
during the past 40 years and this technique has become now the only most effective tool
for land use / land cover data acquisition (Gautam and Channaich, 1985; Lillesand and
Kiefer; 1994, Kelarestaghi et al., 2006). Synoptic view with repetitive coverage makes
satellite remote sensing imagery a viable source of gathering quality land cover
information from local to global scales (Csaplovics, 1998; Foody, 2002).
Remote sensing techniques have been valuable in mapping urban land use pattern
as well as data sources which aid in the analysis and modeling of urban growth and land
use change (Clarke et al., 2002). Land use / land cover changes are one of the main
human induced activities altering the groundwater system (Calder, 1993) and are known
to impact the hydrology of the catchment area (Bhaduri et al., 2000; Bronstert, 2004; Ott
and Uhlenbrook, 2004; Tang et al., 2005).
Ming et al., (1993) used minimum distance to mean classifier, the maximum
likelihood classifier and the box classification for land use classification of Nanjing,
Eastern China, from Landsat MSS data. It was found that classification algorithms and
threshold parametres have an important influence on classification results and should be
selected carefully based on the training area.
Saha et al., (2005) did land cover classification of Himalaya region covering
portions of Rudraprayag and Chamoli Districts of Uttaranchal State in India using multi-

25
source classification approach. Multispectral image from IRS-LISSIII was used as
primary data to produce land cover classification, whereas the PAN image was used as
reference data for creation of training and testing data sets and NDVI and DEM as the
additional data layers to implement multi-source land cover classification using the
maximum likelihood classifier (MLC). The study revealed that addition of ancillary data
with remote sensing data substantially reduced the misclassifications incurred due to the
effect of shadow in the image and also due to the similarity in spectral characteristics of
some classes in high elevation areas. A remarkable increase in accuracy up to 90% was
achieved on incorporation of DEM and NDVI data layers with IRS-LISS-III image.
Al-Ahmadi and Hames (2009) applied unsupervised (ISODATA) and supervised
(Maximum likelihood, Mahalanobis Distance, and Minimum Distance) in three sub-
catchments in Saudi Arabia for land use classification of the raw TM5 images. It was
found that the maximum likelihood method gave the best results with an average
accuracy of 80% and both Mahalanobis distance and Minimum distance methods
overestimated agriculture land and suburban areas with an average accuracy of 74% and
67% respectively.
Mahdavi (2010) did image classification for land use/land cover mapping in
Zagros region, Iran using supervised classification techniques of maximum likelihood
and minimum distance classifier, utilizing original and synthetic bands resulted from
diverse spectral transformation such as rationing, PCA and Tasseled Cap. Nine main
classes, based on spectral values and textural characteristics, of land use / land cover such
as rangeland, dense forest, semi-dense forest, sparse forest, very sparse forest,
agriculture, gardens, settlements and bare lands were found with 83% overall accuracy
and 0.78 kappa coefficient.
Kenneth and Gunter (2012) combined data from optical sensors (Landsat,
Worldview-2) with Radar sensor data from Advanced Land Observing Satellite (ALOS)
Phased Array type L-band Synthetic Aperture Radar (PALSAR) data for urban land-use
mapping in Nakuru municipality of Kenya. The study used several classical and modern
classifiers namely maximum likelihood (ML) for image classification and revealed that
Landsat has sufficient spectral bands allowing for better delineation of urban green and
impervious surface, Worldview-2 has a higher spatial resolution and facilitates urban

26
growth mapping while PALSAR has higher temporal resolution compared to other
operational sensors.
Brar (2013) carried out study for land use change detection in Siwaliks of Punjab
using 1989 and 2005 Landsat TM and IRS P6 satellite imageries respectively. Supervised
classification coupled with field verification revealed that land under natural vegetation
was decreasing at alarming rate and most of the land under closed forest in 1989 had
changed to open forest in 2005. Similarly increase in area under water bodies,
agricultural practices and settlements were also noticed.
2.6.3 Remote Sensing and GIS applications in artificial groundwater recharge
Generation of spatial data and information by remote sensing techniques and
management of a large and coplex data by GIS for artificial groundwater studies is
reviewed in this section.
Anbazhagan et al., (1997) used IRS-IA LISS II satellite imagery to extract
geological structures, lineaments and soil types for the analysis in selection of suitable
sites for artificial recharge in hard rock terrain of central Tamilnadu, India. Rock soil
contact map was prepared from the aerial photo interpretation to understand the regional
view of soil covered area. Areas with water level deeper than the mean water level were
considered suitable for artificial recharge. Further, these areas were integrated with
pervious soil, synclinal structures and regions of higher lineament density to identify the
areas having good permeability with adequate aquifer dimension to construct the
recharge structures.
Saraf and Choudhury (1998) applied various standard digital image processing
techniques to IRS-LISS-II data to enhance and extract information on geology,
geomorphology, land use, structural features and vegetation cover for groundwater
exploration and identification of suitable sites for artificial recharge in Sironj area of
Madhya Pradesh. DEM, drainage and groundwater level data was used as supporting data
in the analysis. Integration of thematic maps by weighted indexing overlay method
revealed that geology, geomorphology, slope and lineaments were the main features in
contolling the recharge pattern of the area. Moreover, the integrated analysis of these

27
features using GIS provided a further insight into the hydrogeological regime of the area
for site selection for artificial recharge.
Elango and Arrikkat (1998) using remote sensing and GIS integrated and
analyzed various thematic layers related to groundwater recharge for the identification of
recharge sites in parts of Ongur sub-basin, south India. Seven thematic layers were
prepared using both remotely sensed and conventional data. After being ranked and
reclassified these thematic layers were overlayed in ArcInfo GIS. Based on the analysis,
the study area was divided into four zones viz., ‘very good’, ‘good’, ‘poor’, and ‘very
poor’ according to the potential for natural recharge. The unfavorable areas were further
classified into four classes on the basis of potential for artificial recharge. The study
concluded that remotely sensed data, conventional data, and GIS overlay analyses
provide a powerful and practical approach to identify groundwater recharge areas in a
basin.
Anbazhagan et al., (1999) used remote sensing and GIS for interpreting the
various terrain characters and integrating them for identifying the problematic areas and
favourable sites for artificial recharge in Kinzig basin, Germany. Large amount of
extraction had resulted in water table depletion and created water scarcity in the study
area. Aerial photographs and Landsat Thematic Mapper data were analyzed for
interpreting the lineaments, land use/ land cover and geomorphology and were integrated
in GIS environment to identify suitable areas for aquifer replenishment by artificial
recharge. Areas of water table depletion, areas of groundwater demand and the socio
economic data were integrated with geological, hydrogeological data bases by using
ILWIS 2.1 GIS software. Subsurface dams at confluence of slope and injection wells
along the fracture zones were suggested to arrest the further decline of groundwater table.
Areas with shallow water table were recommended for induced recharge to accelerate
further infiltration from the surrounding areas.
Ramalingam and Santhakumar (2002) carried out a study on artificial recharge
using remote sensing and GIS in all the blocks of Tamil Nadu and found that the
increased use of groundwater had resulted in fast decline of groundwater table. Various
thematic maps such as drainage density, lineament density, land use, geomorphology,
geology, soil, slope, runoff isolines, depth to weathered zone, depth to basement,

28
groundwater level fluctuations and water quality were used in the analysis. The above
maps were prepared using IRS-1C LISS III satellite data and other collateral information
collected from the field. After assigning different weights and ranks to different themes
and their features respectively, these maps were overlaid using ARC/INFO GIS software
and statistical analysis was made on the intergrated map to classify it into four suitable
zones. After the ground truthing percolation ponds, check dams, subsurface dykes,
recharge pits, nalla bund, contour trench etc. recharge structures were proposed
depending on the terrain condition and favorable zonation. The study concluded that the
zonation created using GIS as well as the type and location of water-harvesting structures
suggested were agreeable, and the success rate was more than 90%.
Vasanthakumaran et al., (2002) used remote sensing and GIS techniques for
selecting suitable sites for artificial groundwater recharge in the rocky terrain of Southern
India. Thematic maps of soil, lineament, and drainage density were prepared using
toposheets and satellite data. ArcView and ArcInfo GIS softwares were used to integrate
these developed themes after assigning appropriate weights to each theme, which resulted
in the identification of suitable artificial recharge sites.
Jothiprakash et al., (2003) delineate artificial recharge zones in Agniar-
Ambuliar-Southvellar river basins in Tamilnadu. Thematic maps pertaining to geology,
permeability, effective soil depth, drainage intensity, soil texture, water holding capacity
and physiography were integrated in GIS environment to delineate the potential zones for
artificial recharge. For this each theme was assigned a weightage depending upon its
influence on groundwater recharge and each feature of the parametres used was assigned
a knowledge based ranking from one to four depending on its significance in storage and
transmittance of groundwater. Areas having rapid permeability with high water holding
capacity in alluvium soil were found to be excellent zones for constructing artificial
structures. Areas nearer to the coastal area and inland coastal area were highly suitable
for artificial recharging of groundwater.
Rao et al., (2003) conducted Vertical Electrical Soundings (VES) to identify
recharge zones on the basis of geo-electrical parametres longitudinal conductance,
transverse resistance and coefficient of anisotropy along with water table information in
Champavathi river basin of Andhra Pradesh. Soil thickness and permeability evaluated

29
from apparent resistivity along with water table data were taken into account to
demarcate potential zone for groundwater recharge.
Saraf et al., (2004) did GIS based surface hydrological modeling in identification
of groundwater recharge zones in Dwarkeshwar watershed, West Bengal and Kethan
basin, Madhya Pradesh. In this study, comparative analysis of the drainage network
derived from DEM and toposheets had been carried out and it was found the potential
groundwater recharge zones at locations of clustering of drainage networks. It was also
found from the groundwater recharge maps of the two study areas that the areas where
groundwater recharge was high, the degree of mismatch between the surveyed and
simulated drainage was also high. Such mismatch was suggested to delineate the
groundwater recharge zones. The study conducted was found in good correlation with
suitable recharge zones derived from remote sensing and GIS techniques.
Ravi Shankar and Mohan (2005) used a GIS based hydrogeomorphic approach for
identification of site-specific artificial recharge techniques in the Bhatsa and Kalu river
basins of Thane district, in western Deccan Volcanic Province (DVP). In the present
study they attempted to identify zones favorable for the application and adaptation of site
specific artificial recharge techniques for augmentation of groundwater.
Hydrogeomorphological characteristics of both the basins extracted from the IRS-1C
LISS-III data and supported by lineament density, depth to bedrock, soil cover and water
table fluctuation of the area were used for the analysis. Suitable sites for the construction
of artificial recharge structures were suggested. Percolation ponds, check dams and en
echelon dams were recommended on the basis of drainage morphology of the study area.
Sensitivity analysis revealed that a variation of ± 12% in the parametres did not affect the
location of suggested sites indicating the procedure adopted for decision rules was robust.
Ghayoumian et al., (2007) applied Fuzzy Logic among GIS techniques to
determine most suitable areas for artificial groundwater recharge in a coastal aquifer in
Gavbandi Drainage Basin in southern part of Iran. Thematic layers such as slope,
infiltration rate, depth to groundwater, quality of alluvial sediments and land use were
prepared, classified, weighted and integrated in a GIS environment by the means of
Boolean and Fuzzy logic. The study revealed that about 12% of the study area was
appropriate and 8% moderately appropriate for artificial groundwater recharge. The

30
relationship between geomorphology and appropriate areas for groundwater recharge
indicate that the majority of these areas were located on alluvial fans and pediment units.
Kumar et al., (2008) delineated the potential sites for water harvesting structures
using remote sensing and GIS in the Bakhar watershed, Uttar Pradesh. Various criterion
maps depicting the land use/land cover, geomorphology, roads, drainage and lineaments
were prepared using geocoded photographs and digitally enhanced products of the IRS
LISS-III sensor. Knowledge base ranking of 1 to 4 was assigned to each feature of the
thematic map depending on its significance in storage and transmittance of groundwater
and these values were multiplied with criteria weight to get final score of each feature.
These weighted maps were integrated in GIS by weighted aggregation method and the
study area was classified into four categories of suitability sites based on the total score
of polygons formed in final integrated map. Water harvesting structures such as check
dams, contour bunding, recharge pits, wells and contour trenching were suggested as per
technical guidelines provided by the Integrated Mission for Sustainable Development
(IMSD) and Indian National Committee on Hydrology (INCOH). The study revealed that
out of 136 villages of Bakhar watershed 22 villages were found suitable for check dams,
14 for contour bunding, 5 for recharge pits and 12 for contour trenching and rest were
found not suitable for any of these water harvesting structure.
Singh et al., (2009) in their study of Soankhand watershed in Punjab found that
water harvesting structures were extremely important for conserving natural resources
like soil and water. From the study it was found that huge amount of available runoff can
be considerably reduced by constructing suitable water harvesting structures which in
turn reduces floods, increases infiltration and helps in water conservation. Depending
upon the parameters like location, slope, soil type, intensity of rainfall, land cover and
settlement, suitable sites for the construction of check dams, gully plugging structures,
percolation tanks and farm ponds were suggested. Nala bunding and farm ponds were not
found suitable in the area due to steep slope, less soil thickness and high runoff velocity.
Ramakrishnan et al., (2009) carried out a study for identifying potential water
harvesting sites in Kali watershed of Mahi River basin, Gujrat using SCS-CN and GIS
based approach. The study found that high runoff potential, evapo-transpiration and poor
infiltration has resulted in drought like situation from December to June almost every

31
year in this area. Thus the augmentation of water resources by construction of runoff
harvesting structures at suitable sites was proposed. The study considered spatial
parametres like runoff potential, slope, fracture pattern and integrated them in GIS
environment to determine sites of different water harvesting structures. Land use maps
were prepared from March and October 2004 Indian Remote Sensing Satellite (IRS-
LISS-III) data and Shuttle Radar Topographic Mission (SRTM) DEM was used to derive
the slope map. In this study, lineament map was prepared from the satellite data
following the conventional edge enhancement techniques and field checks. Construction
of runoff harvesting structures like check dam, percolation pond, farm pond, well and
subsurface dyke was suggested and an accuracy of 80-100 % was achieved on ground
truthing.
Chenini et al., (2010) used the GIS based multi-criteria analysis technique to map
groundwater recharge zone in the Maknassy basin (central Tunisia) where depletion of
groundwater levels were taking place for the last decade and the problem further
aggravated due to increased demand for agricultural and industrial needs and arid
climatic conditions. Thematic maps of the factors (watershed limit, drainage, drainage
density, lithology, fractured outcrops, lineament, permeability, and piezometry)
influencing the groundwater recharge were prepared and integrated in GIS after
assignment of weights. The resultant map was categorized as per the weight ranges
obtained.
Chowdhury et al., (2010) proposed a methodology for delineating artificial
recharge zones and identifying possible recharge sites in the West Medinipur district of
West Bengal using remote sensing, GIS and MCDM techniques. Thematic maps of
geomorphology, geology, drainage density, slopes and aquifer transmissivity, considered
for the study were prepared using IRS-1D imagery and conventional data. Each thematic
layer and its feature were assigned a weight with help of expert’s knowledge and the
normalized weights were calculated by the analytical hierarchy process (AHP). The five
layers were then combined by addition to get the final integrated layer. The resultant
layer was then classified into three zones as suitable, moderately suitable and not
suitable. The study revealed that only 46 percent of the total area was under suitable zone
for artificial recharge and 43 percent was moderately suitable. Further 40 artificial

32
recharge sites were selected in suitable to moderately suitable zones at the intersection of
lineaments with 2nd
and 3rd
order streams.
Sukumar and Sankar (2010) delineated the potential zones for artificial recharge
using GIS in Theni district, Tamil Nadu. Three problems, deeper groundwater levels,
over-exploitation and salinity related to groundwater were identified in the study area.
Therefore the layers of permeability, soil depth, drainage intensity, water holding
capacity, soil texture and geology were integrated in GIS environment to prioritize the
area for the identification of suitable artificial recharge sites. Structures like check dam
and percolation ponds were suggested to create new plans and models to implement the
water resource development and action plan in the study area.
Babu and Kumar (2010) demarcated groundwater recharge potential zones for
Tiruppur block of Tiruppur district, Tamil Nadu using geographical information system.
This was done to combat the problem of water scarcity and declining water levels in the
area due to overexploitation. Geology, geomorphology, hydrological soil groups,
lineament and land use parametres (themes) were consisderd for identification of
potential groundwater recharge zones. The demarcation process involved the assignment
of weights to each parametre according to the influence of each theme on supporting
groundwater recharge and appropriate ranks were given to each individual feature.
Weighted index overlay method was used to integrate all the themes and integrated map
was classified into three zones namely good, moderate and poor potential areas for
artificial recharge. The study proved that methodology adopted in assigning weights and
integrating different thematic maps in GIS proved to be more accurate than for
delineation of potential groundwater recharge zones using any other conventional
method.
Kumar and Kumar (2011) used Multidate IRS 1D/P6 LISS III data in conjunction
with collateral data to generate thematic layers on geology, geomorphology, land use/
land cover, lineaments for study area of Sanjai Watershed, Jharkhand. Geographic
Information System (GIS) framework was used for integration of these layers and
analyzed using a developed model based on logical conditions to derive groundwater
recharge zones. Technical guidelines provided by the Integrated Mission for Sustainable
Development (IMSD, 1985), National ( Natural) Resources Information System (NRIS,

33
2000), Rajiv Gandhi National Drinking Water Mission (NRSC, 2007) were adopted for
identifying the groundwater recharge zones and selecting sites for rainwater harvesting
structures. Suitable structures for groundwater recharge/harvesting such as boulder
bunds, check dam, percolation/disiltation tanks and recharge pits and wells and
subsurface dykes were suggested accordingly.
Sharma and Kujur (2012) applied remote sensing and GIS techniques for the
identification of suitable sites for artificial recharge structures in and around Gola block,
Jharkhand. Thematic data pertaining to geology, geomorphology, land use/land cover,
lineaments, drainage pattern, etc. were prepared by visual interpretation of the digitally
enhanced satellite data IRS-P6 LISS-III, for study area of Gola block, Ramgargh district,
Jharkhand, India. The study found that in a hard rock terrain intersection zone of
lineaments provide potential for groundwater accumulation and recharge. The multi-layer
integration viz. geomorphology, land use, geology, lineament density and drainage
density data helped to identify suitable zones for artificial recharge. These zones were
then compared with land use land cover map and ordering of drainage for adopting the
suitable structure for rainwater harvesting like boulder bunds, check dams and recharge
pits.
Kadam et al., (2012) used SCS-CN method for identifying rainwater harvesting
sites in basaltic region of Western India. The runoff was derived using SCS-CN method
with the help of land use land cover, slope, soil and drainage layers. The analysis found
that water body and agricultural land had high runoff potential followed by settlement,
open scrub, dense scrub and low runoff from open forest and dense forest areas. The
SCS-CN method integrated with geographical information system was found to be an
effective method for identifying suitable rainwater harvesting sites because the average
accuracy of these sites when checked in the field was found to be 86.25 %. The study
revealed that 84 % of study area was suitable for constructing rainwater harvesting
structures like farm ponds, check dam, percolation tank and gully plugs to augment the
groundwater resource of the study area.

34
2.7 Limitations of spatial multi-criteria modeling
As discussed studies have been carried out where multi criteria decision making
(MCDM) is implemented in GIS for suitability analysis. Although the spatial modeling
techniques are quite effective and found appropriate in site suitability problems, there are
certain limitations of these methods. Firstly, inaccuracy, imprecision and ambiguity are
the inherent properties of data input to GIS which leads to inaccurate results. Some
efforts like sensitivity analysis and error propagation analysis were suggested to tackle
this problem by Lodwick and Hevelink (Malczewski, 2004). Fuzzy logic can also be
incorporated to solve this. Standardization of the non commensurate criteria is the other
problem. Different standardization methods lead to different suitability patterns. Third
difficulty is related to the choice of decision rule for a particular problem.This problem
still remains largely unsolved in decision analysis as different decision rules lead to
different suitability patterns.The solution to this problem is to integrate MCDM with
artificial intelligence (AI) techniques like, fuzzy, artificial neural network (ANN), genetic
programming etc. to develop the intelligent multi criteria decision support (Malczewski,
2004).
2.8 Advance technology in spatial modeling: Artificial Neural Networks
Neural networks have seen an explosion of interest over the last few years and are being
successfully applied across an extraordinarily range of problem domains, in areas as
diverse as finance, medicine engineering, geology, physics, biology and urban
development etc. Artificial neural networks (ANNs) refer to computing systems whose
central theme is borrowed from highly simplified mathematical models of biological
neural networks. From a statistical perspective neural networks are interesting because of
their potential use in prediction and classification problems (Rajanayaka et al., 2001).
They may be viewed as non-linear extensions of conventional spatial statistical models
and pattern recognition techniques (Fischer and Gopal 1994a). Besides providing the
extremely valuable classes of data driven mathematical tools for a series of spatial
analysis tasks, neural networks also provide an appropriate framework for reengineering

35
the well established spatial data analysis techniques to meet the new large scale data
processing needs in GIS (Fischer, 1999). They are powerful tools for modeling especially
when the underlying data relationship is unknown. They include the ability to learn and
generalize from examples to produce meaningful solutions to problems even when input
data contain errors or are incomplete, and to adapt solutions over time to compensate for
changing circumstances and to process information rapidly (Jain et al., 2004). Neural nets
consist of sets of nodes between which weighted connections are established (Zahedi,
1991). After training, ANN can be used to predict the outcome of new independent input
data. The important feature of adaptive nature, where “learning by example” replaces
“programming” makes such computational models very appealing in application domains
where one has little or incomplete understanding of the problem to be solved but where
training data is readily available.Thus they are ideally suited for the modeling of
hydrological data which are known to be complex and often non-linear (Govindaraju et
al., 2000). It has been successfully used in many hydrologic applications as rainfall
forecasting (Hung et al., 2008), rainfall-runoff relationship (Cigizoglu, 2007; Junsawang
et al., 2007), evaporation modeling (Sudheer et al., 2002) and improving air temperature
prediction (Smith et al., 2006).
Out of about 30 different neural network models developed, characteristics of 10
most well-known neural network paradigms were briefly reviewed by Sui, 1994. The
multi layer perceptron (MLP) used in the back-propagation (BP) learning algorithm is
one of the most widely used neural network models in natural resource management
(Rumelhart et al., 1986 a & b). A typical BP network contains one input layer, one output
layer and one or more hidden layers. The whole operation of a neural network performs
like a black box. Sui, 1992 utilized back propagation neural network to analyze the
suitability of a number of land parcels for development in vector GIS and also compared
neural net based approach to cartographic modeling based techniques. Wand, 1994 used
neural net in land use suitability assessment for wetland rice, soyabean, sugarcane,
pasture and acacia crops in the north coast of west Java, Indonesia.The advantage of this
method is that it focuses on the problems rather on the details of the techniques, therefore
it is best suited for tackling planning decision makings where there is little or incomplete
understanding of the problem. The drawback of the neural net is that it is not clear what

36
constitute the actual structure of the network, secondly overtraining, where the network
seems to perform well in training, but is just memorizing solutions specifically for the
training data and will perform poorly on real data (Collins et al., 2001; Malczewski,
2004).
2.9 Summary
The literature reviewed shows that overexploitation of groundwater resources has
resulted in decline of groundwater levels at alarming rates. Therefore there is an urgent
need to replenish the depleting aquifers. This requires assessment of the available
groundwater resources and their utilization. Integrated Remote Sensing and GIS
techniques have proved to be an efficient tool in artificial groundwater recharge studies to
target suitable areas for artificial recharge. For these different thematic layers (factors) are
combined by overlaying in GIS environment using spatial multi criteria decision making
techniques. In GIS, the overlay method is often called as suitability analysis from the
planning point of view. Prior to overlaying, different factors and their features are assigned
a weightage (importance) by experts, considering their contribution towards achieving the
goal i.e. artificial groundwater recharge. The assignment of weights to different factors in
spatial modeling methods is usually subjective. AHP is one of the most widely applied
multiattribute decision making methods for calculating weights. The final output largely
depends upon the weights and how the different layers are combined. Advanced
technology like artificial neural networks are gaining popularity in applications to
hydrology problems due to their power and potential in mapping nonlinear system data.
Moreover artificial neural network techniques can be used to resolve the bottleneck of
weight estimation for site suitability analysis in the absence of expert’s knowledge.