CHAPTER 2 LITERATURE REVIEW -...
63
8 CHAPTER 2 LITERATURE REVIEW 2.1 INTRODUCTION This chapter deals with an extensive literature survey on the present research work. This literature search provides a background and guide for the entire study. This chapter includes the review on historical appraisal of activated carbon, activated carbon preparation methods, application of activated carbon, wastewater treatment methods, classification of textile dyes and effect of process parameters on activated carbon preparation and adsorption studies. 2.2 HISTORY OF ACTIVATED CARBON Activated carbon is broadly defined to include a wide range of amorphous carbon based materials prepared in such a way that exhibit a high degree of porosity and an extended surface area. For many centuries the activated carbon was used in the form of carbonized wood. The earliest known use of carbon in the form of wood chars by the Egyptians and Sumerians was in 3750 BC for the reduction of ores in the manufacturing of bronze, domestic smokeless fuel and medicinal application. In 1500 BC, Egyptian papyri was used as adsorbent for odorous vapours from putrefying wounds and from within the abdominal tract. The wrecks of Phoenician trading ships suggest that drinking water was stored in charred wooden barrels. This practise was certainly still in use in the 18 th century for extending
-
Upload
truongphuc -
Category
Documents
-
view
220 -
download
1
Transcript of CHAPTER 2 LITERATURE REVIEW -...

8
CHAPTER 2
LITERATURE REVIEW
2.1 INTRODUCTION
This chapter deals with an extensive literature survey on the present
research work. This literature search provides a background and guide for the
entire study. This chapter includes the review on historical appraisal of
activated carbon, activated carbon preparation methods, application of
activated carbon, wastewater treatment methods, classification of textile dyes
and effect of process parameters on activated carbon preparation and
adsorption studies.
2.2 HISTORY OF ACTIVATED CARBON
Activated carbon is broadly defined to include a wide range of
amorphous carbon based materials prepared in such a way that exhibit a high
degree of porosity and an extended surface area. For many centuries the
activated carbon was used in the form of carbonized wood. The earliest
known use of carbon in the form of wood chars by the Egyptians and
Sumerians was in 3750 BC for the reduction of ores in the manufacturing of
bronze, domestic smokeless fuel and medicinal application. In 1500 BC,
Egyptian papyri was used as adsorbent for odorous vapours from putrefying
wounds and from within the abdominal tract. The wrecks of Phoenician
trading ships suggest that drinking water was stored in charred wooden
barrels. This practise was certainly still in use in the 18th century for extending

9
the use of potable water on long sea voyages. The ancient Hindus in India of
the same period (450 B.C) used sand and charcoal filters for purifying
drinking water. In 157 AD Claudius Galvanometer referred the use of carbons
of both vegetable and animal origin for the treatment of a wide range of
diseases. The specific adsorptive capacity of charcoal was recognized by
Scheele at 1773 AD, who measured the volumes of gases that could be
adsorbed by carbons derived from different sources. In 1785, Lowitz
reviewed the abilities of charcoals to adsorb odors and vapours from a range
of organic chemicals. He also studied the effectiveness of charcoal in
decolourizing tartaric acid. In 1794 wood charcoal was used to decolourize
the sugar cane syrups. In 1811, Figuier evaluated the decolourizing capacity
of bone char and wood char and during 1815, most of the sugar refining
industry had switched to the use of granulated bone char as a decolorant.
Joseph de Cavaillon patented a method for regenerating used bone chars in
1817. Bussy (1822) demonstrated that the decolorizing properties of carbons
were inherent to the source material and also depended on the thermal
processing and the particle size of the finished product. Kayser (1881) first
used the term adsorption to describe the uptake of gases by carbons. The basis
for the industrial production of activated carbon from coal was established in
1900 in order to replace the bone char in the sugar refining process.
The first powdered commercial activated carbon, eponite was
produced in Europe in 1909. During the First World War (1914), steam
activation of coconut shell and almond shell char was developed in the United
States for use in gas masks. It has been used subsequently for water treatment,
solvent recovery and air purification. This type of activated carbon mainly
contains fine pore structures suited for gas phase adsorption applications. In
Czechoslovakia two varieties of pelletized carbons were produced (1935–
1940) from sawdust by zinc chloride activation, for the recovery of volatile
solvents and for the removal of benzene from town gas. Nowadays the zinc

10
chloride process of chemical activation has been largely superseded by the
use of phosphoric acid. Barrer & Breck (1956) invented the method of zeolite
synthesis. In that year the North-American Linde Company started production
of synthetic zeolites on a commercial scale (Dabrowski 2001, Ferhan &
Ozgur 2011, John 1974). The use of carbon molecular sieves in gas
separation, in particular oxygen and nitrogen, has grown steadily in the past
years (Sircar et al 1996).
Activated carbons are useful adsorbents due to their porous
structures, the presence of various oxygenated functional surface groups
depending on the precursor’s nature and the procedures used in their
preparation, and thus activated carbons show differences in their adsorptive
behavior. To produce these carbons, chemical, physical and mixture of both
as activating agents are used and a number of activation procedures have been
reported in the literature (Bansal et al 1988) using the above said activating
agents. In general it can be classified either as single stage or two-stage
process.
2.3 ACTIVATED CARBON
Activated carbon also called activated charcoal, is a form of carbon
that has been processed with oxygen to create millions of tiny pores between
the carbon atoms. Commercial activated carbons have internal surface area
ranging from 500 to 1500 m2/g. Activated carbon can be prepared from feed
stock with high carbon and low inorganic content. The most common feed
stocks used for the production of activated carbon are wood, coconut shell,
bituminous coal, peat etc. The chars obtained from them could be activated
easily to produce reasonably high quality activated carbons. During the
activation process, the unique internal pore structure is created, which
provides the activated carbon its outstanding adsorptive properties.

11
Activated carbons have a number of unique characteristics such as
large internal surface area, chemical properties and good accessibility of
internal pores. According to IUPAC definitions three groups of pores can be
identified.
Macropores (above 50nm diameter)
Mesopores (2-50 nm diameter)
Micropores (Under 2 nm diameter)
Micropores generally contribute to a major part of the internal
surface area. Macro and micropores can generally be regarded as the
highways into the carbon particle, and are crucial for kinetics. The desirous
pore structure of an activated carbon product is attained by combining the
right raw material and suitable activation procedure.
2.4 PREPARATION OF ACTIVATED CARBON
Most carbonaceous substances can be converted into activated
carbon, the final properties of the carbon will depend significantly on the
nature of the starting material. A large number of processes for making
activated carbons have been developed over the past century. However, most
processes consist of the pyrolysis of the starting material, followed by a stage
of controlled oxidation or vice versa. The purpose of the oxidation stage is to
activate the carbon.
2.4.1 Pyrolysis
Pyrolysis step (or also called as Carbonization) involves heating the
source materials to temperatures ranging between 600 to 900ºC in the absence
of air (Cooney 1999). This process is to eliminate most of the non-carbon
elements such as hydrogen, nitrogen, oxygen and sulphur as volatile gaseous

12
products. Low molecular weight volatiles are first released, followed by light
aromatics and finally the hydrogen gas, the resultant product being a fixed
carbonaceous char. The residual carbon atoms are grouped into condensed
sheets of aromatic ring with a cross-linked structure in a random manner. The
mutual arrangement of these aromatic sheets is irregular and leaves free
interstices between the sheets, which may be filled with the tarry materials.
To remove these tarry materials, activation process is carried out. It also
enlarges the diameters of the pores, which were created during the
carbonization process and creating new porosity (Smisek & Cerny 1970).
2.4.2 Activation
The basic characteristics of a carbon are established during the
pyrolysis, and the ensuing oxidation step must be designed to complement the
pyrolysis step. During this step, the oxidising agent increasingly erodes the
internal surfaces of the carbon, develops an extensive and fine network of
pores in the carbon, and changes the atoms lying on the surface to specific
chemical forms which may have selective adsorption capabilities. This
activation step is done by two methods physical activation or chemical
activation.
2.4.2.1 Physical activation
Physical activation or partial gasification is generally carried out at
elevated temperatures between 750 and 1100 C using oxidants such as steam,
carbon dioxide, air or mixture of these gases. Chlorine, sulphur vapours,
sulphur dioxide, ammonia and a number of other substances having activation
effects are rarely used. Gasification of the carbonized material with steam and
carbon dioxide occurs by the following endothermic reactions:
C + H2O H2 + CO (2.1)
13
C + CO2 2CO (2.2)
The reaction of steam with carbon is accompanied by the water gas
formation reaction, which is catalyzed by the carbon surface as,
CO + H2O CO2 + H2 (2.3)
Since the reaction of carbon with steam and with carbon dioxide is
both endothermic, external heating is required to drive the reactions and to
maintain the reaction temperature. The activation process can be manipulated
to produce products of desired characteristics. Activation temperature, steam
and CO2 flow rates control the pore development, which in turn affect pore
size distributions and the level of activity of the activated carbon.
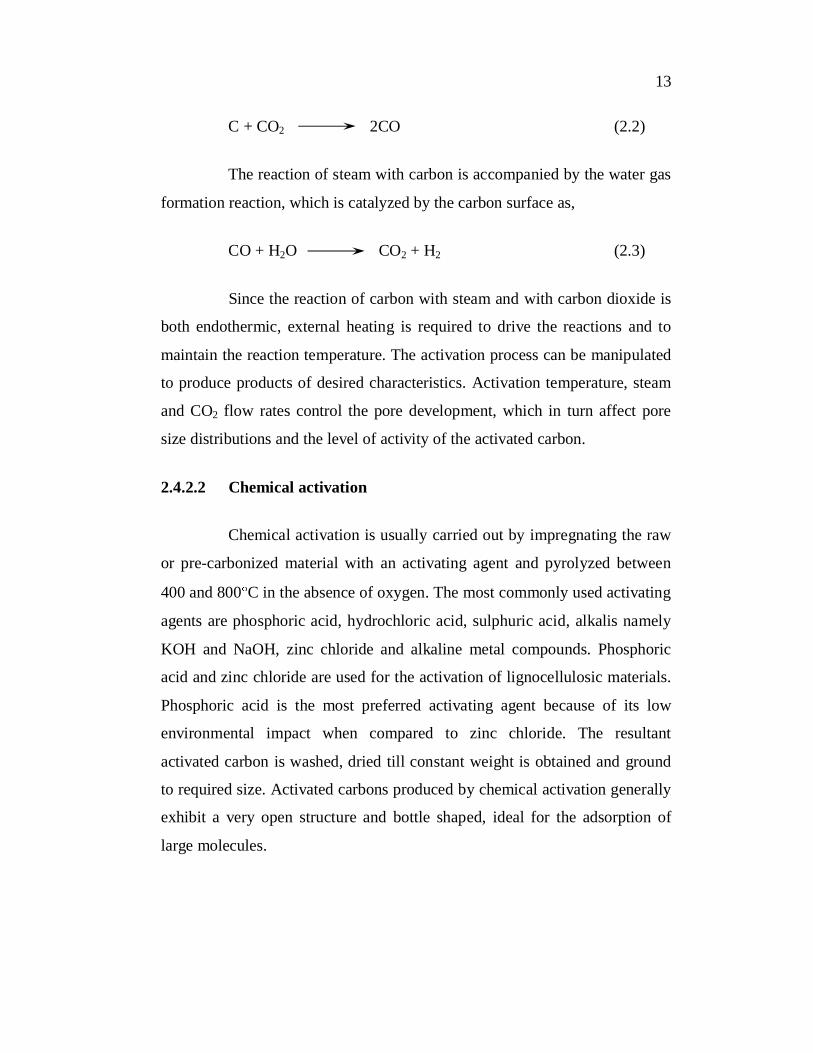
2.4.2.2 Chemical activation
Chemical activation is usually carried out by impregnating the raw
or pre-carbonized material with an activating agent and pyrolyzed between
400 and 800 C in the absence of oxygen. The most commonly used activating
agents are phosphoric acid, hydrochloric acid, sulphuric acid, alkalis namely
KOH and NaOH, zinc chloride and alkaline metal compounds. Phosphoric
acid and zinc chloride are used for the activation of lignocellulosic materials.
Phosphoric acid is the most preferred activating agent because of its low
environmental impact when compared to zinc chloride. The resultant
activated carbon is washed, dried till constant weight is obtained and ground
to required size. Activated carbons produced by chemical activation generally
exhibit a very open structure and bottle shaped, ideal for the adsorption of
large molecules.

14
2.4.2.3 Combination of physical and chemical activation
A combination of physical and chemical activation can be used to
prepare granular activated carbons with a very high surface area and porosity
adequate for certain specific applications such as gasoline vapour control, gas
storage, etc. Activated carbons of this types have been reported using
lignocellulosic precursors chemically activated with phosphoric acid and zinc
chloride and later activated under a flow of carbon dioxide. Uniform,
medium-size microporosity and surface areas above 3600 m2/g are obtained
with this mixed procedure (Bansal 1988).
2.4.2.4 Advantages of chemical activation over physical activation
An important advantage of chemical activation is that the process normally takes place at a lower temperature and for a shorter time than those
used in physical activation. In addition, very high surface area activated
carbons can be obtained with the yields of carbon in chemical activation being
usually higher than those in physical activation because the chemical agents used are substances with dehydrogenation properties that inhibit the formation
of tar and reduce the production of other volatile products. The activation of
wood using H3PO4 could be carried out at temperature less than 500oC(Bansal et al 1988), while ZnCl2 activation was carried at between 600oC to
709oC. The carbonization step generate the porosity, which becomes
accessible when the chemical is removed by washing (Caturla et al 1991,
Molina et al 1995). Consequently, the modification of chemical/precursor
ratio permits the adjustment of the porosity in the final activated carbon.
However, the most important disadvantage of chemical activation is the
incorporation of impurities, coming from the activating agent, which may affect the chemical properties of the activated carbon. Another disadvantage is
the investment needed for the unit for recovering chemical used for impregnation (Lozano et al 2001; Balci 1992).

15
2.4.2.5 Advantages of phosphoric acid over zinc chloride
The classical chemical used on a large scale for chemical activation was zinc chloride due to its efficiency and simplicity of the process. However,
its use is on the decline, because of the problems of corrosion, ineffective
chemical recovery and environmental disadvantages associated with zinc
chloride. This process produces activated carbons with large porosity, although the pore size distribution is determined for a given precursor mainly
by the degree of impregnation, that is, the larger the degree of impregnation,
the larger the average pore size of the final carbon. The activated carbon obtained using zinc chloride however, cannot be used in pharmaceutical and
food industries as it may contaminate the products. Hence, there have been
many studies reporting the activation of carbon using phosphoric acid,
because of the disadvantages associated with zinc chloride, phosphoric acid is used largely in industry to impregnate lignocellulosic materials, mainly wood.
Also, phosphoric acid includes important changes in the pyrolytic
decomposition of the lignocellulosic materials since it promotes
depolymerisation, dehydration and redistribution of constituent biopolymers (Jagtoyen and Derbyshire 1993), favouring the conversion of aliphatic to
aromatic compounds at temperatures lower than when heating in the absence
of an additive, thus increasing the yield. One of the reasons why activation with phosphoric acid has become popular is because of the improvements introduced in the process of acid recovery.
2.5 A REVIEW ON ACTIVATED CARBON PREPARATION
USING CHEMICAL ACTIVATION
The term chemical activation refers to the treatment of the
precursor with an activating agent used for restricting tar formation during the
thermal step. During thermal treatment, chemical activating agents such as
phosphoric acid and zinc chloride among others, provoke carbonization of the
precursor by dehydration, depolymerisation and redistribution of biopolymers

16
and cross linking of lignocellulosic materials (Jagtoyen and Derbyshire 1998).
Several coals (Ehrburger et al 1986, Ahmadpour & Do 1996, Teng et al 1998,
Lozano et al 2001), polymers (Park & Jung 2002, Puziy et al 2002), and some
agricultural by-products and forest wastes (Savova et al 2001, Garcia
et al 2003, Villegas et al 1993) have been used as raw materials to prepare
activated carbon.
Phosphoric acid activation has been used for a wide variety of
cellulosic precursors such as coconut shells (Laine et al 1989), white oak
(Jagtoyen & Derbyshire 1993), peach stones (Monlina et al 1996), nut shells
(Toles et al 1998), cotton stalks (Girgis & Ishak 1999), almond shells (Bevia
et al 1984, Toles et al 2000), pecan shells (Dastgheib & Rockstraw 2001),
Arundo donax cane (Vernerson et al 2002) and apple pulp (Garcia et al 2002),
peanut hull (Girgis et al 2002) and sugarcane bagasse (Girgis et al 1994,
Ahmedna et al 2000).
Ruiz et al (1984) prepared activated carbon from almond shell
using various activating agents like H3PO4, ZnCl2, K2CO3 and Na2CO3 at
700 C under N2 flow. Of the different activating reagents studied, zinc
chloride gave the highest surface area of 2111 m2 g-1. The surface area was
drastically reduced to 700 m2 g-1 for carbonization of ammonium chloride
impregnated almond and hazelnut shell in the flow of N2 at 700 C (Balci et al
1994). A good BET surface area activated carbon was reported (1071 m2 g-1)
at lower activation temperature (500 C) using pecan shell in the presence of
air and phosphoric acid (Dastgheib & Rockshaw 2001). Series of activated
carbons from almond, olive and peach stones chars by direct chemical
activation with zinc chloride at 800 C yielded a wide range of pore size
distribution (Rodriguez & Molina 1992).

17
Hu & Vansant (1995) reported a similar wide range of pore size
distribution of activated carbon from walnut shell char using potassium
hydroxide in the absence of air at 500-900 C. They found that higher
temperatures, longer activation times and larger amounts of potassium
hydroxide favoured high adsorption capacity and wide pore size distribution.
Philip & Girgis (1996) produced activated carbon from apricot stones using
phosphoric acid which yielded high surface area and microporous structure.
Activated carbon produced from palm oil shell, coconut shell, almond,
hazelnut, walnut shell, pistachio nut and apricot stones using K2CO3 (Hayashi
et al 2002) at 900oC and ZnCl2 (Aygun et al 2003) under N2 flow at 750oC,
yielded high surface area and well-developed micropore structure
respectively. A similar well-developed microporous structure with very small
proportion of mesoporous network was obtained by the activation of peach
stones using phosphoric acid. These have been further activated in a CO2 gas
flow at 825oC for various range of burn-off (Molina et al 1995, 1996).
Phosphoric acid, potassium hydroxide and zinc chloride were used as
activating agents for various nutshell species. Girgis et al (2002) and Guo &
Lua (2000) produced activated carbon from peanut hull and oil palm stones
using all three agents and activated at 500 and 650 C respectively. They
reported that zinc chloride and phosphoric acid activation yielded essentially
microporous network whereas the use of potassium hydroxide gave well-
developed mesoporous activated carbon.
Production of activated carbon from biological sludge (Martin et al
2002) and sewage sludge (Rozada et al 2003) by chemical activation using
phosphoric acid at 700 C for 30 min yielded mesoporous network with
certain percentage of macropores. Preparation of activated carbon from cork
waste using potassium hydroxide at 800 C for 2h yielded surface area of
1415 m2 g-1 (Carvalho et al 2003)

18
Srinivasakannan et al (2004) carried out a two-stage process for the
preparation of activated carbon from rubber wood saw dust. The two-stage
process with semi-carbonization up to 200 C for 15 min followed by
activation at 400 and 500 C for 30, 45, 60 and 90 min. Phosphoric acid was
used as an activating agent with various impregnation ratio (dry wt. of H3PO4/
dry wt. of rubber wood saw dust) of 1, 1.5, and 2. At the optimal conditions of
activation, activated carbon with iodine number and surface area of
1096 mg g-1 and 1496 m2 g-1 respectively were obtained.
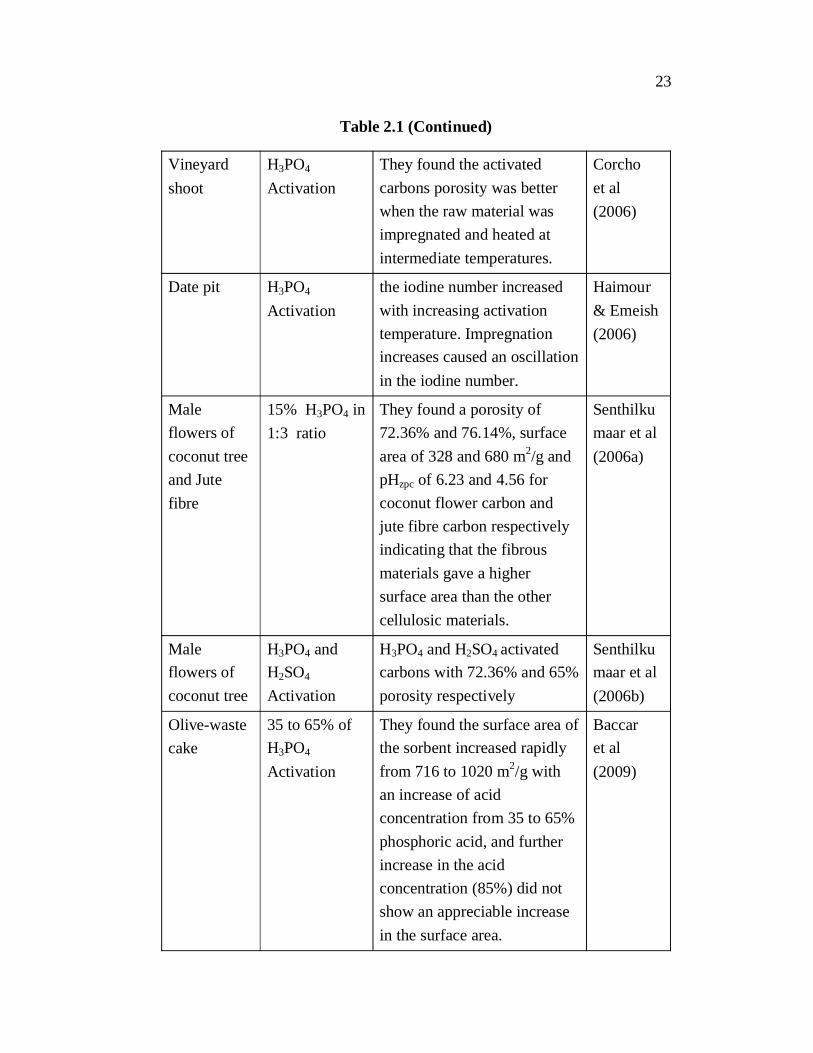
Corcho et al (2006) prepared activated carbon from vineyard shoot
using phosphoric acid as the activating agent. They found the activated
carbons porosity was better when the raw material was impregnated and
heated at intermediate temperatures. Haimour & Emeish (2006) reported
phosphoric acid activated date pit carbon, the iodine number increased with
increasing activation temperature. Impregnation increases caused an
oscillation in the iodine number.
Senthilkumaar et al (2006a) prepared activated carbon from male
flowers of coconut tree and jute fibre using 15% phosphoric acid in the ratio
1:3. They found a porosity of 72.36% and 76.14%, surface area of 328 and
680 m2/g and pHzpc of 6.23 and 4.56 for coconut flower carbon and jute fibre
carbon respectively indicating that the fibrous materials gave a higher surface
area than the other cellulosic materials. The porosity of the carbon varied
based on the activating agent, activated carbon prepared from coconut male
flower using phosphoric acid and sulphuric acid (Senthilkumaar et al 2006b)
yielded carbons with 72.36% and 65% porosity respectively.
Baccar et al (2009) prepared activated carbon from olive-waste
cake using phosphoric acid as a activating agent, carbon preparation
parameters such as concentration of the activating agent, impregnation ratio

19
and activation time were optimized. They found the surface area of the
sorbent increased rapidly from 716 to 1020 m2/g with an increase of acid
concentration from 35 to 65% phosphoric acid, and further increase in the
acid concentration (85%) did not show an appreciable increase in the surface
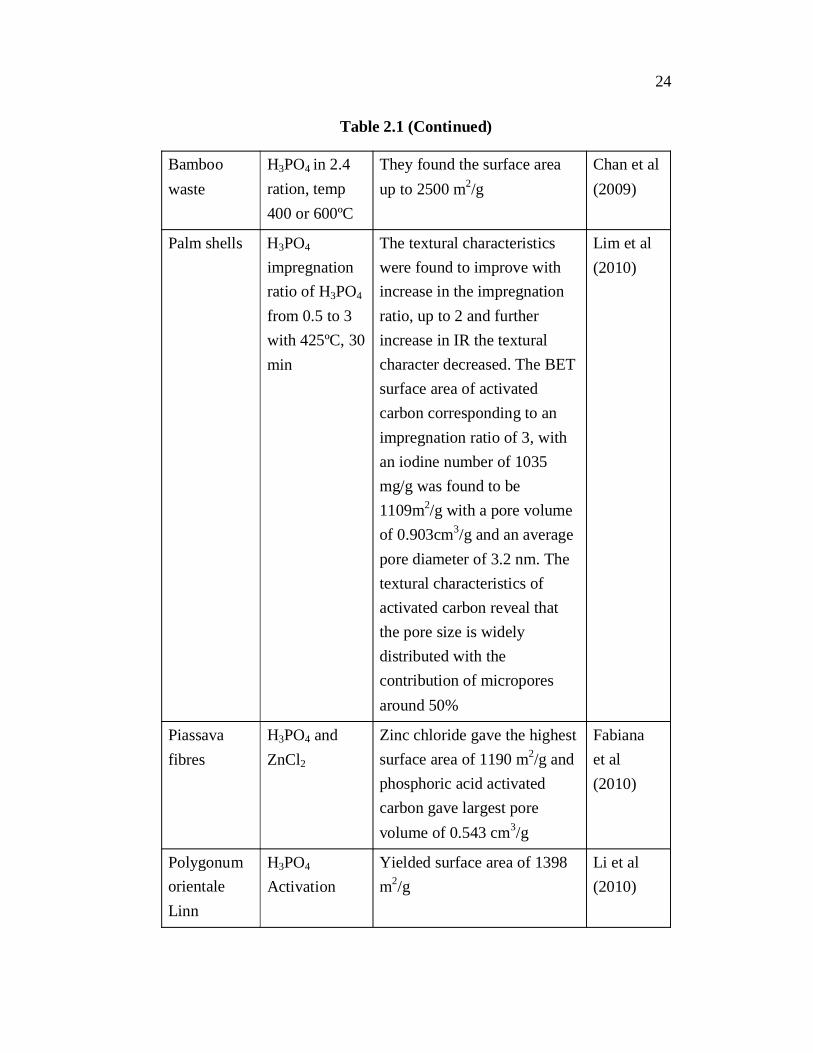
area. Chan et al (2009) prepared activated carbon from bamboo waste
scaffolding using phosphoric acid. They found the surface area up to
2500 m2/g of the activated carbon increased with impregnation ratio (2.4) and
activation temperature (400 or 600ºC).
Lim et al (2010) prepared activated carbon from palm shells by
phosphoric acid impregnation. They prepared carbon at low activation
temperature (425ºC) and activation time (30 min), while varying the
impregnation ratio of phosphoric acid from 0.5 to 3. The yield of activated
carbon was not vary with the impregnation ratio and was found to be about
50%. The textural characteristics were found to improve with increase in the
impregnation ratio, up to 2 and further increase in IR the textural character
decreased. The BET surface area of activated carbon corresponding to an
impregnation ratio of 3, with an iodine number of 1035 mg/g was found to be
1109m2/g with a pore volume of 0.903cm3/g and an average pore diameter of
3.2 nm. The textural characteristics of activated carbon reveal that the pore
size is widely distributed with the contribution of micropores around 50%.
Fabiana et al (2010) prepared activated carbon from piassava fibres
using chemical activation with zinc chloride and phosphoric acid and physical
activation with carbon dioxide or water vapour. Zinc chloride gave the highest
surface area of 1190 m2/g and phosphoric acid activated carbon gave largest
pore volume of 0.543 cm3/g. Li et al (2010) reported that activated carbon
prepared from polygonum orientale Linn by phosphoric acid activation gave a
surface area of 1398 m2/g.
20
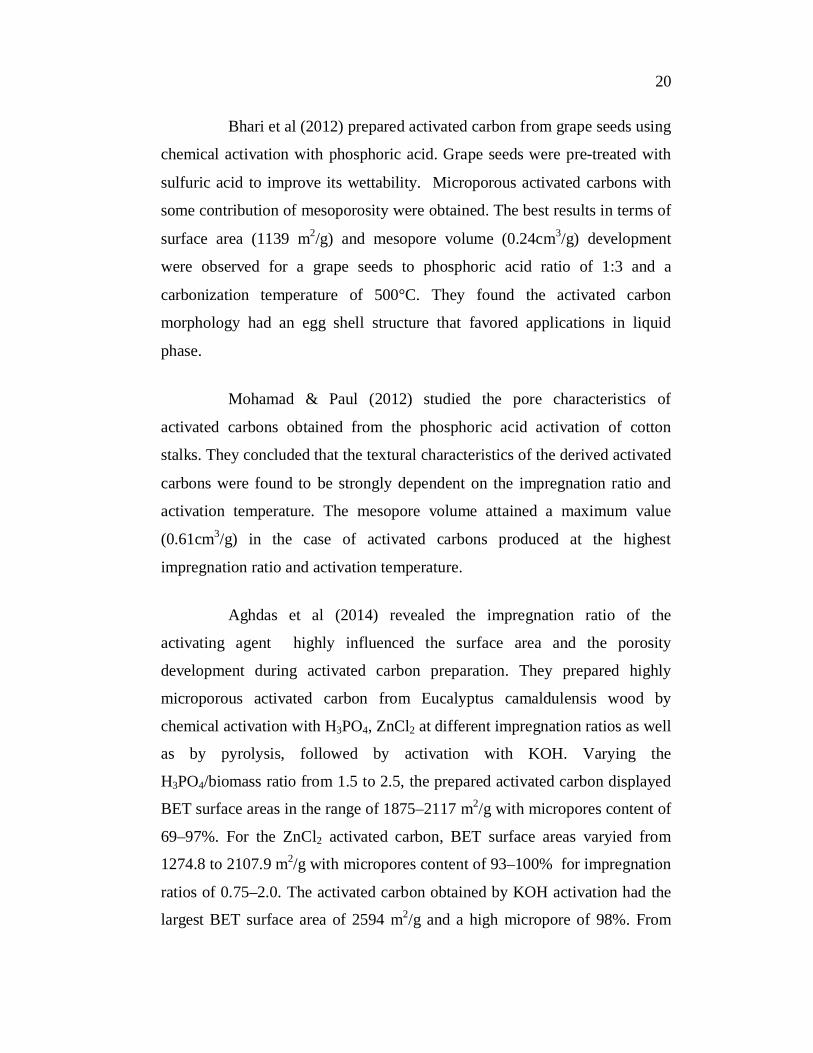
Bhari et al (2012) prepared activated carbon from grape seeds using
chemical activation with phosphoric acid. Grape seeds were pre-treated with
sulfuric acid to improve its wettability. Microporous activated carbons with
some contribution of mesoporosity were obtained. The best results in terms of
surface area (1139 m2/g) and mesopore volume (0.24cm3/g) development
were observed for a grape seeds to phosphoric acid ratio of 1:3 and a
carbonization temperature of 500°C. They found the activated carbon
morphology had an egg shell structure that favored applications in liquid
phase.
Mohamad & Paul (2012) studied the pore characteristics of
activated carbons obtained from the phosphoric acid activation of cotton
stalks. They concluded that the textural characteristics of the derived activated
carbons were found to be strongly dependent on the impregnation ratio and
activation temperature. The mesopore volume attained a maximum value
(0.61cm3/g) in the case of activated carbons produced at the highest
impregnation ratio and activation temperature.
Aghdas et al (2014) revealed the impregnation ratio of the
activating agent highly influenced the surface area and the porosity
development during activated carbon preparation. They prepared highly
microporous activated carbon from Eucalyptus camaldulensis wood by
chemical activation with H3PO4, ZnCl2 at different impregnation ratios as well
as by pyrolysis, followed by activation with KOH. Varying the
H3PO4/biomass ratio from 1.5 to 2.5, the prepared activated carbon displayed
BET surface areas in the range of 1875–2117 m2/g with micropores content of
69–97%. For the ZnCl2 activated carbon, BET surface areas varyied from
1274.8 to 2107.9 m2/g with micropores content of 93–100% for impregnation
ratios of 0.75–2.0. The activated carbon obtained by KOH activation had the
largest BET surface area of 2594 m2/g and a high micropore of 98%. From
21
the above they found that the activating agent and its concentration strongly
influenced the textural characteristics of the eucalyptus wood based activated
carbon.
Alicia et al (2014) studied the influence of activation atmosphere
used in the chemical activation of almond shell on the carbon characteristics.
They found activated carbons prepared at low and intermediate impregnation
ratios showed higher yields. This could be attributed to the decomposition of
the polymeric structures of the activated carbons during the activation stage
that release most elements different from carbon (N, H and O). Activating
agent employed permits the dehydration, depolymerization and redistribution
of the constituent polymers, and the conversion of aliphatic groups to
aromatics, increasing the yield of the activated carbons. Higher impregnation
ratios produce a higher elimination of tars of the pores decreasing the yield.
However, there are only a few publications reporting the
preparation of activated carbon from Agave sisalana fibre (Sisal fiber) and
Puninga granatum Peel (Pomegranate Peel) using phosphoric acid as
activating agent. One can design activated carbon for adsorption of specific
adsorbate, using approximate precursor and by optimizing the activation
process conditions. Cost effectiveness, cheap availability, higher adsorbate
loading capacity, relatively high surface area and high binding affinity were
the main criteria for choosing activated carbons to remove dyes from aqueous
solution. Taking this criteria into consideration, the present study was carried
out to determine the feasibility of using the relatively common, cheap and
thrown away waste Agave sisalana fibre (Sisal fiber) and Puninga granatum
Peel to prepare highly effective carbon with a large surface area. These
carbons were prepared using phosphoric acid as the impregnating agent by
chemical activation method followed by their characterization, for the
adsorption of reactive dye, acid dye and basic dye from aqueous solutions and
effluent, the studies being carried out in both batch and column mode.

22
Table 2.1 Summary of H3PO4 activation on physiochemical properties of activated carbon
Precursor Activating
Agent/ Parameters
Physicochemical Properties of Activated Carbon
Author
Almond shell
H3PO4, ZnCl2,K2CO3 &Na2CO3. Temp400-700°C
Of the different activating reagents studied, zinc chloride gave the highest surface area of 2111 m2 g-1
Ruiz et al (1984)
Apricot Stone
H3PO4 Yielded high surface area and microporous structure
Philip & Girgis (1996)
Peach stones H3PO4
followed by activated in a CO2 gas flow at 825oC
Well-developed microporous structure with very small proportion of mesoporous network was obtained
Molinaet al 1995, 1996
Peanut hull and Oil palm stones
H3PO4, KOH and ZnCl2
with 500 and 650 C
They reported that zinc chloride and phosphoric acid activation yielded essentially microporous network whereas the use of potassium hydroxide gave well-developed mesoporous activated carbon.
Girgis et al (2002)and Guo & Lua (2000)
Sewage sludge
H3PO4
700 C for
30 min
Yielded mesoporous network with certain percentage of macropores
Rozadaet al 2003
Rubberwood saw dust
H3PO4 400 & 500 C for 30, 45,60 & 90min
Maximum iodine number and surface area of 1096 mg g-1
and 1496 m2 g-1 respectively
Srinivasakannan et al (2004)
23
Table 2.1 (Continued)
Vineyardshoot
H3PO4
Activation They found the activated carbons porosity was better when the raw material was impregnated and heated at intermediate temperatures.
Corchoet al (2006)
Date pit H3PO4
Activation the iodine number increased with increasing activation temperature. Impregnation increases caused an oscillation in the iodine number.
Haimour & Emeish (2006)
Maleflowers of coconut tree and Jute fibre
15% H3PO4 in 1:3 ratio
They found a porosity of 72.36% and 76.14%, surface area of 328 and 680 m2/g and pHzpc of 6.23 and 4.56 for coconut flower carbon and jute fibre carbon respectively indicating that the fibrous materials gave a higher surface area than the other cellulosic materials.
Senthilkumaar et al (2006a)
Maleflowers of coconut tree
H3PO4 and H2SO4
Activation
H3PO4 and H2SO4 activated carbons with 72.36% and 65% porosity respectively
Senthilkumaar et al (2006b)
Olive-waste cake
35 to 65% of H3PO4
Activation
They found the surface area of the sorbent increased rapidly from 716 to 1020 m2/g with an increase of acid concentration from 35 to 65% phosphoric acid, and further increase in the acid concentration (85%) did not show an appreciable increase in the surface area.
Baccaret al (2009)
24
Table 2.1 (Continued)
Bamboo waste
H3PO4 in 2.4 ration, temp 400 or 600ºC
They found the surface area up to 2500 m2/g
Chan et al (2009)
Palm shells H3PO4
impregnation ratio of H3PO4
from 0.5 to 3 with 425ºC, 30 min
The textural characteristics were found to improve with increase in the impregnation ratio, up to 2 and further increase in IR the textural character decreased. The BET surface area of activated carbon corresponding to an impregnation ratio of 3, with an iodine number of 1035 mg/g was found to be 1109m2/g with a pore volume of 0.903cm3/g and an average pore diameter of 3.2 nm. The textural characteristics of activated carbon reveal that the pore size is widely distributed with the contribution of micropores around 50%
Lim et al (2010)
Piassavafibres
H3PO4 and ZnCl2
Zinc chloride gave the highest surface area of 1190 m2/g and phosphoric acid activated carbon gave largest pore volume of 0.543 cm3/g
Fabianaet al (2010)
Polygonum orientaleLinn
H3PO4
Activation Yielded surface area of 1398 m2/g
Li et al (2010)

25
Table 2.1 (Continued)
Grape seeds H3PO4
Impregnation ratio of 1:3 and temp 500°C
The best results in terms of surface area (1139 m2/g) and mesopore volume (0.24cm3/g) development were observed
Bhari et al (2012)
Cottonstalks
H3PO4
Activation They concluded that the textural characteristics of the derived activated carbons were found to be strongly dependent on the impregnation ratio and activation temperature. The mesopore volume attained a maximum value (0.61cm3/g) in the case of activated carbons produced at the highest impregnation ratio and activation temperature.
Mohamad& Paul (2012)
Eucalyptuswood
H3PO4,ZnCl2
followed by KOH
H3PO4 activated carbon BET surface areas in the range of 1875–2117 m2/g with micropores content of 69–97%. For the ZnCl2 activated carbon, BET surface areas varyied from 1274.8 to 2107.9 m2/g with micropores content of 93–100% for impregnation ratios of 0.75–2.0. The activated carbon obtained by KOH activation had the largest BET surface area of 2594 m2/g and a high micropore of 98%.
Aghdas et al (2014)

26
2.6 APPLICATION OF ACTIVATED CARBON
Activated carbon is a unique and effective agent for purification
and isolation and recovery of trace material. During the last three decades,
treatment with active carbon has become an important unit process for
separation and purification in wide range of industries. The various
applications can be broadly divided into two categories, (i) liquid-phase
applications (ii) gas-phase applications.
2.6.1 Gas-Phase Applications
This includes separation, gas storage and catalysis. These products
are generally more expensive than liquid phase carbons (Allen et al 1998).
Some of the gas-phase applications are listed below.
Recovery of solvents, e.g in rotogravure printing operations,
from coatings and in the packaging, food and chemicals
industries.
Natural gas purification; removal of H2S and BTX
Flue gas cleaning at waste incineration plants for the
removal of dioxins and heavy metals
Exhaust air treatment following production processes for the
removal of organic impurities
Purification of process gases, e.g. CO2; scrubbing and
separation of oil from compressed air
Removal of pollutants in airconditioning, ventilation and
exhaust systems
Removal of odourous substances in kitchen exhaust hoods
and refrigerator filters

27
Emission control, e.g. at filling stations and during tank
ventilation for motor vehicle and industrial applications
Pollutant removal in car interior ventilation systems in gas
masks
In cigarette and cigar filters
As a carrier medium for special impregnating agents or
catalysts
2.6.2 Liquid-Phase Applications
In the water treatment sector, activated carbon is used either in
powdered (suspension process) or granular (fixed bed process) form,
depending upon the specific application and process. The objectives pursued
with the use of activated carbon in water treatment have changed significantly
in recent decades. Years ago, activated carbon was employed primarily for the
removal of excess chlorine and the elimination of substances affecting odour
and taste from relatively good-quality raw water. Increasingly exacting
quality requirements for drinking water, coupled with increasing pollution
levels in untreated water (groundwater and surface water), have led to the
optimization of activated carbon as a means of guaranteeing acceptable
drinking water quality. In parallel, changes in treatment processes, such as the
reduction of high-strength chorine treatment, have resulted in the elimination
of traditional applications.
In recent years, the use of activated carbon processes has become
widely established in drinking water treatment, groundwater rehabilitation
and the treatment of service water. Likewise, activated carbon is being used to
an increasing extent in waste water treatment, whether it be in the systematic
treatment of individual effluent streams (e.g. in the chemicals industry), in the
removal of substances toxic to bacteria in biological waste water treatment or

28
in tertiary waste water treatment, where effluent restrictions are particularly
severe.
Among the wide range of physical, chemical and biological
processes used in waste water treatment, activated carbon adsorption is
gaining steadily in importance. The use of activated carbon is especially
advisable in cases requiring the removal of toxic substances or pollutants that
are not easily biodegradable. Activated carbon is almost always employed in
the treatment of waste water in the paper, textile and petrochemical industries.
The textile finishing industry generates a large amount of wastewater.
Wastewaters from dyeing and subsequent rinsing steps form one of the largest
contributions to wastewater generation in the textile industry. Because dyes
are almost invariably toxic, their removal from effluent stream is ecologically
necessary (Santhy & Selvapathy 2006).
2.7 TREATMENT OF TEXTILE EFFLUENTS
Environment is the broad concept encompassing the whole range of
diverse surroundings, which we perceive, experience and react to events and
changes that are taking place on it. It includes land, water and air. One of the
main problems prevailing in this environment is pollution. It is the unhealthy
and undesirable change in the environment that is caused directly or indirectly
by the human beings, either in the process by living or through any industrial
processes. Considering the volume discharge and effluent composition, the
wastewater generated by the textile industry is rated as one of the most
polluting among the industrial sectors. The dye is the major polluting agent of
water among the various processes. The principal route by which the dye
enters the environment is through wastewater from the manufacturing activity
in both the dye manufacturing and the dye consuming industries. It produces
large volume of effluents that are toxic, resistant to physiochemical treatments
and not easily biodegradable. The dyeing, bleaching and printing departments

29
contribute to the maximum dyeing effluents. Conventionally the wastewater
from the textile industry is treated using the following methods,
Primary treatment
Secondary or Biological treatment
Tertiary treatment
2.7.1 Primary Treatment
Primary treatment is done to remove the suspended solids and to
some extent to remove the colour and odour. This process includes screening,
neutralization, coagulation, sedimentation etc., screening process is mainly
done to remove the floating materials such as yarn, rags etc., equalization is
the process done mainly to maintain the pH and uniform flow throughout the
process. Coagulation is done to remove the suspended particles by using
alum, ferric chloride, ferrous sulphate and calcium chloride.
2.7.2 Secondary Treatment
Secondary treatment is done to break the complex organic
molecules to simpler substances. The biological treatment is also known as
the secondary treatment. This process involves aerobic and anaerobic
treatment. In aerobic treatment, the destruction takes place mainly in the
presence of oxygen and in the anaerobic treatment, destruction takes place in
the absence of oxygen. The secondary treatment involves activated sludge
process, trickling filtration, aerated lagoons and oxidation ponds. In the
trickling filtration process, the wastewater is brought in contact with that of
the microbial population in the form of a film of slime attached to the solid
surface as the supporting medium. The slimes formed on the stones oxidize
the waste during its passage. Aerated lagoons are activated sludge units
operated with the sludge return. In this aerated lagoon treatment, the effluent

30
from the primary treatment process is passed on to a tank and it is
mechanically aerated. An oxidation pond is a shallow pond in which the
waste is added at one end and the effluent is removed at the other end. Among
all the above processes the activated sludge process is employed widely.
2.7.3 Tertiary Treatment
Tertiary treatment is also termed as the advanced wastewater
treatment. The main purpose of this treatment is the reclamation of the water
for reuse resulting from the primary and biological treatments. This process
includes chemical coagulation/flocculation, membrane process,
electrochemical method, photolysis, ozonation and adsorption.
2.7.3.1 Coagulation/flocculation
The chemical coagulation/flocculation process is used to remove
colour, to reduce COD and suspended solids with the help of the chemicals
such as Fe3+/Cr3+, alum with lime etc., 50% reduction of COD and 57%
reduction of suspended solids were achieved in wool dyeing effluents using
100 mg/L of flucculant Zetas 92 (Norman & Seddon 1991). Lime and alum
mixture in dosage between 200 and 300 mg/L was the best coagulant mixture
to remove 80% of colour and 65% of BOD (Tapas et al 1998). The main
disadvantages of this method is the additional chemical load on the effluent
(normally increases salt concentration) which increases the sludge production
and leads to the incomplete dye removal.
2.7.3.2 Membrane process
Membrane processes involving the diffusion of a fluid through a
semi permeable membrane separating two solutions of different
concentrations and tending to equalize the concentration on the both sides of
31
the membrane. Semi permeable membrane has the ability to prevent the
passage of dissolved molecules while allowing passage solvent through the
membrane under pressure gradient (Marcucci et al 2001). This membrane
processes include reverse osmosis, ultrafiltration and nano filtration.
Reverse Osmosis membranes are susceptible to fouling due to
organics, colloids and microorganism. Scale causing constituents like
hardness and carbonate. Silica, heavy metals, oil etc has to be removed from
the feed. As the membranes are sensitive to oxidizing agents like chlorine or
ozone, they should also be absent. Ultra-filtration process is similar to reverse
osmosis. The difference between reverse osmosis and ultrafiltration is
primarily the retention properties of the membranes. Reverse osmosis
membranes retain all solutes including salts, while ultrafiltration membranes
retain only macro molecules and suspended solids. Thus salts, solvents and
low molecular weight organic solutes pass through ultrafiltration membrane
with the permeate water.
Nanofiltartion can be positioned between reverse osmosis and
ultrafiltration. Nanofiltration is essentially a lower pressure version
membrane where the purity of permeate water less important. This process is
used where the high salt rejection of reverse osmosis is not necessary. The
nanofiltration is capable of removing hardness elements such as calcium or
magnesium together with bacteria, viruses, and colour. Nanofiltration is
operated at lower pressure than reverse osmosis and as such the treatment cost
is lower than reverse osmosis treatment (CPCB 2007). Membrane separation
process is a new separation technology, with high separation efficiency, low
energy consumption, easy operation, no pollution and so on. However, this
technology is still not promoted on a large scale because it has the limitation
of requiring special equipment, high investment, membrane fouling and so on
(Ranganathan et al 2007).

32
2.7.3.3 Electrochemical methods
This process has an advantage of operating at low temperatures and
does not need the addition of reagents. Electrochemical technique is based on
effluent electrolysis in which the molecules are partially destroyed to avoid
excessive power consumption. This destruction of organic compounds can
occur directly at the anode and/or indirectly by species generated by the
anode. In the direct electrolysis method, an electron transfer reaction to or
from the undesired pollutant occurs at the surface of an electrode and in the
indirect electrolysis the dissolved redox reagent either exists in or is generated
from the electrolyte or from the electrode phase in order to participate in a
targeted reaction.
2.7.3.4 Photolysis
Photocatalysis is defined as the acceleration of a photoreaction in
the presence of a catalyst, while photolysis is defined as a chemical reaction
in which a chemical compound is broken down by photons. Photochemical
oxidation has many advantages of the mild reaction conditions (ambient
temperature and pressure), powerful oxidation ability and fast speed, etc. It
can be divided into 4 kinds, which are light decomposition, photoactivate
oxidation, optical excitation oxidation and photocatalysis oxidation. Among
them, the photocatalysis oxidation has been more researched and applied
currently. This technology can effectively destroy a lot of organic pollutants
whose structure is stable and difficult to biologically degrade. Compared with
the physical treatment in traditional wastewater treatment process, the most
obvious advantages of this technology are significant energy efficiency,
complete degradation of pollutants and so on. Almost all of the organic matter
can be completely oxidized to CO2, H2O and other simple inorganic
substances under the light catalyst. However, towards high concentration
wastewater, the effect of the photocatalysis oxidation process is not ideal. The

33
research about photocatalytic degradation of dye is mainly focused on the
study of photocatalyst (Peter 2011).
2.7.3.5 Ozonation
Ozone is one of the strongest oxidizers commercially available and
popular for disinfection of potable water. Besides this it has multiple
applications. Large, complex organic molecules, detergents, phenols etc. can
be broken into simpler compounds by ozonation. Among the industrial
applications, oxidation of organics and inorganics, deodorisation, and
decolourisation are the main usages. Ozone is an unstable gas at temperature
and pressure encountered in water and waste water treatment plants. For most
industrial applications ozone has to be produced at insitu. Although, there are
several methods by which ozone can generated, the corona discharge method
is a widely used procedure. An ozone generation unit incorporates a series of
electrodes fitted with cooling arrangements mounted in a gas tight container.
When the source gas (air or oxygen) is passed through narrow gap separating
electrodes, the oxygen gets converted into ozone. Ozone is applied to waste
water by means of diffuser tubes or turbine mixers. Ozone doses in level of 2
mg/L have been reported to result in virtually complete removal of colour and
hard pollutants such as detergents. The treated water after sand filtration
becomes clean and sparkling (CPCB 2007). In textile effluent it initiates and
accelerates azo bond cleavage. The negative effect is the release of
carcinogenic aromatic amines and otherwise toxic molecules and, therefore, it
should not be used (Sheng et al 1997).
2.7.3.6 Adsorption
Adsorption is the most used method in physicochemical wastewater
treatment, which can mix the wastewater and the porous material powder or
granules, such as activated carbon and clay, or let the wastewater through its

34
filter bed composed of granular materials. Through this method, pollutants in
the wastewater are adsorbed and removed on the surface of the porous
material or filter. Commonly used adsorbents are activated carbon, silicon
polymers and kaolin. Different adsorbents have selective adsorption of dyes.
But, so far, activated carbon is still the best adsorbent for dye wastewater. The
chroma can be removed to 92.17% and COD can be reduced to 91.15% in
series adsorption reactors, which meet the wastewater standard in the textile
industry and can be reused as the washing water. Because activated carbon
has selection to adsorb dyes, it can effectively remove the water-soluble dyes
in wastewater, such as reactive dyes, basic dyes and azo dyes, but it cannot
adsorb the suspended solids and insoluble dyes. Moreover, the activated
carbon cannot be directly used in the original textile dyeing wastewater
treatment, while generally used in lower concentration of dye wastewater
treatment or advanced treatment because of the high cost of regeneration
(Peter 2011).
2.8 ADVANTAGES OF ADSORPTION OVER OTHER
METHODS
Colour in dye house effluents has always been a difficult problem
to solve and the utilization of dyes has made it even more serious. Cooper
(1993) summarized the technologies used until then in order to remove or
atleast reduce colour, mentioning that some them have certain efficiency:
Coagulation and/or flocculation, membrane technologies, chemical oxidation
technologies, biochemical oxidation and adsorbent utilization. Among various
treatment technologies, adsorption onto activated carbon has proven to be one
of the most effective and reliable physicochemical treatment methodology
(McKay 1996, Sankar et al 1993). Ramesh et al (2007) reviewed the
advantages and disadvantages of various treatment techniques and are
presented in Table 2.1. The adsorption process has an edge over the other

35
treatment methods due to its sludge free operation, and complete removal of
dyes even from dilute solutions. The wide usefulness of activated carbon is a
result of its chemical and mechanical stability, high adsorption capacity and
high degree of surface reactivity (Malik 2003).
Table 2.2 Possible treatments for cotton textile wastes and their associated advantages and disadvantages (Ramesh et al, 2007)
Process Advantages Disadvantages References
Biodegradation Rates of elimination by oxidizable substances about 90%
Low biodegradability dyes
Pala & Tokat 2002; Ledakowicz et al 2001
Coagulation/ flocculation Elimination of insoluble dyes Production of sludge
blocking filter Gaehr et al 1994
Adsorption on activated carbon
Suspended solids and organic substances well reduced
Cost of activated carbon
Arslan et al 2000
Ozone treatment Good decolourization No reduction of the COD
Adams et al 1995; Lin & Chen 1997
Electrochemical Process
Capacity of adaptation of different volumes and pollution loads
Iron hydroxide sludge
Lin & Peng 1994; Lin & Chen 1997
Reverse osmosis Removal of all minerals salts, hydrolyzes reactive dyes and chemical auxiliaries
High Pressure Ghayeni et al 1998
Nanofiltration
Separation of organiccompounds of low molecular weight and divalent ions from monovalent salts. Treatment of high concentrations
-
Erswell et al 1998; Xu et al 1999; Akbari et al 2002; Tang & Chen 2002
Ultrafiltration-microfiltration Low pressure
Insufficient quality of the treated wastewater
Watters et al 1991; Rott & Minke 1999; Ciardelli & Ranieri 2001; Ghayeni et al 1998
Cost effectiveness and adsorption properties are the main criteria
for choosing an adsorption process to remove dyes from aqueous solution.
Adsorption process has higher selectivity. Adsorption based process offer a

36
more reliable and highly efficient in the removal of complex structure dyes
than many other conventional treatment methods.
The adsorption process achieves higher removal levels in a wide
range of solution conditions and generally reduces the quantity of sludge or
solid residuals that need to be disposed (Smith 1996). The adsorption
phenomenon has still been found to be economically appealing for the
removal of toxic dyes from textile effluents by choosing adsorbents under
optimum operating conditions. Therefore, the adsorption process is reported
to be the best method for removal of textile dyes.
2.9 ADSORPTION PROCESS
Adsorption (Slejko 1985, Suzuki 1990, Noll et al 1992) involves
the preferential partitioning of substances from the gaseous or the liquid phase
accompanied by its accumulation or concentration onto the surface of a solid
substrate. The adsorbing phase is the adsorbent, and the material concentrated
or adsorbed at the surface of that phase is the adsorbate.
2.9.1 Gas Phase Adsorption
This is a condensation process where the adsorption forces
condense the molecule from the bulk phase within the pores of the adsorbent.
The driving force for adsorption is the ratio of the partial pressure and the
vapour pressure of the compound.
2.9.2 Liquid Phase Adsorption
The molecules go from the bulk phase to being adsorbed in the
pores in a semi-liquid state. The driving force for adsorption is the ratio of the
concentration to the solubility of the compound.

37
2.9.3 Adsorption Mechanism
The adsorption process results from interaction between carbon
surface and the adsorbate. Those interactions can be electrostatic or non-
electrostatic. When the adsorbate is an electrolyte that dissociates in aqueous
solution, electrostatic interactions occur; the nature of interactions, that can be
attractive or repulsive, depends on the: (i) change in density of the carbon
surface: (ii) chemical characteristics of adsorbate: and (iii) ionic strength of
solution. Non electrostatic interactions are always attractive and include:
(i) Vander waals forces: (ii) hydrophobic interactions; and (iii) hydrogen
bonding (Joana et al 2007).
According to Moreno (2004), the properties of the adsorbate that
mainly influence the adsorption process in activated carbons are:
(1) Molecular size; (2) Solubility; (3) Dissociation constant of solution (pKa)
and (4) Nature of the substituents (in the case of aromatic adsorbate). The
molecular size determines the accessibility of the adsorbate to the pores of the
carbon, solubility determines the degree of hydrophobic interactions between
the adsorbate and the carbon surface and pKa controls the dissociation of
adsorbate (if it is an electrolyte). When the adsorbate is aromatic, the
substituents of the aromatic rings have the ability to withdraw or release
electrons, which therefore affects the non-electrostatic interactions between
the adsorbate and activated carbon surface.
Adsorption process is classified as either physical or chemical. Physical adsorption occurs when the Vanderwaals forces bind the adsorbing molecule onto the solid substrate; these intermolecular forces are the same as the bond molecules to the surfaces of a liquid. It follows that heats of adsorption are comparable in magnitude to latent heats (10 to 70 KJ/mol). Specifics that are physically adsorbed to a solid can be released by applying heat; the process is reversible. An increase in temperature causes a decrease in adsorption efficiency and capacity.
38
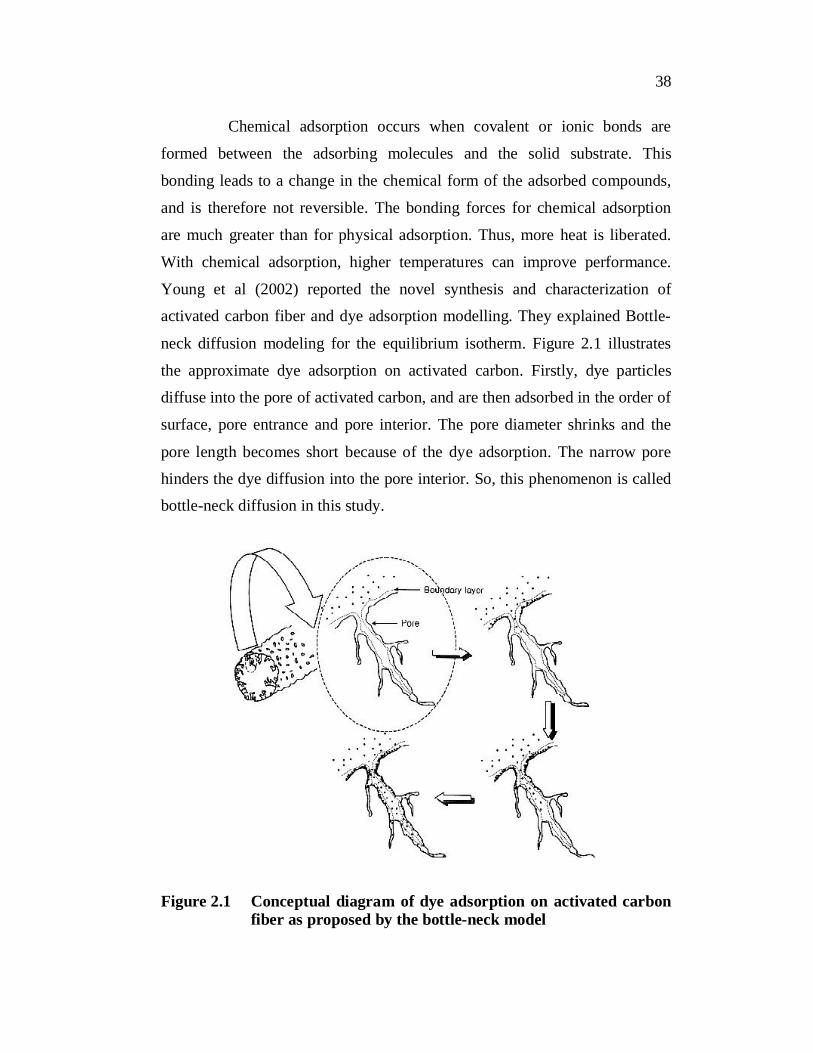
Chemical adsorption occurs when covalent or ionic bonds are
formed between the adsorbing molecules and the solid substrate. This
bonding leads to a change in the chemical form of the adsorbed compounds,
and is therefore not reversible. The bonding forces for chemical adsorption
are much greater than for physical adsorption. Thus, more heat is liberated.
With chemical adsorption, higher temperatures can improve performance.
Young et al (2002) reported the novel synthesis and characterization of
activated carbon fiber and dye adsorption modelling. They explained Bottle-
neck diffusion modeling for the equilibrium isotherm. Figure 2.1 illustrates
the approximate dye adsorption on activated carbon. Firstly, dye particles
diffuse into the pore of activated carbon, and are then adsorbed in the order of
surface, pore entrance and pore interior. The pore diameter shrinks and the
pore length becomes short because of the dye adsorption. The narrow pore
hinders the dye diffusion into the pore interior. So, this phenomenon is called
bottle-neck diffusion in this study.
Figure 2.1 Conceptual diagram of dye adsorption on activated carbon fiber as proposed by the bottle-neck model

39
2.10 ADSORBENTS
Adsorbents (Noll et all 1992, Oscik et al 1982) are porous materials
that contain many miniscule internal pores. The most common industrial
adsorbents are activated carbon, silica gel and activated alumina, because they
present enormous surface areas per unit weight. Activated carbon is produced
by thermal degradation of organic material to decompose it to granules of
carbon. Agro waste and animal waste are the common source. Typical surface
areas are 300 to 1500 m2/g. Silica gel is a matrix of hydrated silicon dioxide.
Silica is used to separate hydrocarbons. Typical surface areas are 300 to
900 m2/g. Activated alumina are commonly used to remove oxygenenates and
mercaptans from hydrocarbons and fluorides from water. Typical surface
areas are 200 to 400 m2/g. The adsorbent such as zeolite, carbon molecular
sieve, bone char, iron and manganese coated sand, kaolinite clay, hydrated
ferric oxide, activated bauxite, titanium oxide, silicium oxide and other
synthetic media are also widely used.
Activated carbons are known as very effective adsorbents due to
their highly developed porosity, large surface area, variable characteristics of
surface chemistry, and high degree of surface reactivity (Bansal et al 1988).
However, due to high production cost, these materials tend to be more
expensive than other adsorbents. Currently there are many studies on the
development of low-cost adsorbents, namely by using waste materials for that
purpose.
Activated carbon production costs can be reduced by either
choosing a cheap raw material or by applying a proper production method
(Lafi 2001); nevertheless, it is still a challenge to prepare activated carbon
with very specific characteristics, such as a given pore size distribution, and
using low-cost raw materials processed at low temperature (less energy cost)
(Sudaryanto et al 2006). Therefore, it is of extreme relevance to find suitable

40
low-cost raw materials that are economically attractive from the point of view
of their contribution to decrease the costs of waste disposal, therefore helping
environmental protection (Joana et al 2007).
2.11 ADSORBATE
The industrial wastewater usually contains a variety of organic
compounds and toxic substances which are harmful to fish and other aquatic
life. Dyeing wastewater discharged to natural receiving waters may make
them unacceptable for public consumption. Thus, it is desirable to eliminate
dyes from textile wastewater. Dyes are one of the hazardous groups that are
emitted into wastewaters from various industrial branches, mainly from the
dye manufacturing and textile finishing. Reactive dyes, Acid dyes and Basic
dyes are commonly used dyes for dyeing of Cotton, Silk, Wool and Acrylic
materials. The detailed classification of dyes is presented in section 2.12.
2.12 TEXTILE DYES
The dyeing industry uses various types of dyes. The dye contains
two components in it namely the chromophore and the auxochrome. The
chromophore as its name indicates is the colour containing compound and the
auxochrome is the backbone which holds the chromophore. The chromophore
configurations are represented by the azo group (-N=N-), ethylene group
(=C=C=), methine group (-CH=), carbonyl group (=C=O), carbon-nitrogen
(=C=NH; -CH=N-), carbon-sulphur (=C=S; CS-S-C ), nitro (-NO2; -NO-
OH), nitrozo (-N=O; =N-OH) or chinoid groups. The auxochrome groups are
ionizable groups, that confer to the dyes the binding capacity onto the textile
material. The usual auxochrome groups are: amino (-NH2), carboxyl
(-COOH), sulphonate (-SO3H) and hydroxyl (-OH) (Suteu et al 2011;
Welham 2000). These dyes have a conjugated system, that is a structure with
alternating single and double bond. The chromophore should be a part of this
41
conjugated system. These conjugations are present in benzene and azo
compounds. (IARC-WHO).
2.12.1 Classification of Textile Colorants
Textile colourants are classified into two classes one is water
soluble called are dyes and the other water insoluble called pigments (Allen
1971). The dyes are mainly classified as two categories based on its chemical
nature and its application. The Colour Index recognizes 26 types of dyes by
chemical classification. They are as follows: (1) Nitrazo, (2) Mono, dis-,
tri- and poly azo, (4) Azoic, (5) Stilbene, (6) Carotenoid, (7) Diphenyl
methane, (8) Triphenylmethane, (9) Xanthene, (10) Accridine, (11) Quinoline
(12) Methine and polymethine, (13) Thiazole, (14) Indamine and indolphenol,
(15) Azine, (16) Oxize, (17) Triazine, (18) Sulfur (19) Amino-Ketone
(20) Hydroxyl Ketone, (21) Anthraquinone, (22) Indigoid,
(23) Phthalocyanine, (24) Natural organic colouring matter, (25) Oxidation
bases and (26) Inorganic colouring matter.
It is convenient to use the classification based on its application, the
US International Trade Commission classified dyes based on the application
as follows: (1) Acid dyes, (2) Azoic dyes, (3) Basic dyes, (4) Direct dyes, (5)
Reactive dyes, (6) Mordant dyes, (7) Solvent dyes, (8) Sulfur dyes and (9) Vat
dyes. The use-wise classification of dyestuffs is more important from a
practical point of view as for the manufacturers market name and number.
2.12.1.1 Direct dyes
Direct cotton dyes have inherent substantivity for cotton and for
other cellulosic fibres. Chemically, direct dyes are sodium salt of aromatic
sulphonic acids and most of them contain an ‘azo’ group as the main
chromophore. These classes of dyestuffs are applied directly to the substrate
42
in a neutral or alkaline bath. The bath is then gradually heated, usually to the
boil, and additions of salt promote dyeing. Direct dyes give bright shades but
exhibit poor wash fastness (Koushik & Antao 2003).
2.12.1.2 Reactive dyes
Reactive dye is a type of water soluble anionic dye having good
affinity for cellulose fibres. In the presence of alkali, they react with hydroxyl
groups present in the cellulose and thus are linked with the fibre by means of
covalent bond. Fibre reactive dyes are relatively new dyes and are used
extensively on cellulosics when bright shades are desired. Reactive dyes,
particularly those used for dyeing of cotton, have become one of the major
classes of dye because of their good washing fastness, ability to produce
bright shades and versatility in application either by batch or continuous
dyeing methods.
2.12.1.3 Acid dyes
Acid dyes are organic sulphonic acids, the commercially available
forms are usually sodium salts, which exhibit good water solubility. In
sequence of their importance, acid dyes are mostly used with certain fiber
types such as polyamide, wool, silk, modified acrylic, and polypropylene
fibers, as well as blends of the aforementioned fibers with other fibers such as
cotton, rayon, polyester, regular acrylic, etc. According to their structure, acid
dyes belong to the following chemical groups: azo, anthraquinone,
triphenylmethane, pyrazolone, nitro and quinoline. Azo dyes represent the
largest and most important group followed by anthraquinone and
triarylmethane dyes.
43
2.12.1.4 Basic dyes
Basic dyes are called so since they are salts of organic bases, it is
also called as cationic dyes as in aqueous solution their molecules ionize into
coloured cations and colourless anions. Basic dyes are used for dyeing wool,
silk, acrylic and modacrylic fibres. The outstanding characteristics of the
basic dyes are the brilliance and intensity of their colours. They have poor
fastness to light and poor to moderate washing fastness. Basic dyes belong to
different chemical classes such as azo, diphenylmethane, triphenylmethane,
methane, acridine, xanthane, azine, induline, oxazine, thiazine, thiazole, etc.
2.12.1.5 Azoic dyes
Azoic dyes are a type of azo compound which is formed on the
fibre by first treating the fibre with a phenolic compound. The fibre is then
immersed in a solution containing a diazonium salt that reacts with the
phenolic compound to produce a coloured azo compound. Since the phenolic
compound is dissolved in caustic solution, these dyes are mainly used for
cellulose fibre, although other fibres can be dyed by modifying the process.
2.12.1.6 Vat dyes
Vat dyes are one of the oldest types of dye. It gives the best overall
fastness properties with cellulosic fibres. Its application involves reduction to
the water soluble leuco compound, dyeing the cotton and re-oxidation of the
leuco dye in the fibres to the insoluble pigment. Vat dyes are among the most
resistant dyes to both washing and sunlight. They are widely used on cotton,
linen rayon, and other cellulosic fibres.
44
2.12.1.7 Sulphur dyes
Sulphur dyes are a class of water insoluble dye that are applied in a
soluble, reduced form from a sodium sulfide solution and are then reoxidized
to the insoluble form on the fibre. Sulfur dyes are mainly used on cotton for
economical dark shades of moderate to good fastness to washing and light.
They generally give very poor fastness to chlorine.
2.12.1.8 Disperse dyes
Disperse dyes are with extremely low water solubility in water
which is in finely dispersed state. The size of a disperse dye particles is in the
region of approximately 0.5 – 1 m. Disperse dyes are applied in the form of
fine aqueous dispersion. The fibres readily coloured by disperse dyes are
cellulose acetate, polyester, acrylic, and nylon. Chemically,the disperse dye
belong to various classes such as azo, anthroquinone, methane and
diphenylamine.
2.12.1.9 Metal complex dyes
Metal complex dyes are also called pre-metallised acid dyes. This is
because a metal, usually chromium, is incorporated in the dye molecule
during its manufacture. The incorporation of metal in the dye molecule
enables the dye to be more readily applied to the fibre and therefore
facilitates a dyeing process that is relatively short.
2.13 REVIEW OF ADSORPTION OF REACTIVE DYES
Low & Lee (1997) studied the sorption of hydrolysed Reactive
Blue 2 on quaternized rice husk they showed that the binding capacity of the
sorbent was not suppressed by dye bath conditions of high concentration
electrolytes. Its sorption capacity decreased with increasing concentration of
45
NaOH. Complete regeneration of dye-coated quaternized rice husk was not
possible under base treatment, suggesting chemisorption of dye molecules on
the sorbent material. The physical stability of the quaternized rice husk was
examined by treating it with various concentrations of NaOH solution.
Results showed that no dissolution of sorbent occurred, even in 1 M NaOH
solution.
Ming & Hsing (2002) investigated the adsorption of C.I Reactive
red 189 (RR189) on cross-linked chitosan beads, including the effects of
particle sizes on the isotherm, and the effects of the initial dye concentrations,
temperature, pH and the epichlorohydrin/chitosan weight ratio on the kinetics
of the adsorption processes. The cross-linked chitosan beads have a high
adsorption capacity to remove dye RR 189. The maximum monolayer
adsorption capacities of cross-linked chitosan beads with diameters 2.3–2.5,
2.5–2.7 and 3.5–3.8mm were 1936, 1686 and 1642 g/kg, respectively, at pH
3.0, temperature 30ºC and epichlorohydrin/chitosan weight ratio of 0.2.
A decrease in the pH of the solutions lead to a large increase in the adsorption
capacity of dye RR189 on the cross-linked chitosan beads.
Khraisheh et al (2002) studied the rate-limiting steps of reactive
dye adsorption onto FS-400 activated carbon, elucidated through the
investigation of adsorption kinetics. They revealed initially that only 20% of
the available adsorption capacity was achieved during the first 6 h. Kinetic
profiles showed that the adsorption process was mainly controlled by external
diffusion during the first 30 min of the reaction, after which internal diffusion
controlled the process. The interruption test method identified the rate-
limiting steps; the results showed that sorption of reactive dyes onto FS-400
were mainly controlled by internal diffusion. Furthermore, the external and
internal diffusion coefficients and the desorption rate decreased after the
interruption period. The same parameters increased when the solution

46
temperature was raised. The thermodynamic parameters studied showed that
the adsorption of reactive dyes onto activated carbon was endothermic and
was mainly controlled by internal diffusion with a minor effect of external
diffusion.
Daniela & Doina (2005) studied the adsorption capacity of
commercial powdered activated charcoal when used for the sorption of
reactive dye Brilliant Red HE-3B from aqueous solutions. The sorption of
reactive dye Brilliant Red HE-3B on activated carbon has an insignificant
variation with pH in the range 5–11, when the sulphonic acid groups of the
dye are completely deprotonated. Because the pH of the aqueous dye solution
is about 7. The dye amount sorbed increased with increasing dye
concentration but the percent of dye removal decreased. The amount of dye
sorbed increase with increasing temperature, suggesting an endothermic
process. Also they found high temperatures favor the dye molecule diffusion
in the internal porous structure of activated carbon.
Santhy & Selvapathy (2006) investigated the removal efficiency of
activated carbon prepared from coir pith towards three highly used reactive
dyes in textile industry C.I Reactive orange 12, C.I Reactive red 2 and C.I
Reactive Blue 4 in batch mode. Adsorption of dyes was found to follow the
Freundlich model. Kinetic studies indicated that the adsorption followed first
order and the values of the Lagergren rate constants of the dyes were in the
range of 1.77 10-2 to 2.69 10-2 min-1. The column experiments using
granular form of the carbon (obtained by agglomeration with polyvinyl
acetate) showed that adsorption efficiency increased with an increase in bed
depth and decrease of flow rate. The bed depth service time (BDST) analysis
carried out for the dyes indicated a linear relationship between bed depth and
service time. The exhausted carbon could be completely regenerated and put

47
to repeated use by elution with 1.0 M NaOH. They also found the adsorption
studies significantly reduced COD levels of the textile wastewater.
Senthilkumaar et al (2006a) investigated the adsorption of Reactive
red dye (RR) onto Coconut tree male flower carbon (CFC) and Jute fibre
carbon (JFC) from aqueous solution. Quantitative removal of Reactive red
dye was achieved at strongly acidic conditions for both the carbons studied.
The adsorption isotherm data fitted well to the Langmuir isotherm and the
adsorption capacity were found to be 181.9 and 200 mg/g for CFC and JFC,
respectively. By Elovich model to study the mechanism of adsorption,
calculated qe values agreed well with the qe experimental values, supporting
chemisorption. Analysis of mechanistic steps involved in the adsorption
process confirmed that the adsorption process was film-diffusion controlled.
Xiaoyan & Bushra (2005) studied the adsorption equilibrium and
kinetics of three reactive dyes from their single-component aqueous solutions
onto activated carbon in a batch reactor. The results show that the modified
pseudo-first-order kinetic model generates the best agreement with the
experimental data for the three single-component adsorption systems. The
adsorption equilibrium and kinetics of three adsorption systems (RN/F400,
RR/F400 and RY/F400) were studied. It was found that the adsorption
equilibrium of the three adsorption systems could be fitted by the four-
parameter Fritz–Schlünder isotherm model. Effects of the initial
concentration and adsorbent particle size on adsorption rate were investigated.
The rate constant of the modified pseudo-first-order kinetic model was found
to decrease with both increasing initial concentration and increasing adsorbent
size. It was also found that the rate constant of RY/F400 system was much
larger than that of RR/F400 system, which in turn was slightly larger than that
of RN/F400 system. This was attributed to the difference in molecular size
and polarity of the three reactive dyes.

48
Orfao et al (2005) studied that the surface chemistry of activated
carbons plays a key role in the performance of the reactive dye adsorption
process. The adsorption kinetics of the C.I. Reactive red 241 on the three
activated carbons (slightly basic - commercial, acid, and basic - prepared in
the context of this study) was well described by the second order model in the
wide pH range studied (2–12). Langmuir provides the best fit. Irrespective of
the solution pH, the adsorption of the reactive dye on basic activated carbons
was favoured, mainly due to the dispersive interactions between the
delocalized electrons in the carbon basal planes and the free electrons in the
dye molecules (aromatic rings and N=N bonds). In relation to reactive dyes,
the pH value must be lower than the pH of the activated carbon under
consideration in order to maximize adsorption.
Ponnusami et al (2007) investigated the biosorption of reactive red
RGB on rice husk treated with nitric acid. The efficiency of color removal
was determined after 60 min of treatment. They investigated that nitric acid
treated rice husk is effective in removal of reactive dye and could provide an
economical solution for removal of such dyes from aqueous solutions. For
50 mg/L solution maximum color removal of 96.33% was achieved with
pH 2, 5 g/L of adsorbent, and 40°C. Similarly for 250 mg/L solution
maximum color removal was achieved at pH 2, 50 g/L of adsorbent and 40ºC.
They found adsorbent dosage, initial concentration of dye and solution pH
were highly significant.
Chung (2007) examined the equilibrium and dynamic adsorption
of Procion Red MX-5B onto CNTs at various pHs and temperatures. The
adsorption capacity was highest when 0.25 g/L CNTs was added. The results
suggested that the adsorption of Procion Red MX-5B on CNTs decreased as
the pH but increased with temperature. RL lay between zero and unity,
revealing that the adsorption of Procion Red MX- 5B on CNTs was favorable.
49
The adsorption of Procion Red MX-5B onto CNTs was endothermic, the
result was supported by the increasing adsorption of Procion Red MX-5B
with temperature. The values of H , G and Ea all suggested that the
adsorption of Procion Red MX-5B onto CNTs was a physisorption process
and was spontaneous.
Yahya et al (2007) examined that the activated carbon with a large
surface area (820 m2/g) and a modest surface charge density (0.54 group/nm2)
was shown to be effective in removing anionic reactive dyes from solution. At
pH 7.0 and 298 K, the maximum adsorption values as described using the
Langmuir equilibrium isotherm model was 0.27, 0.24, and 0.11 mmol/g for
C.I. Reactive Blue 2, C.I. Reactive Yellow 2 and C.I. Reactive Red 4 dyes,
respectively. The formation of a complete monolayer was not achieved and
the fraction of surface coverage was calculated as 0.45, 0.42, and 0.22 for C.I.
Reactive Blue 2, C.I. Reactive Yellow 2 and C.I. Reactive Red 4 dyes,
respectively. The adsorption capacity of the dyes on activated carbon
increased in acidic solutions, but decreased in basic solutions.
Al-Degs et al (2009) examined a good removal of problematic
reactive dyes by fixed-bed activated carbon column. The characteristics of
MTZ of reactive yellow and black adsorption indicated that a better column
adsorber is achieved at longer bed-depth and diluted inlet dye concentration.
A service time of 36.5 h (at 90% exhaustion) was reported for reactive yellow
adsorption at carbon bed-depth 0.09 m, inlet dye concentration 0.19 kgm 3,
flow rate 5.0×10 6 m3min 1, pH 5, and particle diameter 600–710 m.
Analysis of reactive yellow adsorption data by BDST model revealed that
3.5 h was needed to exhaust 1.0 cm of carbon bed-depth at 50% break through
point.

50
Vijayaraghavan et al (2009) investigated the treatment of complex
Remazol dye effluent using sawdust and coal based activated carbon.
A complex Remazol dye effluent, comprised of four reactive dyes and
auxiliary chemicals, was decolorized using SPS-200 (sawdust-based) and
SPC-100 (coal-based) activated carbon and it was revealed that the pore
diameter plays a vital role in the adsorption of reactive dyes. The average pore
diameter of SPS-200 was higher than SPC-100 and thus, possess a high
adsorption capacity. This study also highlighted that the pore size of activated
carbon plays an important role in the uptake and adsorption kinetics of a dye.
Fernando et al (2011) studied that the multiwall carbon nanotube
(MWCNT) and powdered activated carbon (PAC) were good adsorbents to
remove Reactive Red M-2BE (RRM) textile dye from aqueous solutions. The
best condition was established with respect to pH and contact time to saturate
the available sites located on the adsorbent surface. Three kinetic models were
used to adjust the adsorption, and the best fit was the Avrami fractional
kinetic model. The equilibrium isotherm of the RRM dye was obtained, and
these data fit best to the Liu isotherm model. The maximum adsorption
capacities were 335.7 and 260.7 mg g 1 for MWCNT and PAC, respectively.
The thermodynamic parameters of adsorption ( H°, S° and G°) were
calculated. For treatment of simulated industrial textile effluents, the
MWCNT adsorbent presented very good performance for removing at least
98.7% of the mixture of dyes in a medium containing high saline
concentrations.

51
Table 2.3 Summary of adsorption results in reactive dye adsorption
Adsorbent Adsorbate Adsorption result Reference Quarternized rice husk
Reactive Blue 2
Sorption capacity decreased with increasing concentration of NaOH.
Low & Lee (1997)
Cross-linked chitosan beeds
Reactive Red 189
The maximum monolayer adsorption capacities of cross-linked chitosan beads with diameters 2.3–2.5, 2.5–2.7 and 3.5–3.8mm were 1936, 1686 and 1642 g/kg, respectively
Ming & Hsing (2002)
FS-400 activated carbon
Reactive dye The thermodynamic parameters studied showed that the adsorption of reactive dyes onto activated carbon was endothermic and was mainly controlled by internal diffusion with a minor effect of external diffusion
Khraisheh et al (2002)
Powdered activated charcoal
Brilliant Red HE-3B
The amount of dye sorbed increase with increasing temperature, suggesting an endothermic process. Also they found high temperatures favor the dye molecule diffusion in the internal porous structure of activated carbon.
Daniela & Doina (2005)
Coir pith C.I Reactive orange12, C.I Reactive red 2 and C.I Reactive Blue 4
Adsorption of dyes was found to follow the Freundlich model. Kinetic studies indicated that the adsorption followed first order. The bed depth service time (BDST) analysis carried out for the dyes indicated a linear relationship between bed depth and service time. 1.0 M NaOH was found as a desorption agent. They also found the adsorption studies significantly reduced COD levels of effluent.
Santhy & Selvapathy (2006)

52
Table 2.3 (Continued)
Coconut tree male flower carbon and Jute fibre carbon
Reactive red dye
The adsorption isotherm data fitted well to the Langmuir isotherm and the adsorption capacity were found to be 181.9 and 200 mg/g for CFC and JFC, respectively.
Senthil kumaar et al (2006a)
Commerical Activated Carbon (F400)
Reactive Red, Reactive Yellow, Reactive N
It was found that the adsorption equilibrium of the three adsorption systems could be fitted by the four-parameter Fritz–Schlünder isotherm model.
Xiaoyan & Bushra (2005)
Commercial activated carbon (Slightly basic - commercial, acid, and basic)
C.I. Reactive Red 241
Langmuir provides the best fit. Irrespective of the solution pH, the adsorption of the reactive dye on basic activated carbons was favoured, mainly due to the dispersive interactions between the delocalized electrons in the carbon basal planes and the free electrons in the dye molecule
Orfao et al (2005)
Rice husk Reactive Red RGB
For 50 mg/L solution maximum color removal of 96.33% was achieved with pH 2, 5 g/L of adsorbent, and 40°C. They found adsorbent dosage, initial concentration of dye and solution pH were highly significant.
Ponnusami et al (2007)
Carbon Nano Tubes
Procion Red MX-5B
The adsorption of Procion Red MX-5B onto CNTs was endothermic, the result was supported by the increasing adsorption of Procion Red MX-5B with temperature. The values of H , G and Ea all suggested that the adsorption of Procion Red MX-5B onto CNTs was a physisorption process and was spontaneous.
Chung (2007)

53
Table 2.3 (Continued)
Commercial activated carbon
C.I. Reactive Blue 2, C.I. Reactive Yellow 2 and C.I. Reactive Red 4
The maximum adsorption values as described using the Langmuir equilibrium isotherm model was 0.27, 0.24, and 0.11 mmol/g for C.I. Reactive Blue 2, C.I. Reactive Yellow 2 and C.I. Reactive Red 4 dyes, respectively. The formation of a complete monolayer was not achieved and the fraction of surface coverage was calculated as 0.45, 0.42, and 0.22 for C.I. Reactive Blue 2, C.I. Reactive Yellow 2 and C.I. Reactive Red 4 dyes, respectively.
Yahya et al (2007)
Commercial activated carbon
Reactive Yellow
Analysis of reactive yellow adsorption data by BDST model revealed that 3.5 h was needed to exhaust 1.0 cm of carbon bed-depth at 50% break through point.
Al-Degs et al (2009)
Sawdust and coal based activated arbon
Complex Remazol dye
They highlighted that the pore size of activated carbon plays an important role in the uptake and adsorption kinetics of a dye
Vijaya raghavan et al (2009)
Multiwall carbon nanotube (MWCNT) and powdered activated carbon (PAC)
Reactive Red M-2BE
The maximum adsorption capacities were 335.7 and 260.7 mg g 1 for MWCNT and PAC, respectively
Fernando et al (2011)

54
2.14 REVIEW OF ADSORPTION OF ACID DYE
Soheil et al (2007) studied the removal of acid orange 7 from
aqueous solutions by using powdered activated carbon with an initial
concentration of 150 ppm to 350 ppm and initial pH values of 2.8, 5.8, 8.0
and 10.5 at 25ºC in batch mode. They found that in most cases, after 75 min
the removal of acid orange 7 is performed. They found the removal percent
of acid orange 7 decreases with increase in its initial concentration. The
maximum removal percent of acid orange 7 was 96.24% at a pHi of 2.8 and Ci
of 150 ppm and the minimum was 48.05% at pHi of 5.8 and Ci of 350 ppm.
The results indicated that the application of different initial pH values,
similar experimental conditions altered the acid orange 7 removal no more
than 90.6%.
Chan et al (2008) studied the adsorption of acid dye using bamboo
based activated carbon. Activated carbon of two different sizes like high
surface area and low surface area were prepared by thermal activation with
phosphoric acid impregnation. Two different acid dyes with varying
molecular sizes were used for adsorption namely Acid Yellow 117 and Acid
blue 25. The dye with smaller molecular size (Acid blue 25) was readily
adsorbed onto the carbon where as the larger size dye (Acid Yellow 117)
showed little adsorption. Thus by changing the conditions for AC preparation
it is possible to produce tailor-mode activated carbon for the adsorption of dye
mixtures in industrial applications, especially textile dyeing.
Mohamed et al (2004) compared the surfactant-modified
mesoporous FSM-16 with activated carbon for the removal of acid yellow and
acid blue. Activated carbon was prepared from rice husk with an
impregnation of H3PO4 at 773K. It was found that that the ultimate capacity of

55
the adsorbents varied in the order FSM-16 > modified FSM- 16 > Activated
carbon and it followed first order kinetics. As compared to activated carbon of
micro porous character, the CTAB/FSM-16 sample achieved higher
performance at low concentrations. This was due to the successful narrowing
of the pore opening of FSM-16 using CTAB but retaining a considerable
portion of the pore volume.
Malik (2003) prepared an activated carbon from low-cost
mahogany sawdust and rice husk which is used to remove the Acid yellow 36
from the aqueous solution. Study revealed that the pH value of 3 is favourable
for the adsorption of acid dye. Adsorption capacities of saw dust carbon and
rice husk carbon were found to be 183.8 mg and 86.9 mg/g. It was observed
that both the adsorbents could be employed as low-cost alternatives to
commercial activated carbon in wastewater treatment for the removal of acid
dyes.
Amina et al (2006) investigated the adsorption capacity of
commercial activated carbon was used as parent and heated products for the
removal of Acid Blue 74, Acid Red 73 and Acid Yellow 23 from aqueous
solution. Thermal treatment resulted in some enhancement in the porosity
characteristics (specific area and pore volume) particularly in micropores,
although insignificant changes appear in the surface chemical properties.
Evaluated capacity and affinity parameters demonstrated that the
uptake of the acid dyes decreased in the order of Acid blue > Acid Red > Acid
yellow, which may be due to chemical structure differences in substituents
and side chains leading to unavailable accessibility. Heated carbons exhibit a
reduction in uptake of Acid Blue, and an increase in case of Acid Yellow and
Acid Red dyes. Changes in surface chemical groups, under action of heat

56
probably influence the adsorbate/adsorbent, adsorbate/liquid and
adsorbent/liquid relationships leading to the apparent differences. Further they
found, thermal activation leads to a small enhancement in microporosity due
to the removal of adsorbed gases acquired during processing and storing.
Indra et al (2006) studied the removal of orange-G and methyl
violet dyes on low cost adsorbent derived from bagasse fly ash. Effective pH
for orange-G and methyl violet were 4 and 5 in which batch studies were
performed. Greater percentage of dye was removed with decrease in the initial
concentration of dyes, and increase in amount of adsorbent used. Physico-
chemical characteristics, surface area, pore volume and pore size observed
exhibit potential use of BFA as adsorbent. Thermogravimetric analysis
exhibited the thermal stability of BFA even at temperature up to 300ºC.
Shaobin & Huiting (2007) studied dye adsorption mechanism on
unburned carbon with kinetic modelling. Here adsorption method was
investigated using unburned carbon from coal combustion residue for the
decolourisation of typical acidic and basic dyes. Since higher solution pH
favoured the adsorption of basic dye while it reduced the adsorption in case of
acid dye. The adsorption of dye increased with increasing temperature but
decreased with increasing particle size. For Basic Violet, the adsorption
involves both physical and chemical processes while the adsorption is the
main process for the Acid Black. Finally it was found that the unburned
carbon showed high adsorption capacity of 1.97 10-4 and 5.27 10-4 mol/g for
Basic Violet 3 and Acid Black 1.
Ewa & Grazyna (2007) found that the adsorption characteristics of
Congo Red on bituminous coal-based mesoporous activated carbon. The
mesopore contribution to the total pore volume ranged from 52 to 83%. The
57
adsorption tests were performed under static conditions at solution pH 7.8-
8.3. Activated carbon at the point of zero charge pH 10 was maintained. It
was found that higher the fraction of mesopores with a size between 10 and
50 nm, the shorter the time to achieve the equilibrium stage for Cango Red
adsorption. The activated carbon were characterized by mesopore volume
between 0.271 and 0.471 cm3/g and high mesopore contribution to the porous
texture, ranging from 53.4 to 82.1%. The monolayer adsorption capacity of
activated carbon was found to increase with increase in both the mesopore
volume and the mesopore contribution to their porous texture.
Purkait et al (2005) investigated the performance of activated
carbon on eosin dye in which adsorption study was conducted in batch and
column mode. The effects of various operating conditions like pH, initial dye
concentration and temperature were investigated for the batch operation and
also the effect of changing the bed depth was studied for column adsorption.
Breakthrough curves for column adsorption were also studied. It has been
experimentally investigated that the regeneration of spent carbon by
desorbing the dye by means of applying a surfactant enhanced carbon
regeneration technique using both cationic and anionic surfactants. It was
observed that the desorption of the dye was favoured at highly basic pH
(desorption was 46% at a pH of 12).
They also studied use of cationic surfactant resulted in about 23%
desorption but significantly higher desorption (about 70 and 63%) were
obtained using the anionic surfactants with 2000 mg/L of surfactant
concentration after 40 min of operation. It was found that the comparison
between the model and the experimental results were satisfactory.

58
Table 2.4 Summary of adsorption results in acid dye adsorption
Adsorbent Adsorbate Adsorption Results Reference
Powderedactivated carbon
Acid
Orange 7
The maximum removal percent of acid orange 7 was 96.24% at a pHi
of 2.8 and Ci of 150 ppm and the minimum was 48.05% at pHi of 5.8 and Ci of 350 ppm.
Soheil et al (2007)
Bamboo basedactivated carbon
Acid Yellow117 and Acid blue 25
They found changing the conditions for activated carbon preparation it is possible to produce tailor-mode activated carbon for the adsorption of dye mixtures in industrial applications, especially textile dyeing
Chan et al (2008)
Rice husk Acid Yellow
They found found that that the ultimate capacity of the adsorbents varied in the order FSM-16 > modified FSM- 16 > Activated carbon and it followed first order kinetics.
Mohamedet al (2004)
Mahogany sawdust and rice husk
Acid yellow 36
Adsorption capacities of saw dust carbon and rice husk carbon were found to be 183.8 mg and 86.9 mg/g
Malik(2003)
Commercial activated carbon
Acid Blue 74, Acid Red 73 and Acid Yellow 23
Evaluated capacity and affinity parameters demonstrated that the uptake of the acid dyes decreased in the order of Acid blue > Acid Red > Acid yellow, which may be due to chemical structure differences in substituents and side chains leading to unavailable accessibility.
Amina et al (2006)

59
Table 2.4 (Continued)
Bagasse fly ash
Orange-G andMethylviolet
Greater percentage of dye was removed with decrease in the initial concentration of dyes, and increase in amount of adsorbent used. Physico-chemical characteristics, surface area, pore volume and pore size observed exhibit potential use of bagasse fly ash activated carbon.
Indra et al (2006)
Coalcombustion residue
Acid black 1
They found that the unburned carbon showed high adsorption capacity of 5.27 10-4 mol/g
Shaobin & Huiting (2007)
Bituminous coal
Congo Red
The monolayer adsorption capacity of activated carbon was found to increase with increase in both the mesopores volume and the mesopores contribution to their porous texture
Ewa & Grazyna(2007)
Commercial activated carbon
Eosin dye adsorption study was conducted in batch and column mode. The effects of various operating conditions like pH, initial dye concentration and temperature were investigated for the batch operation and also the effect of changing the bed depth was studied for column adsorption. cationic surfactant resulted in about 23% desorption but significantly higher desorption.
Purkait et al (2005)
2.15 REVIEW OF ADSORPTION OF BASIC DYE
Tan et al (2007) showed that oil palm fibre was a promising
precursor to be used in the preparation of activated carbon for the removal of

60
methylene blue dye from aqueous solutions over a wide range of
concentrations. The equilibrium data was best described by Langmuir
isotherm model, with maximum monolayer adsorption capacity of
277.78 mg/g at 30°C. The kinetics of the adsorption process was found to
follow the pseudo-second order model and the process was endothermic in
nature.
Karagozoglu et al (2007) studied sepiolite, fly ash and apricot
stone activated carbon (ASAC) as adsorbents for the investigation of the
adsorption kinetics, isotherms and thermodynamic parameters of the Astrazon
Blue FGRL from aqueous solutions and various concentrations (100–300 mg/L),
adsorbent doses (3–12 g/L) and temperatures (303–323 K). The result showed
that the adsorption capacity of the dye increased with increasing initial dye
concentration, adsorbent dose and temperature. The kinetics of adsorption of
the basic dye followed pseudo-second-order kinetics. The adsorption
capacities calculated from the Langmuir isotherm were 181.5 mg/g for
ASAC, 155.5 mg/g for sepiolite and 128.2 mg/g for fly ash at 303 K.
Thermodynamical parameters were also evaluated for the dye–adsorbent
systems and revealed that the adsorption process was endothermic in nature.
Demirbas et al (2008) prepared activated carbon from apricot stone
with H2SO4 activation and its ability to remove astrazon yellow 7GL, from
aqueous solutions was studied. The optimum conditions for removal of the
basic dye were found to be pH 10, 6 g/L of adsorbent dosage and equilibrium
time of 35 min, respectively. The basic dye adsorbent system showed that the
removal rate was heavily dependent on diffusion controlled kinetic models.
The adsorption isotherm data were fitted well to Langmuir isotherm and the
capacity was 221.23 mg/g at 50oC. Thermodynamics parameters were also
evaluated. The values of enthalpy and entropy were 49.87 kJ/mol and
31.93 J/mol K, respectively, indicating that this process was spontaneous and
endothermic.
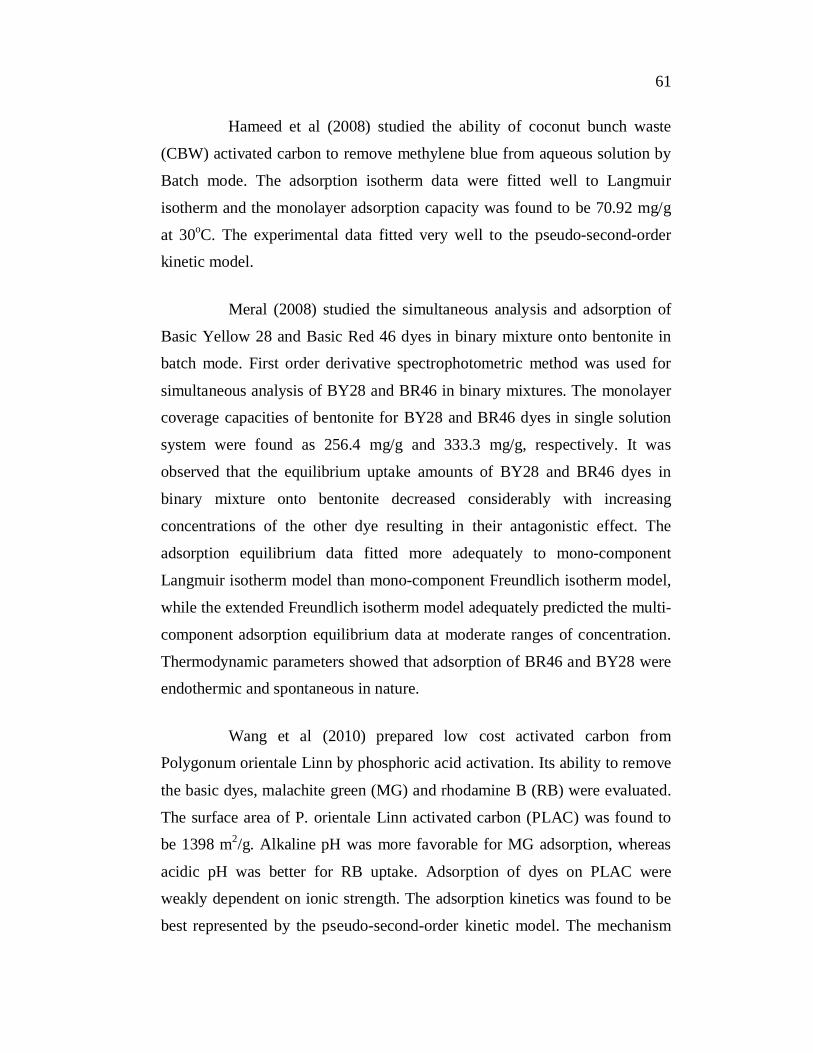
61
Hameed et al (2008) studied the ability of coconut bunch waste
(CBW) activated carbon to remove methylene blue from aqueous solution by
Batch mode. The adsorption isotherm data were fitted well to Langmuir
isotherm and the monolayer adsorption capacity was found to be 70.92 mg/g
at 30oC. The experimental data fitted very well to the pseudo-second-order
kinetic model.
Meral (2008) studied the simultaneous analysis and adsorption of
Basic Yellow 28 and Basic Red 46 dyes in binary mixture onto bentonite in
batch mode. First order derivative spectrophotometric method was used for
simultaneous analysis of BY28 and BR46 in binary mixtures. The monolayer
coverage capacities of bentonite for BY28 and BR46 dyes in single solution
system were found as 256.4 mg/g and 333.3 mg/g, respectively. It was
observed that the equilibrium uptake amounts of BY28 and BR46 dyes in
binary mixture onto bentonite decreased considerably with increasing
concentrations of the other dye resulting in their antagonistic effect. The
adsorption equilibrium data fitted more adequately to mono-component
Langmuir isotherm model than mono-component Freundlich isotherm model,
while the extended Freundlich isotherm model adequately predicted the multi-
component adsorption equilibrium data at moderate ranges of concentration.
Thermodynamic parameters showed that adsorption of BR46 and BY28 were
endothermic and spontaneous in nature.
Wang et al (2010) prepared low cost activated carbon from
Polygonum orientale Linn by phosphoric acid activation. Its ability to remove
the basic dyes, malachite green (MG) and rhodamine B (RB) were evaluated.
The surface area of P. orientale Linn activated carbon (PLAC) was found to
be 1398 m2/g. Alkaline pH was more favorable for MG adsorption, whereas
acidic pH was better for RB uptake. Adsorption of dyes on PLAC were
weakly dependent on ionic strength. The adsorption kinetics was found to be
best represented by the pseudo-second-order kinetic model. The mechanism

62
of the adsorption process was determined from the intraparticle diffusion
model. The equilibrium adsorption data was well described by the Langmuir
model. Thermodynamic study showed that the adsorption was spontaneous
and endothermic process.
Eren & Eren (2010) studied the adsorption behavior of crystal
violet (CV+) from aqueous solution onto a manganese oxide-coated (MCS)
sepiolite sample. The Langmuir monolayer adsorption capacity of MCS was
estimated as 319 mg/g. The pseudo-first-order, pseudo-second-order kinetic
and the intra-particle diffusion models were used to describe the kinetic data
and rate constants were evaluated. The values of the energy (Ea), enthalpy
H°) and entropy of activation ( S°) were 56.45 kJ/mol, 53.90 kJ/mol and
117.26 J/ (mol K), respectively, at pH 6.5. The quite high adsorption
capacity and high adsorption rate of MCS was an important advantage for use
of this material in basic dye solutions.
Dalia et al (2012) prepared adsorbent from kenaf fibre using HCl as
activating agent (3 M). The highest percentage removal of Methylene blue
dye (MB) was found to be 95 wt% at a concentration of 50 mg/L. At a pH of
8.5, the sorption of dye was favorable. The equilibrium data was best
represented by the Langmuir isotherm model and the reaction followed
pseudo- second-order model. Thermodynamic studies indicated that the
adsorption was endothermic in nature.
Kumar et al (2013) studied the adsorption kinetics of Acid Blue 113
(AB), Basic Red 5 (BR) and Reactive Yellow 81 (RY) textile dyes. They
determined the influence of the initial dye concentration of aqueous solutions
on the adsorption kinetics. The experiments, carried out in a batch reactor,
allowed the determination of the equilibrium times ( 1 h for RY and AB and
4 h for BR). The adsorption results were perfectly fitted to the pseudo-
second order, predicting a significant intra-particle diffusion stage in the

63
controlling of the adsorption process. Moreover, the fit to Elovich equation,
confirms that the process is ensured by chemisorption on a highly
heterogeneous material.
Hassani et al (2014), using response surface methodology (RSM)
studied the effects of operational parameters on the removal of two dyes (C.I.
Basic Blue 3 (BB3) and C.I. Basic Yellow 2 (BY2)) using coal as the low-
cost and available adsorbent. Quadratic central composite design (CCD) was
used for experiments designing, process modeling and optimization. The
investigated variables were initial concentration of dye (10–50 mg/L),
adsorbent dosage (0.4–2 g/L), temperature (12–60°C) and contact time
(5– 45 min). The significance of the model and regression coefficients were
tested by the analysis of variance (ANOVA), residuals analysis and t-test
statistics. For both dyes, the adsorption process was mainly influenced by the
initial concentration of the dyes and adsorbent dosage, whereas the other
factors showed lower effects. Different color removal efficiencies were
obtained for the dyes with different chemical structures. The optimum initial
concentration of dye, adsorbent dosage, temperature and contact time were
found to be 30 mg/L, 1.5 g/L, 25°C and 10 min. Under optimal conditions,
high removal efficiency of dyes (97.08% and 91.29% respectively for BY2
and BB3) were obtained.
Mohamed et al (2013) investigated that the adsorption of basic
yellow from aqueous solution by natural stevensite, having 104 m2/g specific
surface area. They found an alkaline pH favoured basic yellow adsorption and
the adsorption reached equilibrium in about 20 min. They concluded that the
adsorption process was governed by the electrostatic interaction. The
isothermal data were fitted by means of Langmuir and a monolayer
adsorption capacity of 454.54 mg/g was calculated. Finally, a good agreement
was found between the pseudo-second order model and the experimental data.

64
A high maximum adsorption capacity was obtained (526 mg/g) and a
maximum surface density of ~9 dye molecules/nm2 was estimated, involving
a column arrangement of the adsorbed molecules.
Emad et al (2008) compared the adsorption capacity of different
types of activated carbons produced by steam activation. Equilibrium
behavior of the activated carbons was investigated by performing batch
adsorption experiments using bottle-point method. Basic dyes (methylene
blue (MB), basic red (BR) and basic yellow (BY)) were used as adsorbate. It
was found that PAC2 (activated carbon produced from New Zealand coal
using steam activation) has the highest adsorptive capacity towards MB dye
(588 mg/g) followed by F400 (commercial activated carbon) (476 mg/g) and
PAC1 (Activated carbon Produced from Venezuelan bituminous coal in a
laboratory scale using physical activation) (380 mg/g). BR and BY showed
higher adsorptive affinity towards PAC2 and F400 than MB. Under
comparable conditions, adsorption capacity of basic dyes, MB, BR and BY
onto PAC1, PAC2 and F400 increased in the order of MB < BR< BY.
Redlich–Peterson model was found to describe the experimental data over the
entire range of concentration under investigation.
Lei & Yong (2014) studied the removal of anionic (methyl orange,
MO) and cationic dyes (methylene blue, MB) using Jerusalem artichoke stalk
based mesoporous activated carbon (MAC) as adsorbent. In batch adsorption
experiments they found that the adsorption data of both dyes fitted well to the
Langmuir model and pseudo second-order kinetic model. MB and MO
adsorbed by MAC were of endothermic and exothermic nature, respectively.
Acidic condition promotes the anionic dye molecules moving onto MAC
surface by electrostatic attraction, while it limits the initial adsorption rate of
cationic dye. The intra-particle diffusion was involved in the whole diffusion
process, but not the sole rate-controlling step. They calculated film diffusion

65
coefficient (Df) values 10-6 – 10-8 cm2/s, as two orders of magnitude higher
than intra-particle diffusion coefficient (Di) values, indicating the film
diffusion controls the whole diffusion rates of the dye molecules moving from
aqueous solution onto solid surface. Moreover, the Di values for both dyes
obtained in present study were superior to many reported carbon adsorbents.
This higher Di values were the result of more developed internal surface of
MAC as higher mesoporosity, which promotes the diffusion rate.
Table 2.5 Summary of adsorption results in basic dye adsorption
Adsorbent Adsorbate Adsorption Results Reference
Oil palm fibre Methyleneblue
The equilibrium data was best described by Langmuir isotherm model, with maximum monolayer adsorption capacity of 277.78 mg/g at 30°C.
Tan et al (2007)
Sepiolite, fly ash and apricot stone activated carbon(ASAC)
Astrazon Blue FGRL
The adsorption capacities calculated from the Langmuir isotherm were 181.5 mg/g for ASAC, 155.5 mg/g for sepiolite and 128.2 mg/g for fly ash at 303 K.
Karagozoglu et al (2007)
Apricot stone with H2SO4
activation
Astrazon yellow7GL
The basic dye adsorbent system showed that the removal rate was heavily dependent on diffusion controlled kinetic models. The adsorption isotherm data were fitted well to Langmuir isotherm and the capacity was 221.23 mg/g at 50oC.
Demirbas et al (2008)

66
Table 2.5 (Continued)
Coconutbunch waste (CBW)
Methyleneblue
The adsorption isotherm data were fitted well to Langmuir isotherm and the monolayer adsorption capacity was found to be 70.92 mg/g at 30oC. The experimental data fitted very well to the pseudo-second-order kinetic model.
Hameed et al (2008)
Binarymixture onto bentonite
BasicYellow 28 and Basic Red 46
The monolayer coverage capacities of bentonite for BY28 and BR46 dyes in single solution system were found as 256.4 mg/g and 333.3 mg/g, respectively. It was observed that the equilibrium uptake amounts of BY28 and BR46 dyes in binary mixture onto bentonite decreased considerably with increasing concentrations of the other dye resulting in their antagonistic effect.
Meral(2008)
Polygonum orientale Linn by phosphoric acidactivation
The basic dyes,malachite green (MG) and rhodamine B (RB)
The adsorption kinetics was found to be best represented by the pseudo-second-order kinetic model. The mechanism of the adsorption process was determined from the intraparticle diffusion model. The equilibrium adsorption data was well described by the Langmuir model.
Wang et al (2010)

67
Table 2.5 (Continued)
Manganese oxide-coated(MCS) sepiolitesample
Crystalviolet (CV+)
The Langmuir monolayer adsorption capacity of MCS was estimated as 319 mg/g. The pseudo-first-order, pseudo-second-order kinetic and the intra-particle diffusion models were used to describe the kinetic data and rate constants were evaluated. The values of the energy (Ea),enthalpy ( H°) and entropy of activation ( S°) were 56.45 kJ/mol, 53.90 kJ/mol and
117.26 J/ (mol K), respectively, at pH 6.5.
Eren & Eren (2010)
Kenaf fibre using HCl as activating agent
Methyleneblue
The highest percentage removal of Methylene blue dye (MB) was found to be 95 wt% at a concentration of 50 mg/L. At a pH of 8.5, the sorption of dye was favorable.
Dalia et al (2012)
Commercial activated carbon
Acid Blue 113 (AB), Basic Red 5 (BR) and Reactive Yellow 81 (RY)
The adsorption results were perfectly fitted to the pseudo-second order, predicting a significant intra-particle diffusion stage in the controlling of the adsorption process. Moreover, the fit to Elovich equation, confirms that the process is ensured by chemisorption on a highly heterogeneous material.
Kumar et al (2013)

68
Table 2.5 (Continued)
Coal Basic Blue 3 (BB3) and Basic Yellow 2 (BY2)
The optimum initial concentration of dye, adsorbent dosage, temperature and contact time were found to be 30 mg/L, 1.5 g/L, 25°C and 10 min. Under optimal conditions, high removal efficiency of dyes (97.08% and 91.29% respectively for BY2 and BB3) were obtained.
Hassani et al (2014)
Naturalstevensite
Basicyellow
The isothermal data were fitted by means of Langmuir and a monolayer adsorption capacity of 454.54 mg/g was calculated. Finally, a good agreement was found between the pseudo-second order model and the experimental data. A high maximum adsorption capacity was obtained (526 mg/g) and a maximum surface density of ~9 dye molecules/nm2 was estimated, involving a column arrangement of the adsorbed molecules.
Mohamed et al (2013)

69
Table 2.5 (Continued)
Differenttypes of activated carbons
Basic dyes (methylene blue (MB), basic red (BR) and basicyellow(BY)
It was found that PAC2 (activated carbon produced from New Zealand coal using steam activation) has the highest adsorptive capacity towards MB dye (588 mg/g) followed by F400 (commercial activated carbon) (476 mg/g) and PAC1 (Activated carbon Produced from Venezuelan bituminous coal in a laboratory scale using physical activation) (380 mg/g).
Emad et al (2008)
Jerusalem artichoke stalk based mesoporous activated carbon(MAC)
Methylorange, Methyleneblue
In batch adsorption experiments they found that the adsorption data of both dyes fitted well to the Langmuir model and pseudo second-order kinetic model. MB and MO adsorbed by MAC were of endothermic and exothermic nature, respectively. The intra-particle diffusion was involved in the whole diffusion process, but not the sole rate-controlling step. The higher Di values were the result of more developed internal surface of MAC as higher mesoporosity, which promotes the diffusion rate.
Lei & Yong (2014)

70
2.16 SUMMARY OF LITERATURE SURVEY
Activated carbon is prepared by different methods both physical
and chemical activation as well as combination of both physical and chemical
activation. The drawback of physical activation is that the yields are relatively
poor while also required higher temperature for the activation process. A
number of literature is available for the chemical activation process using the
different chemical activating agent. Chemical activation gives higher yields of
carbon as well as larger pore size in the carbon is created. Mesopores
development is normally desired in treatment of effluents. As the activated
carbon produced is highly dependent on the raw materials used as well as the
activation procedure. In order to optimize parameters for the activation
process information from literature though in plenty cannot be directly
applicable to a particular biomass chosen leading to extensive experimental
work for its optimization as carried in the further studies.