Discrete Probability Distributions. Probability Distributions.
Upload
mavis-kelleyCategory
view
217download
1
Chapter 2: Frequency Distributions

2
25 32 28 2927 20 25 3128 23 31 1917 21 29 3524 34 30 2822 29 24 3024 25 33 2721 18 34 2619 22 29 2930 24 27 3226 27 30 3624 23 22 2323 25 32 33
Control Group Experimental Group
16 18 20 22 24 26 28 30 32 34
Control Group
Exam Score
16 18 20 22 24 26 28 30 32 34
Experimental Group
Exam Score
36

3
Example 2.1
8, 9, 8, 7, 10, 9, 6, 4, 9, 8, 7, 8, 10, 9, 8, 6, 9, 7, 8, 8,
f
2
5
7
3
2
0
1
x
10
9
8
7
6
5
4

4
Example 2.1b
8, 9, 8, 7, 10, 9, 6, 4, 9, 8, 7, 8, 10, 9, 8, 6, 9, 7, 8, 8,
x f fx
10 2 20
9 5 45
8 7 56
7 3 21
6 2 12
5 0 0
4 1 4

5
Example 2.2
8, 9, 8, 7, 10, 9, 6, 4, 9, 8, 7, 8, 10, 9, 8, 6, 9, 7, 8, 8,
x f p=f/N %=p(100)
10 2 2/20=0.10 10%
9 5 5/20=0.25 25%
8 7 7/20=0.35 35%
7 3 3/20=0.15 15%
6 2 2/20=0.10 10%
5 0 0/20=0.00 0%
4 1 1/20=0.05 5%

Grouped Frequency Distribution• When a frequency distribution table lists all of the
individual categories (X values) it is called a regular frequency distribution.
• Sometimes the scores covers a wide range of values: 82, 75, 88, 93, 53, 84, 87, 58, 72, 94, 69, 84,
61, 91, 64, 87, 84, 70, 76, 89, 75, 80, 73, 73, 60
• A list of all the X values is too long to be a “simple” presentation of the data.
• To remedy this situation, a grouped frequency distribution table is used.

7
Forming Class Intervals of a Grouped Frequency Distribution
1. Approximately 10 class intervals
2. Interval width a relatively simple number (e.g. 2, 5, 10, or 20)
3. Bottom score of each interval a multiple of the width
4. Same width

8
Table 2.2 Grouped Frequency Distribution Table
82, 75, 88, 93, 53, 84, 87, 58, 72, 94, 69, 84,
61, 91, 64, 87, 84, 70, 76, 89, 75, 80, 73, 73, 60
x f
90-94 3
85-89 4
80-84 5
75-79 4
70-74 3
65-69 1
60-64 3
55-59 1
50-54 1

Frequency Distribution Graphs
9

10
x f
6 1
5 2
4 2
3 4
2 2
1 1
Scores
4
3
2
1
1 2 3 4 5 6 7
Frequency

11
x f
12-13. 4
10-11. 5
8-9. 3
6-7. 3
4-5. 2
4
3
2
1
1 2 3 4 5 6 7
Scores
Frequency
8 9 10 11 12 13 14
5

12
5
10
15
20
Frequency
Personality Type
A B C

13
x f
6 1
5 2
4 2
3 4
2 2
1 1
Scores
4
3
2
1
1 2 3 4 5 6 7
Frequency

14
4
3
2
1
1 2 3 4 5 6 7
Scores
Frequency
x f
6 1
5 2
4 2
3 4
2 2
1 1
Frequency bar graph

15
x f
12-13. 4
10-11. 5
8-9. 3
6-7. 3
4-5. 2
4
3
2
1
1 2 3 4 5 6 7
Scores
Frequency
8 9 10 11 12 13 14
5

16
4
3
2
1
1 2 3 4 5 6 7
Scores
Frequency
8 9 10 11 12 13 14
x f
12-13. 4
10-11. 5
8-9. 3
6-7. 3
4-5. 2
5

17
5
10
15
20
25
30
1 2 3 4 5
Score
f
.10
.20
.30
.40
.50
.60
1 2 3 4 5
Score
f
x f
5 10
4 20
3 5
2 10
1 5
x f p
5 10 10/50=0.20
4 20 20/50=0.40
3 5 5/50=0.10
2 10 10/50=0.20
1 5 5/50=0.10

18
x f p %
5 10 10/50=0.20 20%
4 20 20/50=0.40 40%
3 5 5/50=0.10 10%
2 10 10/50=0.20 20%
1 5 5/50=0.10 10%
x f p %
5 80 80/400=0.20 20%
4 160 160/400=0.40 40%
3 40 40/400=0.10 10%
2 80 80/400=0.20 20%
1 40 40/400=0.10 10%
N=50
N=400

19

20
100 13211668 84
IQ scores
Rel
ativ
e fr
eque
ncy

21
Any distribution can be described by 3 characteristics:
1. Shape
2. Central tendency
3. Variability

22
Symmetrical Distributions
Skewed Distributions
Positive skew Negative skew

23
A B C D
HGFE
Frequency Distributions

24
Percentile Ranks and Percentiles :
• The percentage of scores in the distribution at or below a particular score is known as a percentile rank.
• The score corresponding to a specific percentile rank is known as a percentile score.

25
1.3, 5.2, 4.0, 4.2, 3.0, 2.1, 4.3, 2.9, 1.0
3.8, 3.9, 3.3, 3.1, 1.9, 3.4, 2.2, 2.9, 1.8
3.0, 2.7
5
4
3
2
1

26
x f cf c%
5 1 20 100%
4 5 19 95%
3 8 14 70%
2 4 6 30%
1 2 2 10%

27
0.5 1.5 2.5 3.5 4.5 5.5
cf = 0
cf = 2
cf = 6
cf = 14
cf = 19
cf = 20
x = 1f = 2
x = 2f = 4
x = 3f = 8
x = 4f = 5
x = 5f = 1

28
x f cf c%
5 1 20 100%
4 5 19 95%
3 8 14 70%
2 4 6 30%
1 2 2 10%
10%
10%
30%
70%
95%
100%
0%.5
1.5
2.5
3.5
4.5
5.5
29
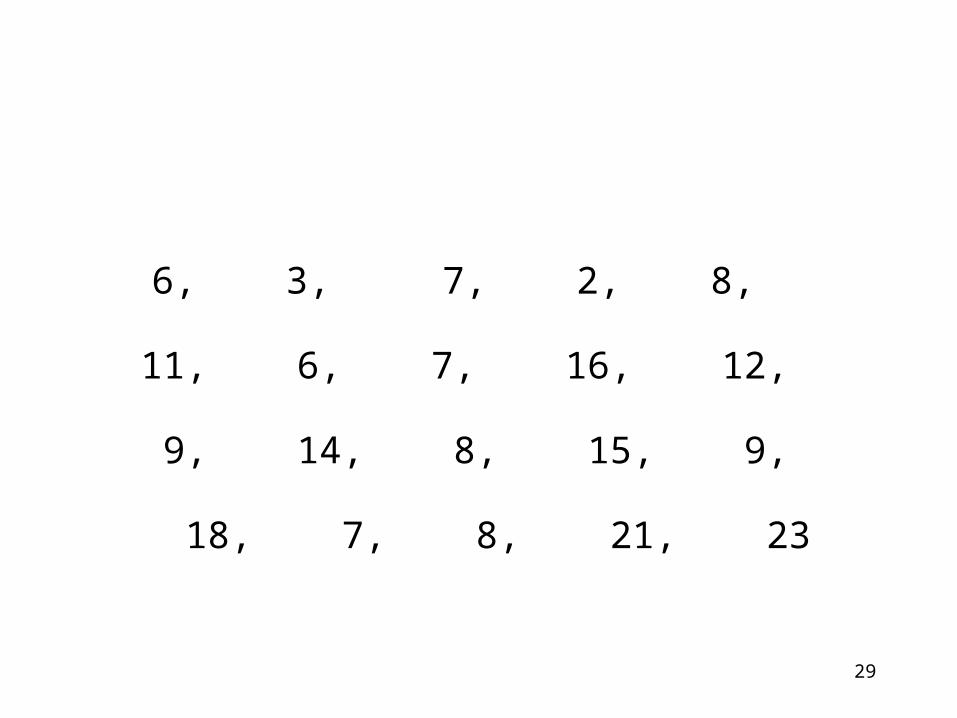
6, 3, 7, 2, 8, 11, 6, 7, 16, 12,
9, 14, 8, 15, 9, 18, 7, 8, 21,
23
30
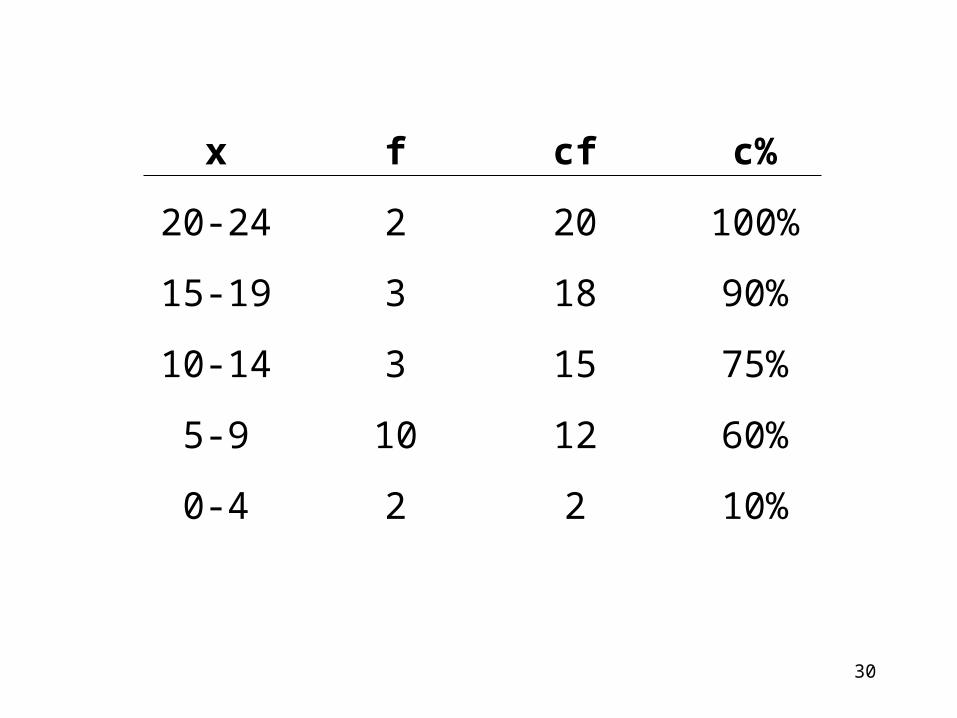
x f cf c%
20-24 2 20 100%
15-19 3 18 90%
10-14 3 15 75%
5-9 10 12 60%
0-4 2 2 10%

31
x f cf c%
20-24 2 20
15-19 3 18
10-14 3 15
5-9 10 12
0-4 2 2
24.5
19.5
14.5
9.5
4.5
0
100%
90%
75%
60%
10%
0%

Scores
8
6
4
2
5-9 10-14 15-19 20-24
24.5
Frequency
0-4
19.5
10
32