
CHAPTER 2 FLEXURAL STRENGTHENING OF REINFORCED CONCRETE STRUCTURES … · 2019-12-19 · 2-1...
76
2-1 CHAPTER 2 FLEXURAL STRENGTHENING OF REINFORCED CONCRETE STRUCTURES BY PLATE BONDING 2.1. Introduction Although composite materials have been successfully used in practice for strengthening (Gómez Pulido and Sobrino, 1998; Mayo et al., 1999; Stallings et al., 2000; Brosens, 2001; Godes and Cots, 2002), there are many design issues that remain unsolved. In the vast majority of tested beams, the application of externally bonded laminates resulted in a catastrophic brittle failure in the form of a premature laminate peeling-off before the design load was reached. The main challenge concerning the use of externally bonded laminates for flexural strengthening is to prevent and avoid this undesirable mode of failure. Up to now, the problem of a premature failure with a subsequent debonding of the laminate has been dealt by means of two parallel lines of investigation: one experimental and the other theoretical. Both will be summarized within §2.2 and §2.3. Initially, the experimental research was focused on the feasibility of plate bonding. The main area of interest was to know the effect of the laminates, that is, the increase in magnitude in strength and stiffness on the beam provided by the bonded plates. The effectiveness of the external reinforcement was assessed in terms of deflection, crack distribution and failure loads. After observing the failure modes, the peeling phenomena became of primary interest. Then, some authors tried to classify the different premature failures depending on the starting point of the debonding process. In addition, some devices like external anchorages were developed to delay the premature laminate
Transcript of CHAPTER 2 FLEXURAL STRENGTHENING OF REINFORCED CONCRETE STRUCTURES … · 2019-12-19 · 2-1...
2-1
CHAPTER 2
FLEXURAL STRENGTHENING OF REINFORCED CONCRETE STRUCTURES BY PLATE BONDING
2.1. Introduction Although composite materials have been successfully used in practice for strengthening (Gómez Pulido and Sobrino, 1998; Mayo et al., 1999; Stallings et al., 2000; Brosens, 2001; Godes and Cots, 2002), there are many design issues that remain unsolved. In the vast majority of tested beams, the application of externally bonded laminates resulted in a catastrophic brittle failure in the form of a premature laminate peeling-off before the design load was reached. The main challenge concerning the use of externally bonded laminates for flexural strengthening is to prevent and avoid this undesirable mode of failure. Up to now, the problem of a premature failure with a subsequent debonding of the laminate has been dealt by means of two parallel lines of investigation: one experimental and the other theoretical. Both will be summarized within §2.2 and §2.3. Initially, the experimental research was focused on the feasibility of plate bonding. The main area of interest was to know the effect of the laminates, that is, the increase in magnitude in strength and stiffness on the beam provided by the bonded plates. The effectiveness of the external reinforcement was assessed in terms of deflection, crack distribution and failure loads. After observing the failure modes, the peeling phenomena became of primary interest. Then, some authors tried to classify the different premature failures depending on the starting point of the debonding process. In addition, some devices like external anchorages were developed to delay the premature laminate

Chapter 2
2-2
peeling-off. In §2.2, a historical overview is presented, the failure modes are described and an experimental database is introduced, including results from the existing literature and results from an experimental program conducted by the author at the Structural Technology Laboratory of the Department of Construction Engineering of the Technical University of Catalonia. The main target of theoretical studies was to develop a suitable design method for strengthening concrete structures by plate bonding. Most of the existing models were focused on the peeling phenomena at the laminate end, developing a linear elastic analysis to establish a limit on the stress concentration at the laminate cut-off point. Despite the importance of end peeling, it should not be forgotten that laminate debonding may initiate near midspan at the vicinity of flexural or shear cracks, but there are a limited number of studies on this subject in the published bibliography. In §2.3 the existing theoretical models are summarized and classified. By means of the experimental database, a critical comparison of the different models on predicting failure load is presented. To overcome the weaknesses of the existing theoretical models, Non-Linear Fracture Mechanics theory will be applied in Chapter 3.
2.2. Experimental background
2.2.1. Introduction One of the main issues when using a new material in a new domain, such as fiber reinforced polymers for strengthening concrete structures, is to know how it is going to perform in a certain environment; in this case, how an externally reinforced concrete section is going to behave when applying a certain load state. One way to know this is by developing a lab or field test. Before dealing with the issue of strengthening concrete structures by plate bonding in a theoretical manner, the experimental work will become very useful in identifying the trends that should be considered in the development of an analytical model or in the formulation of standards. In addition, in case the experimental background is well documented, it will constitute a useful tool to check the validity of analytical formulation. For these reasons, many research groups have performed experimental programs, not only large-scale tests on beams strengthened in flexure or/and shear but also small-scale tests to specifically study some topics such as the bond strength or the transference of stresses at the interface. Therefore, a substantial amount of experimental work has been done around the world since the earliest known application of the externally bonded plate technique up to today. As will be shown in §2.2.2, the existing experimental programs on beams strengthened by FRP laminates have shown in general that the expected modes of failure can be more brittle than those classical modes of failure for conventional beams.

Flexural strengthening of reinforced concrete structures by plate bonding
2-3
2.2.2. Historical review A historical overview of the existing experimental research on strengthening concrete structures by bonding external plates and the main conclusions are presented in this section. Although the first studies on externally bonded steel plates date from the late sixties of last century, it is not until the 1980’s when composites were introduced in the strengthening field. The partial substitution of steel plates with polymer matrix/fiber composites was first discussed in 1982 at the EMPA (Swiss Federal Laboratories for Materials Testing and Research) where most of the initial work was performed (Meier, 1995). In 1987, after a small number of tests, Meier (1995) presented the feasibility of externally bonded composite laminates for strengthening concrete structures assuming a cost reduction of 25% when substituting steel plates by composite laminates. This initial experience not only showed to the world the potential use of those materials in civil engineering but also served as the basis of subsequent tests and led to the manufacture of the first prefabricated FRP laminate by a pultrusion process. After the initial research, CFRP laminates were successfully employed at the EMPA as a strengthening tool in concrete elements, in more than 70 flexural loading tests of beams having spans between 2.0 m and 7.0 m, as performed by Kaiser (1989) and Deuring (1993) (both referenced by Meier, 1995). Kaiser’s thesis (1989) (referenced by Meier, 1995) was the first experimental and analytical research on strengthening concrete structures by composite laminates. Tests results of RC beams strengthened in flexure by CFRP or hybrid CFRP/GFRP laminates showed an increase in the stiffness and in the load carrying capacity of the beam. Three stages were identified during the load application process. In the first one, the beam remained uncracked. The second stage was characterized by the formation of some cracks with a lower crack distance and a lower crack width in comparison to a conventional RC beam. The third stage was identified to be between the yielding of internal steel and the tensile rupture of the laminate. Some premature modes of failure were identified during the experimental program besides FRP rupture or concrete crushing. According to Meier (1995), the research work showed the validity of the strain compatibility method in the analysis of various cross-sections. Therefore, the calculation of the externally strengthened elements could be performed in a similar manner as conventionally reinforced concrete elements. In the period between 1990 and 1994, some other research groups performed large scale tests regarding the use of FRP materials and confirmed the conclusions of the research at the EMPA described in Kaiser’s thesis. Therefore, an increase in the knowledge about the technique of strengthening structures by FRP laminates was obtained thanks to different experimental programs performed by different authors such as: Ritchie et al. (1991), Saadatmanesh et al. (1991a, 1991b), Triantafillou and Plevris (1992), Sakai et al. (1992), Nanni (1993), and Sharif et al. (1994). The common conclusions from research carried out until 1994 to improve the performance of the external reinforcement, can be summarized as follows:
1) There was a need for a design guideline or a standard related to externally bonded reinforcement.

Chapter 2
2-4
2) Some premature failures were observed in different experimental programs. In most cases, the development of a concrete tensile failure implied the debonding of the laminate. To understand the sudden laminate peeling-off, the stress transfer between laminate and support should be studied. A summary of the theoretical background about the interface behavior will be presented in §2.3.
The commercial use of FRP laminates as externally bonded reinforcement began in Switzerland around 1993, and was soon followed by other European countries. From this point in time, a huge number of experimental studies spread out around the world especially in Europe, United States, China and Japan. More than 70 experimental programs have been performed from 1994 up to now at different research centers. Some of them, reported in the bibliography, were compiled in a database of beam bending tests that will be described in §2.2.4. Even though most of the reported experimental programs are externally strengthened beams with a rectangular cross-section tested in a three or four-point bending configuration, there are some interesting studies on simply supported T-beams (Khalifa et al., 2000a; Raghu et al., 2000; Shahawy et al., 2001; Chaallal et al., 2002), or slabs reinforced by bonded plates. The largest experimental research on slabs was done at the University of California San Diego (Hormann et al., 1998; Seim et al., 1999a, 1999b; Vasquez, 1999) where a total of 30 slab specimens strengthened by wet lay-up or pultruded FRP bonded plates were tested in flexure. In addition, Juvandes (1999) and Dias (2000a) tested 12 slabs strengthened by CFRP strips. In the existing literature, there is a short number of studies on continuous beams. For instance, Khalifa et al. (1999a) analyzed the contribution of externally bonded CFRP laminates to the shear capacity of two-span continuous beams and El-Refaie et al. (2002) studied the premature failure of two-span continuous beams strengthened in flexure with CFRP laminates. Following the idea of prestressing flexural elements with initially tensioned plates, that was implemented in the past using steel plates to prestress wood, Triantafillou et al. (1992) established a methodology to calculate the maximum prestress of external FRP sheets through analysis combined with experiments. Herein, prestressing the laminate not only has advantages under service loads (closing cracks and delaying the opening of new ones) but also at ultimate state because of a possible change in the failure mode. Garden and Hollaway (1998) and later on, Wight et al. (2001) performed an experimental program with the objectives of improving the prestressing systems and studying the failure modes of concrete beams prestressed with CFRP laminates. The existing studies have shown that one of the major factors affecting the behavior of strengthened structures is the bond strength at the interface between the reinforcing plate and the concrete surface. Therefore, to study the bond behavior, some experimental studies have been carried out by using several test set-ups such as single shear tests (Täljsten, 1994; Chajes et al., 1996b; Bizindavyi and Neale, 1999), double shear tests (Maeda et al., 1997; Neubauer, 2000; Tripi et al., 2000; Nakaba et al., 2001; Brosens, 2001; Souza and Appleton, 2001; Ferrier and Hamelin, 2002; Ueda et al., 2002; Sato and Vecchio, 2003) or modified beam bending tests (Miller and Nanni, 1999; De Lorenzis et al., 2001; Alarcón, 2002). The existing shear tests available in the bibliography were assembled in a database that will be described in §2.2.4. If the

Flexural strengthening of reinforced concrete structures by plate bonding
2-5
characterization of bond strength is done “in situ” in a real structure, the set-ups mentioned before will not be suitable, since a pull-off test is more appropriate. According to a comparative analysis of the different set-ups performed by Horiguchi and Saeki (1997), the bond strength depends mainly on the concrete strength. As the concrete strength increases, the bond strength increases as well. This trend is more accentuated in pull-off tests than in modified beam bending tests and even more so when compared to shear tests (Chen et al., 2001). Finally, although this study is focused on flexural strengthening, the possibility of using composite materials on shear strengthening should not be omitted. There are many research programs which developed this topic such as Täljsten (1994), Chajes et al. (1996a), Triantafillou (1998), Chaallal et al. (1998a), Malek and Saadatmanesh (1998), Khalifa et al. (1999b, 2000b), or Täljsten and Elfgren (2000).
2.2.3. Failure modes Cataloging failure modes The identification of failure modes is fundamental to understanding the behavior of externally strengthened structural elements and then developing a suitable design method. The first reported identification was a result of the experimental research performed at the EMPA by Kaiser (1989), Deuring (1993) and Meier (Meier, 1995). Later on, some other authors like Oelhers (1990, 1992), Arduini and Nanni (1997), Buyuközturk and Hearing (1998), Róstasy (1998), Neubauer (2000), and Juvandes (1999) not only studied but also tried to classify the different failures obtained from their tests. Regarding the existing experimental studies, the failure modes of concrete structures strengthened by plate bonding can be classified into two categories as described by the FIB Task Group 9.3 FRP (2001). Note that this cataloging is also valid for steel plated beams except for specific failures exclusively associated to FRP laminates.
1) Full composite action or classical failure modes. This category comprises the failure modes where the full composite action of the concrete and the bonded plate is maintained until the concrete crushes in compression or the plate fails in tension. It is desirable that these modes of failure occur after internal steel yielding. A detailed treatment of the classical failure modes can be found in Triantafillou and Plevris (1992) and Thomsen et al. (2004).
a) Concrete crushing: Concrete crushes in the compression zone while the laminate is intact. This mode of failure will be brittle and undesirable if the concrete crushes before steel yielding.
b) FRP rupture: For relatively low ratios of both internal and external reinforcements, failure may occur through tensile fracture of the FRP. According to Bonacci and Maalej (2001), the FRP must be well

Chapter 2
2-6
anchored for this failure mode to occur. In the case of steel plates, this failure mode will correspond to the steel plate rupture after yielding.
c) Shear failure: The reinforced concrete beam may reach its shear limit prior to any kind of flexural failure if it is not properly reinforced in shear.
2) Loss of composite action. According to Ulaga et al. (2002), when commercial products are used in strengthening, the most probable failure mode is a sudden and brittle laminate peeling-off. In this case, the loss of composite action takes place at the interface between concrete and the external reinforcement prior to the appearance of a classical failure mode. Debonding failure may occur at different interfaces:
a) in the adhesive b) inside the FRP between fibers and resin (interlaminar shear failure) c) between concrete and adhesive or between adhesive and the external
bonded plate d) in the concrete near the surface along a weakened layer or along the
embedded steel reinforcement
Nowadays, the adhesives and laminates are manufactured to avoid the first two debonding failures described above. An insufficient surface preparation during plate application can result in debonding at the interface between concrete and adhesive or between adhesive and laminate. Finally, since the weakest point in the bond between the concrete and the external reinforcement is the concrete layer near the surface, the last debonding failure mode is the most common. Concentrating on bond failures related to the concrete surface, some different types of failures can be identified depending on the initiation point of the debonding process:
d.1) Peeling-off at the plate end:
d.1.1) Plate debonding can occur in an uncracked anchorage zone as a result of bond shear fracture through the concrete. This brittle failure mode typically occurs in beams reinforced with short plates (Tumialan et al., 1999; Sebastian, 2001; Seim et al., 2001; Thomsen et al., 2004). In these cases, a peak shear stress is observed at the plate end caused by the geometric discontinuity at this location. Several tests of beams provided with enough stirrups (Oelhers, 1990, 1992; Jansze, 1997; Brosens, 2001) showed the development of a crack in the concrete layer between the surface and the internal steel reinforcement which started at the plate end. The crack propagation towards midspan led to a plate end debonding failure also identified as concrete riping-off.
d.1.2) Plate end shear failure may occur when the unstrengthened concrete beam does not have enough shear reinforcement. A shear crack initiates at the plate end and grows as an inclined shear crack towards the load application point (Jansze, 1997; Ahmed et al., 2001; Brosens, 2001).
d.2) Peeling-off caused at flexural or shear cracks:

Flexural strengthening of reinforced concrete structures by plate bonding
2-7
d.2.1) Peeling-off caused at flexural cracks: Flexural cracks may propagate horizontally and cause the debonding of the laminate in regions far from the anchorage (Buyukozturk and Hearing, 1998; Juvandes, 1999). This failure mode is usually initiated near midspan and continues up to the laminate ends; it is more ductile than the previous one.
d.2.2) Peeling-off caused at shear cracks: The vertical displacement between both sides of the shear crack causes deviatory tensile forces which are generated by the stiff strip resisting the movement (Buyukozturk and Hearing, 1998; Juvandes, 1999). At an ultimate state, these forces cause a tensile failure in the concrete layer between the laminate and the longitudinal reinforcement. This failure results in plate debonding. In elements with enough internal or/and external shear reinforcement, the effect of a vertical crack opening on the peeling-off is almost negligible.
d.3) Peeling-off caused by the unevenness of the concrete surface: The FRP laminate should be straight after application. A concave surface may lead to laminate debonding. This mode of failure can be avoided by performing a good execution and applying quality control measures. To achieve the required evenness of the concrete surface it will often be required to apply a putty. This should be done according to the specificications of the FRP manufacturer.
d.1.1) End peeling d.1.2) Plate end shear failure
d.2.1) Peeling caused by flexural cracks d.2.2) Peeling caused by shear cracks
Figure 2.1. Types of peeling-off failures.
Since the most common failure mode is the premature debonding of the laminate, as an attempt to prevent it, some authors (Róstasy, 1998; Hormann et al., 1998; Seim et al. 1999a, 1999b) and guidelines (S&P, 2000; German Institute of Construction Technology, 1997 (referenced by FIB Task Group 9.3 FRP, 2001)) recommend limiting the ultimate tensile strain value in the laminate to half of the laminate’s ultimate tensile strain, and to five times the steel yielding strain. Typical values for this limit range between 0.60% to 0.80%.
syLu εε 5≤ (2.1)
Chapter 2
2-8
2,kLuLu εε ≤ (2.2)
where:
εLu: ultimate strain of the externally bonded laminate εsy: yielding strain of the internal steel reinforcement εLu,k: characteristic value of the ultimate strain of the laminate according to the manufacturer
As will be shown later on, this limitation is often not enough because the premature debonding of the laminate occurs even though the tensile strains are accomplishing both conditions (2.1) and (2.2). Therefore it is necessary to define a more accurate limit or an alternative and more correct design procedure to avoid this sudden and brittle mode of failure. As mentioned in Chapter 1, this is one of the objectives of this dissertation. External anchorages The efficiency of an external anchorage against peeling failure has been proven by different tests on externally strengthened reinforced concrete beams with steel or FRP laminates. Poulsen et al. (2001) compared some different anchorage devices using the observations made during the performed laboratory tests. The possible anchorage devices may be classified into three groups:
1) Mechanical anchorage by mild steel bolts 2) Core anchorage 3) Anchorage by an externally bonded composite laminate.
Inspired on a normal anchorage device with bolts for steel plates, a steel plate bolted to the concrete surface can be bonded to the FRP laminates. It is important not to let the bolts pass through the laminate to avoid the appearance of a stress concentration around the laminate hole as shown by Mukhopadhyaya et al. (1998). By drilling a hole on the laminate, the longitudinal fibers would be cut and would no longer be able to transfer any forces. The mechanical anchorage can be transformed into a sandwich anchorage with the laminate bonded between two steel plates, which are bolted to the concrete. The core anchorage was developed by Meier et al. (1998) (referenced by Poulsen et al., 2001) who showed the possibility of achieving a full anchorage by drilling a hole in the concrete, placing the laminate end into the hole and filling it with an epoxy adhesive or a fiber reinforced repair mortar. The simplest way to increase the ultimate anchorage force is by gluing a laminate as an external anchorage. The bonded external anchorage usually has a U-shape wrapping the soffit and lateral sides of the beam. In some cases it is spread up to the concrete compression zone. Existing opinions differ on the location of the external anchorages. Some authors (Ritchie et al., 1991; Spadea et al., 1998) prefer to place the external anchorage at the laminate end. If the anchorage is located on the FRP anchorage area, the debonding of the laminate end may not occur. In the opinion of other research groups (Täljsten, 1994; Shahawy et al., 1996; Norris et al., 1997; GangaRao and Vijay,

Flexural strengthening of reinforced concrete structures by plate bonding
2-9
1998; Dias et al., 2000b), the external fixing mechanisms should either be placed along the complete bonded length continuously or by means of bonded strips separated a certain distance. The last anchorage distribution was motivated by the fact that there are many sections prone to be a starting location of the peeling-off phenomenon. Even though the most common bonded anchorage is a wet lay-up laminate, Jensen et al. (1999) (referenced by Poulsen et al., 2001) tested the use of prefabricated laminates transversely bonded across the main laminate at its end, achieving an increase of 70% of the ultimate anchorage force.
2.2.4. Bending test database A database of experimental tests is a useful tool to verify the reliability of a theoretical model. In the existing bibliography, there are some attempts to develop databases of simply supported beams externally reinforced by steel plates or FRP laminates. A summary of the existing databases is presented below. Firstly, Bonacci (1996) compiled a database of 64 specimens from 10 separate studies and analyzed their failure mode, strength gain and deformability, and observed that debonding failure was prevalent among the database specimens. Later on, Mukhopadhyaya and Swamy (2001) reported a database of 26 beams strengthened with steel bonded plates, 20 with GFRP laminates and 23 with CFRP laminates. All beams compiled in the database failed by plate end debonding. Beams with unusual features such as overlapping plates, beams with no internal reinforcement, or over-reinforced unplated sections were omitted. Raoof and Hassanen (2000a, 2000b) calculated a lower and upper limit for the bending moment to avoid peeling failure for a total of 82-steel and 58-FRP bonded specimens, respectively. To verify the reliability of their model, Colotti and Spadea (2001) assumed a database of 20 strengthened RC beams tested by different authors. A survey of all published results of experimental programs was done by El-Mihilmy and Tedesco (2001), excluding the tests where no detailed information was given. A total of 26 uncracked beams externally reinforced by steel or FRP plates were compiled from nine different references. Bonacci and Maalej (2001) completed their initial database and reported the largest database of those reviewed up to now including 23 separate studies with a total of 127 specimens strengthened by means of FRP laminates. Smith and Teng (2002b) assembled a database of externally strengthened beams, all of them failing due to plate end debonding. The database consisted of 59 non-precracked beams from 14 different studies. Pěsic and Pilakoutas (2003) investigated the applicability of different analytical approaches for predicting the capacity of strengthened beams by using the results of 77 experimentally tested beams that had failed due to plate end debonding. Finally, Colotti et al. (2004) extended their database to check their theoretical model based on the truss analogy again (see §2.3.2). The previous database concerned beams strengthened in flexure. To check the validity of a design approach for the calculation of the shear capacity of RC externally strengthened elements, Triantafillou and Antonopoulos (2000) synthesized the published experimental results from 1992 to 1998 on shear strengthened RC elements that failed in shear which represent a total of 76 specimens from 14 studies. This database was upgraded and enriched by Bousselham and Chaallal (2004) covering 100 tests but excluding those tests incomplete or ambiguous.

Chapter 2
2-10
In the present study, a new bending test database has been assembled by using the experimental programs in the published literature which were well-documented. Data from the existing database mentioned above were included. To include a test on the database, it should be a conventionally reinforced concrete beam, with a rectangular cross-section, externally strengthened by bonded plates and tested in a simply supported configuration. Concrete T-beams or beams where the external plate was prestressed before bonding were excluded from the database. Specimens for which geometry, material properties, failure mode or failure load were not reported were excluded from the database analysis. The database has been grouped into two sets: the first group contains all beams strengthened only by a plate glued to their soffit, and the second include beams that were additionally strengthened in shear or that were externally anchored. The second group will not be analyzed in further sections. A special distinction has been made for those beams that were preloaded before bonding the external reinforcement. Most of the existing experimental studies were with uncracked reinforced beam specimens to which external plates were bonded prior to testing the beams for failure, with little attention to real life situations where beams have already been cracked at service. However, in any considered case, the load applied before plate bonding was far from causing loss of the original flexural capacity and it was concluded that such previous load application has no significant effect at failure load levels. According to Bonacci and Maalej (2001), the consideration of damage to the existing conventional reinforcement or sustained stress in the compression zone would have led to considerably different trends in the failure mode, strength and deformability. A total number of 672 specimens has been assembled in the database. In Appendix A, a summary of beam details, such as the geometry, the internal steel reinforcement, the adhesive, the externally bonded plate, the different material properties, the loading configuration, failure load and mode of failure are presented. From the 672 tests included on the database, 84 were control beams and 588 were strengthened by external plate bonding. A total of 116 beams, which represent 20% of the sample, were strengthened by steel plate bonding. The remaining 80% beams were strengthened by FRP laminates. Nearly all composite laminates were made of carbon fibers (CFRP) (84%). The glass FRP (GFRP) represents only 11% of the composite laminates. The remaining percentage is shared by the AFRP (3%) and a hybrid composite made of carbon and glass fibers (2%). In relation to the failure modes observed on the 588 strengthened beams: 373 were reported to fail due to a premature debonding of the laminate, 39 failed by FRP rupture and 44 by concrete crushing. In the remaining 132 beams, failure was not clearly reported in 22 specimens and was directly not reported in 110 beams.

Flexural strengthening of reinforced concrete structures by plate bonding
2-11
Table 2.1. Summary of specimen characteristics.
Specimen parameter Minimum Mean Maximum Std deviation Cross-section depth (mm) 100 220 800 83.09
Beam span (mm) 740 2156 7530 923.41 ρs = As/bh (%) 0.12 1.02 5.36 0.01 ρL = AL/bh (%) 0.02 0.91 8.33 0.01
ρL/ρs 0.03 0.89 6.34 0.92 fcm (MPa) 16.5 40.5 80.0 10.23 EL (MPa) 10342 132530 300000 61830
Shear span/effective depth 1.32 4.38 11.72 1.53 Shear span/total span 0.13 0.37 0.50 0.05
A summary of some data related to geometry, material properties and load application point is presented in Table 2.1. A set of comments about Table 2.1 are listed below:
1) Focusing on the specimen scale of tested beams, the average span is 2.1 m. 2) In addition, more than 90% of tests have spans shorter than 3.0 m. 3) The quotient between the laminate and internal steel reinforcement ratio has an
average value of 0.89, lower than 1.0. In 70% of specimens, the area of externally bonded plate is lower than the area of internal steel reinforcement.
4) In relation to material properties, the compressive concrete strength is between 16.5 MPa and 80.0 MPa with a mean value of 40.5 MPa. Only 5% of specimens were cast on high-strength concrete (fck > 50 MPa). All high-strength concrete beams belong to the experimental program of Fanning and Kelly (2001).
5) The average value of the plate’s modulus of elasticity is 132.5 GPa. This parameter has the largest scatter because of the tailorability of composite materials which is related to their anisotropy. According to the rule of mixtures the stiffness and strength of the composite increases in proportion to the fiber volume fraction (Kaw, 1997; Karbhari, 2001). To obtain a high fiber volume fraction, the fibers must be aligned in the same plane, an orientation that result in a highly anisotropic structure. In a wet lay-up composite, the designer may choose a lamina sequence depending on the required laminate properties. Hence, for wet lay-up plates the modulus of elasticity of the designed laminate may fluctuate in a wide range between 10.3 GPa and 283.3 GPa with an average value of 107.5 GPa. In most cases, the pultruded laminates are unidirectional with a high percentage of fibers in an axial direction. The modulus of elasticity of pultruded plates is more controlled by the fabrication procedure within the range of 107.3 GPa to 300.0 GPa. As a conclusion, the manufacturing has a strong influence on the laminate properties.
6) The shear span/effective depth ratio is related to the mechanisms of shear transfer on concrete elements. For the bending test database, this ratio has a mean value of 4.38 with a standard deviation of 1.53. According to McGregor (1997), in a conventional reinforced concrete beam, if the shear span/effective depth ratio ranges from 1.0 to 2.5, the beam will fail by a bond failure, a splitting failure, a dowel failure along the tension reinforcement or by a shear compression failure. In slender shear spans with a ratio ranging from 2.5 to 6.0, beams will failed at the shear inclined cracks. Very slender beams with a shear span/effective depth ratio greater than about 6.0 will fail in flexure prior to the formation of inclined cracks. For the bending test database, the vast majority of tests show a shear span/effective depth ratio in the range between 2.5 and 6.0

Chapter 2
2-12
(74.5% of tests). This ratio is greater than 6.0 for 19.2% of tests, and it ranges from 1.0 to 2.5 in the remaining 6.3% of tests.
7) The shear span vs. total span ratio has a mean value of 0.37 and a low standard deviation (0.05).
2.2.5. Single/Double shear test database One of the objectives concerning this research (see Chapter 1) is to study the premature peeling failure, which is related to the bond mechanism. In Chapter 3, an analytical model to evaluate the stress transfer between concrete and laminate in a pure shear specimen will be developed. The suitability of this model should be evaluated by means of experimental results. Therefore, a database of bond tests has been compiled to check this model together with other existing analytical models that describe the interface behavior at the anchorage zone. As previously mentioned, several different experimental set-ups have been used to determine the bond strength: shear tests and modified beam bending tests. According to Chen et al. (2001), the strength obtained by a modified beam bending test can be higher than that obtained by using single or double shear tests. However, the database of the present research only assembles single and double shear tests because its purpose is to verify the formulae derived for a pure shear specimen (see Chapter 3). Before dealing with the compiled database, a short historical review of other existing database related to bond tests is summarized below. Lorenzis et al. (2001) were the first to compile a total of 40 tests performed to study bond mechanisms. From the total number of tests, 22 were existing shear tests from the literature and the remaining were modified beam bending tests performed by the authors. This implies that in their analytical study, Lorenzis et al. were actually mixing two different set-ups. After an extensive literature survey, Chen and Teng (2001) collected a database of single and double shear tests with 55 tests that included the 22 shear tests compiled by Lorenzis et al. Tests that were not sufficiently well-documented were excluded. Data showed that most experimental tests failed in the concrete layer beneath the plate-to-concrete interface. In the present study, a shear test database of 185 tests has been made compiling the tests of available references. From the 185 tests collected, 33 tests were excluded: 17 tests because no information about the experimental failure load was available and 16 tests because their mode of failure was by FRP rupture. Therefore, only 152 specimens from the database will be studied. Appendix B gives the concrete block details, the internal steel reinforcement if available, the adhesive, the externally bonded plate, as well as the different material properties. In addition, the test set-up, failure load and mode of failure are also presented.

Flexural strengthening of reinforced concrete structures by plate bonding
2-13
A short review of the data compiled is given by Table 2.2, where the range of values for some characteristics related to geometry, material properties and applied load are summarized.
Table 2.2. Summary of pure shear specimen characteristics.
Specimen parameter Minimum Mean Maximum Std deviation Cross-section depth (mm) 27 135 200 42.26
Laminate length (mm) 50 244 800 159.32 AL 5 58 232 0.95
ρL = AL/bh (%) 0.33 0.48 5.00 0.95 fcm (MPa) 19.8 41.7 51.6 9.68 EL (MPa) 20435 138178 266981 60386
A set of comments about the compiled data in Table 2.2 are listed below:
1) The major portion of specimens has a square cross-section. Only 14 of the 185 compiled specimens have a rectangular cross-section. The average depth of the tested concrete blocks is 135 mm.
2) The laminate bonded length ranges between 50 mm and 800 mm. 62% of laminate lengths are considered short bonded lengths according to Chapter 3, and the remaining 38% are classified as long bonded lengths.
3) The average area of external reinforcement is 58 mm2. Although this value is very similar to the mean obtained for FRP laminates alone (40 mm2), it increases significantly when steel plates are examined alone (186 mm2).
4) In relation to material properties, the concrete compressive strength is in the range of 19.8 MPa and 51.6 MPa with a mean value of 41.7 MPa. As shown in Table 2.2, no specimens were cast on high-strength concrete (fck > 50 MPa).
5) The average value of the plate’s modulus of elasticity is 138.1 GPa. This parameter has the largest scatter (60.4 GPa) because of the tailorability of composite materials.
From the 185 tests included in the database, 12% of the samples were strengthened by steel plate bonding. The remaining 88% were strengthened by FRP laminates. In addition, by classification of the type of fiber of the composite laminates, 83% were made of carbon fibers (CFRP), 13% of glass fibers (GFRP) and the remaining percentage of aramid fibers (AFRP) (4%). In relation to the failure modes, the assembled data showed that most shear tests failed in the concrete layer beneath the concrete/adhesive interface, in particular, 152 of the 169 tests where the failure mode was clearly reported, which represent 90% of the specimens. A small number of tests failed by FRP rupture; 16 of the 169 tests (9%). Only one specimen failed at the adhesive interface because of the strong adhesives developed to bond the external reinforcements. In this case, only in 5 of the 169 well-known specimens, was failure reported as FRP delamination. However, all of them were grouped as a premature peeling failure, because according to Neubauer and Róstasy (1997), the same energy release rate model is applicable to concrete fracture failure and FRP delamination. The reason is that in FRP delamination failure, a tensile concrete failure occurs in the first 20 to 50% of the

Chapter 2
2-14
bonded length which thereafter propagates into the matrix and causes FRP delamination. It should be mentioned that only a small number of the concrete prisms tested in shear had internal steel reinforcement (18 from the total 185 specimens, and 4 of the 152 well-known tests). Therefore, in the vast majority of tests, the stress transfer between laminate and concrete can develop in an area larger than the concrete cover, because there is no interference with internal steel reinforcement.
2.2.6. Experimental program Introduction To better understand the flexural behavior of externally bonded FRP reinforcement for RC structures, ten strengthened beams were tested by the author at the Structural Technology Laboratory of the Department of Construction Engineering at the School of Civil Engineering of Barcelona, in 2000. This section summarizes the test set-up, beam details such as geometry and material properties, some tests results and a discussion about them. A more extended review of the experimental program can be found in Appendix C. This work has also been published elsewhere (Oller et al., 2001, 2002, 2004). Test set-up. Specimen details: geometry and materials Ten simply supported beams of 2400 mm x 300 mm x 200 mm were strengthened with CFRP laminates and tested during the experimental program. The beams, with an effective span of 2000 mm, were tested in a three-point bending configuration (shown in Figure 2.2) using deflection control.
Figure 2.2. Test set-up for Beams 1 and 2.

Flexural strengthening of reinforced concrete structures by plate bonding
2-15
Beams were divided into two groups depending on the internal steel reinforcement as shown in Table 2.3. To avoid the possibility of a shear failure, the beams were also provided with shear reinforcement.
Table 2.3. Internal reinforcement of tested beams.
Beam Bottom longitudinal rebars Top longitudinal rebars Transverse stirrups
1 2φ16 mm (ρs = 0.67%)
2φ8 mm (ρs’ = 0.16%)
φ12 mm / 0.15 m (ρw = 0.50%)
2 2φ20 mm (ρs = 1.40%)
2φ8 mm (ρs’ = 0.16%)
φ12 mm / 0.10 m (ρw = 0.50%)
Cylinder compression tests and splitting tensile tests were performed to obtain the concrete’s mechanical properties. The average 28-day compressive strength was 35.20 MPa and the tensile strength obtained from the test and reduced according to the CEB FIB Model Code 90 was 2.76 MPa. The nominal yield strength of internal reinforcement was 500 MPa. According to the data of the manufacturer, the average yield strength should be 550 MPa. Results from 450 mm long rebars tested in tension suggested a slightly higher value, 580 MPa. Pultruded laminates (CFRP) from S&P Clever Reinforcement Company supplied by courtesy of Bettor MBT and Fosroc Euco were bonded with different lengths and cross-sections as external reinforcement, as shown in Table 2.4 and Table 2.5. According to the manufacturer, the laminates should have a nominal elastic modulus of 150 GPa, and a nominal tensile stress at failure of 2500 MPa (at 1.6% strain). Laminate tensile tests conducted at the Structural Technology Laboratory according to the ASTM D3039 Standard Test Method for tensile properties of Fiber-Resin Composites (ASTM D3039, 1989) gave a mean value of 147 GPa for the elastic modulus. Additionally, in some tests, a ply of S&P C Sheet 240 was applied as an external anchorage. The measured mean value of the carbon-resin system elastic modulus given by the tensile tests was 169 GPa, and the experimental mean value of the ultimate tensile stress was 1740 MPa.
Table 2.4. External reinforcement of Beams 1.
Beam Test # External reinforcement ρL/ρs (%)
1/E 1 Control Beam - 1 1 laminate S&P 150/2000, 100 mm x 1.4 mm, length = 1500 mm (Euxit 220) 0.34
1/D 2 2 laminates S&P 150/2000, 50 mm x 1.4 mm, length = 1800 mm (MBrace adhesive) 0.34
1 1 laminate S&P 150/2000, 100 mm x 1.4 mm, length = 1800 mm (Euxit 220) 0.34 1/C 2 1 laminate S&P 150/2000, 100 mm x 1.4 mm, length = 1800 mm (MBrace
adhesive) and S&P C Sheet 240 (MBrace saturant) 0.43
1 1 laminate S&P 150/2000, 100 mm x 1.4 mm, length = 1800 mm (Euxit 220) 0.34 1/B 2 2 slot-applied laminates S&P 150/2000, 10 mm x 1.4 mm, length = 1800 mm
(MBrace adhesive) 0.07
1/A 1 1 laminate S&P 150/2000, 100 mm x 1.4 mm, length = 1800 mm (Euxit 220) 0.34

Chapter 2
2-16
Table 2.5. External reinforcement of Beams 2.
Beam Test # External reinforcement ρL/ρs (%)
2/E 1 Control Beam - 1 1 laminate S&P 150/2000, 100 mm x 1.4 mm, length = 1800 mm (Euxit 220) 0.22 2/D 2 2 laminates S&P 150/2000, 100 mm x 1.4 mm, length = 1800 mm (Euxit 220) 0.44
2/C 1 2 laminates S&P 150/2000, 50 mm x 1.4 mm, length = 1800 mm (MBrace adhesive) 0.22
2/B 1 2 laminates S&P 150/2000, 50 mm x 1.4 mm, length = 1800 mm (MBrace adhesive) and S&P C Sheet 240 (MBrace saturant) 0.22
2/A 1 1 laminate S&P 150/2000, 100 mm x 1.4 mm, length = 1800 mm (MBrace adhesive) and S&P C Sheet 240 (MBrace Saturant) 0.22
Test results Table 2.6 and Table 2.7 show some test results from Beam groups 1 and 2 where εL,max is the maximum laminate strain and τmax,exp is the maximum shear stress at the end of the CFRP under failure load. τmax,exp has been calculated from the increments of laminate longitudinal strains between two contiguous strain gauges. The calculated shear stresses, which are mean values between the gauge locations, will be compared afterwards to the values derived from the theoretical analysis. Except for Beam 1/A, all tests were performed in two stages. In the first one, the unstrengthened beam was loaded up to a service load value (Fs) in an attempt to simulate a stress state similar to real conditions. After removing the beam from the supports, the external reinforcement was bonded along its surface. Once the instrumentation was affixed, the beam was tested to its ultimate load in the second stage. The beams that did not suffer from significant damage during the test were strengthened and tested a second time. Table 2.6 and Table 2.7 summarize the results indicating the test number.
Table 2.6. Test results in Beams 1.
Beam Fs (kN)
Test #
Failure mode Fu,exp (kN)
εL,max (µε)
τmax,exp
(MPa) 1/E 51.3 1 Concrete crushing 82.0
1 Premature debonding at the laminate end probably due to an anchorage lack 80.0 2824 2.73
L1 111.0 (35.3%) 4112 1/D 55.0 2
Peeling failure L2 100.9 4982
1 Peeling failure 104.0 (26.8%) 3949 2.08
1/C 48.8 2 Peeling failure 121.0
(47.6%) 4181
1 Peeling failure 100.4 (22.4%) 3646 1.66
1/B 50.1 2 Peeling failure and CFRP sliding 92.5
(12.8%) 7000
1/A 1 Peeling failure 109.0 (32.9%) 4612

Flexural strengthening of reinforced concrete structures by plate bonding
2-17
Table 2.7. Test results in Beams 2.
Beam Fs (kN)
Test #
Failure mode Fu,exp (kN)
εL,max (µε)
τmax,exp (MPa)
2/E 72.3 1 Concrete crushing 113.7
1 Peeling failure 128.0 (12.6%) 3905 1.45
L1 163.0 (43.4%) 4121 1.42 2/D 74.1
2 Peeling failure L2 162.9 4122 1.33
L1 142.8 (25.6%) 5618 1.87 2/C 70.1 1 Peeling failure
L2 118.8 5509 1.67
L1 153.1 (34.6%) 5062* 2.26 2/B 70.4 1 Fiber rupture of anchorage, peeling
failure and sliding of CFRP L2 126.4 5156
2/A 71.3 1 Fiber rupture of anchorage, peeling failure and sliding of CFRP 154.6
(35.9%) 5643 2.23 *value could have measurement errors Control Beams 1/E and 2/E were tested without external reinforcement in two steps. During the first step, the beam was loaded up to service load. First cracking at the bottom of Beams 1/E and 2/E was not observed until a load of 13.2 kN and 18.3 kN was respectively reached. The average crack distance was 150 mm in Beam 1/E and 100 mm in Beam 2/E. During the second step, both specimens displayed a very ductile behavior, each failing by concrete crushing after steel yielding at a load of 82.0 kN (Beam 1/E) and 113.7 kN (Beam 2/E). First yielding of internal steel was observed at a load value of 76.0 kN in Beam 1/E and 105.4 kN in Beam 2/E. The insufficient amount of external reinforcement at the end of Beam 1/D caused the premature debonding of the laminate under an applied load similar to the control beam failure load (Fu,exp = 80.0 kN). To try to shift the location and mode of failure, as well as to increase the failure load, the laminate was extended up to the supports in the next tests. The behavior of Beams 1/C, 1/B, 1/A, 2/D and 2/C was very similar. In those failure tests, shear cracks appeared between the flexural cracks at a load level higher than the service load. The vertical displacement between the shear or flexural crack tips caused deviatory tensile forces that were generated by the stiff strip which was resisting the movement. At an ultimate stress level, these forces caused the laminate peeling-off due to a tensile failure in the concrete layer between the laminate and the longitudinal internal steel rebars. This premature failure was initiated near midspan and continued suddenly up to the laminate end (see Figure 2.3). For the same amount of external reinforcement, better behavior was observed when the laminates were placed under the position of the stirrups as shown in Figure 2.4. In this case, the transfer of the vertical component of the laminate tensile stress to the stirrups was improved. The effect of bonding the laminate without applying any previous load on the beam (Beam 1/A) generated an increase in the beam’s initial stiffness, but its influence was almost negligible at failure (Fu,exp = 109.0 kN; εL,max = 4612 µε ).

Chapter 2
2-18
Figure 2.3. Peeling failure in Beams 1/C, 1/B, 1/A, 2/D, and 2/C.
Beams 1/D, 1/C, 1/B, 1/A, 2/D
Beams 1/D (#2) and 2/C
Figure 2.4. Beams 1/D, 1/C, 1/B, 1/A and 2/D sections vs. 1/D (#2) and 2/C. (Dimensions in mm)
Since in most cases the peeling failure was the cause of the external reinforcement debonding, to postpone the peeling phenomena, as mentioned in §2.2.2, some authors (Ritchie et al., 1991; Täljsten, 1994; Shahawy et al., 1996; Norris et al., 1997; GangaRao and Vijay, 1998; Spadea et al., 1998; Dias et al., 2000b) propose an external anchorage system with carbon fiber lamina. If so, the interfacial stress concentration around cracks will again cause premature plate debonding, but the external anchorage will hold the plate during its slide towards the sheet fibers rupture. In Beams 2/B and 2/A, a lamina of CFRP (C Sheet 240) was applied as an external anchorage as shown in Figure 2.5. The ultimate failure loads on both beams were similar (2/B, 153.1 kN and 2/A, 154.6 kN), even though in one of them the anchorage sheet was only applied on the beam soffit. For this reason, at least in this case, the test indicated that the anchorage must not be necessarily affixed to the webs. This event highlights a potential use of an external anchorage in slabs. The observed failure of sheet fibers was probably due to the lack of strength in the lamina along the longitudinal direction. The designed lamina was insufficient to resist the stresses produced by the longitudinal sliding of the laminate. However, the delay of the peeling effect allowed a substantial strength increase (34.6% in Beam 2/B and 35.9% in Beam 2/A). To improve the ductility of the external reinforcement system, the laminate can be applied in special saw-cuts slots in the concrete (laminates 10 mm x 1.4 mm can be used in slots 15 mm deep). This system improves the bond between concrete and laminate allowing for greater strains prior to peeling. The performance of two slot-applied laminates 10 mm x 1.4 mm was tested in Beam 1/B (Figure 2.6). In spite of the lower

Flexural strengthening of reinforced concrete structures by plate bonding
2-19
ratio of reinforcement applied, an increase of 12.8% was observed in the load capacity with respect to the control beam. The maximum strain measured by the acquisition system was 7000 µε at an applied load of 85.0 kN. However the maximum strain was probably higher at failure load, 91.7 kN. The laminate debonding due to peeling near cracks appeared after the external reinforcement slide, which was caused by the loss of contact with the adhesive. As observed in Figure 2.6, the behavior of the slot-applied laminates was far more ductile than the system with externally bonded reinforcement.
Figure 2.5. Test set-up for Beam 2/B with full-height plies of carbon sheet as external anchorage.
Sheet rupture after laminate peeling in Beam 2/A (right side) and 2/B (left side).
-140
-120
-100
-80
-60
-40
-20
00 2000 4000 6000 8000
ε (µε)
F (k
N)
Beam 1/DBeam 1/CBeam 1/BBeam 1/D (#2)Beam 1/C (#2)Beam 1/B (#2)
Figure 2.6. Slot-applied laminates in Beam 1/B. Load vs. midspan strain.

Chapter 2
2-20
Conclusions about the experimental program As shown in Table 2.6 and Table 2.7, all tested beams failed due to a premature debonding of the external reinforcement as a result of either the excessive stresses at the laminate end (Beam 1/D) or the effect of intermediate flexural or shear cracks (in the remaining tests). In any case, the maximum strain at the laminate was less than 0.45% in Beam group 1 and 0.55% in Beam group 2. Therefore, the peeling effect took place even though the FRP strain was lower than the recommended limits to avoid this type of failure viewed in §2.2.2. This event generates a degree of uncertainty because the recommended limits of 0.60% - 0.80% seem to pose a safety risk, at least in the case of pultruded laminates. As a consequence, more realistic values that fit with the experimental results should be defined. In Beams 2/A and 2/B, the effect of an external anchorage device in the form of bonded strips separated a certain distance along the beam delayed the appearance of a premature peeling failure. As observed, once the laminate debonding was initiated, the external bonded anchorage held the longitudinal laminate during its sliding up to the rupture of the fibers in the FRP anchorage. Although the experimental results confirm the feasibility of using an external anchorage device to improve the performance of externally reinforced concrete beams (see §2.2.3), this issue will not be dealt with again in this thesis. The ensuring research will be focused on the laminate peeling-off phenomena regarding beams without external anchorages. As shown in the second test performed in Beam 1/B, the ductility of the strengthened beam was improved by applying two laminates in special saw-cut slots in the concrete. Although this topic is in an area of interest, it will not be handled again in this dissertation. The reason is due to the huge number of saw-cut slots that must be made in a reinforced concrete beam to significantly improve its ultimate load capacity when using the existing FRP laminate sizes. As a conclusion of the previous comments, the existing guidelines should be reviewed focusing special attention on the features related to the premature debonding of the laminate. To define a strain limit to avoid peeling failure is a simple design tool, but as has been shown, experimental results are not always within the guidelines limit range. Therefore, it seems necessary to define an alternative design method in order to prevent the peeling phenomena from occurring in a strengthened structure. This is the main goal of this dissertation. Previous to the development of an alternative design method, a review of the theoretical background is necessary to know the goals and weaknesses of the different conceptual models and the proposals developed up to now.

Flexural strengthening of reinforced concrete structures by plate bonding
2-21
2.3. Theoretical background
2.3.1. Introduction After the initial experimental research, some empirical approaches tried to establish a relationship between plate debonding and some parameters such as plate width to thickness ratio (bL/tL). For instance, in 1982, MacDonald restricted this ratio to a value no lower than 60 for steel plates whereas Swamy, in 1987, adjusted this value to 50 (Mukhopadhyaya and Swamy, 2001). However, those empirical approaches were only recommendations that did not lead to a consistent prediction of peeling failure. Since these initial approaches, the interface behavior has been studied by many research centers in order to develop a theoretical model that prevents the strengthened beam from the premature laminate debonding. The first analytical methods were developed especially for steel bonded plates. Later on, by applying some modifications, they were adapted to FRP laminates. The existing models can be divided into five groups based on their approaches: truss analogy models, models based on a linear elastic analysis, models based on a closed-form high-order approach, shear capacity based models, and finally, concrete tooth models. The application of Non-Linear Fracture Mechanics theory to the premature peeling failure will be dealt with in Chapter 3 and in Chapter 4. In the following sections, in addition to the descriptions of each developed theoretical models, their formulae to obtain the ultimate shear force or/and bending moment, below which a premature peeling failure is avoid, are given. The truss analogy based models are described in §2.3.2. Models based on a linear elastic analysis at the plate end or between flexural cracks and the failure criteria associated to these models are presented in §2.3.3 and §2.3.4, respectively. A closed-form high-order approach is explained in §2.3.5. Models based on the shear capacity of concrete are summarized in §2.3.6. To predict peeling failure at the concrete cover, a concrete tooth model is presented in §2.3.7.
2.3.2. Truss analogy models One of the first attempts to study the behavior of concrete strengthened elements was by means of a well-known theory based on a truss analogy that has been widely used to design conventional concrete structures. Täljsten (1994) derived some expressions for design purposes based on simple truss theory, to be used when beams are strengthened for bending or shear or both. From equilibrium equations, it is possible to state the necessary cross-section of the steel plates for flexural strengthening (see equation (2.3)).

Chapter 2
2-22
( ) ( )
−++= ysv
LyL fAbdfxV
dxM
fA
21
21
9.01 (2.3)
where:
b: concrete section width d: effective depth of the concrete section AL: cross-sectional area of externally bonded reinforcement As: cross-sectional area of internal steel reinforcement M(x): bending moment acting on the x coordinate V(x): shear force acting on the x coordinate fy: yield strength of internal steel reinforcement fLy: yield strength of reinforcing plate fv: concrete formal shear stress given by equation (2.4)
( ) ctmsv ff 30.0501 ρξ += (2.4)
where:
ρs: longitudinal internal steel reinforcement ratio fctm: mean value of axial tensile strength in concrete ξ: parameter given by equation (2.5)
>≤<−≤<−
≤
=
mdmddmdd
md
0.19.00.15.04.03.15.02.06.1
2.04.1
ξ (2.5)
Colotti and Spadea (2001) developed a model based on the theory of plasticity. This model differs from the current truss models since it explains the failure mode influenced by bond-slip. According to the truss analogy concept, a generic cracked and strengthened RC beam was idealized as a plane truss. The longitudinal rebars, the external reinforcement and the vertical stirrups constitute the tension members, while the compression members are formed by the concrete in the top chord and in the web diagonal struts (Figure 2.7). Perfect bonding is assumed between the concrete support and the plate. The model for the interface assumes constant bond strength with zero tension cut-off when the concrete tensile strength is reached. The mechanism associated with the bond failure mode is characterized by the slipping of the plate located in the shear span zone, together with a diagonal crack. The ultimate failure load before peeling occurs is given by equation (2.6).

Flexural strengthening of reinforced concrete structures by plate bonding
2-23
Figure 2.7. Diagram for truss model concept.
( )
−−
+−+=
daL
dL
dLdf
sAV shearshearshear
yw
wu ϑϑϑ 2
2
(2.6)
where:
Vu: ultimate shear force before peeling occurs Lshear: shear span a: unplated length between the support and the laminate end Aw: cross-sectional area of steel shear reinforcement sw: distance between stirrups ϑ: ratio of bond strength to stirrup tensile strength given by (2.7)
yw
wy fA
sU=ϑ (2.7)
where:
Uy: bond strength. The yield condition of the interface is assumed as a constant value defined as bond strength. In the evaluation of the bond strength, the different debonding failures are taking into account through the following equations:
a) debonding of the plate from the concrete:
( )( )( )( )
>−+≤<−+
=MPaffbMPaffb
UcmcmL
cmcmLy 505006.077.2
50202002.017.2 (2.8)
where:
fcm: mean value of concrete compressive strength (cylinder) bL: laminate width
b) failure of the concrete layer between the plate and the
reinforcing rebars:

Chapter 2
2-24
rbsfU crctm
y 6= (2.9)
where:
scr: crack spacing r: concrete cover
2.3.3. Linear elastic analysis at the plate end Adopting the following hypothesis: materials are homogeneous, isotropic and linear elastic, complete composite action between plate and concrete (no slip), and shear and normal stresses constant along the adhesive thickness, it is possible to develop an interface behavior model that helps to define some acceptable design criteria to avoid peeling failure at the laminate end. Some models have been developed using the linear elastic approach. They constitute a relatively simple closed-form solution. Jones et al. (1988) were the first in suggesting the use of an elastic shear stress based on the classical beam theory to predict the interface shear stress at the plate end of a steel laminate. They compared a peak shear value, which was reasonably given by the elastic shear stress multiplied by a factor of 2.0, to 2.00.5 times the concrete tensile strength. But in most cases, this model was extremely unconservative. Later on, based on a parametric study, Varastehpour and Hamelin (1997) modified Jones’ formula to take into account the effect of different variables such as the rigidity of the plate, the geometry of the section and the nature of loading on interfacial stresses. Roberts and Haji-Kazemi (1989) developed a set of equations for predicting the shear and normal stresses at the interface based on a staged analysis approach. The interfacial shear and normal stresses were found by combining the stresses of two stages. In the first stage, the beam and plate were assumed to have identical deflections, with the boundary conditions modeling the zero axial force condition at the laminate ends. In the second stage, a bending moment and a shear force equal to those derived from the previous stage were applied at the plate end in the opposite direction. This method was accurate but rather complicated and was later simplified by the first author (Roberts, 1989). Ziraba et al. (1994) suggested a modification of Roberts’ formula after performing a non-linear finite element analysis because it underestimated the stresses for thick plates. Later on, Quantrill et al. (1996a) employed a modification of Roberts’ formula to predict the stresses at the laminate end. According to El-Mihilmy and Tedesco (2001), this approach did not yield a consistent relationship with the experimental results. Tumialan et al. (1999) developed a model where the interfacial peak of shear and normal stress were evaluated using Roberts’ solution. Finally, El-Mihilmy and Tedesco (2001) modified and simplified Roberts’ expressions to account for the non-linearities that exist at the concrete-adhesive interface. Malek et al. (1996, 1998) and Saadatmanesh and Malek (1998) studied the local failure in FRP-strengthened concrete beams due to stress concentration at the plate end or due to the effect of cracks. Their model was based on the linear elastic behavior of materials

Flexural strengthening of reinforced concrete structures by plate bonding
2-25
and on strain compatibility. At the same time, Täljsten (1997) developed a similar model at the plate end for a single load case. In 2001, Brosens (2001) performed the same linear elastic analysis but particularizing for three different load cases. Meanwhile, Smith and Teng (2001a, 2002a) reviewed the previous models and developed a more accurate solution (Smith and Teng, 2001a), which on one hand, assessed the significance of various terms that have been omitted by existing solutions and, on the other hand, allowed the application of these formulae not only to RC beams bonded with a thin plate but also to situations where the flexural rigidity of the beam is more comparable to that of the plate. All solutions proposed by Malek et al., Saadatmanesh and Malek, Täljsten, Brosens, and Smith and Teng include the bending deformations in the beam and the axial deformations in the bonded plate. The difference between them arises from the inclusion of other terms to the governing equation, for instance, the bending deformations on the plate. It should be mentioned that the major part of the existing linear elastic models have been checked by means of a numerical analysis but their ability to predict laminate debonding has only been verified against experimental data recently by Pěsic and Pilakoutas (2003). Even though Smith and Teng developed the most accurate solution for interfacial stresses derived from a linear elastic analysis, it is quite cumbersome and unsuitable for hand calculation. In the following section, a simplification of this solution is given in terms of shear and normal stresses. Shear stress distribution The interfacial shear stresses, τ(x), can be derived from the difference of longitudinal displacements between the bottom fiber of the support and the laminate top face.
( ) ( )
+==
dxdv
dyduGxGx aa γτ (2.10)
where:
Ga: shear modulus of the adhesive layer γ(x): shear deformation u: displacement on the longitudinal direction v: displacement on the vertical direction
By applying equilibrium of forces (see Figure 2.8) and compatibility in a strengthened differential element dx, equation (2.10) results in equation (2.11), which governs the behavior of shear stresses at the interface.

Chapter 2
2-26
Figure 2.8. Forces acting on a strengthened differential element of a beam under transverse loads.
In addition to the assumptions related to a linear elastic analysis, the following considerations are used to obtain equation (2.11). Firstly, no shear deformation is considered when deriving the differential equation. Hence, the shear stress governing equation is easily obtained because the interfacial shear and normal stress problems are uncoupled. In addition, to simplify the governing equation, plate bending stiffness is neglected, since in most cases it is negligible compared to the beam bending stiffness.
( ) ( ) ( )xVIE
ytGx
tEtG
dxxd
cc
c
a
a
LLa
a −=− ττ 12
2
(2.11)
where:
ta: thickness of the adhesive layer tL: thickness of the external reinforcement yc: position of the center of gravity in the concrete cross-section Ic: second moment of inertia of the concrete cross-section Ec: modulus of elasticity for concrete EL: modulus of elasticity for the external reinforcement
The solution of this second-order differential equation gives a general expression for shear stresses shown in equation (2.12). C1 and C2 are integration constants that can be obtained by applying the appropriate boundary conditions.
( ) ( ) ( ) ( )xVIE
ytGxCxCx
cc
c
a
a221
1sinhcoshλ
λλτ ++= (2.12)

Flexural strengthening of reinforced concrete structures by plate bonding
2-27
where:
LLa
a
tEtG 12 =λ (2.13)
By incorporating the integration constants into equation (2.12), an expression for the shear stresses that generalizes the particular load cases solved by Malek (1998), Täljsten (1997), Brosens (2001) or Smith and Teng (2001a) is obtained, as shown in equation (2.14).
( ) ( ) ( )
+
−== −
=
xVedxdVxM
IEy
tGx x
xcc
c
a
a
λλλτ λ 1101
02 (2.14)
Equation (2.14) can be rewritten in a more simplified form, as given by (2.15), by using the notations shown in equations (2.16) to (2.18).
( ) ( ) ( ) x
xLL e
dxdVxtxVx λ
λασλατ −
=
−=+=
0
0 (2.15)
where:
*,Ltr
cL I
yt=α (2.16)
( ) ( ) *,
00Ltr
cL I
yxMx ===σ (2.17)
and: Itr,L
*: second moment of inertia of the strengthened section transformed to laminate
L
ccLtr E
EII =*, (2.18)
The first term of equation (2.15), αV(x) matches with the shear stress derived at the plate interface according to the classical formulae of Strength of Materials since α factor gives the first static moment of the plate divided by both the plate width and the homogeneous moment of inertia of the section (α = mx/bLItr,L
*). The second term of equation (2.15) gives the modification in shear stress caused by the sudden interruption of the plate. The maximum shear stress is obtained at the end of the laminate. When the shear force is constant in the proximity of the plate end (dV(x)/dx = 0), equation (2.15) at x = 0 is simplified to equation (2.19), where the second term is a fraction of the tensile stress generated by the bending moment.

Chapter 2
2-28
( ) ( ) ( )000 =+=== xtxVx LLσλατ (2.19) Equation (2.19) is similar to the solutions of Roberts (1989), Ziraba et al. (1994) and El-Mihilmy and Tedesco (2001). By using the experimental bending test database, it is possible to obtain four ranges of typical values for: constants λ and α, the quotient between both constants, and the product λtL. Table 2.8 summarizes the calculated range of values obtained when choosing the strengthened tests without external anchorages where all data including the failure load are known. In addition, for the analyzed tests, the maximum shear stress at the plate end under failure load has been calculated by means of equation (2.19). As can be observed in Table 2.8, this value fluctuates from 0.21 MPa to 38.82 MPa. By observing this range and knowing that concrete is one of the links of the interface, it seems obvious that the concrete support will never be able to assume the highest value of shear stress because its tensile strength is much lower. Therefore, this linear-elastic approach may not be realistic, if the concrete has reached its tensile strength at the laminate end. If this happens, a flexural crack will appear and the concrete behavior will not be linear elastic. After selecting the tests (a total of 63) where the applied moment at the end of the laminate, M(x = 0) is lower than the cracking moment Mcr, (that is where the linear elastic assumption is reasonably accomplished at the plate end section), the maximum calculated shear stress varies from 0.21 MPa to 6.85 MPa.
Table 2.8. Typical values for the shear stress parameters and for the maximum shear stress.
# of tests λ equation (2.13)
α equation (2.16)
α/λ
λtL
τmax (MPa) equation (2.19)
207 from 0.01 to 0.55
from 4.07e-07 to 1.67e-04
from 1.05e-06 to 5.86e-03
from 0.01 to 1.23
from 0.21 to 38.82
63 M(x = 0) < Mcr
from 0.03 to 0.39
from 4.07e-07 to 1.67e-04
from 1.17e-06 to 5.86e-03
from 0.03 to 1.02
from 0.21 to 6.85
Normal stress distribution The interfacial normal stresses σy(x) can be obtained by assuming strain compatibility between the concrete and the external reinforcement. When applying a certain load state to a beam, a vertical displacement occurs between both adherents: concrete and laminate. This relative displacement creates an interfacial normal stress in the adhesive layer. By applying equilibrium and strain compatibility, the differential equation that governs interfacial normal stresses can be obtained, as shown in equation (2.20).
( ) ( ) ( )cca
a
LL
LL
a
ay
LL
L
a
ay
IEq
tE
dxxd
IEyb
tEx
IEb
tE
dxxd
−=+τσ
σ4
4
(2.20)
where:
yL: position of the center of gravity in the laminate cross-section from its top fiber

Flexural strengthening of reinforced concrete structures by plate bonding
2-29
IL: second moment of inertia of the laminate cross-section Ea: modulus of elasticity for the adhesive layer q: transverse distributed load
For large values of x, it is assumed that the normal stress approaches to zero. Therefore, the general solution for equation (2.20) is given by (2.21).
( ) ( ) ( )[ ] ( )ccL
LLL
xy IEb
IEqdx
xdyxCxCex −++= − τζζσ ζ sincos 21 (2.21)
where:
4 313
LLa
a
tEtE
=ζ (2.22)
By assuming as boundary conditions that the bending moment and shear force at the plate end are resisted solely by the concrete, the integration constants C1 and C2 are then calculated. After incorporating the expressions for both integration constants, the interfacial normal stresses are given by equation (2.23).
( ) ( ) ( ) ( ) ( )(
( ))] ( )} ( )ccL
LLL
Lcca
aL
xy
IEbIEq
dxxdyxxV
xyIE
xMtExxyex
−+=−
−
=−
=
−== −
τζα
τλζ
ζτζσ ζ
sin0
0402
1cos02 32
(2.23)
The maximum normal stress at the interface takes place at the end of the laminate (x =0) and it is proportional to the maximum shear stress and its first derivative.
( ) ( ) ( ) ( )[ ]0020 =+=−== xVxyx Ly ατλζσ (2.24) By choosing from the experimental bending test database those tests whose geometrical and material data as well as their failure load are known, a range of typical values for both the ζ parameter (given by equation (2.22)) and for the maximum interfacial normal stress at the laminate end (equation (2.24)) are calculated and shown in Table 2.9. Similar to the previous case of shear stresses, when the 207 chosen tests from the database are analyzed, the highest value in the range of maximum interfacial normal stress is 23.22 MPa, which is much higher than the possible stresses that can be assumed by the concrete support. However, in the 63 tests where the tensile stress in the bottom fiber of the support has not exceeded the concrete tensile strength, the maximum interfacial normal stress range from 0.10 MPa to 4.22 MPa, a range of values which seems more reasonable.
Table 2.9. Typical values for the ζ parameter and the interfacial normal stress.
Test # ζ equation (2.22)
σy,max (MPa) equation (2.24)
207 from 0.09 to 1.17 from 0.10 to 23.22 63
M(x = 0) < Mcr from 0.09 to 1.07 from 0.10 to 4.22
Chapter 2
2-30
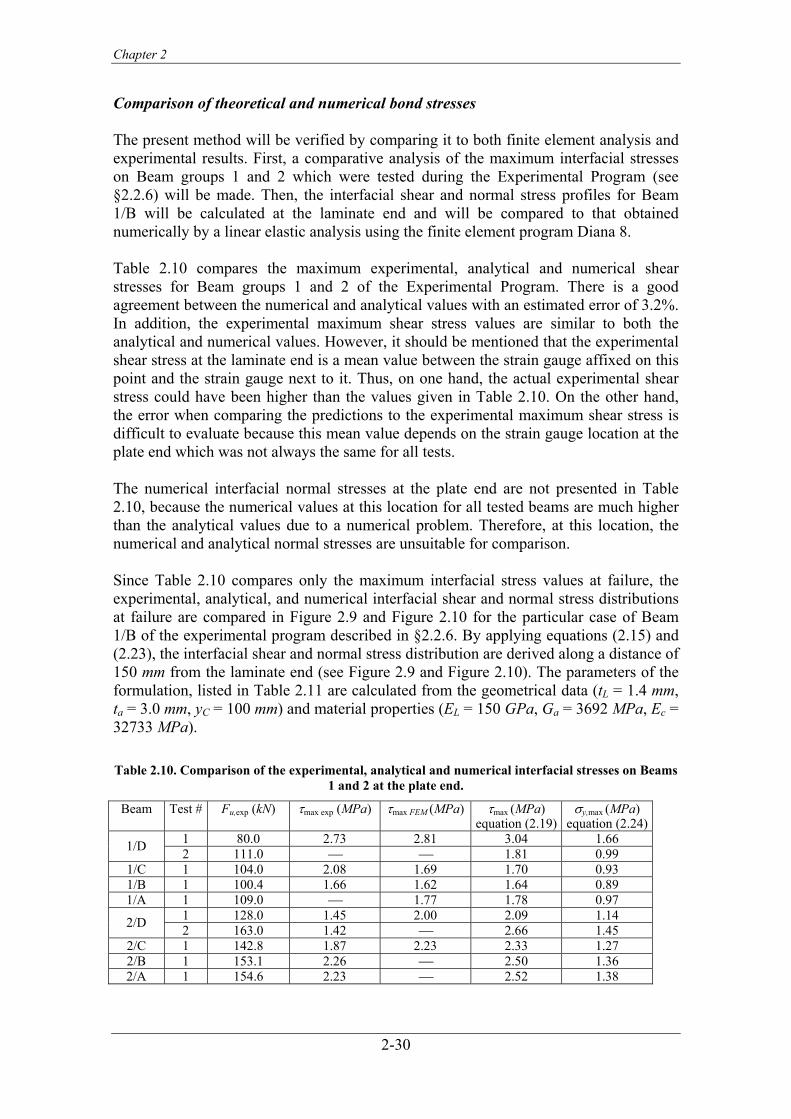
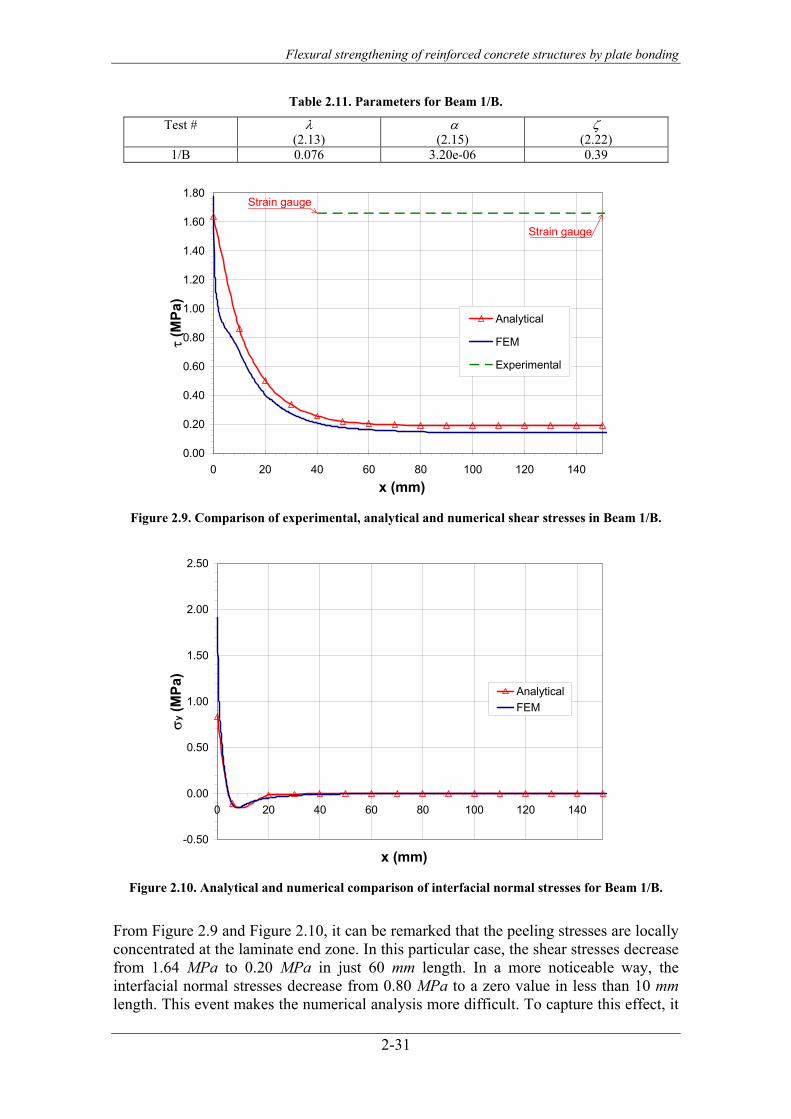
Comparison of theoretical and numerical bond stresses The present method will be verified by comparing it to both finite element analysis and experimental results. First, a comparative analysis of the maximum interfacial stresses on Beam groups 1 and 2 which were tested during the Experimental Program (see §2.2.6) will be made. Then, the interfacial shear and normal stress profiles for Beam 1/B will be calculated at the laminate end and will be compared to that obtained numerically by a linear elastic analysis using the finite element program Diana 8. Table 2.10 compares the maximum experimental, analytical and numerical shear stresses for Beam groups 1 and 2 of the Experimental Program. There is a good agreement between the numerical and analytical values with an estimated error of 3.2%. In addition, the experimental maximum shear stress values are similar to both the analytical and numerical values. However, it should be mentioned that the experimental shear stress at the laminate end is a mean value between the strain gauge affixed on this point and the strain gauge next to it. Thus, on one hand, the actual experimental shear stress could have been higher than the values given in Table 2.10. On the other hand, the error when comparing the predictions to the experimental maximum shear stress is difficult to evaluate because this mean value depends on the strain gauge location at the plate end which was not always the same for all tests. The numerical interfacial normal stresses at the plate end are not presented in Table 2.10, because the numerical values at this location for all tested beams are much higher than the analytical values due to a numerical problem. Therefore, at this location, the numerical and analytical normal stresses are unsuitable for comparison. Since Table 2.10 compares only the maximum interfacial stress values at failure, the experimental, analytical, and numerical interfacial shear and normal stress distributions at failure are compared in Figure 2.9 and Figure 2.10 for the particular case of Beam 1/B of the experimental program described in §2.2.6. By applying equations (2.15) and (2.23), the interfacial shear and normal stress distribution are derived along a distance of 150 mm from the laminate end (see Figure 2.9 and Figure 2.10). The parameters of the formulation, listed in Table 2.11 are calculated from the geometrical data (tL = 1.4 mm, ta = 3.0 mm, yC = 100 mm) and material properties (EL = 150 GPa, Ga = 3692 MPa, Ec = 32733 MPa). Table 2.10. Comparison of the experimental, analytical and numerical interfacial stresses on Beams
1 and 2 at the plate end.
Beam Test #
Fu,exp (kN) τmax exp (MPa) τmax FEM (MPa) τmax (MPa) equation (2.19)
σy,max (MPa) equation (2.24)
1 80.0 2.73 2.81 3.04 1.66 1/D 2 111.0 1.81 0.99 1/C 1 104.0 2.08 1.69 1.70 0.93 1/B 1 100.4 1.66 1.62 1.64 0.89 1/A 1 109.0 1.77 1.78 0.97
1 128.0 1.45 2.00 2.09 1.14 2/D 2 163.0 1.42 2.66 1.45 2/C 1 142.8 1.87 2.23 2.33 1.27 2/B 1 153.1 2.26 2.50 1.36 2/A 1 154.6 2.23 2.52 1.38
Flexural strengthening of reinforced concrete structures by plate bonding
2-31
Table 2.11. Parameters for Beam 1/B.
Test # λ (2.13)
α (2.15)
ζ (2.22)
1/B 0.076 3.20e-06 0.39
0.00
0.20
0.40
0.60
0.80
1.00
1.20
1.40
1.60
1.80
0 20 40 60 80 100 120 140x (mm)
τ (M
Pa)
Analytical
FEM
Experimental
Strain gauge
Strain gauge
Figure 2.9. Comparison of experimental, analytical and numerical shear stresses in Beam 1/B.
-0.50
0.00
0.50
1.00
1.50
2.00
2.50
0 20 40 60 80 100 120 140
x (mm)
σy (
MPa
)
AnalyticalFEM
Figure 2.10. Analytical and numerical comparison of interfacial normal stresses for Beam 1/B.
From Figure 2.9 and Figure 2.10, it can be remarked that the peeling stresses are locally concentrated at the laminate end zone. In this particular case, the shear stresses decrease from 1.64 MPa to 0.20 MPa in just 60 mm length. In a more noticeable way, the interfacial normal stresses decrease from 0.80 MPa to a zero value in less than 10 mm length. This event makes the numerical analysis more difficult. To capture this effect, it

Chapter 2
2-32
is necessary to generate a high dense mesh (see Figure 2.11) at the anchorage region which implies a significant increase in the computational cost. Despite the density of the mesh at the laminate end, a numerical normal stress peak higher than the analytical value is obtained for x = 0. However, at a few millimeters from this section, both stress distributions are similar.
Figure 2.11. Mesh for Beam 1/B.
As a conclusion, the presented methodology represents a useful tool to predict the interfacial shear and normal stresses at the cut-off point of the laminate when assuming a linear elastic behavior of concrete. Failure criteria: Kupfer and Gerstle (1973) or Mohr-Coulomb Once the maximum interfacial shear and normal stresses are known, a comparison to an adequate failure criterion should be performed. Failure will occur if the threshold of the maximum shear stress or maximum tensile stress is exceeded. However, it seems more realistic a failure criterion that merges both shear and tensile stresses. There are two failure criteria that have been applied with more frequency in the bibliography: Kupfer and Gerstle (1973) and Mohr-Coulomb. Both criteria will be explained in the following lines. In the immediate vicinity of the external reinforcement, the concrete is under a state of combined shear (τ) and biaxial tensile stresses resulting from the combination of beam flexure and peeling stresses (σx, σy). Thus, the principal stresses in the concrete (σI, σII) may be either tension-tension or tension-compression depending on the magnitude of shear stresses. Since the concrete is the weakest link of the materials that constitutes the interface, some authors (Malek et al., 1998; Saadatmanesh and Malek, 1998; El-Mihilmy and Tedesco, 2001; Pěsic and Pilakoutas, 2003) proposed the Kupfer and Gerstle criterion for concrete elements under a biaxial stress state. When both principal stresses are tension, this failure model implies that the resulting state of stresses will be acceptable only if the maximum principal stress is lower than the concrete tensile strength. On the contrary if one of the principal stresses is compression, the failure envelope can be approximated by a straight line between the concrete tensile strength and the concrete compressive strength as shown in Figure 2.12.
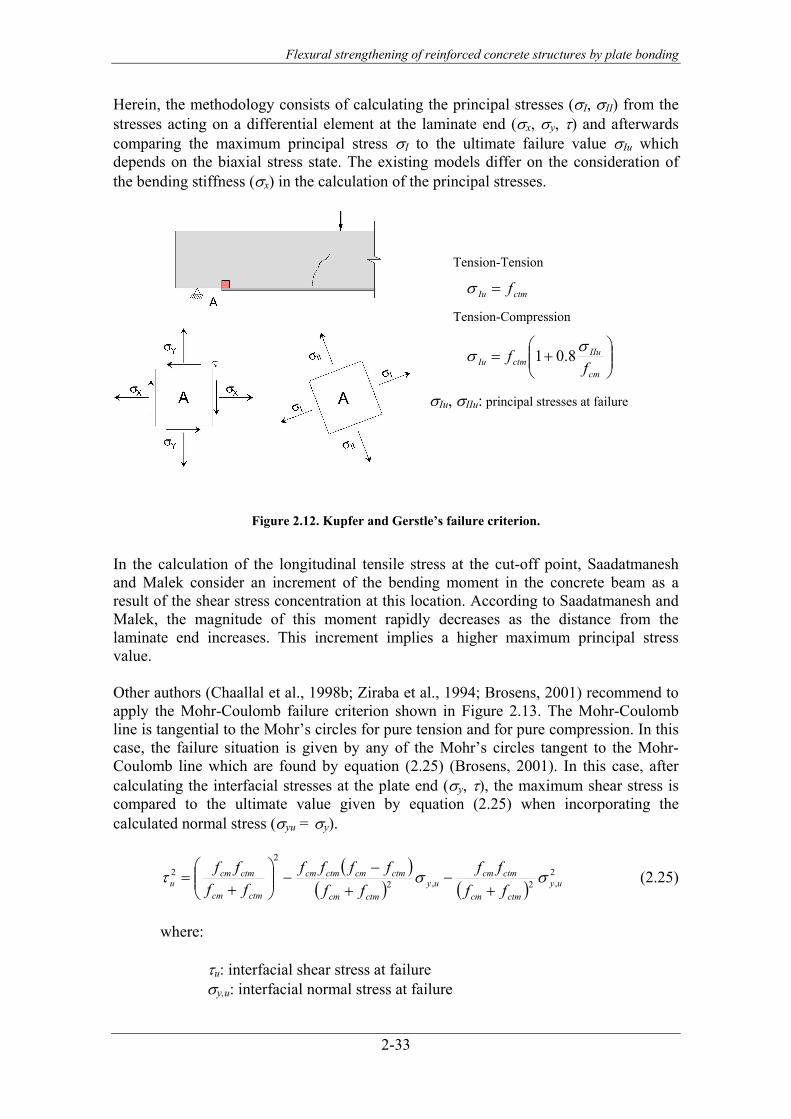
Flexural strengthening of reinforced concrete structures by plate bonding
2-33
Herein, the methodology consists of calculating the principal stresses (σI, σII) from the stresses acting on a differential element at the laminate end (σx, σy, τ) and afterwards comparing the maximum principal stress σI to the ultimate failure value σIu which depends on the biaxial stress state. The existing models differ on the consideration of the bending stiffness (σx) in the calculation of the principal stresses.
Tension-Tension
ctmIu f=σ
Tension-Compression
+=
cm
IIuctmIu f
f σσ 8.01
σIu, σIIu: principal stresses at failure
Figure 2.12. Kupfer and Gerstle’s failure criterion.
In the calculation of the longitudinal tensile stress at the cut-off point, Saadatmanesh and Malek consider an increment of the bending moment in the concrete beam as a result of the shear stress concentration at this location. According to Saadatmanesh and Malek, the magnitude of this moment rapidly decreases as the distance from the laminate end increases. This increment implies a higher maximum principal stress value. Other authors (Chaallal et al., 1998b; Ziraba et al., 1994; Brosens, 2001) recommend to apply the Mohr-Coulomb failure criterion shown in Figure 2.13. The Mohr-Coulomb line is tangential to the Mohr’s circles for pure tension and for pure compression. In this case, the failure situation is given by any of the Mohr’s circles tangent to the Mohr-Coulomb line which are found by equation (2.25) (Brosens, 2001). In this case, after calculating the interfacial stresses at the plate end (σy, τ), the maximum shear stress is compared to the ultimate value given by equation (2.25) when incorporating the calculated normal stress (σyu = σy).
( )( ) ( )
2,2,2
22
uyctmcm
ctmcmuy
ctmcm
ctmcmctmcm
ctmcm
ctmcmu ff
ffff
ffffff
ff σστ+
−+
−−
+
= (2.25)
where:
τu: interfacial shear stress at failure σy,u: interfacial normal stress at failure

Chapter 2
2-34
Figure 2.13. Mohr-Coulomb’s failure criterion.
An example of application of both failure criteria in Beam groups 1 and 2 of the experimental program described in §2.2.6 is presented in Table 2.12. For the Kupfer and Gerstle criterion, by using the maximum shear and normal stresses given in Table 2.10, the principal stresses have been calculated as shown in Table 2.12. The longitudinal tensile stress at the laminate cut-off has been considered in this calculation. When neglecting longitudinal tensile stress, the value in brackets has been obtained. The author believes that the contribution of the longitudinal tensile stress should be considered only in case the concrete remains uncracked at the plate end section. Following this assumption, the maximum principal stress for each test is given in bold in Table 2.12. Since the minimum principal stresses in all tests are compression, the failure value (σIu,Kupfer) depends not only on the concrete tensile strength but on the lower principal stress σII,max (see Figure 2.12). The ratio between the maximum and the theoretical failure principal stress at the laminate end is higher than 1.0 for all tested beams except for Beam 1/D (#2) and Beam 1/A (see values in bold). It seems that all beams except Beam 1/D (#2) and Beam 1/A should have failed by debonding initiated at the laminate end for a load value much lower than the experimental ultimate load. As shown in Table 2.10, when applying the Mohr-Coulomb criterion, only Beam 1/D and the entire Beam group 2 should have failed due to peeling-off at the laminate end because the maximum shear stress at the cut-off point exceeded the maximum value allowed by the criterion.

Flexural strengthening of reinforced concrete structures by plate bonding
2-35
Table 2.12. Failure criteria for Beams 1 and 2 at the plate end.
Kupfer and Gerstle criterion Mohr-Coulomb criterion Beam Test #
Fu,exp (kN) σI,max
(MPa) σIu,Kupfer (MPa)
σI,max/ σIu,Kupfer
τmax (MPa)(2.15)
τu,Mohr (MPa)
τmax/τu,Mohr
1 80.0 6.80 (3.90) 2.69 (2.57) 2.51 (1.52) 3.04 1.69 1.79 1/D 2 111.0 3.90 (2.33) 2.70 (2.63) 1.44 (0.89) 1.81 2.07 0.88 1/C 1 104.0 3.65 (2.18) 2.70 (2.63) 1.35 (0.83) 1.70 2.11 0.81 1/B 1 100.4 3.53 (2.11) 2.70 (2.64) 1.30 (0.97) 1.64 2.12 0.77 1/A 1 109.0 3.83 (2.28) 2.70 (2.63) 1.41 (0.87) 1.78 2.08 0.85
1 128.0 4.50 (2.68) 2.70 (2.61) 1.66 (1.03) 2.09 1.99 1.05 2/D 2 163.0 5.73 (3.42) 2.70 (2.58) 2.11 (1.32) 2.66 1.81 1.46 2/C 1 142.8 5.02 (2.99) 2.70 (2.60) 1.85 (1.15) 2.33 1.92 1.22 2/B 1 153.1 5.38 (3.21) 2.70 (2.59) 1.98 (1.24) 2.50 1.85 1.35 2/A 1 154.6 5.43 (3.24) 2.70 (2.59) 2.00 (1.25) 2.52 1.85 1.37
At this point, a preliminary conclusion can be drawn from the application of a linear elastic analysis combined with a failure criterion to all beams of the Experimental program. Since Beam 1/D was probably the only beam that may have failed at the laminate end, both Kupfer and Gerstle and Mohr-Coulomb failure criteria seem to be inaccurate when predicting the end peeling failure. It should be noted that the preliminary conclusion is only an observation related to results obtained from the beams tested by the author. This conclusion cannot be generalized because the number of tests employed to check the validity of both failure criteria seems insufficient (10). At the end of this Chapter, the existing linear elastic models together with their failure criteria will be evaluated by means of the bending test database described in §2.2.4. A special distinction will be made for the assembled tests that surely failed by end peeling.
2.3.4. Linear elastic analysis between cracks of a beam subjected to bending and/or shear
Experiments have shown that, during the phase of flexural cracking in concrete, the distribution of shear and normal stresses along the adhesive-concrete interface changes dramatically in comparison with the distribution of the elastic phase. Around each crack, high stress concentrations, which oppose the opening of the flexural crack, develop due to the presence of the FRP reinforcement. The estimation and prediction of these stresses are very important and must be taken into account in design considerations explicitly or implicitly. Malek et al. (1998) were the first to study the effect of flexural cracks analytically. The significant role played by the cracks in the distribution of shear stresses was taken into account by applying the same linear elastic procedure described in §2.3.3 in the shear stress calculation. A similar approach is presented in this section. The general expression for shear stresses given by equation (2.12) of §2.3.3 remains valid for this case. Assuming as boundary conditions the value of the plate axial stresses at each crack location, the integration constants C1 and C2 can be calculated. By incorporating their values into equation (2.12), the shear stress distribution can be obtained as a function of both the plate tensile stress and the bending moments acting on each crack location.

Chapter 2
2-36
Studying an element between two cracks I and J (see Figure 2.14), whose length is the crack distance scr, and where crack J is the crack with the highest bending moment and the highest plate tensile stress, equation (2.26) gives the general expression for shear stresses between both cracks.
Figure 2.14. Forces acting in an element between two cracks.
( ) ( ) ( )( ) ( )( )[ ]{
( ) ( )( ) ( ) ( )( )[ ]
( )( ) ( )( )[ ]} ( )xVxxxxq
xxxxMxxxxM
xxxxts
x
JI
JIIJ
JILIJLLcr
αλλλα
λλαλ
λσλσλλ
τ
+−−−−
−−=−−=−
−−−−=
coshcosh
coshcosh
coshcoshsinh
1,,
(2.26)
where:
xI: location of crack I xJ: location of crack J scr: distance between cracks I and J σL,I: laminate tensile stress in crack I σL,J: laminate tensile stress in crack J λ: constant defined in equation (2.13) α: constant defined in equation (2.15)
As shown in equation (2.26), the distribution of shear stresses follows an exponential function that diminishes from both crack locations, where the maximum value of shear stress is achieved (equations (2.27) and (2.28)), to a zero shear stress value located between both cracks. To achieve equilibrium in an element between two cracks, the shear stresses should be opposite to the plate tensile stress of the nearest crack location.
( ) ( ) ( )[ ]{ ( )[
( ) ( )] ( )[ ]} ( )IcrcrI
JcrILJLLcr
I
xxVsqsxxM
xxMsts
xx
=+−−=−
−=−−==
αλλαλ
αλλσσλλ
τ
cosh1cosh
coshsinh
1,,
(2.27)

Flexural strengthening of reinforced concrete structures by plate bonding
2-37
( ) ( ) ( )[ ]{ ( ) ( )[
( )] ( )[ ]} ( )JcrI
crJILcrJLLcr
J
xxVsqxxM
sxxMsts
xx
=+−−=−
−=−−==
αλλα
λαλσλσλλ
τ
1cosh
coshcoshsinh
1,,
(2.28)
As an example, this formulation has been applied to the particular case of Beam 2/C of the Experimental Program described in §2.2.6. As previously mentioned, the beam was precracked before applying the external reinforcement. The crack pattern under service load of the unstrengthened beam is shown in Figure 2.15. Only the right hand side of the laminate bonded length is studied. Cracks are listed from midspan towards the laminate end.
Figure 2.15. Crack pattern in Beam 2/C prior to strengthening.
The plate tensile stress in each crack location has been calculated at different load levels by means of moment-curvature analysis, the distribution of shear stresses along half of the bonded laminate at failure load has been obtained by using equation (2.26) between each pair of cracks, as shown in Figure 2.16. As observed in Figure 2.16, the interfacial shear stresses given by equation (2.26) along half of the laminate seem excessively high (maximum values around 80 MPa), especially in each crack location where the maximum value along each pair of cracks is attained. In addition, the maximum shear stresses increase when approaching to midspan (x = 900 mm).
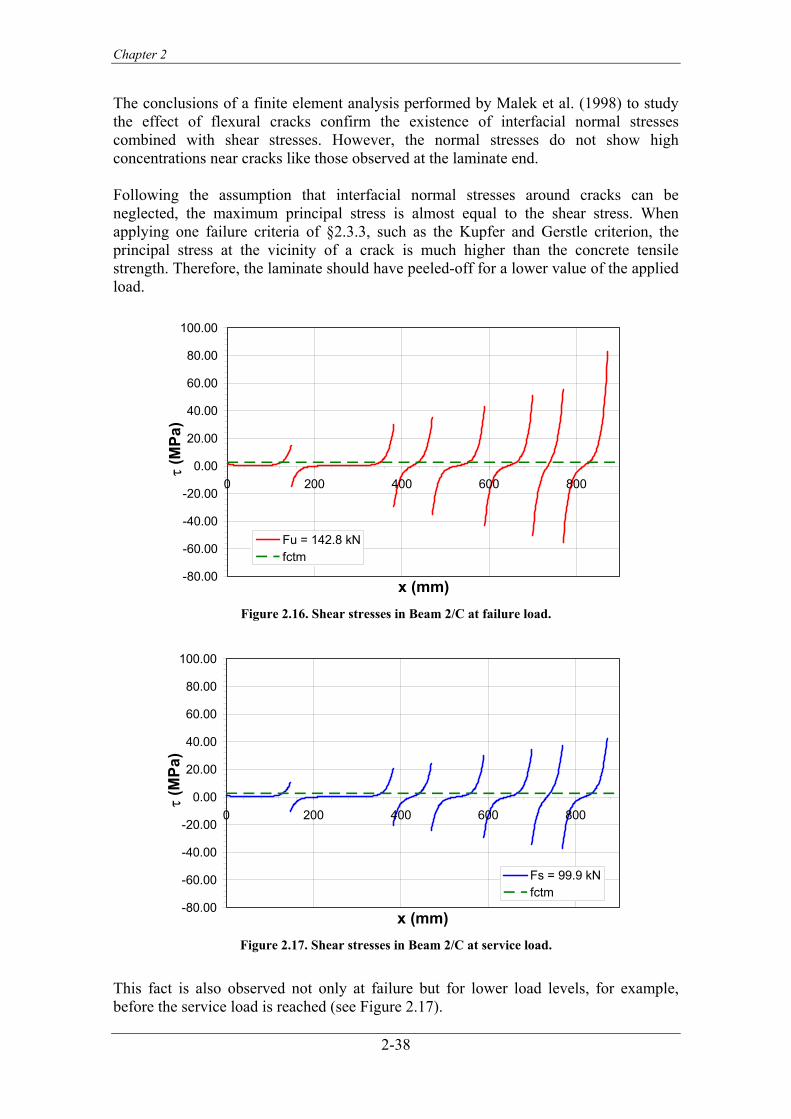
Chapter 2
2-38
The conclusions of a finite element analysis performed by Malek et al. (1998) to study the effect of flexural cracks confirm the existence of interfacial normal stresses combined with shear stresses. However, the normal stresses do not show high concentrations near cracks like those observed at the laminate end. Following the assumption that interfacial normal stresses around cracks can be neglected, the maximum principal stress is almost equal to the shear stress. When applying one failure criteria of §2.3.3, such as the Kupfer and Gerstle criterion, the principal stress at the vicinity of a crack is much higher than the concrete tensile strength. Therefore, the laminate should have peeled-off for a lower value of the applied load.
-80.00
-60.00
-40.00
-20.00
0.00
20.00
40.00
60.00
80.00
100.00
0 200 400 600 800
x (mm)
τ (M
Pa)
Fu = 142.8 kNfctm
Figure 2.16. Shear stresses in Beam 2/C at failure load.
-80.00
-60.00
-40.00
-20.00
0.00
20.00
40.00
60.00
80.00
100.00
0 200 400 600 800
x (mm)
τ (M
Pa)
Fs = 99.9 kNfctm
Figure 2.17. Shear stresses in Beam 2/C at service load.
This fact is also observed not only at failure but for lower load levels, for example, before the service load is reached (see Figure 2.17).

Flexural strengthening of reinforced concrete structures by plate bonding
2-39
Hence, the linear elastic analysis is unsuitable to simulate the existing shear stress distribution along a cracked beam in a correct manner. Thus, a more appropriate method should be developed on replacement of that presented in this section.
2.3.5. Closed-form high-order analysis The closed-form solution obtained by a linear elastic analysis does not satisfy the zero shear stress condition at the end of the adhesive layer. Although this drawback has only a limited effect in a small area near the plate end, a high-order analysis should be performed if the condition of zero-shear stress at the laminate end is pursued. To analyze the behavior of concrete beams externally reinforced with bonded FRPs, Ravinovich and Frostig (2000, 2001a, 2001b) developed a closed-form high-order analysis based on an approach of Frostig (1992) for the analysis of sandwich panels with adhesive bonded joints. The governing equations along with the boundary and continuity conditions are derived using the variational principle of virtual work and following high-order theory. The concrete element is described as a linear elastic beam that follows the Bernouilli-Euler assumption, and the FRP is modeled by using lamination theory. In addition, the adhesive layer is treated as an elastic material without longitudinal stiffness. Then, the normal stresses vary linearly across the adhesive thickness. Although this assumption increases the complexity of the problem, it accomplishes the free surface condition at the end of the adhesive layer. The field equations yield to a 14th order set of linear governing equations. By omitting the appropriate terms, this high-order model can be reduced to the formulae of linear elastic analysis presented in §2.3.3. Opposite to the linear elastic analysis of §2.3.3., the high-order approach takes into account the interaction between interfacial shear and normal stresses and has the ability to control the fulfillment of boundary conditions at the plate end. This model was used especially in the examination of various techniques that try to control and reduce the shear and vertical normal stress at the plate end, such as decreasing the thickness and increasing the width of the laminate, or applying external anchoring devices of prestressed clamps or straps wrapping the strengthened section, or leaving a spew-fillet at the edges of the adhesive layer (Ravinovich and Frostig, 2001b). In addition, later on, Ravinovich and Frostig (2001a) introduced the non-linear response of the strengthened beam in the high-order analysis. From the model verification, Ravinovich and Frostig concluded that both interfacial and laminate tensile stress exhibited a strong dependence on the non-linear response of a beam. Therefore, a linear elastic analysis underestimates their value and may yield to an unsafe design. The validity of the model developed by Ravinovich and Frostig was questioned by some authors like Shen et al. (2001). In particular, the research group of Shen et al. and Yang et al. (2002, 2004) developed a high-order interfacial stress analysis for simply supported beams strengthened by bonded plates and subjected to general symmetric loads. The difference of this solution over that of Ravinovich and Frostig relies on the

Chapter 2
2-40
permission for non-zero longitudinal stresses in the adhesive layer and consequently, the variation of shear stresses across the adhesive thickness. As a conclusion, the closed-form high-order analysis is a systematic and more rigorous approach compared to the linear elastic analysis of §2.3.3. However, it has the inconvenience of not providing explicit expressions for interfacial stresses. Therefore, it results complicated and not very useful for hand calculations in design purposes.
2.3.6. Shear capacity based models Shear capacity based models are designed to prevent two types of shear failure: peeling failure due to the effect of shear cracks (Oelhers, 1990, 1992; Smith and Teng, 2001b; Ali et al. 2001), and plate end shear failure (Jansze, 1997; Ahmed and Van Gemert, 2001; Brosens, 2001) (see §2.2.3). The basis of the shear capacity based models is the shear strength of the concrete with or without partially contribution of the steel shear reinforcement. The peeling phenomena in beams subjected to shear and flexure where no shear diagonal cracks have occurred was first investigated by Oelhers (1990, 1992). Tests results on steel plated beams showed that the presence of stirrups do not affect the shear force that causes debonding of steel plates. This is because the stirrups that cross a diagonal crack, have to be stretched before they can contribute to the shear strength of the beam, but as steel plates are rigid, they debond as soon as sliding takes place. Oelhers (1992) suggested a lower bound of the shear force that causes peeling in the tension face plated beam, Vpeel, which can be taken as the shear capacity of the concrete in the RC beam alone without the contribution of the stirrups, Vcu.
cupeel VV = (2.29) For general cases with shear forces and bending moments at the plate end, the experimental program performed by Oelhers (1992) showed a very strong interaction between flexural and shear peeling. Therefore, Oelhers suggested the following interaction equation (2.30) derived from the failure envelope of tests results, where: Mpeel and Vpeel are the bending moment and shear force at the plate end when peeling occurs; and, Mpeel, V = 0 is the peeling moment at the plate end when the shear force is equal to zero and is given by equation (2.31).
17.10,
≤+= cu
peel
Vpeel
peel
VV
MM
(2.30)
LL
ctmctrcVpeel tE
fIEM
901.0
*,
0, == (2.31)
Flexural strengthening of reinforced concrete structures by plate bonding
2-41
where:
Itr,c*: second moment of inertia of the strengthened section transformed to
concrete Although Oelhers’ model was not purely based on shear capacity, it was included in this group because it establishes a limit on the shear force. By the way, the only difference with the remaining models is the consideration of an interaction between shear forces and bending moments. Smith and Teng (2001b) assessed Oelhers’ interaction by means of a database, and noted that no interaction existed between the bending moment and the shear force when the shear force was greater than Vpeel given by equation (2.29). Therefore, Smith and Teng proposed a simple debonding strength model replacing Oelhers’ interaction, where the shear strength is evaluated according to any national or international design code. The range of applicability of this model is limited to a ratio Mpeel/Mpeel, V = 0 lower than 0.78.
cupeel VV 2.1= (2.32) Later on, Ali et al. (2001) developed mathematical models to quantify the shear peeling resistance based on plasticity concepts of shear in reinforced concrete beams and based on procedures to compute the bond strength between the bonded plate and the concrete element. According to Ali et al., for every possible critical diagonal crack location, it is necessary to determine both the shear force required to cause diagonal cracking Vcr and the applied shear force to cause failure along the cracked section Vu. The intersection point between the plots of both parameters (Vcr, Vu) gives the critical crack location (Lcrack,crit), as shown in Figure 2.18. The shear force to cause diagonal cracking, Vcr, is obtained by applying equilibrium in Figure 2.18, as shown in equation (2.33). The externally bonded plate delays the formation and propagation of a diagonal crack. In addition, a diagonal crack will open when the concrete stress reaches the concrete tensile strength and the plate is subjected to the tensile stress given by strain compatibility. In equation (2.34), ∆Vcr is the component resisted by the plate and it is obtained by multiplying the concrete tensile strength by the transformed area of plate crossing the inclined crack.
( ) ( ) ( )
+
+∆++= 2222
,5.01 hx
hthVhxf
LV L
creffctmshear
cr (2.33)
where:
h: total depth of the concrete section fctm,eff: effective tensile strength in concrete given by Zhang (1997) as equation (2.34)
( ) 3.032
, 01.0156.0 −= hff cmeffctm (2.34)

Chapter 2
2-42
Ali et al. modified the formulae of Zhang (1997) for the shear force to cause failure (Vu) along a cracked plane in an unplated reinforced concrete beam without shear stirrups to take into account the contribution of the external reinforcement on resisting the shear failure across a cracked section.
+
+
−
+
+
= 58.07115154.827.05.325.0
2
Ly
Lctmscm
cmu f
btfAbhh
xhxbhf
hfV η
(2.35)
where:
η: experimental constant that depends on the load type and equals to 1.6 for point loads
Equation (2.35) is equivalent to any other code formulation for the shear resistance of an element without shear reinforcement with only a slight modification to take into account the contribution of the laminate on the shear strength. This modification corresponds to the last term of equation (2.35) and represents the restraint provided by the longitudinal reinforcement and the bonded plate to the sliding failure along the cracked section. By using equations (2.34) and (2.35), the envelopes for Vcr and Vu can be drawn for different x values. The point of intersection of both curves gives the shear peeling strength, Vpeel, as well as the critical diagonal crack location, Lcrack,crit (see Figure 2.18). Ali et al.’s model is valid not only for reinforced concrete beams externally reinforced with steel plates but for either beams with steel angles attached to the tension face or externally reinforced beams where side plates have been attached to improve the shear peeling resistance.
Figure 2.18. Shear peeling model according to Ali et al.
Jansze (1997) developed a model to prevent plate end shear failure in steel plated beams based on an analogy of the model of Kim and White (1991). Plate end shear failure occurs when a shear crack is initiated at the plate end instead of at the beam support. The plate-end shear crack propagates as a normal shear crack, from the end of the

Flexural strengthening of reinforced concrete structures by plate bonding
2-43
laminate to the load application point. This type of failure only occurs when there is not enough shear reinforcement. The formula developed by Jansze is based on the shear formulae of the CEB-FIP Model Code MC-90 (1990) with the following modifications: the critical shear crack of a conventional RC beam, Lshear crack, is analogous to the plate end position or the unplated length, a; and the shear span of the unstrengthened beam is analogous to a fictitious shear span, Lshear mod as shown in Figure 2.19.
Figure 2.19. Jansze’s model. Analogy to the model of Kim and White.
The critical shear force at the plate end that causes a premature failure, Vpeel, is associated to a plate end shear stress τPES given by equation (2.37).
bdV PESpeel τ= (2.36)
33mod
1002001318.0 cksshear
PES fdL
d ρτ
+= (2.37)
where:
fck: characteristic cylinder compressive strength in concrete Lshear mod: fictitious shear span given by equation (2.38)
( )4 3
2
mod
1daL
s
sshear ρ
ρ−= (2.38)
Ahmed and Van Gemert (2001) modified Jansze’s model to make it suitable for FRP strengthened beams by replacing the plate end shear stress τPES by the so-called fiber end shear stress τFES which adds to equation (2.37) a modification factor, ∆τmod. On one hand, the proposed factor relies on adding the incremental portion of shear stress generated due to shear force when substituting the steel plates by FRP laminates, and on the other hand, the factor considers the contribution of the original shear reinforcement of the beam to be strengthened. More information about this factor is given by Ahmed and Van Gemert (2001) or Brosens (2001).
bdV FESpeel τ= (2.39)

Chapter 2
2-44
modτττ ∆+= PESFES (2.40)
2.3.7. Concrete tooth models The concrete tooth models are based on the formation of teeth within the concrete cover along the shear span. Each concrete tooth between two cracks is assumed to act as a cantilever with shear flow stresses acting at its free end as shown in Figure 2.20. By ignoring the interaction between neighboring teeth, failure occurs when the tensile stress at the underside of the internal steel rebars reaches the concrete tensile strength. At this point a horizontal peeling crack initiates and causes peeling-off at the concrete cover.
a) Concrete beam b) Concrete tooth between two adjacent cracks
Figure 2.20. Behavior of a tooth between two adjacent flexural cracks according to Raoof and Zhang.
The concrete tooth concept was first described by Zhang et al. (1995). Based on it, Raoof and Zhang (1997) developed a model to predict the premature debonding of the laminate due to concrete cover peeling-off. In Raoof et al. (2000a, 2000b), the proposed model was checked against large scale test data reported by others. In addition, in the last references, the influence of various design parameters such as concrete strength, beam width, plate thickness was studied by means of a parametric study. Due to large variations in the spacing of stabilized cracks within the concrete cover zone, a theoretical upper and lower bound for the peeling failure load was obtained depending on the upper and lower crack spacing value. The lower bound was suggested to be the appropriate for design purposes. Firstly, Raoof and Zhang (1997) calculated the minimum and maximum stabilized crack spacings, scr,min and scr,max, in a reinforced concrete beam with an externally bonded plate.
( )∑ +=
LLss
ctmecr buu
fAsπφmin, (2.41)
min,max, 2 crcr ss = (2.42)

Flexural strengthening of reinforced concrete structures by plate bonding
2-45
where:
Ae: area of concrete in tension φs: diameter of the longitudinal tensile steel rebars us, uL: internal steel-to-concrete average bond strength and steel plate-to-concrete average bond strength, respectively, in MPa given by equation (2.43)
cmLs fuu 313.0== (2.43) By assuming elastic behavior for the structural deformations of an isolated tooth up to failure, the tensile stress in point A, shown in Figure 2.20, can be calculated by equation (2.44). If failure initiates once the tensile stress at point A reaches the concrete tensile strength, the minimum shear stress value that causes failure will be obtained from equation (2.45). Therefore, by applying horizontal equilibrium, a minimum value for the stress in the steel plate, σL,min, which is required to cause flexural cracking and failure of a tooth covering the minimum stabilized crack spacing, can be obtained as a function of the calculated minimum shear stress, τmin. After incorporating equation (2.45) into equation (2.46), equation (2.47) is obtained. Noting from equations (2.42) and (2.46) that τmax = 2τmin, the upper bound of the plate tensile stress σL,max will be given as twice the lower bound σL,min.
τσcr
LcrAA bs
rbsI
M 62
== (2.44)
ctmL
cr frb
bs6
min,min =τ (2.45)
L
effLL t
L ,minmin, τσ = (2.46)
( ) effLctmLLss
e
LL
effLL Lf
buuA
rAb
tL
,2,
minmin, 6 ∑ +==
πφτσ (2.47)
where:
LL,eff: effective length of the steel plate in the shear span (given by equation (2.48)) which is the minimum value between the plate length on the shear span, and LL,1 which was obtained by fitting the semi-empirical data, calculated by equation (2.46), in the tests results of Oelhers (1992)
{ }1,, ,min LsheareffL LaLL −= (2.48)
where:
( )
>≤−
=mmssmmsss
Lcrcr
crcrcrL 723
7225.021
min,min,
min,min,min,1, (2.49)

Chapter 2
2-46
From the magnitudes of minimum and maximum plate tensile stress at the end of the effective shear span, Raoof and Zhang predicted the upper and lower bound of the plate peeling moment (Mpeel,min, Mpeel,max) by using simple bending theory. Later on, Raoof and Hassanen (2000b, 2001) extended the concrete tooth model to cases where FRP laminates were used for upgrading reinforced concrete beams in flexure. In this case, equations (2.44) to (2.49) are valid except for both the plate-to-concrete average bond strength, uL, which should be redefined, and the effective length LL,1 that should now be estimated by the semi-empirical relationship given by equation (2.50).
( )
>≤−
=mmssmmsss
Lcrcr
crcrcrL 404
405.024
min,min,
min,min,min,1, (2.50)
By using those tests of the bending test database that fail due to peeling effect, typical values for scr,min range between 29 mm and 201 mm. By applying equation (2.47), the minimum value of plate stress that causes debonding has an average value of 829 MPa. In a similar manner, debonding plate strains show an average value of 7230 µε. Note that the mean value is in the range between 0.60% and 0.80% recommended by some guidelines to avoid peeling failure and a premature laminate debonding was observed in those cases. As an alternative to the formula of Raoof and Zhang for the stabilized crack spacing given by equation (2.41), the FIB Task Group 9.3 FRP (2001) recommended Róstasy et al.’s (1996) formulation to calculate the crack spacing.
LLbss
ss
ss
ctme
LLbss
LLb
LL
ctmecr AEAE
AEu
fAAEAE
AEbufAs
ξπφξξ
+=
+=
∑22 (2.51)
where:
Ae: area of concrete in tension taken as the minimum of 2.5(h-d)b and (h-x)b/3, where x is the neutral axis depth Es: modulus of elasticity of internal steel us, uL: internal steel-to-concrete average bond strength and steel plate-to-concrete average bond strength (MPa), respectively given by equation (2.52) from the CEB-FIP Model Code MC-90 (1990) and equation (2.53) derived by Holzenkämpfer (1994) (referenced by Róstasy et al., 1996)
ctms fu 80.1= (2.52)
ctmL fu 25.1= (2.53)
ξb: bond parameter given by equation (2.54)
∑=
sLL
Lss
s
Lb AE
bAEuu
πφξ (2.54)
Flexural strengthening of reinforced concrete structures by plate bonding
2-47
Varastehpour and Hamelin (1996) established a debonding criteria for concrete cover failure by comparing the average shear stress at the interface given by equation (2.45) to the admissible shear stress given by the Mohr-Coulomb failure criterion. As mentioned in §2.2.4, in real life situations beams are usually cracked to some degree under service load conditions before applying the laminate. To take into account the precracking phenomenon, Raoof et al. (2000a) modified the stabilized crack spacing given by equation (2.41) omitting the term representing the externally bonded plate. The comparison between equations (2.55) and (2.41) suggests that plate bonding will lead to a reduction of crack spacing. According to Raoof et al., the difference on crack spacing implies a different ultimate peeling bending moment. By contrast, as shown in §2.2.6, during the experimental program performed by the author, some intermediate cracks appeared and propagated between the existing cracks at load levels higher than service in the precracked beams. Therefore, when peeling occurred, crack spacing was very similar in precracked and non-precracked beams.
∑=
ss
ctmecr u
fAsπφmin, (2.55)
2.4. Comparative analysis of the existing theoretical methods by using the bending test database
The theoretical models compiled and reviewed in §2.3 have been validated in this section by using the bending test database presented in §2.2.4. The previous section has presented a methodology for each model to calculate the limit value for the maximum shear force, bending moment or interfacial stress that avoids a premature failure concerning laminate debonding. In this section, the maximum experimental shear force, bending moment or interfacial stress is compared to the corresponding ultimate value derived from the different analytical models. Before starting with the statistical analysis, it should be remembered that truss models, shear capacity based models and concrete tooth models were developed to predict some kinds of premature failures related to laminate peeling-off. According to Smith and Teng (2002b), shear capacity based models appear to be suitable in predicting all kinds of peeling failures. In this respect, special attention is focused on Jansze’s (1997) and Ahmed et al.’s (2001) models which were exclusively developed to prevent plate end shear failures. Concrete tooth models (Raoof and Zhang, 1997; Raoof et al., 2000a, 2000b; Raoof and Hassanen, 2001) were derived for concrete cover separation. Linear elastic models are based on a linear elastic analysis to find the interfacial shear and normal stresses at the end of the laminate. By applying a failure criterion (Kupfer and Gerstle or Mohr-Coulomb) to the calculated stresses, the linear elastic models attempt to predict peeling failure at the plate end. When applying the Kupfer and Gerstle criterion, the maximum principal stresses, σI,max and σII,max, should be calculated. The different models analyzed in this section differ in the consideration of the tensile stress in the bottom concrete fiber, σc,b, when calculating the principal stresses. Malek et al. (1998) consider σc,b even when the concrete has already reached

Chapter 2
2-48
its tensile strength at the laminate end. El-Mihilmy and Tedesco (2001) always neglect the contribution of concrete tensile stresses. In this study, the tensile contribution of concrete has only been considered when the plate end remains uncracked (Oller, 2005). With regard to the Mohr-Coulomb criterion, the statistical performance of equation (2.25) given by Brosens (2001) is analyzed together with the Mohr-Coulomb line given by Ziraba et al. (1994) and Chaallal et al. (1998b). Some authors apply a linear elastic analysis not only at the plate end but also between flexural cracks. However, its application has been omitted in this section because of the conclusions given in §2.3.4. Furthermore, high-order closed-form models have not been analyzed because their complexity makes them unsuitable for design. The existing analytical models have been validated by using the assembled tests without external anchorages and with well-known data at failure about the shear force at the laminate end or about the bending moment acting on the load application point. The total amount of specimens analyzed is summarized in column 3 of Table 2.13. The first number given by this column represents those tests where the maximum experimental shear force is known. In case the total number of tests where the maximum bending moment is known varies from the amount given in column 3, this total is given in brackets. In addition, a special distinction has been made between those specimens that were strengthened with (column 4) a previous load application that tries to simulate a service load state and for those without (column 5). Specimens have also been classified depending on the external reinforcement material. As shown in Table 2.13, when distinguishing the type of material, there are a small number of test results available for the AFRP or the hybrid reinforcement. In addition, for FRP laminates in general, a distinction between wet lay-up and pultruded laminates has been made.
Table 2.13. Summary of assembled specimens.
# of Tests Assembled tests with well-
known data
Data + no external
anchorage
Precracked Non-precracked
(1) (2) (3) (4) (5) Total of strengthened beams 588 346 (379) 37 309 (342)
Material Steel 116 42 0 42 CFRP 395 268 (297) 34 234 (263) GFRP 51 33 (37) 3 30 (34) AFRP 17 0 0 0 Hybrid 9 3 0 3
Fabrication Procedure Wet lay-up 348 220 (253) 25 195 (228) Pultruded 123 83 12 71
After choosing from tests well-documented and without external anchorages those that failed due to laminate peeling-off (see Table 2.14), a statistical analysis was performed for all theoretical models without distinction of the peeling initiation point.
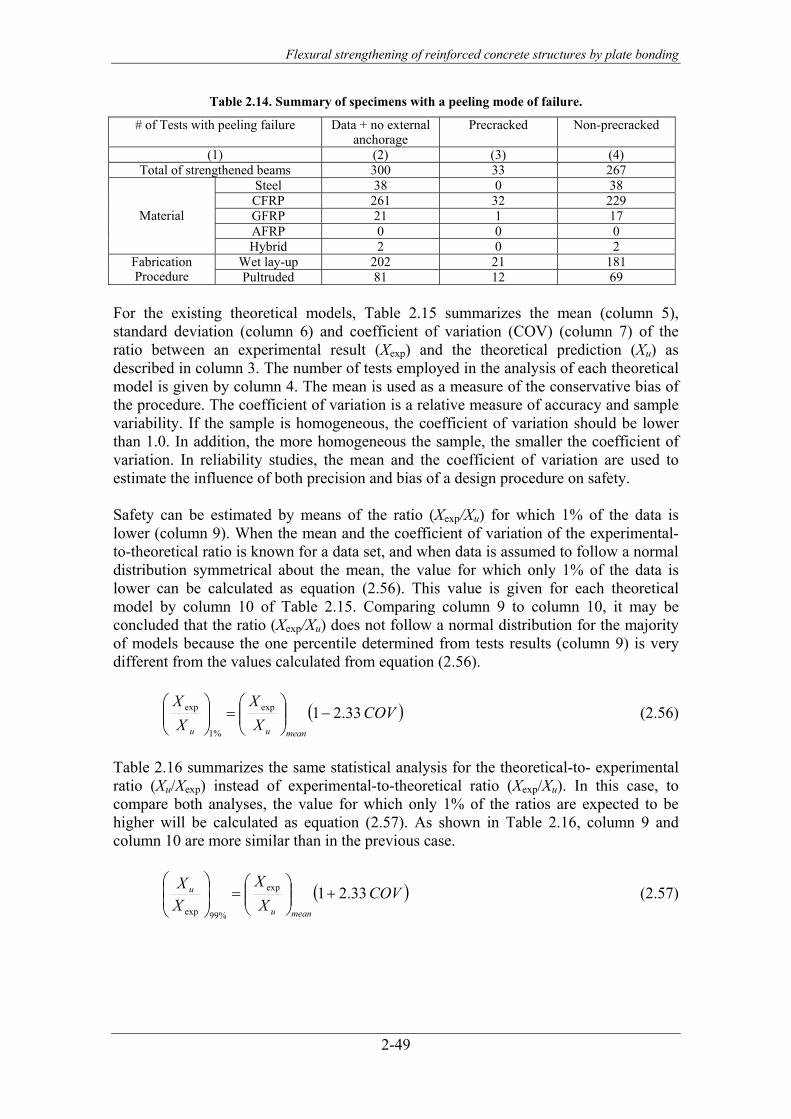
Flexural strengthening of reinforced concrete structures by plate bonding
2-49
Table 2.14. Summary of specimens with a peeling mode of failure.
# of Tests with peeling failure Data + no external anchorage
Precracked Non-precracked
(1) (2) (3) (4) Total of strengthened beams 300 33 267
Steel 38 0 38 CFRP 261 32 229 GFRP 21 1 17 AFRP 0 0 0
Material
Hybrid 2 0 2 Wet lay-up 202 21 181 Fabrication
Procedure Pultruded 81 12 69 For the existing theoretical models, Table 2.15 summarizes the mean (column 5), standard deviation (column 6) and coefficient of variation (COV) (column 7) of the ratio between an experimental result (Xexp) and the theoretical prediction (Xu) as described in column 3. The number of tests employed in the analysis of each theoretical model is given by column 4. The mean is used as a measure of the conservative bias of the procedure. The coefficient of variation is a relative measure of accuracy and sample variability. If the sample is homogeneous, the coefficient of variation should be lower than 1.0. In addition, the more homogeneous the sample, the smaller the coefficient of variation. In reliability studies, the mean and the coefficient of variation are used to estimate the influence of both precision and bias of a design procedure on safety. Safety can be estimated by means of the ratio (Xexp/Xu) for which 1% of the data is lower (column 9). When the mean and the coefficient of variation of the experimental-to-theoretical ratio is known for a data set, and when data is assumed to follow a normal distribution symmetrical about the mean, the value for which only 1% of the data is lower can be calculated as equation (2.56). This value is given for each theoretical model by column 10 of Table 2.15. Comparing column 9 to column 10, it may be concluded that the ratio (Xexp/Xu) does not follow a normal distribution for the majority of models because the one percentile determined from tests results (column 9) is very different from the values calculated from equation (2.56).
( )COVX
XXX
meanuu
33.21exp
%1
exp −
=
(2.56)
Table 2.16 summarizes the same statistical analysis for the theoretical-to- experimental ratio (Xu/Xexp) instead of experimental-to-theoretical ratio (Xexp/Xu). In this case, to compare both analyses, the value for which only 1% of the ratios are expected to be higher will be calculated as equation (2.57). As shown in Table 2.16, column 9 and column 10 are more similar than in the previous case.
( )COVX
XXX
meanu
u 33.21exp
%99exp
+
=
(2.57)
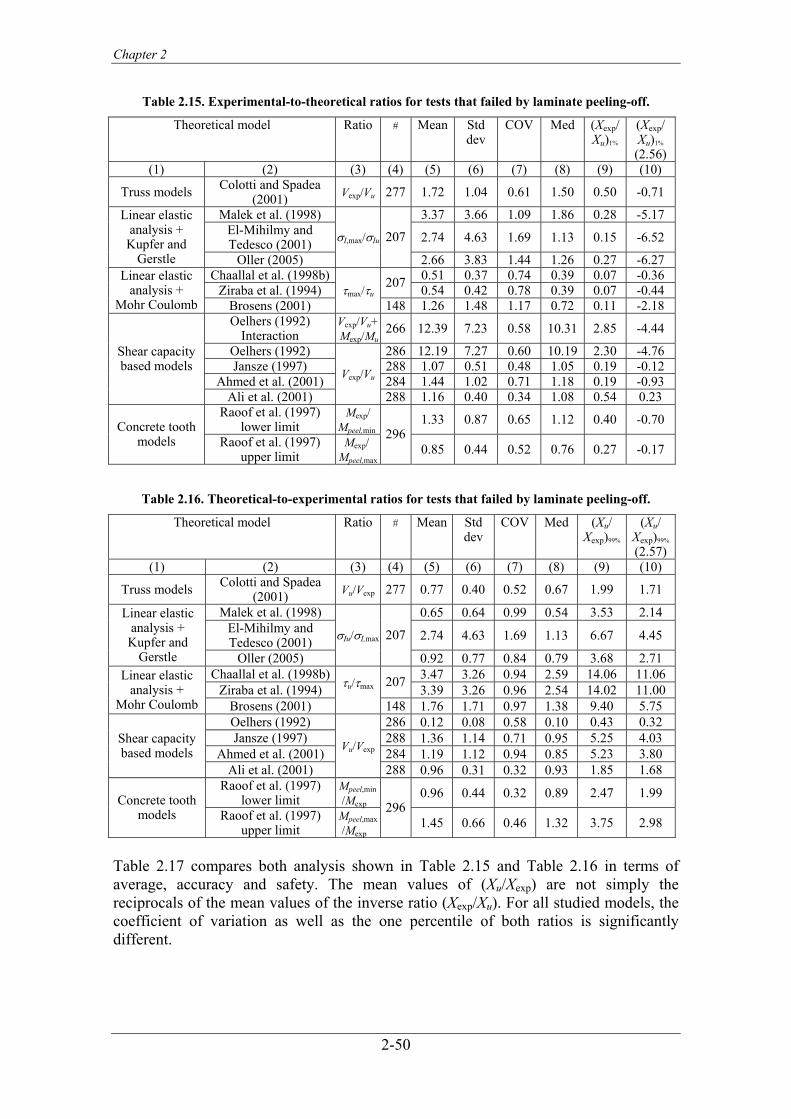
Chapter 2
2-50
Table 2.15. Experimental-to-theoretical ratios for tests that failed by laminate peeling-off.
Theoretical model Ratio # Mean Std dev
COV Med (Xexp/ Xu)1%
(Xexp/ Xu)1%
(2.56) (1) (2) (3) (4) (5) (6) (7) (8) (9) (10)
Truss models Colotti and Spadea (2001) Vexp/Vu 277 1.72 1.04 0.61 1.50 0.50 -0.71
Malek et al. (1998) 3.37 3.66 1.09 1.86 0.28 -5.17 El-Mihilmy and Tedesco (2001) 2.74 4.63 1.69 1.13 0.15 -6.52
Linear elastic analysis + Kupfer and
Gerstle Oller (2005)
σI,max/σIu 207
2.66 3.83 1.44 1.26 0.27 -6.27 Chaallal et al. (1998b) 0.51 0.37 0.74 0.39 0.07 -0.36
Ziraba et al. (1994) 207 0.54 0.42 0.78 0.39 0.07 -0.44 Linear elastic
analysis + Mohr Coulomb Brosens (2001)
τmax/τu
148 1.26 1.48 1.17 0.72 0.11 -2.18 Oelhers (1992)
Interaction Vexp/Vu+Mexp/Mu
266 12.39 7.23 0.58 10.31 2.85 -4.44
Oelhers (1992) 286 12.19 7.27 0.60 10.19 2.30 -4.76 Jansze (1997) 288 1.07 0.51 0.48 1.05 0.19 -0.12
Ahmed et al. (2001) 284 1.44 1.02 0.71 1.18 0.19 -0.93
Shear capacity based models
Ali et al. (2001)
Vexp/Vu
288 1.16 0.40 0.34 1.08 0.54 0.23 Raoof et al. (1997)
lower limit Mexp/
Mpeel,min1.33 0.87 0.65 1.12 0.40 -0.70 Concrete tooth
models Raoof et al. (1997) upper limit
Mexp/ Mpeel,max
2960.85 0.44 0.52 0.76 0.27 -0.17
Table 2.16. Theoretical-to-experimental ratios for tests that failed by laminate peeling-off.
Theoretical model Ratio # Mean Std dev
COV Med (Xu/ Xexp)99%
(Xu/ Xexp)99%
(2.57) (1) (2) (3) (4) (5) (6) (7) (8) (9) (10)
Truss models Colotti and Spadea (2001) Vu/Vexp 277 0.77 0.40 0.52 0.67 1.99 1.71
Malek et al. (1998) 0.65 0.64 0.99 0.54 3.53 2.14 El-Mihilmy and Tedesco (2001) 2.74 4.63 1.69 1.13 6.67 4.45
Linear elastic analysis + Kupfer and
Gerstle Oller (2005)
σIu/σI,max 207
0.92 0.77 0.84 0.79 3.68 2.71 Chaallal et al. (1998b) 3.47 3.26 0.94 2.59 14.06 11.06
Ziraba et al. (1994) 207 3.39 3.26 0.96 2.54 14.02 11.00 Linear elastic
analysis + Mohr Coulomb Brosens (2001)
τu/τmax
148 1.76 1.71 0.97 1.38 9.40 5.75 Oelhers (1992) 286 0.12 0.08 0.58 0.10 0.43 0.32 Jansze (1997) 288 1.36 1.14 0.71 0.95 5.25 4.03
Ahmed et al. (2001) 284 1.19 1.12 0.94 0.85 5.23 3.80 Shear capacity based models
Ali et al. (2001)
Vu/Vexp
288 0.96 0.31 0.32 0.93 1.85 1.68 Raoof et al. (1997)
lower limit Mpeel,min /Mexp
0.96 0.44 0.32 0.89 2.47 1.99 Concrete tooth models Raoof et al. (1997)
upper limit Mpeel,max /Mexp
2961.45 0.66 0.46 1.32 3.75 2.98
Table 2.17 compares both analysis shown in Table 2.15 and Table 2.16 in terms of average, accuracy and safety. The mean values of (Xu/Xexp) are not simply the reciprocals of the mean values of the inverse ratio (Xexp/Xu). For all studied models, the coefficient of variation as well as the one percentile of both ratios is significantly different.

Flexural strengthening of reinforced concrete structures by plate bonding
2-51
Table 2.17. Comparison between both experimental-to-theoretical and theoretical-to-experimental ratios in terms of conservative bias, accuracy and safety.
Theoretical model Para- meter
# Mean COV (Xexp/Xu)1%
Xexp/ Xu
1/(Xu/ Xexp)
Xexp/ Xu
Xu/ Xexp
(Xexp/ Xu)1%
1/(Xu/ Xexp)99%
(1) (2) (3) (4) (5) (6) (7) (8) (9) (10)
Truss models Colotti and Spadea (2001) V 277 1.72 1.28 0.61 0.52 -0.71 0.58
Malek et al. (1998) σI 3.26 1.54 1.09 0.99 -5.17 0.47 El-Mihilmy and Tedesco (2001) σI 2.58 0.36 1.75 1.69 -6.52 0.22
Linear elastic analysis + Kupfer and
Gerstle Oller (2005) σI
207
2.52 1.09 1.48 0.84 -6.27 0.37 Chaallal et al.
(1998b) τ 0.49 0.29 0.76 0.94 -0.36 0.09
Ziraba et al. (1994) τ 207
0.52 0.29 0.81 0.96 -0.44 0.09
Linear elastic analysis +
Mohr Coulomb Brosens (2001) τ 148 1.22 0.57 1.23 0.97 -2.18 0.17 Oelhers (1992) V 286 12.19 8.33 0.60 0.58 -4.75 3.13 Jansze (1997) V 288 1.07 0.74 0.48 0.71 -0.12 0.25
Ahmed et al. (2001) V 284 1.44 0.84 0.71 0.94 -0.93 0.26 Shear capacity based models
Ali et al. (2001) V 288 1.17 1.04 0.34 0.32 0.23 0.60 Raoof et al. (1997)
lower limit M 1.32 1.04 0.65 0.32 -0.70 0.50 Concrete tooth models Raoof et al. (1997)
upper limit M
2960.85 0.69 0.51 0.46 -0.17 0.34
In the majority of existing statistical analysis, the experimental-to-theoretical ratio is used, even though the choice is totally arbitrary. Obviously, this decision has a strong importance on the evaluation of the suitability of a design proposal. When calibration studies are done, the mean and coefficient of variation of the ratio Xexp/Xu are requested. However, as observed in Table 2.17, both values do not lead to a consistent assessment of safety. To solve this dilemma, Collins (2001) proposed the following procedure. Since predictions may be very conservative due to the combination of simplifying assumptions, and they are rarely very unconservative under well formulated procedures, the frequency distribution of (Xexp/Xu) is likely to be unsymmetrical with the median value being less than the average (see both Table 2.15 and Table 2.16). Based on this observation, Collins developed a procedure for determining two numbers which would lead to a less arbitrary assessment of safety. The parameters used to evaluate safety are the median and the coefficient of variation of a fictitious low data set. This low data set consists of the lower 50% of data and their symmetrical values around the median. After evaluating the coefficient of variation of this low data set, the theoretical ratio (Xexp/Xu) for which 99% of the predictions are expected to be higher, (Xexp/Xu)1%, is calculated by means of equation (2.58).
( )%50exp
%1
exp 33.21 Lowmedianuu
COVX
XX
X−
=
(2.58)
The same procedure can be applied to a fictitious high data set in order to calculate the theoretical value for which 99% of elements are expected to be lower in value, (Xexp/Xu)99%.

Chapter 2
2-52
( )%50exp
%99
exp 33.21 Highmedianuu
COVX
XX
X+
=
(2.59)
Like Table 2.15, Table 2.18 summarizes for the existing theoretical models: the minimum (column 5), the mean (column 6), the maximum (column 7), the median (column 8), the standard deviation (column 9), the coefficient of variation (COV) (column 10), the one percentile (Xexp/Xu)1% (column 11) and the ninety-nine percentile (Xexp/Xu)99% (column 12) of the ratio described in column 3 which are calculated as equation (2.58) and (2.59) respectively. The same procedure used to calculate the one percentile (Xexp/Xu)1% and the ninety-nine percentile (Xexp/Xu)99% can be applied to predict some more percentiles (see Table 2.19)
Table 2.18. Experimental-to-theoretical ratios for tests that failed by laminate peeling-off.
Theoretical model Ratio # Min Mean Max Med Std dev
COV (Xexp/ Xu)1%
(Xexp/ Xu)99%
(1) (2) (3) (4) (5) (6) (7) (8) (9) (10) (11) (12) Truss
models Colotti and
Spadea (2001) Vexp/Vu 277 0.45 1.72 6.75 1.50 1.04 0.61 0.18 4.74
Malek et al. (1998) 0.19 3.37 22.24 1.86 3.66 1.09 0.03 14.66
El-Mihilmy and Tedesco
(2001) 0.10 2.74 32.68 1.13 4.63 1.69 -0.20 17.24
Linear elastic
analysis + Kupfer and
Gerstle Oller (2005)
σI,max/σIu 207
0.19 2.66 25.90 1.26 3.83 1.44 0.05 14.60Chaallal et al.
(1998b) 0.04 0.51 1.90 0.39 0.37 0.74 -0.03 1.60
Ziraba et al. (1994)
2070.04 0.54 2.19 0.39 0.42 0.78 -0.03 1.80
Linear elastic
analysis + Mohr
Coulomb Brosens (2001)
τmax/τu
148 0.09 1.26 7.96 0.72 1.48 1.17 -0.02 5.84 Oelhers (1992)
Interaction Vexp/Vu+ Mexp/Mu
266 2.73 12.39 40.04 10.31 7.23 0.58 1.09 33.33
Oelhers (1992) 1.87 12.19 39.98 10.19 7.27 0.60 0.17 33.14Jansze (1997) 288 0.16 1.07 2.90 1.05 0.51 0.48 -0.06 2.31 Ahmed et al.
(2001) 284 0.16 1.44 5.88 1.18 1.02 0.71 0.52 4.40
Shear capacity
based models
Ali et al. (2001)
Vexp/Vu
288 0.53 1.16 2.83 1.08 0.40 0.34 0.93 2.29
Raoof et al. (1997) lower
limit
Mexp/ Mpeel,min
0.36 1.33 6.14 1.12 0.87 0.65 0.31 3.94 Concrete tooth
models Raoof et al. (1997) upper
limit
Mexp/ Mpeel,max
296
0.24 0.85 3.09 0.76 0.44 0.52 0.20 2.11

Flexural strengthening of reinforced concrete structures by plate bonding
2-53
Table 2.19. Significant percentiles of the experimental-to-theoretical ratios for laminate peeling-off.
Theoretical model Ratio # (Xexp/ Xu)1%
(Xexp/ Xu)5%
(Xexp/ Xu)25%
(Xexp/ Xu)50%
(Xexp/ Xu)75%
(Xexp/ Xu)95%
(Xexp/ Xu)99%
(1) (2) (3) (4) (5) (6) (7) (8) (9) (10) (11) Truss
models Colotti and Spadea
(2001) Vexp/Vu 277 0.18 0.57 1.12 1.50 2.44 3.79 4.74
Malek et al. (1998) 0.03 0.57 1.33 1.86 5.57 10.90 14.66
El-Mihilmy and Tedesco (2001) -0.20 0.19 0.75 1.13 5.80 12.50 17.24
Linear elastic
analysis + Kupfer and
Gerstle Oller (2005)
σI,max/σIu 207
0.05 0.40 0.91 1.26 5.12 10.68 14.60
Chaallal et al. (1998b) -0.03 0.09 0.26 0.39 0.74 1.24 1.60
Ziraba et al. (1994)
207-0.03 0.09 0.27 0.39 0.80 1.39 1.80
Linear elastic
analysis + Mohr
Coulomb Brosens (2001)
τmax/τu
148 -0.02 0.20 0.51 0.72 2.20 4.33 5.84 Oelhers (1992)
Interaction Vexp/Vu+ Mexp/Mu
266 1.05 3.77 7.63 10.31 16.95 26.50 33.24
Oelhers (1992) 286 0.13 3.09 7.28 10.19 16.81 26.33 33.06Jansze (1997) 288 -0.06 0.27 0.73 1.05 1.42 1.94 2.31 Ahmed et al.
(2001) 284 0.35 0.43 0.54 0.62 2.59 5.42 7.41
Shear capacity
based models
Ali et al. (2001)
Vexp/Vu
288 0.93 0.97 1.03 1.08 1.43 1.93 2.29 Raoof et al. (1997)
lower limit Mexp/
Mpeel,min 0.31 0.55 0.89 1.12 1.94 3.11 3.94 Concrete
tooth models Raoof et al. (1997)
upper limit Mexp/
Mpeel,max
2960.20 0.36 0.60 0.76 1.15 1.71 2.11
When a mean value of an experimental-to-predicted ratio is greater than 1.0, the associated theoretical model is conservative and underestimates the strength capacity of the externally reinforced section. The better performing model should have a mean value higher than 1.0 but close to it and a low coefficient of variation. According to Collins, a good assessment of safety will be provided when using the median value and the coefficient of variation of a low data set instead of the mean and coefficient of variation or the general sample. The following analysis will be focused on the mean, median and coefficient of variation in addition to the one and ninety-nine percentiles. The coefficient of variation of the low data set is always lower than the coefficient of variation. On the contrary, the coefficient of variation of the high data set is always higher than the coefficient of variation of the general data. Based on the results of Table 2.18, the statistically better performing model is the shear capacity based model of Ali et al. (2001) which shows a mean value of 1.16, a median value of 1.08, and a low coefficient of variation (0.34) compared to the remaining models. In terms of safety, when excluding those models with a median value lower than 1.0, Ali et al.’s has the maximum one percentile (Xexp/Xu)1% and the minimum ninety-nine percentile (Xexp/Xu)99%. The lower limit for the peeling bending moment given by the concrete tooth model of Raoof et al. (1997, 2000a, 2000b, 2001) is the next best perfoming model in terms of conservative bias and low scatter. It should be mentioned that concrete tooth models were exclusively derived for concrete cover separation. As concrete cover separation can occur at any location of the laminate, Raoof et al.’s model provides good predictions for a general peeling failure case. In the ranking of better statistical performing models, Raoof et al’s model is followed by the truss model of Colotti and

Chapter 2
2-54
Spadea (2001) which is more conservative with a mean value of 1.72 and a median of 1.50. The one and ninety-nine percentiles show that Raoof et al.’s model is safer than Colotti and Spadea’s formulation. However, Colotti and Spadea’s model seems more accurate because their coefficient of variation, 0.61, is slightly lower than the value of Raoof et al.’s model, 0.65. It should be noted that, although Colotti and Spadea developed a truss model considering different types of failure, such as the concrete classical failures described in §2.2.3, only the formulae related to a bond failure is assessed in this section. As shown in Table 2.18, the most conservative model is given by Oelhers (1992) with a mean value of 12.19 and a median of 10.19. When applying the Oelhers’ interaction equation to the database, ratios are greater than the acceptable upper bound value given by equation (2.30). This is explained by the conservativeness of equation (2.29) which defines the peeling shear force. Equation (2.29) provides values approximately ten times lower than the maximum experimental shear force. In contrast, when distinguishing the external reinforcement material, the maximum experimental shear force in steel plated beams is around 6 times the predicted value. In beams strengthened by CFRP laminates, this ratio becomes 14. If the shear capacity of the concrete is evaluated using the Spanish Concrete Code EHE (1999) instead of the Australian Code used by Oelhers, the mean ratio Vexp/Vu decreases to 2.40. In addition, this mean value decreases to 2.01 when applying the Smith and Teng (2001) approach combined with the Spanish Concrete Code. The prediction for the peeling bending moment, given by equation (2.31), is unsafe and provides values approximately ten times lower than the maximum experimental bending moment. Because of their conservativeness, both Oelhers’ models will not be analyzed in further sections. With reference to the shear capacity based models that were developed to prevent plate end shear failure, note that Jansze’s model (1997) shows a good statistical performance with a mean and a median close to 1.0. Similar results are obtained for Ahmed et al.’s model (2001), with a higher mean value of 1.44 and a higher median value of 1.18. It should not be forgotten that Ahmed et al.’s model is a readjustment of Jansze’s model for FRP laminates that has exclusively been developed for beams failing due to plate end shear failure, and both Table 2.18 and Table 2.19 analyze the peeling failure in general without distinguishing the initiation point. A large scatter is observed when applying the linear elastic models to all specimens that failed by peeling. All models except Chaallal et al.’s (1998b) and Ziraba et al.’s (1994) show a mean value higher than 1.0 and a large coefficient of variation. Both Chaallal et al.’s and Ziraba et al.’s models are unsafe, with a median value of 0.39. Regardless of the failure criterion, all linear elastic models show low values for the minimum and the one percentile (Xexp/Xu)1%. This fact can be explained by the model’s strong dependence on the distance from the support to the laminate end. The maximum interfacial shear and normal stresses at the laminate end, calculated by means of a linear elastic analysis, decrease as long as the laminate is extended up to the supports. Therefore, for short distances between the support and the plate end, the ratio between the experimental and predicted values (σI,max/σIu or τmax/τu, depending on the failure criteria) is much lower than in any other case, reducing the mean and the median. In addition, high values for the ninety-nine percentile (Xexp/Xu)99% are observed for those linear elastic models combined with the Kupfer and Gerstle criterion. The large scatter proves the unsuitability of linear elastic models to predict peeling failure in general.

Flexural strengthening of reinforced concrete structures by plate bonding
2-55
With respect to the Mohr-Coulomb criterion, a large percentage of tests (around 85%) should have failed by end peeling when applying Chaallal et al.’s and Ziraba et al.’s models to the database. When applying Brosens’ model (2001) this percentage decreases but remains significant; around 60% of tests should have failed by debonding at the laminate end. Since less than 70 specimens from the total number of analyzed tests were observed to fail this way (less than 60% of tests), the Mohr-Coulomb criterion does not seem to predict correctly the failure load in a general case of peeling. Figure 2.21 illustrates some percentiles for all models except for the linear elastic models which do not follow the distribution given by Collins (2001), as shown by the negative one percentile (Xexp/Xu)1%. As observed, Ali et al.’s model performs better because of the highest one percentile and the lowest ninety-nine percentile. All plotted models except the upper limit of Raoof et al. show a safe median value ((Xexp/Xu)50%) higher than 1.0.
0.0
1.0
2.0
3.0
4.0
5.0
Colotti andSpadea(2001)
Jansze(1997)
Ahmed etal. (2001)
Ali et al.(2001)
Raoof et al.lower limit
(1997)
Raoof et al.upper limit
(1997)
Theoretical model
Xexp
/Xu
(Xexp/Xu)99%(Xexp/Xu)95%(Xexp/Xu)75%(Xexp/Xu)50%(Xexp/Xu)25%(Xexp/Xu)5%(Xexp/Xu)1%
Figure 2.21. 1, 5, 25, 50, 75, 95 and 99 percentiles for experimental-to-theoretical ratio for peeling
failure when analyzing truss models, shear capacity based models and concrete tooth models.
Lastly, the trends observed in the previous analysis are confirmed by applying the “Demerit Points Classification” proposed by Collins (2001) for shear design methods. This classification is based on assigning a mark called “Demerit Point” to each range of (Xexp/Xu) values. The total demerit point score is calculated by adding the percentages associated to each range which have been previously multiplied by their associated Demerit Point. The lower the score, the better the model. As shown in Table 2.20 and represented in Figure 2.22, the shear capacity based model of Ali et al. gets the lowest score, followed by the concrete tooth model of Raoof et al. and then, by the truss model of Colotti and Spadea. By applying the Demerit Points Classification, the same conclusions as in the previous statistical analysis can be drawn in terms of model performance. As observed, the larger scatter of Raoof et al.’s model is punished by the Demerit Points Classification more harshly than the conservativeness of Colotti and Spadea’s model.

Chapter 2
2-56
The modification factor of Ahmed et al.’s model in relation to the original Jansze’s model provides a lower percentage of tests in the low safety range and a higher percentage in the extremely conservative range. Since both safety levels are punished by the same mark, the final score is very similar for both models. Models based on a linear elastic analysis at the laminate end show a large percentage of tests in both the extremely dangerous and the dangerous range. It should be distinguished the 62 percent of ratios for Chaallal et al.’s model and the 59 percent of ratios for Ziraba et al.’s model in the extremely dangerous range. This fact implies the highest scores for the linear elastic models.
Table 2.20. Demerit Points Classification for beams failing by laminate peeling-off.
Theoretical model Ratio <0.50 0.50- 0.65
0.65- 0.85
0.85- 1.30
1.30- 2.00
>2.00 Total DemeritPoints
Classification (*) E.D. D. L.S. A.S. C. E.C.
Demerit Point 10 5 2 0 1 2 (1) (2) (3) (4) (5) (6) (7) (8) (9) (10)
Truss models Colotti and Spadea (2001) Vexp/Vu 1.08 4.33 10.83 24.19 32.13 27.44 141
Malek et al. (1998) 4.35 1.93 2.42 22.22 21.26 47.83 175 El-Mihilmy and Tedesco (2001) 15.94 13.04 10.63 15.46 11.59 33.33 324
Linear elastic analysis + Kupfer and
Gerstle Oller (2005)
σI,max/σIu
8.70 7.73 6.76 27.54 16.43 32.85 221 Chaallal et al.
(1998b) 61.84 9.18 10.14 14.98 3.86 0.00 688
Ziraba et al. (1994) 59.42 11.59 7.73 15.94 3.86 1.45 674
Linear elastic analysis +
Mohr Coulomb Brosens (2001)
τmax/τu
28.38 17.57 10.14 17.57 9.46 16.89 435 Oelhers (1992)
Interaction Vexp/Vu+ Mexp/Mu
0.00 0.00 0.00 0.00 0.00 100.00 200
Oelhers (1992) 0.00 0.00 0.00 0.00 0.70 99.30 199 Jansze (1997) 17.36 1.04 10.42 42.36 24.65 4.17 233 Ahmed et al.
(2001) 16.55 1.41 2.46 36.97 24.65 17.96 238
Shear capacity based models
Ali et al. (2001)
Vexp/Vu
0.00 4.17 14.93 51.04 26.74 3.13 84 Raoof et al. (1997)
lower limit Mexp/
Mpeel,min 2.03 8.11 15.20 40.20 22.64 11.82 138 Concrete tooth
models Raoof et al. (1997) upper limit
Mexp/ Mpeel,max
16.89 17.23 25.34 32.09 5.07 3.38 318 (*) E.D.: Extremely dangerous; D.: Dangerous; L.S.: Low safety; A.S.: Appropiate safety; C.: Conservative; E.C.: Extremely conservative Figure 2.23 plots the percentage of the ratio (Xexp/Xu) for each category as given in Table 2.20. Both Oelhers models were removed from Figure 2.23 because of the highest percentages in the extremely conservative range. Likewise, the linear elastic models were not included in Figure 2.23 because the high percentage in the extremely dangerous category. By observing Figure 2.23, the upper limit of Raoof et al. becomes the unsafest plotted method because of the large percentage of ratios in the extremely dangerous and in the dangerous range. In addition, both Jansze’s and Ahmed’s models shows a large percentage of ratios in the extremely dangerous range accompanied by a surprising small percentage in the dangerous range. Therefore, both plate end shear failure models do not seem to fit with the statistical distribution around the median given by Collins.

Flexural strengthening of reinforced concrete structures by plate bonding
2-57
0
50
100
150
200
250
300
350
Colotti andSpadea(2001)
Oelhersinteraction
(1992)
Oelhers(1992)
Jansze(1997)
Ahmed etal. (2001)
Ali et al.(2001)
Raoof et al.lower limit
(1997)
Raoof et al.upper limit
(1997)
Dem
erit
poin
ts
Figure 2.22. Demerit Points for beams failing by laminate peeling-off.
0
10
20
30
40
50
60
Colotti andSpadea(2001)
Jansze(1997)
Ahmed et al.(2001)
Ali et al.(2001)
Raoof et al.lower limit
(1997)
Raoof et al.upper limit
(1997)
% X
test/X
u
<0.500.50-0.650.65-0.850.85-1.301.30-2.00>2.00
Figure 2.23. Percentage of Xexp/Xu ratios for beams that failed by peeling in the different ranges defined by Collins.
Chapter 2
2-58
During the statistical analysis, a special distinction has been made between the following aspects:
1) Strengthening material (steel plates, CFRP, GFRP, AFRP or hybrid laminates) 2) Fabrication procedure for composite laminates (wet lay-up or pultrusion) 3) Application of load prior to the bonding of the external reinforcement
The statistical results obtained when distinguishing between either the strengthening material, the fabrication procedure or the previously applied load are not presented in this chapter due to their extension. Nevertheless some general comments are listed below:
1) Results for peeling failure tests strengthened by CFRP laminates are similar to those obtained in Table 2.18. The reason is the large amount of specimens strengthened by bonding this type of composite laminates.
2) When distinguishing the fabrication procedure of FRP laminates, truss models, shear capacity based models and concrete tooth models give similar mean values for both wet lay-up and pultruded laminates. However, the coefficient of variation for pultruded laminates is lower than for wet lay-up laminates. In terms of demerit points, the trends in both wet lay-up and pultruded laminates are very similar to that observed for CFRP laminates in general.
3) The statistical results for both precracked and non-precracked beams are analogous to the values presented in Table 2.18 in terms of minimum, mean and maximum values. Precracked beams show a lower coefficient of variation compared to non-precracked beams due to the reduced number of precracked tests compiled. In terms of safety, Ali et al’s model is the better performing model for both precracked and non-precracked beams with the highest one percentile and the lowest ninety-nine percentile. Regarding the Demerit Points Classification, Ahmed et al.’s model gets the lowest score (56) for precracked beams, followed by Jansze’s model (59) and by Ali et al.’s model (62). For non-precracked beams, results are almost equal to those observed in Figure 2.22, basically because a greater portion of tested beams were not precracked prior to plate bonding.
Each theoretical model was developed as an attempt to predict a specific premature mode of failure. According to §2.2.3, the premature modes of failure can be classified depending on the initiation point. The following analysis evaluates the reliability of the existing models when predicting the different categories of peeling failure. Tests have been classified according to their observed peeling initiation point: 1) along the span (when failure is due to the effect of flexural or shear cracks), 2) or at the plate end (when failure is due to a high stress concentration at this location, or when failure is caused by a shear crack that initiates at the plate end). A distinction between the two causes of peeling at the laminate end has been made during the analysis. It should be noted that when the peeling initiation point is not clearly reported for a test of the database, it has been assumed to be located along the beam span. In addition, the following sections list some specific comments concerning the results obtained for each peeling failure when distinguishing the strengthening material, the fabrication procedure or the previously applied load.

Flexural strengthening of reinforced concrete structures by plate bonding
2-59
2.4.1. Models developed to prevent peeling failure initiated near cracks This section analyses the truss models, the shear capacity based models and the concrete tooth models, which were developed to prevent peeling failure due to the effect of cracks, by comparing their predictions for all types of peeling failures observed. Truss model of Colotti and Spadea (2001) When applying the truss model of Colotti and Spadea, the statistical results show similar trends regardless of the type of peeling failure. From the total number of tests analyzed (277), 207 specimens failed due to the effect of flexural or shear cracks, 54 specimens failed due to a high stress concentration at the plate end, and finally, 16 specimens showed plate end shear failure. As observed in Table 2.21, the mean and median of the ratio between the maximum shear force at failure and the theoretical prediction for peeling initiated near cracks is similar than for peeling in general. The mean value slightly increases for tests that failed due to high stresses at the laminate end and slightly decreases for tests that failed due to a shear crack at the plate end. The opposite trend is observed for the median. Note that the coefficient of variation for those tests that failed by end peeling is almost equal to that obtained for the total number of peeling tests, despite the shorter number of tests that failed at the plate end. The higher safety levels are obtained for plate end shear failure test, with the closest value to 1.0 of the one and ninety-nine percentiles.
Table 2.21. Experimental-to-theoretical ratios for Colotti and Spadea’s model.
Truss model Colotti and Spadea (2001)
Ratio # Min Mean Max Med Std dev
COV (Xexp/ Xu)1%
(Xexp/ Xu)99%
(1) (2) (3) (4) (5) (6) (7) (8) (9) (10) (11) Total peeling failure tests 277 0.45 1.72 6.75 1.50 1.04 0.61 0.18 4.74 Peeling tests due to cracks 207 0.45 1.70 6.75 1.48 1.09 0.64 0.14 4.88 End peeling failure tests 54 0.55 1.81 5.33 1.51 1.00 0.55 0.28 4.67
Plate end shear failure tests
Vexp/Vu
16 1.09 1.64 2.28 1.72 0.38 0.23 0.67 2.39 Figure 2.24 shows the ratio Vexp/Vu for all tests that failed by laminate peeling-off distinguishing the strengthening material. In most cases, steel plated beams show a ratio higher than 1.0. After classifying the ratios into the ranges associated to the different safety levels of the Demerit Points Classification of Collins, a small percentage of specimens belongs to those ranges with a dangerous level of safety, regardless of the peeling failure mode (see Table 2.22). Around thirteen percent of the specimens that failed due to the effect of cracks are in a low safety range. A high percentage of tests is observed in the extremely conservative range when analyzing those specimens that showed a debonding failure at the laminate end. Predictions for tests that failed due to plate end shear failure are at least conservative. An excess of conservativeness is also punished by Collins’ classification as shown by the score got by plate end shear failure tests. The total number demerit points associated to each type of peeling failure is similar to the score for peeling in general (141) with the exception of plate end shear failure where the score is 94. Note that for peeling in general, the total score decreases to 110 when studying steel plated beams alone.

Chapter 2
2-60
0.00
1.00
2.00
3.00
4.00
5.00
6.00
7.00
8.00
0 50 100 150 200 250 300
Test #
Vexp
/Vu
Colotti and Spadea (2001) Steel
Colotti and Spadea (2001) CFRP
Figure 2.24. Experimental-to-theoretical ratios when applying Colotti and Spadea’s model.
Table 2.22. Demerit Points Classification for Colotti and Spadea’s model.
Truss model Colotti and Spadea (2001)
Ratio <0.50 0.50- 0.65
0.65- 0.85
0.85- 1.30
1.30- 2.00
>2.00 Total DemeritPoints
Classification (*) E.D. D. L.S. A.S. C. E.C.
Demerit Point 10 5 2 0 1 2 Total peeling failure tests 1.08 4.33 10.83 24.19 32.13 27.44 141 Peeling tests due to cracks 1.45 4.83 13.04 22.22 32.85 25.60 149 End peeling failure tests 0.00 3.70 5.56 31.48 22.22 37.04 126
Plate end shear failure tests
Vexp/Vu
0.00 0.00 0.00 25.00 56.25 18.75 94 (*) E.D.: Extremely dangerous; D.: Dangerous; L.S.: Low safety; A.S.: Appropiate safety; C.: Conservative; E.C.: Extremely conservative Shear capacity based model of Ali et al. (2001) Since Oelhers’ model (1992) is very conservative and both Jansze’s (1997) and Ahmed et al.’s (2001) models were developed to prevent plate end shear failure, only Ali et al.’s model is studied in this section. Table 2.23 shows some statistical results when studying the different types of peeling failure. Similar to the truss based model of Colotti and Spadea (2001), the mean, the median and the coefficient of variation are almost equal for all peeling failure modes. Both mean and median are higher but close to 1.0. When comparing Table 2.21 to Table 2.23, Ali et al.’s model is less conservative than Colotti and Spadea’s model, and shows a higher level of safety for all types of peeling failure, as observed by a higher one percentile and a lower ninety-nine percentile.

Flexural strengthening of reinforced concrete structures by plate bonding
2-61
Table 2.23. Experimental-to-theoretical ratios for Ali et al.’s model.
Shear capacity based model Ali et al. (2001)
Ratio # Min Mean Max Med Std dev
COV (Xexp/ Xu)1%
(Xexp/ Xu)99%
(1) (2) (3) (4) (5) (6) (7) (8) (9) (10) (11) Total peeling failure tests 288 0.53 1.16 2.83 1.08 0.40 0.34 0.93 2.29 Peeling tests due to cracks 201 0.57 1.21 2.83 1.10 0.41 0.34 0.96 2.39 End peeling failure tests 66 0.53 1.04 2.18 1.04 0.36 0.34 0.83 1.98
Plate end shear failure tests
Vexp/Vu
21 0.64 1.10 1.58 1.08 0.25 0.23 0.97 1.74 By applying the Demerit Points Classification of Collins, the current model gets a score of 84 for all tests that failed by peeling. This score decreases to 75 when failure is initiated near flexural or shear cracks. As observed in Table 2.24, neither of the tests fall in the extremely dangerous range. For peeling failure initiated near cracks, the percentage of ratios in the low safety range is only 1.5. In addition, less than 4.0 percent of tests belong to the extremely conservative range regardless of the peeling failure mode.
Table 2.24. Demerit Points Classification for Ali et al.’s model.
Shear capacity based model Ali et al. (2001)
Ratio <0.50 0.50- 0.65
0.65- 0.85
0.85- 1.30
1.30- 2.00
>2.00 Total DemeritPoints
Classification (*) E.D. D. L.S. A.S. C. E.C.
Demerit Point 10 5 2 0 1 2 Total peeling failure tests 0.00 4.17 14.93 51.04 26.74 3.13 84 Peeling tests due to cracks 0.00 1.49 14.43 49.75 30.35 3.98 75 End peeling failure tests 0.00 12.12 16.67 56.06 13.64 1.52 111
Plate end shear failure tests
Vexp/Vu
0.00 3.70 11.11 59.26 25.93 0.00 67 (*) E.D.: Extremely dangerous; D.: Dangerous; L.S.: Low safety; A.S.: Appropiate safety; C.: Conservative; E.C.: Extremely conservative
0.00
0.50
1.00
1.50
2.00
2.50
3.00
0 50 100 150 200 250 300
Test #
Vexp
/Vu
Ali et al. (2001) SteelAli et al. (2001) FRP
Figure 2.25. Experimental-to-theoretical ratios according to Ali et al.’s model.
As shown in Figure 2.25, Ali et al.’s model show a better performance for FRP laminates than for steel plates. By contrast, Ali et al.’s model was derived exclusively for steel plated beams. When analyzing steel plated beams alone, Ali et al.’s model

Chapter 2
2-62
gives a mean and a median value of 0.85 which is the limit between appropriate and low safety according to Collins’ classification. Concrete tooth model of Raoof et al. (1997, 2000a, 2000b, 2001) The lower limit of Raoof et al.’s model is studied in Table 2.25. Tests where peeling failure was caused by the effect of flexural or shear cracks show a statistical performance similar to peeling failure tests in general. For tests where a laminate end debonding was reported, not only the median is slightly higher, 1.31 against 1.12 for peeling failure in general, but also the mean, 1.43 against 1.33 for peeling in general. For plate end shear failure tests, the mean is slightly lower than the values for the total peeling failure tests. In addition, both the one and ninety-nine percentiles are much closer to 1.0. This latter sample seems more homogeneous, as shown by the coefficient of variation of 0.16. When comparing Table 2.23 and Table 2.25, the statistical results do not follow the same trends. For Raoof et al.’s model, the mean values are lower for peeling initiated near cracks than for peeling in general and are higher for end peeling than for peeling in general. A better performance is obtained for end peeling failure tests than for peeling due to the effect of cracks. In addition, as observed by the calculated percentiles, Raoof et al.’s model shows better levels of safety than Colotti and Spadea’s model regardless of the peeling failure mode.
Table 2.25. Experimental-to-theoretical ratios for Raoof et al.’s model.
Concrete tooth model Raoof et al. (1997, 2000a, 2000b, 2001) lower limit
Ratio # Min Mean Max Med Std dev
COV (Xexp/ Xu)1%
(Xexp/ Xu)99%
(1) (2) (3) (4) (5) (6) (7) (8) (9) (10) (11) Total peeling failure tests 296 0.36 1.33 6.14 1.12 0.87 0.65 0.31 3.94 Peeling tests due to cracks 207 0.36 1.31 6.14 1.07 0.96 0.73 0.31 4.18 End peeling failure tests 68 0.41 1.43 4.11 1.31 0.72 0.50 0.21 3.41
Plate end shear failure tests
Mexp/ Mpeel,min
21 0.98 1.25 1.84 1.22 0.20 0.16 0.89 1.81 According to the Demerit Points Classification given by Table 2.26, Raoof et al.’s model scores 138 demerit points for peeling failure in general. This score increases to 145 when studying peeling failure caused by cracks. In addition, it diminishes to 37 for debonding generated by a shear crack at the laminate end. This fact is surprising since Raoof et al.’s model was developed to prevent a premature failure initiated near cracks. As observed, the total amount of demerit points of Raoof et al.’s model is higher than Ali et al.’s model, and in some cases, than Colotti and Spadea’s model. When studying solely steel plated beams that failed by peeling near cracks, Raoof et al.’s model gets a similar demerit score (124) than Ali et al.’s (128). In this case, Raoof et al’s model shows a small percentage (less than 11%) of beams with a ratio lower than 0.85 (low safety or dangerous situations) compared to Ali et al., where the percentage is 20%. Since the degree of conservativeness of Raoof et al.’s model is punished in the same amount as low safety, both models get finally similar demerit scores. Results for CFRP laminates are not commented here because of their similarity to the general results of Table 2.26.

Flexural strengthening of reinforced concrete structures by plate bonding
2-63
Table 2.26. Demerit Points Classification for Raoof et al.’s model.
Concrete tooth model Raoof et al. (1997, 2000a, 2000b,
2001) lower limit
Ratio <0.50 0.50- 0.65
0.65- 0.85
0.85- 1.30
1.30- 2.00
>2.00 Total DemeritPoints
Classification (*) E.D. D. L.S. A.S. C. E.C. Demerit Point 10 5 2 0 1 2
Total peeling failure tests 2.03 8.11 15.20 40.20 22.64 11.82 138 Peeling tests due to cracks 2.42 9.18 17.87 43.00 15.94 11.59 145 End peeling failure tests 1.47 7.35 11.76 27.94 35.29 16.18 143
Plate end shear failure tests
Mexp/ Mpeel,min
0.00 0.00 0.00 62.96 37.04 0.00 37 (*) E.D.: Extremely dangerous; D.: Dangerous; L.S.:Low safety; A.S.: Appropiate safety; C.: Conservative; E.C.: Extremely conservative Finally, Figure 2.26 shows the ratio Mexp/Mu for all tests that failed by peeling when distinguishing the material reinforcement. Both lower and upper limit are plotted. Obviously, the upper limit ratio is less safe than the lower limit ratio. Although Raoof et al.’s model performs well for both steel and FRP laminates, it seems more conservative for steel plated beams with a mean ratio of 1.66, against the 1.29 ratio for FRP laminates. In addition, it should be mentioned that if steel plates are studied alone, Raoof et al. will become the better performing model with a mean and a median value higher than 1.0 and the lowest coefficient of variation.
0.00
1.00
2.00
3.00
4.00
5.00
0 50 100 150 200 250 300
Test #
Mex
p/Mpe
el
Raoof et al. (1997) lower limit Steel
Raoof et al. (1997) upper limit Steel
Raoof et al. (1997) lower limit CFRP
Raoof et al. (1997) upper limit CFRP
Figure 2.26. Experimental-to-theoretical ratios for peeling failure tests when applying concrete
tooth models.
Raoof et al. (2000a) adapted their formulation to precracked beams by modifying the crack spacing. Table 2.27 applies this re-adaptation to precracked beams. In addition, it compares the modified formula to the original model of Raoof et al. (1997). Note that all predictions of this re-adaptation are higher than the values initially calculated by the model developed for uncracked sections. According to this re-adaptation, the mean and median are lower than 1.0 regardless of the peeling failure mode. The scatter, which is given by the coefficient of variation, decreases for the modified formulae of precracked

Chapter 2
2-64
beams. Due to high percentages under low safety ranges, the total demerit points of the re-adaptation for precracked beams is always higher than the score of the original model of Raoof et al. (see Table 2.28). Therefore, the re-adaptation for precracked beams do not perform as expected.
Table 2.27. Experimental-to-theoretical ratios in precracked beams for both the original and the modified Raoof et al.’s model.
Concrete tooth model Raoof et al. (1997, 2000a)
lower limit
(*) Ratio # Min Mean Max Med Std dev
COV (Xexp/ Xu)1%%
(Xexp/Xu)99%
(1) (2) (3) (4) (4) (5) (6) (7) (8) (9) (10) (11) O 0.36 1.07 4.25 1.03 0.79 0.74 0.01 3.39 Total peeling failure tests M 32 0.33 0.71 1.60 0.75 0.29 0.41 0.06 1.41 O 0.36 1.05 4.25 0.98 0.89 0.84 0.08 3.99 Peeling tests due to cracks M 25 0.35 0.68 1.60 0.71 0.30 0.44 0.06 1.42 O 0.41 0.41 0.41 - - - - - End peeling failure tests M 1 0.33 0.33 0.33 - - - - - O 1.13 1.27 1.36 1.28 0.09 0.07 1.06 1.42 Plate end shear failure tests M
Mexp/ Mpeel,min
6 0.83 0.92 1.13 0.89 0.11 0.12 0.78 1.21 (*) O: Original Raoof et al.’s model presented in §2.3. M: Re-adaptation for precracked beams (2000a)
Table 2.28. Demerit Points Classification for both the original and modified Raoof et al.’s model.
Concrete tooth model Raoof et al. (1997, 2000a)
lower limit
(**) Ratio <0.50 0.50- 0.65
0.65- 0.85
0.85- 1.30
1.30- 2.00
>2.00 Total Demerit Points
Classification (*) E.D. D. L.S. A.S. C. E.C.
Demerit Point 10 5 2 0 1 2 O 12.50 15.63 9.38 50.00 6.25 6.25 241 Total peeling failure tests M 31.25 6.25 40.63 18.75 3.13 0.00 428 O 12.00 20.00 12.00 48.00 0.00 8.00 260 Peeling tests due to cracks M 36.00 8.00 44.00 8.00 4.00 0.00 492 O 100.00 0.00 0.00 0.00 0.00 0.00 1000 End peeling failure tests M 100.00 0.00 0.00 0.00 0.00 0.00 1000 O 0.00 0.00 0.00 66.67 33.33 0.00 33.33 Plate end shear failure tests M
Mexp/ Mpeel,min
0.00 0.00 33.33 66.67 0.00 0.00 66.67 (*) E.D.: Extremely dangerous; D.: Dangerous; L.S.: Low safety; A.S.: Appropiate safety; C.: Conservative; E.C.: Extremely conservative (**) O: Original Raoof et al.’s model presented in §2.3. M: Re-adaptation for precracked beams (2000a)
2.4.2. Models developed to prevent plate end shear failure Shear capacity based models of Jansze (1997) and Ahmed et al. (2001) This section analyzes the shear capacity based models of Jansze and Ahmed et al. Both models were developed to prevent a premature peeling failure caused by the effect of a shear crack at the laminate end. As in the previous cases, both models are analyzed in this section by considering the peeling initiation point. Table 2.29 summarizes the statistical analysis for Jansze’s model. Results are similar for peeling failure in general and peeling failure due to cracks. Obviously, the performance of this model improves for those tests that failed by plate end shear failure. This is shown by a significantly higher minimum value (0.77 against 0.16), a more
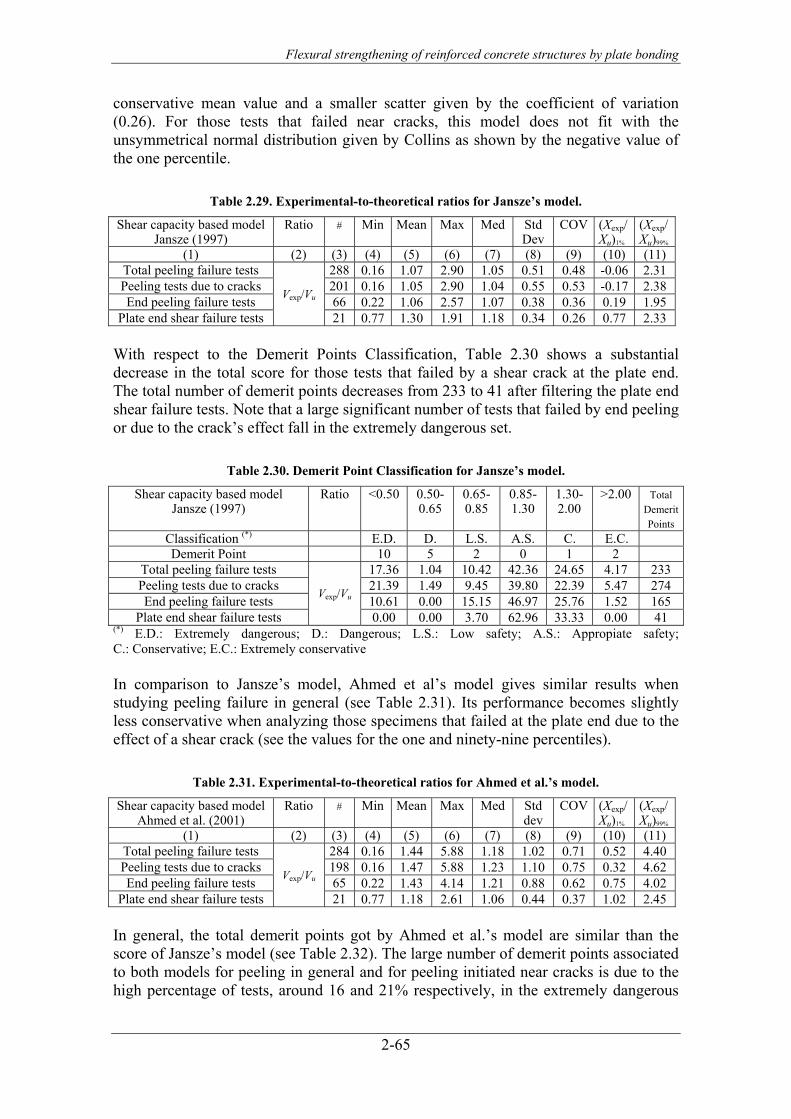
Flexural strengthening of reinforced concrete structures by plate bonding
2-65
conservative mean value and a smaller scatter given by the coefficient of variation (0.26). For those tests that failed near cracks, this model does not fit with the unsymmetrical normal distribution given by Collins as shown by the negative value of the one percentile.
Table 2.29. Experimental-to-theoretical ratios for Jansze’s model.
Shear capacity based model Jansze (1997)
Ratio # Min Mean Max Med Std Dev
COV (Xexp/ Xu)1%
(Xexp/ Xu)99%
(1) (2) (3) (4) (5) (6) (7) (8) (9) (10) (11) Total peeling failure tests 288 0.16 1.07 2.90 1.05 0.51 0.48 -0.06 2.31 Peeling tests due to cracks 201 0.16 1.05 2.90 1.04 0.55 0.53 -0.17 2.38 End peeling failure tests 66 0.22 1.06 2.57 1.07 0.38 0.36 0.19 1.95
Plate end shear failure tests
Vexp/Vu
21 0.77 1.30 1.91 1.18 0.34 0.26 0.77 2.33 With respect to the Demerit Points Classification, Table 2.30 shows a substantial decrease in the total score for those tests that failed by a shear crack at the plate end. The total number of demerit points decreases from 233 to 41 after filtering the plate end shear failure tests. Note that a large significant number of tests that failed by end peeling or due to the crack’s effect fall in the extremely dangerous set.
Table 2.30. Demerit Point Classification for Jansze’s model.
Shear capacity based model Jansze (1997)
Ratio <0.50 0.50- 0.65
0.65- 0.85
0.85- 1.30
1.30- 2.00
>2.00 Total DemeritPoints
Classification (*) E.D. D. L.S. A.S. C. E.C.
Demerit Point 10 5 2 0 1 2 Total peeling failure tests 17.36 1.04 10.42 42.36 24.65 4.17 233 Peeling tests due to cracks 21.39 1.49 9.45 39.80 22.39 5.47 274 End peeling failure tests 10.61 0.00 15.15 46.97 25.76 1.52 165
Plate end shear failure tests
Vexp/Vu
0.00 0.00 3.70 62.96 33.33 0.00 41 (*) E.D.: Extremely dangerous; D.: Dangerous; L.S.: Low safety; A.S.: Appropiate safety; C.: Conservative; E.C.: Extremely conservative In comparison to Jansze’s model, Ahmed et al’s model gives similar results when studying peeling failure in general (see Table 2.31). Its performance becomes slightly less conservative when analyzing those specimens that failed at the plate end due to the effect of a shear crack (see the values for the one and ninety-nine percentiles).
Table 2.31. Experimental-to-theoretical ratios for Ahmed et al.’s model.
Shear capacity based model Ahmed et al. (2001)
Ratio # Min Mean Max Med Std dev
COV (Xexp/ Xu)1%
(Xexp/ Xu)99%
(1) (2) (3) (4) (5) (6) (7) (8) (9) (10) (11) Total peeling failure tests 284 0.16 1.44 5.88 1.18 1.02 0.71 0.52 4.40 Peeling tests due to cracks 198 0.16 1.47 5.88 1.23 1.10 0.75 0.32 4.62 End peeling failure tests 65 0.22 1.43 4.14 1.21 0.88 0.62 0.75 4.02
Plate end shear failure tests
Vexp/Vu
21 0.77 1.18 2.61 1.06 0.44 0.37 1.02 2.45 In general, the total demerit points got by Ahmed et al.’s model are similar than the score of Jansze’s model (see Table 2.32). The large number of demerit points associated to both models for peeling in general and for peeling initiated near cracks is due to the high percentage of tests, around 16 and 21% respectively, in the extremely dangerous

Chapter 2
2-66
safety level. For plate end shear failure, Ahmed et al.’s model gives a large number of tests in an appropriate safety level (81% compared to the 63% of Jansze’s model).
Table 2.32. Demerit Points Classification for Ahmed et al.’s model.
Shear capacity based model Ahmed et al. (2001)
Ratio <0.50 0.50- 0.65
0.65- 0.85
0.85- 1.30
1.30- 2.00
>2.00 Total DemeritPoints
Classification (*) E.D. D. L.S. A.S. C. E.C. Demerit Point 10 5 2 0 1 2
Total peeling failure tests 16.55 1.41 2.46 36.97 24.65 17.96 238 Peeling tests due to cracks 21.21 1.01 1.01 32.32 25.25 19.19 283 End peeling failure tests 7.69 3.08 6.15 36.92 29.23 16.92 168
Plate end shear failure tests
Vexp/Vu
0.00 0.00 4.76 80.95 4.76 9.52 33 (*) E.D.: Extremely dangerous; D.: Dangerous; L.S.: Low safety; A.S.: Appropiate safety; C.: Conservative; E.C.: Extremely conservative For plate end shear failure tests, and when analyzing steel plated beams, Ahmed et al.’s model coincides with Jansze’s model (see Figure 2.27). Since Ahmed et al. modified Jansze’s model to make it suitable for FRP laminates, it gives better predictions for this type of laminates in most cases. However, this observation should be considered as an eventual comment due to the following arguments. When analyzing the results for the whole database, it has been observed the strong influence of some empirical parameters that play a significant role in the calculation of the modification factor (with respect to Jansze’s formulation) that takes into account the replacement of steel plates by FRP laminates. These empirical parameters were defined by experimental calibration using the experimental program performed by Ahmed et al. (2001). As explained by Brosens (2001), it is not clear that the modified model will be valid for other configurations that the used for calibration. In addition, when analyzing the shear stress modification factor by means of the database, its influence on the predicted shear force is only significant for Ahmed et al.’s tests where the mortar width is significantly higher than the laminate width. Furthermore, one of the empirical parameters of the modification factor is a reference shear strength which surprisingly cancels the influence of the shear reinforcement. Due to these uncertainties, a detailed review of Ahmed et al.’s model seems necessary.
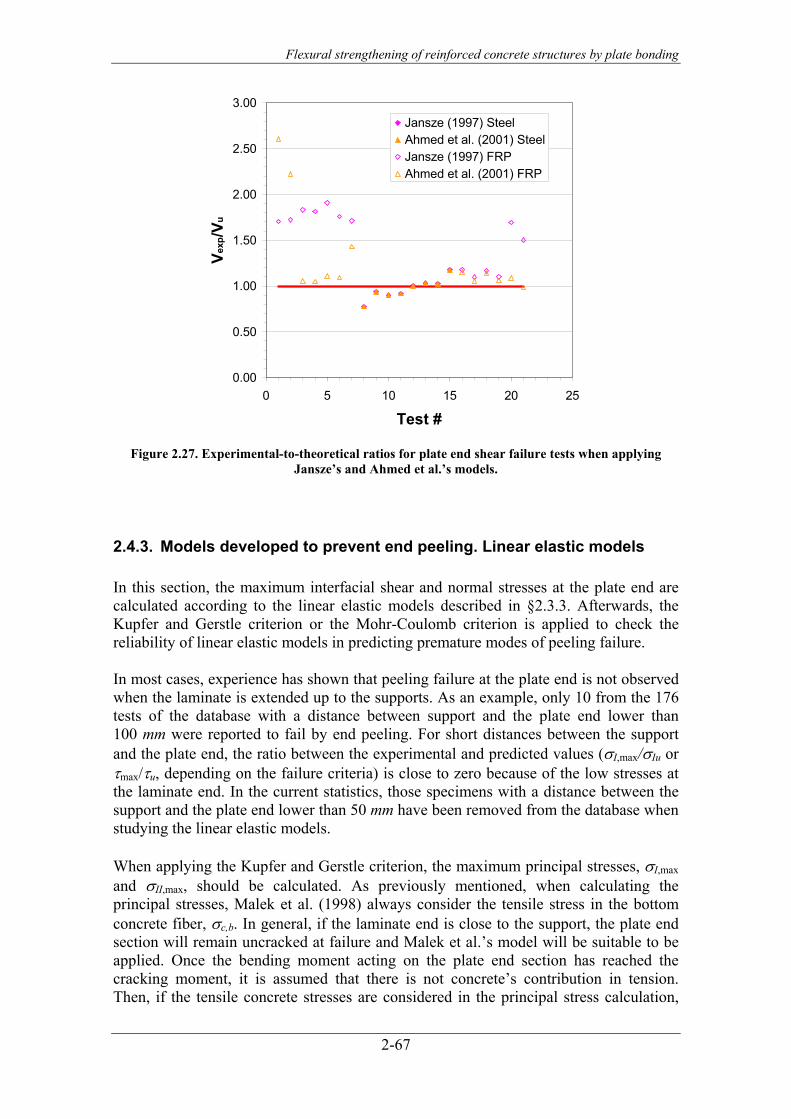
Flexural strengthening of reinforced concrete structures by plate bonding
2-67
0.00
0.50
1.00
1.50
2.00
2.50
3.00
0 5 10 15 20 25
Test #
Vexp
/Vu
Jansze (1997) SteelAhmed et al. (2001) SteelJansze (1997) FRPAhmed et al. (2001) FRP
Figure 2.27. Experimental-to-theoretical ratios for plate end shear failure tests when applying
Jansze’s and Ahmed et al.’s models.
2.4.3. Models developed to prevent end peeling. Linear elastic models In this section, the maximum interfacial shear and normal stresses at the plate end are calculated according to the linear elastic models described in §2.3.3. Afterwards, the Kupfer and Gerstle criterion or the Mohr-Coulomb criterion is applied to check the reliability of linear elastic models in predicting premature modes of peeling failure. In most cases, experience has shown that peeling failure at the plate end is not observed when the laminate is extended up to the supports. As an example, only 10 from the 176 tests of the database with a distance between support and the plate end lower than 100 mm were reported to fail by end peeling. For short distances between the support and the plate end, the ratio between the experimental and predicted values (σI,max/σIu or τmax/τu, depending on the failure criteria) is close to zero because of the low stresses at the laminate end. In the current statistics, those specimens with a distance between the support and the plate end lower than 50 mm have been removed from the database when studying the linear elastic models. When applying the Kupfer and Gerstle criterion, the maximum principal stresses, σI,max and σII,max, should be calculated. As previously mentioned, when calculating the principal stresses, Malek et al. (1998) always consider the tensile stress in the bottom concrete fiber, σc,b. In general, if the laminate end is close to the support, the plate end section will remain uncracked at failure and Malek et al.’s model will be suitable to be applied. Once the bending moment acting on the plate end section has reached the cracking moment, it is assumed that there is not concrete’s contribution in tension. Then, if the tensile concrete stresses are considered in the principal stress calculation,

Chapter 2
2-68
the ratio σI,max/σIu will be higher than what it is expected to be, and the model will be more conservative than El-Mihilmy and Tedesco’s model (2001), which always neglects the concrete contribution in tension. An intermediate solution considered in this dissertation (Oller, 2005) will consist of taking into account the concrete’s contribution only if the plate end remains uncracked. The additional bending moment to be considered in the calculation of the longitudinal tensile stress at the cut-off point, according to Saadatmanesh and Malek, has been neglected in this analysis since its influence is conservative and implies a higher maximum principal stress value. A linear elastic analysis of the interface combined with the failure criterion of Kupfer and Gerstle gives mean and median ratios σI,max/σIu higher than 1.0 as shown in Table 2.33, Table 2.35 and Table 2.37. The conservativeness of Malek et al.’s model is observed by the mean value for the ratio σI,max/σIu which is higher than 2.33 for all peeling failure modes (see Table 2.33). The mean value is almost twice the median because of the large amount of ratios higher than 2.0. (see Table 2.34). Note that the consideration of a bending moment increment in the calculation of the longitudinal tensile stress would have led to even more conservative predictions. The high coefficient of variation observed for tests where failure initiates near cracks gives an idea of the sample’s heterogeneity. This heterogeneity confirms the unsuitability of Malek et al.’s model to predict peeling failure near cracks or peeling failure in general. When applying Malek et al.’s model to end peeling tests, the coefficient of variation slightly decreases and the remaining parameters show a noticeable variation, for instance, the median significantly increases up to 4.12. In this case, the 75 percentile is higher than 5.0, in other words, more than 75% of the specimens reached experimental values which are five times the predicted value. This model does not fit with the statistical distribution of Collins as shown by the negative values of the one percentile. Without any reasonable explanation, Malek et al.’s model performs better for plate end shear failure tests.
Table 2.33. Experimental-to-theoretical ratios for Malek et al.’s model.
Linear elastic model Malek et al. (1998)
Ratio # Min Mean Max Med Std dev
COV (Xexp/ Xu)1%
(Xexp/ Xu)99%
(1) (2) (3) (4) (5) (6) (7) (8) (9) (10) (11) Total peeling failure tests 207 0.19 3.37 22.24 1.86 3.66 1.09 0.03 14.66Peeling tests due to cracks 137 0.19 2.33 11.16 1.42 2.26 0.97 0.20 9.43 End peeling failure tests 53 1.13 6.30 22.24 4.12 5.26 0.83 -0.24 22.04
Plate end shear failure tests
σImax/σIu
17 0.86 2.40 5.08 2.23 0.96 0.40 0.60 4.90
Table 2.34. Demerit Points Classification for Malek et al.’s model.
Linear elastic model Malek et al. (1998)
Ratio <0.50 0.50- 0.65
0.65- 0.85
0.85- 1.30
1.30- 2.00
>2.00 Total DemeritPoints
Classification (*) E.D. D. L.S. A.S. C. E.C. Demerit Point 10 5 2 0 1 2
Total peeling failure tests 4.35 1.93 2.42 22.22 21.26 47.83 175 Peeling tests due to cracks 6.57 2.92 3.65 31.39 23.36 32.12 175 End peeling failure tests 0.00 0.00 0.00 1.89 16.98 81.13 179
Plate end shear failure tests
σImax/σIu
0.00 0.00 0.00 8.70 30.43 60.87 152 (*) E.D.: Extremely dangerous; D.: Dangerous; L.S.: Low safety; A.S.: Appropiate safety; C.: Conservative; E.C.: Extremely conservative

Flexural strengthening of reinforced concrete structures by plate bonding
2-69
As shown by the Demerit Points Classification of Table 2.34, the better score is for plate end shear failure tests. In this case, all predictions are at least in an appropriate safety range. The model is more conservative for plate end peeling as shown by the significant percentage of specimens (81%) in the extremely conservative range. El-Mihilmy and Tedesco’s model gives better statistical results in terms of mean and median but with a large scatter even for those tests that failed at the laminate end. This large scatter is unacceptable. Furthermore, the sample is far from following an unsymmetrical normal distribution because of the negative values obtained for the one percentile category. This is also confirmed by the percentages associated to the different ranges of the Demerit Points Classification. As shown in Table 2.36, a large percentage of tests is in both the extremely dangerous and extremely conservative ranges for peeling failure in general and for peeling initiated near cracks. This fact is punished by the total number of demerit points. Since the 70 tests that failed at the laminate end perform statistically better than the remaining peeling failure tests, the total score for peeling failure in general is lower than the score for peeling initiated near cracks. For those tests that failed by end peeling, El-Mihilmy and Tedesco’s model is less conservative than Malek et al.’s model as observed through the comparison of the percentages associated to the different safety levels. As previously mentioned, for Malek et al.’s model, 81% of tests that failed by end peeling are in the extremely conservative range and the remaining tests are at least in an appropriate safety level. When analyzing the same group of tests by using El-Mihilmy and Tedesco’s model, the extremely conservative range diminishes in favour of the low safety ranges with a total percentage of 9.4%
Table 2.35. Experimental-to-theoretical ratios for El-Mihilmy and Tedesco’s model.
Linear elastic model El-Mihilmy and Tedesco
(2001)
Ratio # Min Mean Max Med Std Dev
COV (Xexp/ Xu)1%
(Xexp/ Xu)99%
(1) (2) (3) (4) (5) (6) (7) (8) (9) (10) (11) Total peeling failure tests 207 0.10 2.74 32.68 1.13 4.63 1.69 -0.20 17.24Peeling tests due to cracks 137 0.10 1.66 12.14 0.76 2.32 1.39 0.02 8.92 End peeling failure tests 53 0.43 5.82 32.68 2.95 7.59 1.30 -2.17 23.19
Plate end shear failure tests
σImax/σIu
17 0.43 1.68 4.47 1.40 0.94 0.56 0.03 3.93
Table 2.36. Demerit Points Classification for El-Mihilmy and Tedesco’s model.
Linear elastic model El-Mihilmy and Tedesco (2001)
Ratio <0.50 0.50- 0.65
0.65- 0.85
0.85- 1.30
1.30- 2.00
>2.00 Total DemeritPoints
Classification (*) E.D. D. L.S. A.S. C. E.C.
Demerit Point 10 5 2 0 1 2 Total peeling failure tests 15.94 13.04 10.63 15.46 11.59 33.33 324 Peeling tests due to cracks 22.63 18.25 13.87 16.79 6.57 21.90 396 End peeling failure tests 1.89 3.77 3.77 13.21 13.21 64.15 187
Plate end shear failure tests
σImax/σIu
4.35 0.00 8.70 26.09 34.78 26.09 148 (*) E.D.: Extremely dangerous; D.: Dangerous; L.S.: Low safety; A.S.: Appropiate safety; C.: Conservative; E.C.: Extremely conservative Since a linear elastic analysis is unsuitable when cracks have already opened at the plate end, an additional statistical analysis has been performed after calculating the principal stresses by only assuming the tensile concrete’s contribution in case the plate end remains uncracked. As shown in Table 2.37, the results obtained fall in the range of

Chapter 2
2-70
ratios obtained by applying both Malek et al.’s and El-Mihilmy and Tedesco’s models. Special attention should be focused on the high coefficient of variation. Except for those tests that showed a plate end shear failure, the score from the Demerit Points Classification of Collins (see Table 2.38) brands the model proposed by the author as worse than the conservative model of Malek et al. The percentages of tests associated to the different safety levels are similar to those obtained for El-Mihilmy and Tedesco’s model. However, in this case, the percentages associated to dangerous safety levels decrease specially for peeling failure in general and peeling initiated near cracks. In addition, there is a significant increase in the amount of tests associated to an appropriate safety level compared to the results obtained for El-Mihilmy and Tedesco’s model.
Table 2.37. Experimental-to-theoretical ratios for Oller’s model.
Linear elastic model Oller (2005)
Ratio # Min Mean Max Med Std dev
COV (Xexp/ Xu)1%
(Xexp/ Xu)99%
(1) (2) (3) (4) (5) (6) (7) (8) (9) (10) (11) Total peeling failure tests 207 0.19 2.66 25.90 1.26 3.83 1.44 0.05 14.60Peeling tests due to cracks 137 0.19 1.78 11.11 1.08 2.11 1.18 0.04 8.27 End peeling failure tests 53 0.43 5.20 25.90 2.88 6.13 1.18 -0.55 24.22
Plate end shear failure tests
σImax/σIu
17 0.86 1.75 4.31 1.52 0.87 0.50 0.61 4.33
Table 2.38. Demerit Points Classification for Oller’s model.
Linear elastic model Oller (2005)
Ratio <0.50 0.50- 0.65
0.65- 0.85
0.85- 1.30
1.30- 2.00
>2.00 Total DemeritPoints
Classification (*) E.D. D. L.S. A.S. C. E.C.
Demerit Point 10 5 2 0 1 2 Total peeling failure tests 8.70 7.73 6.76 27.54 16.43 32.85 221 Peeling tests due to cracks 12.41 10.22 9.49 34.31 12.41 21.17 249 End peeling failure tests 1.89 3.77 1.89 13.21 15.09 64.15 185
Plate end shear failure tests
σImax/σIu
0.00 0.00 0.00 30.43 43.48 26.09 96 (*) E.D.: Extremely dangerous; D.: Dangerous; L.S.: Low safety; A.S.: Appropiate safety; C.: Conservative; E.C.: Extremely conservative As previously shown in Table 2.18, a linear elastic analysis combined with a Mohr-Coulomb criterion gives under-conservative values for the ratio τmax/τu, specially in Chaallal et al.’s (1998b) and Ziraba et al.’s (1994) models. Since around 85% of the analyzed specimens show a ratio τmax/τu lower than 1.0, the reliability of both Chaallal et al.’s and Ziraba et al.’s models is in doubt. In this section, the statistical performance of Brosens’ model (2001) is analyzed in Table 2.39 and Table 2.40. Chaallal et al. and Ziraba et al. have been rejected due to the unsafe results obtained during the previous analysis. For peeling failure in general, Brosens predicts unsafe values for the maximum shear force at the plate end as shown by the median value lower than 1.0. This model gives also unsafe ratios for peeling failure initiated near cracks. When studying solely those tests that failed due to laminate end debonding, both the median and the mean seem appropriate with values of 2.28 and 1.67 respectively. However, the mean in this case is not significant because there is a large dispersion, as shown by the large coefficient of
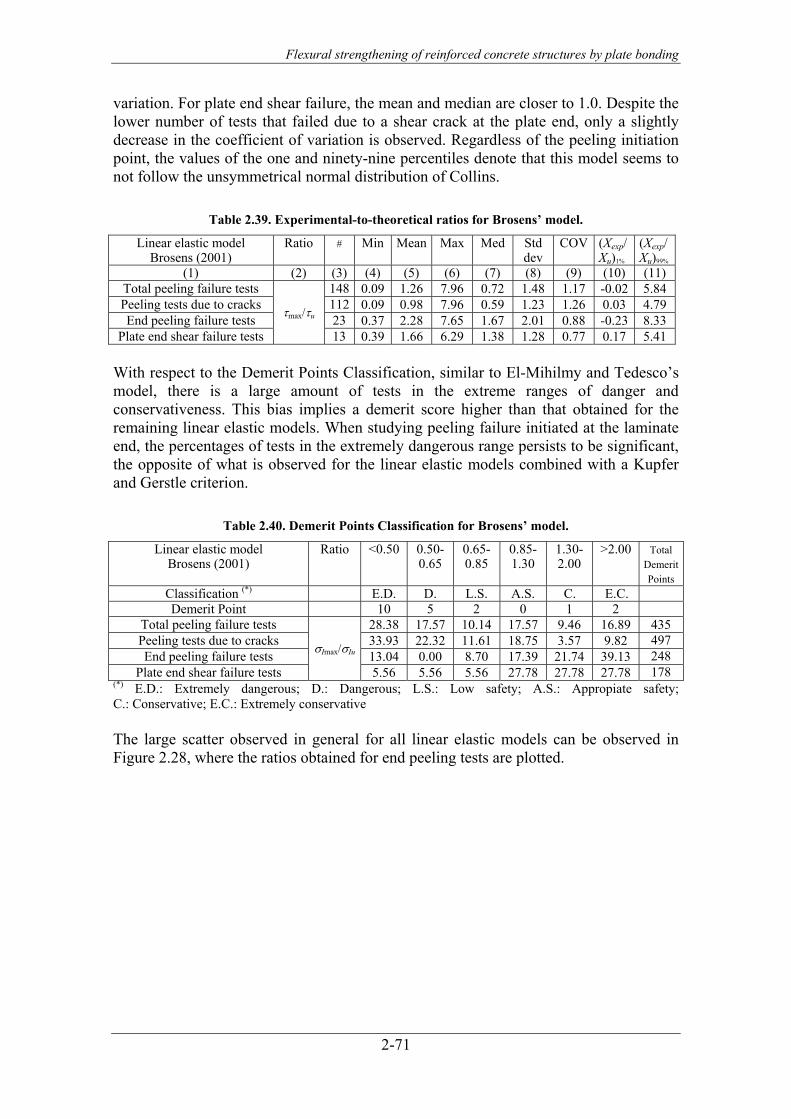
Flexural strengthening of reinforced concrete structures by plate bonding
2-71
variation. For plate end shear failure, the mean and median are closer to 1.0. Despite the lower number of tests that failed due to a shear crack at the plate end, only a slightly decrease in the coefficient of variation is observed. Regardless of the peeling initiation point, the values of the one and ninety-nine percentiles denote that this model seems to not follow the unsymmetrical normal distribution of Collins.
Table 2.39. Experimental-to-theoretical ratios for Brosens’ model.
Linear elastic model Brosens (2001)
Ratio # Min Mean Max Med Std dev
COV (Xexp/ Xu)1%
(Xexp/ Xu)99%
(1) (2) (3) (4) (5) (6) (7) (8) (9) (10) (11) Total peeling failure tests 148 0.09 1.26 7.96 0.72 1.48 1.17 -0.02 5.84 Peeling tests due to cracks 112 0.09 0.98 7.96 0.59 1.23 1.26 0.03 4.79 End peeling failure tests 23 0.37 2.28 7.65 1.67 2.01 0.88 -0.23 8.33
Plate end shear failure tests
τmax/τu
13 0.39 1.66 6.29 1.38 1.28 0.77 0.17 5.41 With respect to the Demerit Points Classification, similar to El-Mihilmy and Tedesco’s model, there is a large amount of tests in the extreme ranges of danger and conservativeness. This bias implies a demerit score higher than that obtained for the remaining linear elastic models. When studying peeling failure initiated at the laminate end, the percentages of tests in the extremely dangerous range persists to be significant, the opposite of what is observed for the linear elastic models combined with a Kupfer and Gerstle criterion.
Table 2.40. Demerit Points Classification for Brosens’ model.
Linear elastic model Brosens (2001)
Ratio <0.50 0.50- 0.65
0.65- 0.85
0.85- 1.30
1.30- 2.00
>2.00 Total DemeritPoints
Classification (*) E.D. D. L.S. A.S. C. E.C.
Demerit Point 10 5 2 0 1 2 Total peeling failure tests 28.38 17.57 10.14 17.57 9.46 16.89 435 Peeling tests due to cracks 33.93 22.32 11.61 18.75 3.57 9.82 497 End peeling failure tests 13.04 0.00 8.70 17.39 21.74 39.13 248
Plate end shear failure tests
σImax/σIu
5.56 5.56 5.56 27.78 27.78 27.78 178 (*) E.D.: Extremely dangerous; D.: Dangerous; L.S.: Low safety; A.S.: Appropiate safety; C.: Conservative; E.C.: Extremely conservative The large scatter observed in general for all linear elastic models can be observed in Figure 2.28, where the ratios obtained for end peeling tests are plotted.
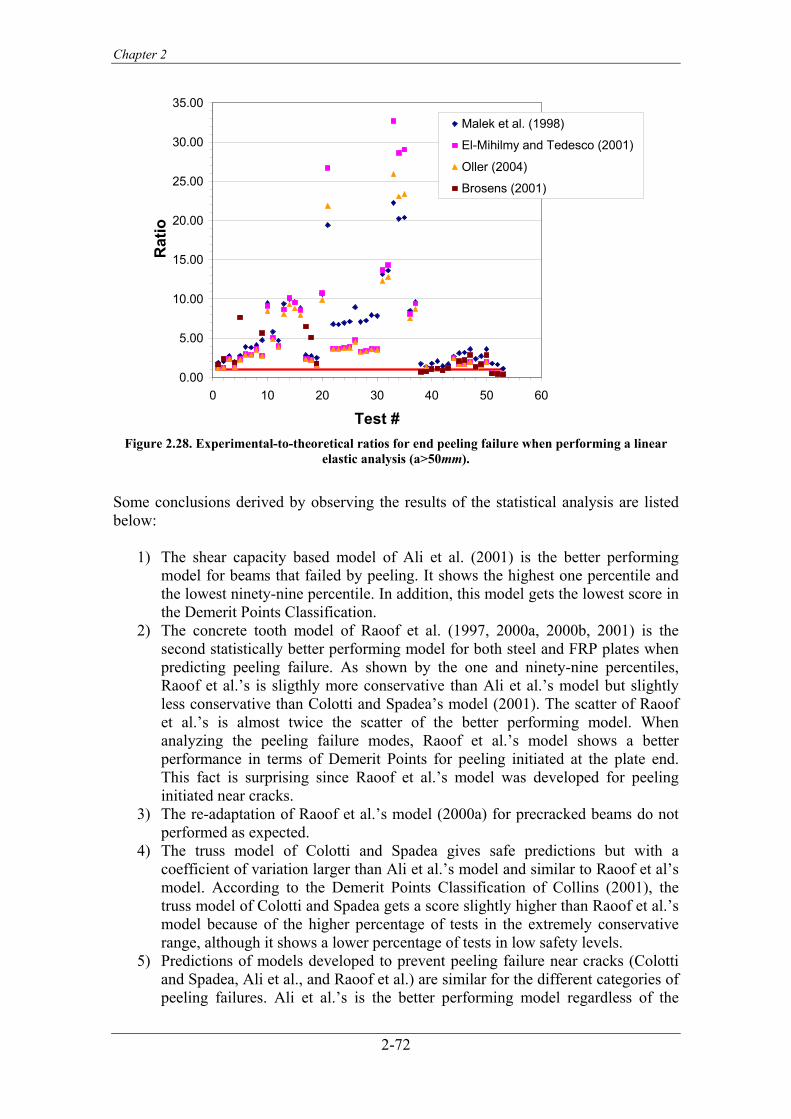
Chapter 2
2-72
0.00
5.00
10.00
15.00
20.00
25.00
30.00
35.00
0 10 20 30 40 50 60
Test #
Rat
io
Malek et al. (1998)
El-Mihilmy and Tedesco (2001)
Oller (2004)
Brosens (2001)
Figure 2.28. Experimental-to-theoretical ratios for end peeling failure when performing a linear
elastic analysis (a>50mm).
Some conclusions derived by observing the results of the statistical analysis are listed below:
1) The shear capacity based model of Ali et al. (2001) is the better performing model for beams that failed by peeling. It shows the highest one percentile and the lowest ninety-nine percentile. In addition, this model gets the lowest score in the Demerit Points Classification.
2) The concrete tooth model of Raoof et al. (1997, 2000a, 2000b, 2001) is the second statistically better performing model for both steel and FRP plates when predicting peeling failure. As shown by the one and ninety-nine percentiles, Raoof et al.’s is sligthly more conservative than Ali et al.’s model but slightly less conservative than Colotti and Spadea’s model (2001). The scatter of Raoof et al.’s is almost twice the scatter of the better performing model. When analyzing the peeling failure modes, Raoof et al.’s model shows a better performance in terms of Demerit Points for peeling initiated at the plate end. This fact is surprising since Raoof et al.’s model was developed for peeling initiated near cracks.
3) The re-adaptation of Raoof et al.’s model (2000a) for precracked beams do not performed as expected.
4) The truss model of Colotti and Spadea gives safe predictions but with a coefficient of variation larger than Ali et al.’s model and similar to Raoof et al’s model. According to the Demerit Points Classification of Collins (2001), the truss model of Colotti and Spadea gets a score slightly higher than Raoof et al.’s model because of the higher percentage of tests in the extremely conservative range, although it shows a lower percentage of tests in low safety levels.
5) Predictions of models developed to prevent peeling failure near cracks (Colotti and Spadea, Ali et al., and Raoof et al.) are similar for the different categories of peeling failures. Ali et al.’s is the better performing model regardless of the
Flexural strengthening of reinforced concrete structures by plate bonding
2-73
peeling failure mode. However, it should be noted that Ali et al.’s model performs better for peeling initiated near cracks than for end peeling failure. As previously mentioned, Raoof et al.’s model shows a better performance for plate end shear failure which is surprising since it was developed for peeling failure near cracks.
6) Since the shear capacity based models of both Jansze (1997) and Ahmed et al. (2001) were developed to predict plate end shear failure, they only show a good statistical performance when analyzing those tests that follow this peeling failure mode. Ahmed et al. modified Jansze’s model to make it suitable for CFRP laminates. Although better results are obtained for FRP laminates, it is necessary a further adjustment of this formulation because of the uncertainties derived from some empirical parameters.
7) In general, a large scatter is observed for all linear elastic models. Due to this large scatter, these models are unsuitable to prevent peeling failure at any location, even at the laminate end.
8) When analyzing the specimens that failed by end peeling, the Kupfer and Gerstle criterion is more conservative than the Mohr-Coulomb criterion.
9) The linear elastic analysis combined with a Mohr-Coulomb criterion given by Chaallal et al. (1998b) and Ziraba et al. (1994) are identified as the worse performing models in terms of giving close and safe predictions.
10) In addition, the upper bound predictions of the concrete tooth models of Raoof et al. are unsafe as they are expected to be.
11) Finally, the shear capacity based model of Oelhers (1992) is extremely conservative with predictions ten times lower than the experimental ultimate value. If the shear capacity of concrete is evaluated according to the Spanish Concrete Code, a significant improvement is observed in the statistical results.
The truss model of Colotti and Spadea (2001) is also able to predict the ultimate shear force for beams failing by FRP laminate rupture. As shown in Table 2.41, after selecting those tests with well-known data and without external anchorages that failed when the tensile strength of the composite was reached, the mean average of the ultimate experimental shear force was 1.09 times the predicted value.
Table 2.41. Theoretical-to-experimental ratios in beams that fail by plate rupture.
Theoretical model Ratio # Min Mean Max Std dev COV Truss models Colotti and Spadea (2001) Vexp/Vu 20 0.80 1.09 1.84 0.28 0.25
2.5. Critical discussion about the theoretical existing models Based on the comparative analysis of §2.4, a critical discussion about the suitability of the existing theoretical models described in §2.3 for the prediction of the peeling failure load is presented in this section. In the experimental review presented in §2.2, it was reported that in most externally plated beams, the concrete cover failed in tension with the following plate debonding before the flexural capacity was reached. The statistical analysis of the database confirms that 86% of the well-documented failures of strengthened beams were by premature plate debonding.
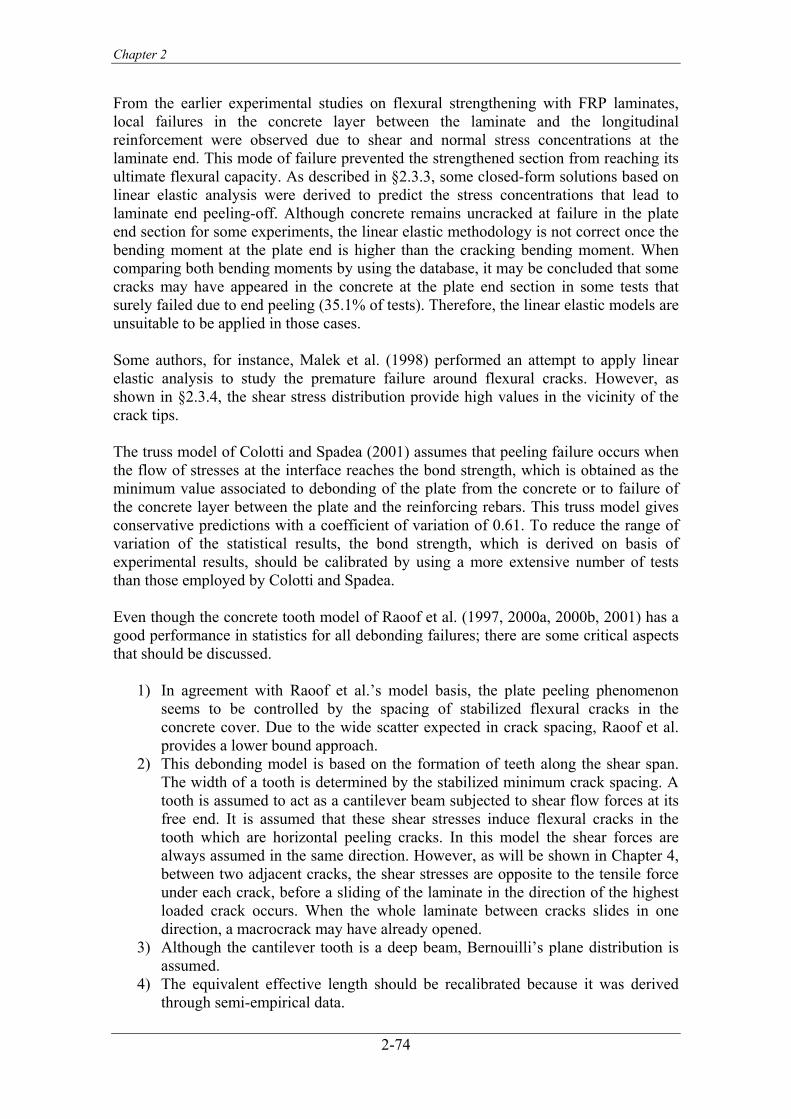
Chapter 2
2-74
From the earlier experimental studies on flexural strengthening with FRP laminates, local failures in the concrete layer between the laminate and the longitudinal reinforcement were observed due to shear and normal stress concentrations at the laminate end. This mode of failure prevented the strengthened section from reaching its ultimate flexural capacity. As described in §2.3.3, some closed-form solutions based on linear elastic analysis were derived to predict the stress concentrations that lead to laminate end peeling-off. Although concrete remains uncracked at failure in the plate end section for some experiments, the linear elastic methodology is not correct once the bending moment at the plate end is higher than the cracking bending moment. When comparing both bending moments by using the database, it may be concluded that some cracks may have appeared in the concrete at the plate end section in some tests that surely failed due to end peeling (35.1% of tests). Therefore, the linear elastic models are unsuitable to be applied in those cases. Some authors, for instance, Malek et al. (1998) performed an attempt to apply linear elastic analysis to study the premature failure around flexural cracks. However, as shown in §2.3.4, the shear stress distribution provide high values in the vicinity of the crack tips. The truss model of Colotti and Spadea (2001) assumes that peeling failure occurs when the flow of stresses at the interface reaches the bond strength, which is obtained as the minimum value associated to debonding of the plate from the concrete or to failure of the concrete layer between the plate and the reinforcing rebars. This truss model gives conservative predictions with a coefficient of variation of 0.61. To reduce the range of variation of the statistical results, the bond strength, which is derived on basis of experimental results, should be calibrated by using a more extensive number of tests than those employed by Colotti and Spadea. Even though the concrete tooth model of Raoof et al. (1997, 2000a, 2000b, 2001) has a good performance in statistics for all debonding failures; there are some critical aspects that should be discussed.
1) In agreement with Raoof et al.’s model basis, the plate peeling phenomenon seems to be controlled by the spacing of stabilized flexural cracks in the concrete cover. Due to the wide scatter expected in crack spacing, Raoof et al. provides a lower bound approach.
2) This debonding model is based on the formation of teeth along the shear span. The width of a tooth is determined by the stabilized minimum crack spacing. A tooth is assumed to act as a cantilever beam subjected to shear flow forces at its free end. It is assumed that these shear stresses induce flexural cracks in the tooth which are horizontal peeling cracks. In this model the shear forces are always assumed in the same direction. However, as will be shown in Chapter 4, between two adjacent cracks, the shear stresses are opposite to the tensile force under each crack, before a sliding of the laminate in the direction of the highest loaded crack occurs. When the whole laminate between cracks slides in one direction, a macrocrack may have already opened.
3) Although the cantilever tooth is a deep beam, Bernouilli’s plane distribution is assumed.
4) The equivalent effective length should be recalibrated because it was derived through semi-empirical data.

Flexural strengthening of reinforced concrete structures by plate bonding
2-75
5) Finally, the model was not derived for peeling at the plate end, but it statistically showed a good performance in this case.
The shear capacity based model of Oelhers (1992) is unsuitable to be used for design purposes because it provides overly conservative predictions. From all shear capacity based models, Ali et al.’s (2001) appears to be the most robust. According to Ali et al., when the plate end is placed in predominantly shear regions, the plate debonding occurs due to the formation of diagonal cracks. The sliding or rotation of a critical diagonal crack causes the initiation of a horizontal crack that generates the laminate separation. This model was developed to quantify the shear peeling force. As mentioned in §2.3.6, it was based on the simplified theory of plasticity for shear in reinforced concrete beams and on some tests results that calibrate the bond strength between a bonded plate and the concrete support. Despite the comparative analysis of §2.4 has shown its good performance, Ali et al.’s model is not able to predict the peeling failure induced by flexural cracks or the interfacial stress concentrations at the laminate end. Finally, Jansze (1997) developed a model to prevent a specific type of peeling failure in steel plated beams caused by an inclined crack that initiates at the plate end. This failure mode is only observed when the unstrengthened beam does not have enough shear reinforcement. Ahmed et al. (2001) readapted this model for FRP laminates. However, some uncertainties related to some empirical parameters suggest a further revision of this method. As shown in §2.3, an important effort in the development of mathematical models has been made in the last years. However, the definition of a suitable design method to predict peeling failure due to stress concentrations at the plate end or due to the shear flow between the crack discontinuities is still an unresolved matter. Recent research in this area has shown that proper understanding and modeling of the peeling phenomena at the interface may be improved by applying Fracture Mechanics theories. Models based on this theory were mainly introduced to study the shear stress transfer at the anchorage zone. According to Triantafillou and Plevris (1992) who were the first to apply Fracture Mechanics to the failure analysis of RC beams strengthened by FRP laminates, the bond between the laminate and the support may fracture in a sudden manner as a result of catastrophic crack propagation along the interface. Fracture occurs when the strain energy release rate equals the critical strain energy release rate for the interface. In Chapter 3 and Chapter 4, the debonding process is modeled as the propagation of an interfacial crack along the interface. A linear elastic analysis is only valid during the first stages in which the formation and propagation of a peeling horizontal crack are described. From a certain instant, the behavior is not linear any longer due to the development of microcracks. However, the stress transfer between concrete and laminate is still possible up to the formation of a macrocrack. Once the linear elastic step is finished, it is only possible to analyze the post-peak behavior by Non-Linear Fracture Mechanics.


![[EMPA] Flexural Strengthening of Reinforced Concrete](https://static.fdocuments.us/doc/165x107/577cdab51a28ab9e78a65444/empa-flexural-strengthening-of-reinforced-concrete.jpg)


