
Chapter 2 Experimental Apparatus and Procedures for Pool ... · Chapter 2 Experimental Apparatus...
20
Chapter 2 Experimental Apparatus and Procedures for Pool Boiling 2.1 Description of Experimental Apparatus In order to investigate the boiling phenomena and heat transfer performance of boiling enhanced surfaces including rectangular fin array surfaces and cavity array surfaces in horizontal and vertical orientations, an experimental facility with FC-72 as working fluid is designed and constructed. The schematic of the pool boiling experimental apparatus is depicted in Figure 2.1. The test rig consists five major parts: (1) test chamber, (2) heating module, (3) measurement and data acquisition system, (4) vacuum and degas system, and (5) environment control system which are described in the following. 2.1.1 Test Chamber As shown in Figure 2.2, the test chamber is used to simulate the pool boiling in saturated dielectric liquid FC-72 at atmospheric pressure inside a hermetic stainless steel pressure vessel, 304mm high and 154mm in diameter, with two quartz windows, each with a diameter of 100mm, to enable the flow patterns of the bubbles to be visualized. The internal water condenser is coiled in the upper section inside the vessel and connected to a thermostat to keep the vessel at atmospheric pressure. A pressure transducer with an operating range of 0 to 4×10 5 Pa is also located at the gate of the vessel to measure the pool pressure. The liquid temperature is measured using two RTDs with a calibrated accuracy of 0.1K. An auxiliary cartridge heater is wrapped around the vessel to preheat the working liquid during the operation, and to protect against heat loss from the vessel to the ambient. All the flanges of vessel and quartz windows are sealed by Teflon O-ring to prevent leakage. Moreover, four flange type thermocouple/power-lead feedthroughs for vacuum system are installed on upside flange of vessel to prevent leakage from the thermocouples and power-lead wire. Meanwhile, before 18
Transcript of Chapter 2 Experimental Apparatus and Procedures for Pool ... · Chapter 2 Experimental Apparatus...
Chapter 2
Experimental Apparatus and Procedures for Pool Boiling
2.1 Description of Experimental Apparatus
In order to investigate the boiling phenomena and heat transfer performance of boiling
enhanced surfaces including rectangular fin array surfaces and cavity array surfaces in
horizontal and vertical orientations, an experimental facility with FC-72 as working fluid is
designed and constructed. The schematic of the pool boiling experimental apparatus is depicted
in Figure 2.1. The test rig consists five major parts: (1) test chamber, (2) heating module, (3)
measurement and data acquisition system, (4) vacuum and degas system, and (5) environment
control system which are described in the following.
2.1.1 Test Chamber
As shown in Figure 2.2, the test chamber is used to simulate the pool boiling in saturated
dielectric liquid FC-72 at atmospheric pressure inside a hermetic stainless steel pressure vessel,
304mm high and 154mm in diameter, with two quartz windows, each with a diameter of
100mm, to enable the flow patterns of the bubbles to be visualized. The internal water
condenser is coiled in the upper section inside the vessel and connected to a thermostat to keep
the vessel at atmospheric pressure. A pressure transducer with an operating range of 0 to 4×10⁵
Pa is also located at the gate of the vessel to measure the pool pressure. The liquid temperature
is measured using two RTDs with a calibrated accuracy of 0.1K. An auxiliary cartridge heater
is wrapped around the vessel to preheat the working liquid during the operation, and to protect
against heat loss from the vessel to the ambient. All the flanges of vessel and quartz windows
are sealed by Teflon O-ring to prevent leakage. Moreover, four flange type
thermocouple/power-lead feedthroughs for vacuum system are installed on upside flange of
vessel to prevent leakage from the thermocouples and power-lead wire. Meanwhile, before
18

charge FC-72 into the test chamber, the leakage test is conducted by vacuumed the vessel and
then charging high pressure nitrogen (3×10⁵Pa). After 48 hours waiting period, if the pressure
variation is less than 10pa, the vessel is considered non-leakage and experiment can be carried
out.
2.1.2 Heating Module-Finned Surfaces
The schematic details of the heating module are shown in Figure 2.3, which include a test
surface, a dummy heater, a bakelite frame insulator and a Teflon substrate ( 0.35Wmk ≈ -1K-1).
All finned surfaces used herein are manufactured from high-purity oxygen-free copper. By
micro electrostatic discharge machining (EDM) process, the 4×4, 5×5 and 7×7 fin array
surfaces with different fin spacing of 2mm, 1mm and 0.5mm, as shown in Figure 2.4 are
machined from the 10mm×10mm base area, with fins of width 1mm, and 0.5, 1, 2 and 4mm fin
length respectively. The other finned surfaces are designed to be 10×10 fin arrays with one fin
spacing (0.5mm) and one fins width (0.5mm) and three fin lengths (0.5mm, 1.0mm and 2.0mm)
on a 10mm×10mm base area. The base temperatures are measured using two T-Type
thermocouples which are inserted and soldered in the two holes in the copper block at a depth
of 1mm under the base surface. The microelectromechanical systems (MEMS) refer to the
characteristic size less than 1 mm but larger than 1µm. Therefore, the finned surfaces fabricated
herein can be divided to two sets: mini finned surfaces (fin width = 1mm) and micro finned
surfaces (fin width = 0.5mm). The detailed geometric specifications of finned surfaces are list
in Table 2.1 and 2.2. The dummy heater is fabricated by standard photolithography, sputtering,
electro-less plating and immersion gold deposition process on a 10mm×10mm×0.09mm
Aluminum-Nitride heat spreader ( k ≈ 170Wm-1K-1). The Titanium/Copper heating circuit
(electrical resistance 10Ω ) is sputtered on downward-facing surface of the heat spreader. On
the upward-facing surface, Titanium/Copper thin film is also sputtered to be the adhesive layer.
Then, the copper electro-less plating and immersion gold process are conducted on the Ti/Cu
≈
19
layer for soldering with test surfaces. The bakelite frame insulator and the Teflon substrate are
mounted with test surface to prevent side heat loss. Moreover, low thermal conductivity
silicone adhesive is used to seal the crevice between test surface and bakelite to prevent boiling
nucleation.
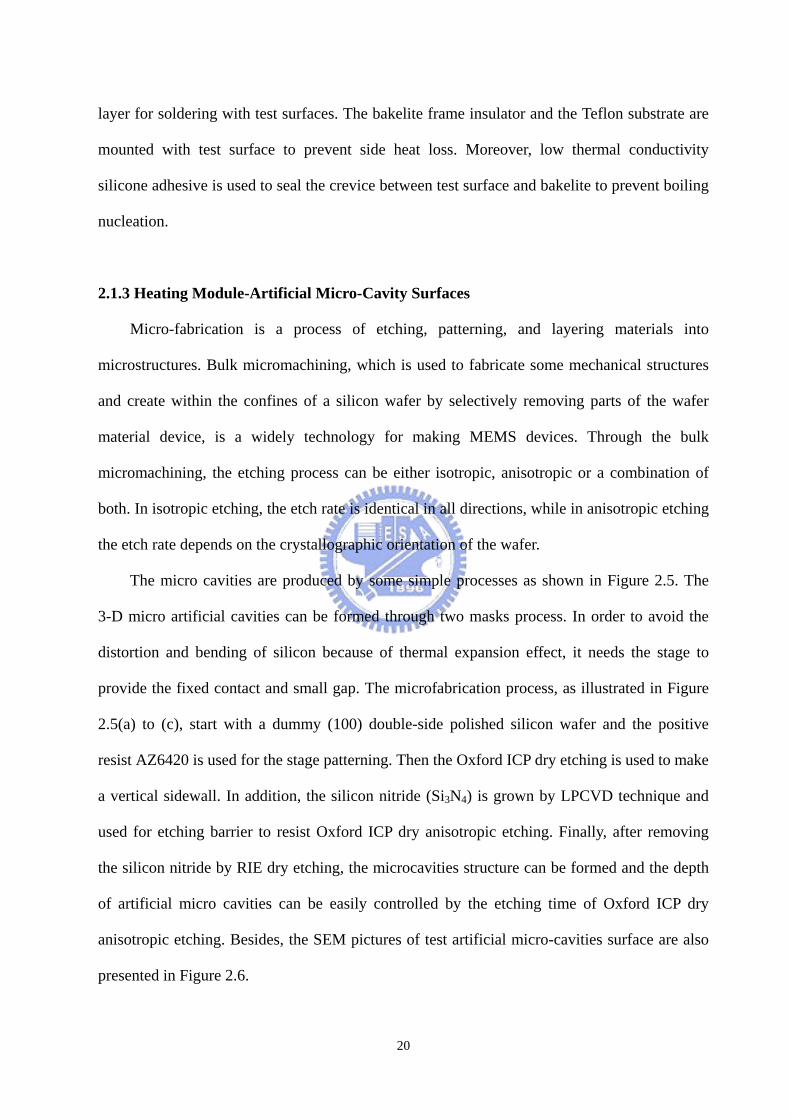
2.1.3 Heating Module-Artificial Micro-Cavity Surfaces
Micro-fabrication is a process of etching, patterning, and layering materials into
microstructures. Bulk micromachining, which is used to fabricate some mechanical structures
and create within the confines of a silicon wafer by selectively removing parts of the wafer
material device, is a widely technology for making MEMS devices. Through the bulk
micromachining, the etching process can be either isotropic, anisotropic or a combination of
both. In isotropic etching, the etch rate is identical in all directions, while in anisotropic etching
the etch rate depends on the crystallographic orientation of the wafer.
The micro cavities are produced by some simple processes as shown in Figure 2.5. The
3-D micro artificial cavities can be formed through two masks process. In order to avoid the
distortion and bending of silicon because of thermal expansion effect, it needs the stage to
provide the fixed contact and small gap. The microfabrication process, as illustrated in Figure
2.5(a) to (c), start with a dummy (100) double-side polished silicon wafer and the positive
resist AZ6420 is used for the stage patterning. Then the Oxford ICP dry etching is used to make
a vertical sidewall. In addition, the silicon nitride (Si3N4) is grown by LPCVD technique and
used for etching barrier to resist Oxford ICP dry anisotropic etching. Finally, after removing
the silicon nitride by RIE dry etching, the microcavities structure can be formed and the depth
of artificial micro cavities can be easily controlled by the etching time of Oxford ICP dry
anisotropic etching. Besides, the SEM pictures of test artificial micro-cavities surface are also
presented in Figure 2.6.
20

2.1.4 Data Acquisition
The power generated from the dummy heater is provided by a DC power supply (0-160V,
0-5A). The heating power, simulating the heat generated by CPU, is supplied from the DC
power supply.
All the signals, including those from thermocouples, RTDs and the pressure transducer are
collected and converted by the internal calibration equation in a data acquisition device, which
then transmitted the converted signals through a GPIB (IEEE488) interface to a personal
computer and displayed them on screen for further operation.
A microscope with a high speed camera (Fuji S602) is installed in front of the quartz
window to observe the mechanism of boiling on these test surfaces. The focus plane of the
camera is adjusted on the first row fins or cavities. The diameter of the departure bubble is
determined by compare with the side length of bakelite frame insulator instead of fin with or
fin width because of thermal expansion of copper may results measurement deviation. The
boiling images captured by the camera are stored and displayed using a PC with
image-capturing software. The images are recorded and the data collected simultaneously
during the experiment, to enable visual images to be compared with corresponding
measurements.
2.1.5 Degas System
The working fluid used in present study, FC-72, is highly wetting dielectric fluid
(perfluorocarbon). Moreover, FC-72 is apt to trap gas and dissolving gas be able obviously
affect the thermal properties of dielectric fluid and caused the deviation of experimental data.
Hence, prior to charge the FC-72 into the experimental vessel, the degassing process the
movement, reduce the influence of dissolving gas to the experiment. Degas system mainly
consist a stainless steel vessel with a heater, a condenser, a discharge valve and venting valve.
The dissolving FC-72 is heated and boiled by the heater in the stainless steel vessel. The boiled
21

movement causes dielectric fluid in fierce ebullition state, lies between dissolving gas which
dielectric fluid vapor will release to condenser, the vapor flow through in the condenser, then
will lie between dielectric fluid becomes the condensation the liquid backflow to the vessel, but
will survive the dissolving gas to follow by the venting valve to discharged to the ambient. The
degassing process carries on approximately 3 hours, until the pressure under saturation
temperature error value in 104 Pa. As the degas process is completed, opens degas system with
dielectric fluid between the circulatory system to pass the valve, charge the dielectric fluid the
flow into the vacuum state experimental vessel.
2.1.6 Environment Control System
During the experimental process, the test vessel is placed in a thermal state, 1.5m height,
1m width and depth, which used to control the internal ambient temperature inside the thermal
state the same as the working fluid inside test vessel for preventing the heat loss.
2.1.7 Working Fluid
The liquids used in the immersed cooling of electronic component must meet several
requirements which including chemically stable and inert, non-toxic, nonflammable, low
dielectric constant, low boiling point and high dielectric strength. The perfluorocabons FC-72
made by 3M Inc. are fit for the requirement above. Hence, FC-72 is used to be the working
fluid in present study. The thermal properties of FC-72 are shown in Table 2.3.
2.2 Experimental Procedures
The working liquid FC-72 is filled into the test vessel before the test run. The liquid level
is maintained at approximately 80 mm above the test surface to prevent any disturbance caused
by the rise of vapor/bubbles to the level of liquid, which will influence the boiling test. The test
vessel with the operating fluid is heated to the saturation temperature, using auxiliary cartridge
22
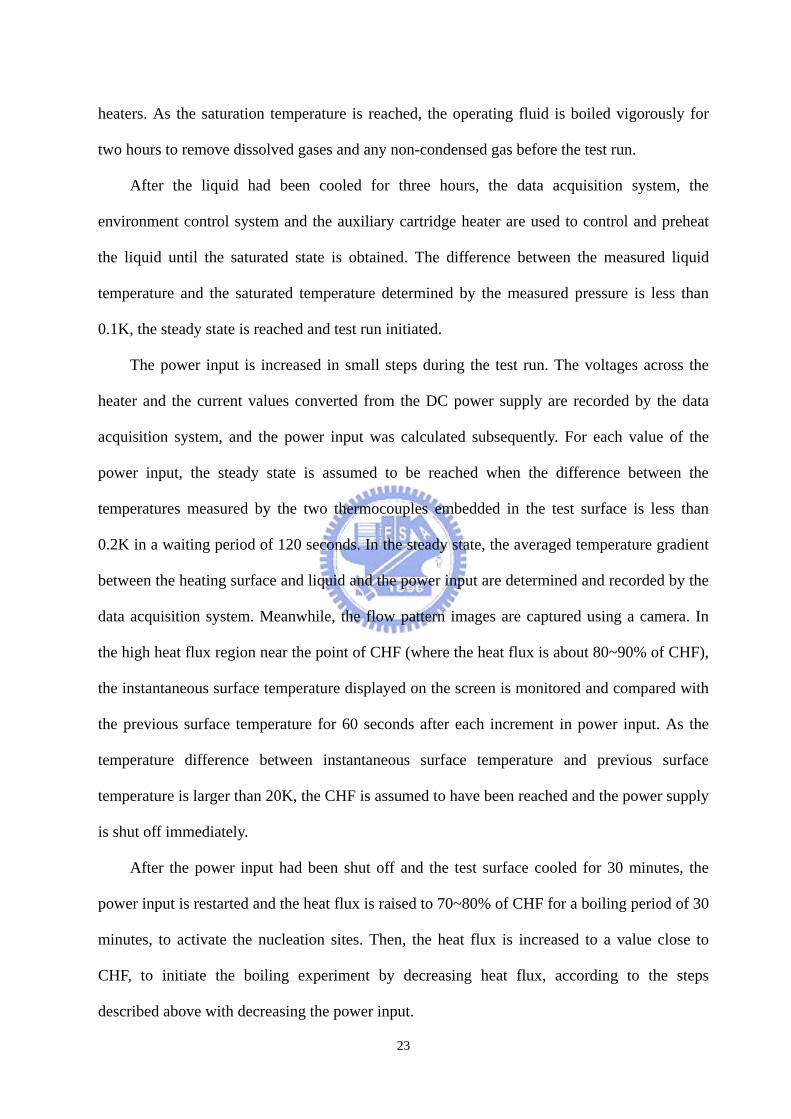
heaters. As the saturation temperature is reached, the operating fluid is boiled vigorously for
two hours to remove dissolved gases and any non-condensed gas before the test run.
After the liquid had been cooled for three hours, the data acquisition system, the
environment control system and the auxiliary cartridge heater are used to control and preheat
the liquid until the saturated state is obtained. The difference between the measured liquid
temperature and the saturated temperature determined by the measured pressure is less than
0.1K, the steady state is reached and test run initiated.
The power input is increased in small steps during the test run. The voltages across the
heater and the current values converted from the DC power supply are recorded by the data
acquisition system, and the power input was calculated subsequently. For each value of the
power input, the steady state is assumed to be reached when the difference between the
temperatures measured by the two thermocouples embedded in the test surface is less than
0.2K in a waiting period of 120 seconds. In the steady state, the averaged temperature gradient
between the heating surface and liquid and the power input are determined and recorded by the
data acquisition system. Meanwhile, the flow pattern images are captured using a camera. In
the high heat flux region near the point of CHF (where the heat flux is about 80~90% of CHF),
the instantaneous surface temperature displayed on the screen is monitored and compared with
the previous surface temperature for 60 seconds after each increment in power input. As the
temperature difference between instantaneous surface temperature and previous surface
temperature is larger than 20K, the CHF is assumed to have been reached and the power supply
is shut off immediately.
After the power input had been shut off and the test surface cooled for 30 minutes, the
power input is restarted and the heat flux is raised to 70~80% of CHF for a boiling period of 30
minutes, to activate the nucleation sites. Then, the heat flux is increased to a value close to
CHF, to initiate the boiling experiment by decreasing heat flux, according to the steps
described above with decreasing the power input.
23

The experiment process of effects of the test run number and non-boiling time on the test
surface is keep the test surface and working fluid inside the vessel for 24 hours non-boiling
time between two test run to maintain the consistency of experiment.
2.3 Temperature Calibration
The temperature calibration of all thermocouples and resistance temperature detectors are
take a HP2804A quartz thermometer as the reference datum. The probe of the quartz
thermometer is located inside a hole drilled in the central of a copper cylinder block which
placed in the water thermostat. The thermocouples and the resistance temperature detectors are
also located in the holes dilled on the same copper block encircled the quartz thermometer
probe. Vary the temperature of the thermostat from 40~90 and measure 60 temperature value.
Finally, the measurements of thermocouples, resistance temperature detectors and quartz
thermometer are plotted to take correlations to modify the deviation of each thermocouple and
resistance temperature detector.
2.4 Heat loss estimation and experimental uncertainty
The insulators of the heating module, including the bakelite frame and the Teflon substrate,
cannot completely prevent heat loss. Therefore, commercial computational fluid dynamic
software (Flotherm) is used to perform the thermal simulation. Three detailed thermal models
of the heating module are developed to examine the heat losses. All simulation models are
setting as the heating module immersed in the FC-72, the ambient pressure and temperature is
1 atmospheric and 55.6. The heat losses from bakelite frame and Teflon substrate in
horizontal and vertical copper plain surfaces estimated by simulation are 15.5% to 9.3% and
13.6% to 9.0% respectively in the heat flux range 0.2 Wcm-2 to 1 Wcm-2 in single phase natural
convection condition. The simulation results indicate that heat losses of the bakelite frame and
Teflon substrate cannot be neglected. Therefore, the heat loss will be subtracted in natural
24

convection region. However, as the boiling is initiated, the boiling heat transfer can provide
two order magnitude of heat transfer coefficient than that of single phase and the heat loss in
boiling region might be reduced in a neglecting range.
The uncertainties in the experimental results, including heat flux and measured
temperature, are analyzed as proposed by Kline and McClintock [61]. Table 2.4 and 2.5
summarize the results of this uncertainty estimation.
2.5 Data Reduction
Plain Surfaces
In the analysis of the boiling heat transfer performance, the overall heat transfer
coefficient of the plain surface is defined as:
(2-1) Tqh pp ∆′′= /
where is the heat flux through the heating surface and pq ′′ T∆ represents the wall superheat,
which can be determined by experimental measurement. The heat transfer rate is determined
from output current ( I ) of the DC power supply and measured voltage (V ) across the dummy
heater.
VIQp ⋅=& (2-2)
ppp AQq /&=′′ (2-3)
where is the base area of the plain surface. pA
The heat transfer inside the base of plain surface is determined as one-dimensional heat
conduction:
(2-4) ppmb AkxQTT ⋅∆⋅−= /&
where is the average measured temperature of two thermocouples; is the distance
between the base surface and the thermocouple, and is the thermal conductivity of the test
mT x∆
k
25

surface.
The wall superheat ( ) is defined as the difference between the temperature of the base
surface ( ) and the saturated temperature of FC-72 ( ).
T∆
bT satT
(2-5) satb TTT −=∆
Finned Surfaces
To analyze the boiling heat transfer effectiveness of the fined surface, the overall heat
transfer coefficient, , is defined as equal to: th
(2-6) Tqh tt ∆′′= /
where is the heat flux through the total area of the finned surface and represents the
wall superheat. The heat transfer rate can be calculated by the output current (
tq ′′ T∆
fQ& I ) of the
DC power supply and measured voltage (V ) across the dummy heater. The heat flux can be
based on either the base surface area , or the overall surface area ( , the summation of the
base area and the fin area).
bA tA
VIQf ⋅=& (2-7)
tft AQq /&=′′ (2-8)
bfb AQq /&=′′ (2-9)
)4( LWnAA bt ⋅⋅+= (2-10)
where W is the width and L is the length of the fin and represents the numbers of fins. n
The heat transfer inside the base of finned surface is also determined as one-dimensional
heat conduction:
(2-11) bfmb AkxQTT ⋅∆⋅−= /&
where is the average measured temperature of two thermocouples; is the distance
between the base surface and the thermocouple, and is the thermal conductivity of the
finned surface.
mT x∆
k
26

The wall superheat ( ) is defined as the difference between the temperature of the base
surface ( ) and the saturated temperature of FC-72 ( ).
T∆
bT satT
satb TTT −=∆ (2-12) Micro-Cavity Surfaces
The overall heat transfer coefficient of the micro-cavity surface is defined as:
Tqh tt ∆′′= / (2-13)
where is the heat flux through the total area of the micro-cavity surface and tq ′′ T∆
represents the wall superheat. The heat flux can be based on either the base surface area , or
the total surface area ( , the summation of the base area and the cavity area).
bA
tA
VIQc ⋅=& (2-13)
tct AQq /&=′′ (2-14)
bcb AQq /&=′′ (2-15)
)4
(2c
ccbtd
HdnAAπ
π +⋅+= (2-16)
where and is the diameter and depth of the cavity and represents the numbers of
cavities..
cd cH n
The heat transfer inside the base of micro-cavity surface is determined as one-dimensional
heat conduction:
bcmb AkxQTT ⋅∆⋅−= /& (2-17)
where is the average measured temperature of two thermocouples; is the distance
between the base surface and the thermocouple, and is the thermal conductivity of the test
surface.
mT x∆
k
The wall superheat ( ) is also defined as the difference between the temperature of the
base surface ( ) and the saturated temperature of FC-72 ( ).
T∆
bT satT
(2-18) satb TTT −=∆
27

Table 2.1 Specifications of mini-finned surfaces (W=1.0mm)
(See Figure 2.4)
Material : Copper L = 0.5mm L = 1mm L = 2mm L = 4mm
S = 0.5mm Fin Numbers: 49
tA =198mm2
Fin Numbers: 49
tA =296 mm2
Fin Numbers: 49
tA =492 mm2
Fin Numbers: 49
tA =884 mm2
S = 1mm Fin Numbers: 25
tA =150 mm2
Fin Numbers: 25
tA =200 mm2
Fin Numbers: 25
tA =300 mm2
Fin Numbers: 25
tA =500 mm2
S = 2mm Fin Numbers: 16
tA =132 mm2
Fin Numbers: 16
tA =164 mm2
Fin Numbers: 16
tA =228 mm2
Fin Numbers: 16
tA =356 mm2
Table 2.2 Specifications of micro-finned surfaces (W=0.5mm)
(See Figure 2.4)
Material : Copper L = 0.5mm L = 1mm L = 2mm
S = 0.5mm Fin Numbers: 100
tA =200mm2
Fin Numbers: 100
tA =300 mm2
Fin Numbers: 100
tA =500 mm2
28
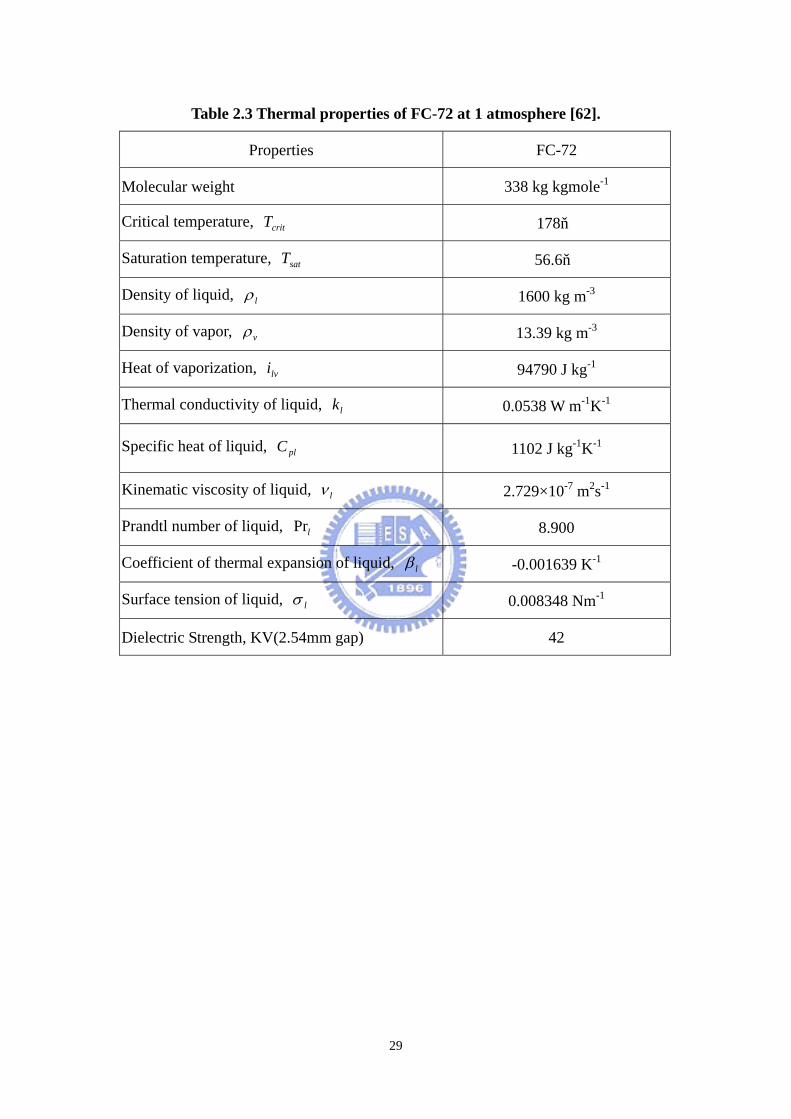
Table 2.3 Thermal properties of FC-72 at 1 atmosphere [62].
Properties FC-72
Molecular weight 338 kg kgmole-1
Critical temperature, critT 178
Saturation temperature, satT 56.6
Density of liquid, lρ 1600 kg m-3
Density of vapor, vρ 13.39 kg m-3
Heat of vaporization, lvi 94790 J kg-1
Thermal conductivity of liquid, lk 0.0538 W m-1K-1
Specific heat of liquid, plC 1102 J kg-1K-1
Kinematic viscosity of liquid, lν 2.729×10⁻⁷ m2s-1
Prandtl number of liquid, lPr 8.900
Coefficient of thermal expansion of liquid, lβ -0.001639 K-1
Surface tension of liquid, lσ 0.008348 Nm-1
Dielectric Strength, KV(2.54mm gap) 42
29
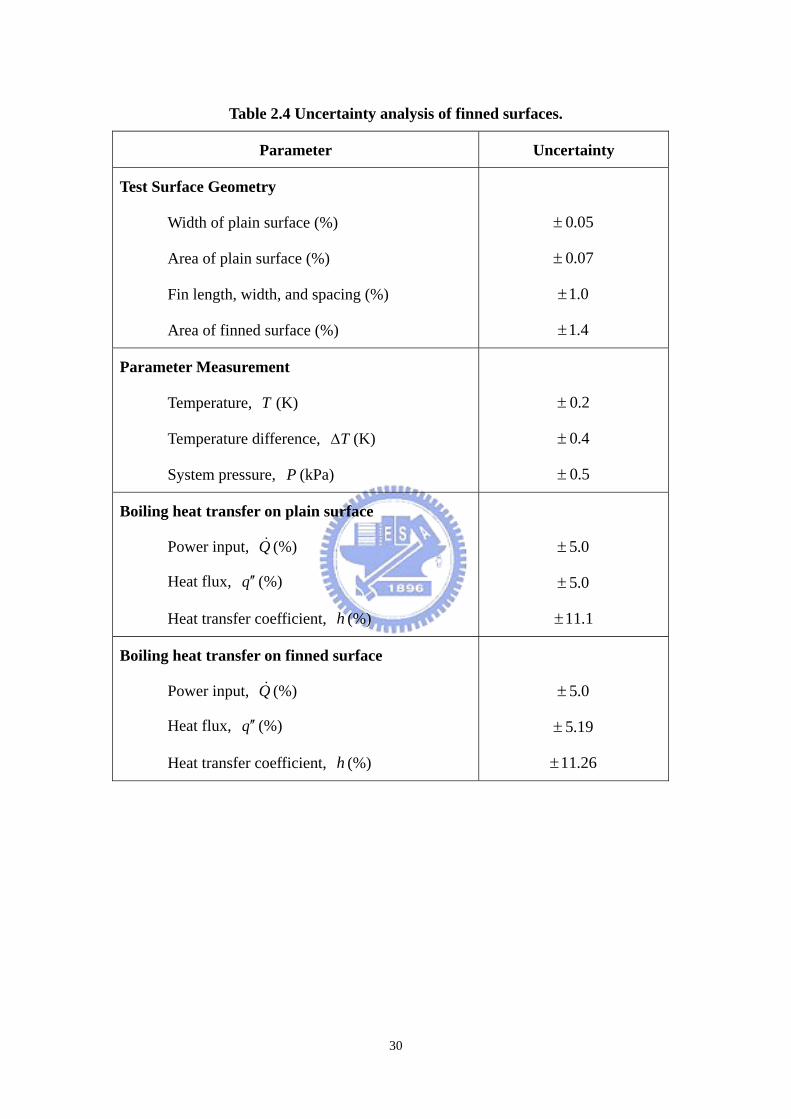
Table 2.4 Uncertainty analysis of finned surfaces.
Parameter Uncertainty
Test Surface Geometry
Width of plain surface (%)
Area of plain surface (%)
Fin length, width, and spacing (%)
Area of finned surface (%)
05.0±
07.0±
0.1±
4.1±
Parameter Measurement
Temperature, T (K)
Temperature difference, T∆ (K)
System pressure, P (kPa)
2.0±
4.0±
5.0±
Boiling heat transfer on plain surface
Power input, (%) Q&
Heat flux, (%) q ′′
Heat transfer coefficient, (%) h
0.5±
0.5±
1.11±
Boiling heat transfer on finned surface
Power input, (%) Q&
Heat flux, (%) q ′′
Heat transfer coefficient, (%) h
0.5±
19.5±
26.11±
30

Table 2.5 Uncertainty analysis of micro-cavity surfaces.
Parameter Uncertainty
Test Surface Geometry
Width of plain surface (%)
Area of plain surface (%)
Cavity diameter and depth (%)
Area of cavity surface (%)
5.0±
0.1±
0.5±
0.7±
Parameter Measurement
Temperature, T (K)
Temperature difference, T∆ (K)
System pressure, P (kPa)
2.0±
4.0±
5.0±
Boiling heat transfer on plain surface
Power input, (%) Q&
Heat flux, (%) q ′′
Heat transfer coefficient, (%) h
0.5±
1.5±
2.11±
Boiling heat transfer on cavity surface
Power input, (%) Q&
Heat flux, (%) q ′′
Heat transfer coefficient, (%) h
0.5±
6.8±
1.13±
31
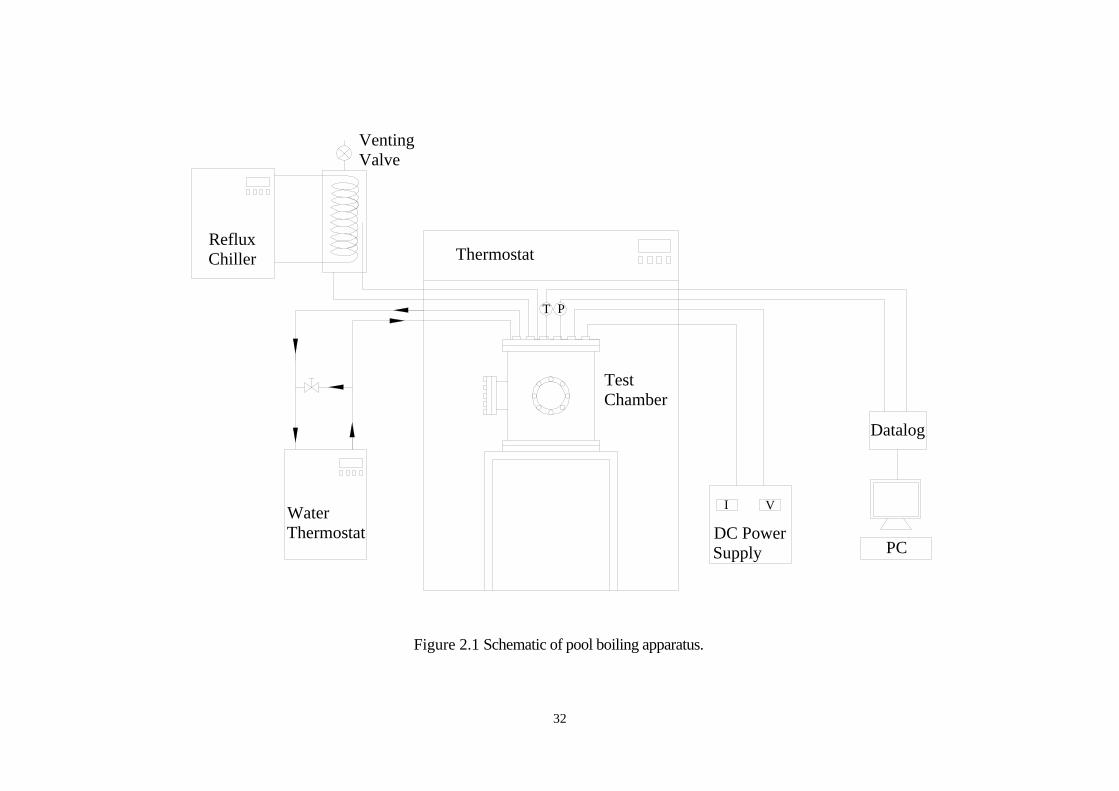
VentingValve
RefluxChiller Thermostat
TestChamber
WaterThermostat
PC
Datalog
T P
DC Power Supply
VI
Figure 2.1 Schematic of pool boiling apparatus.
32
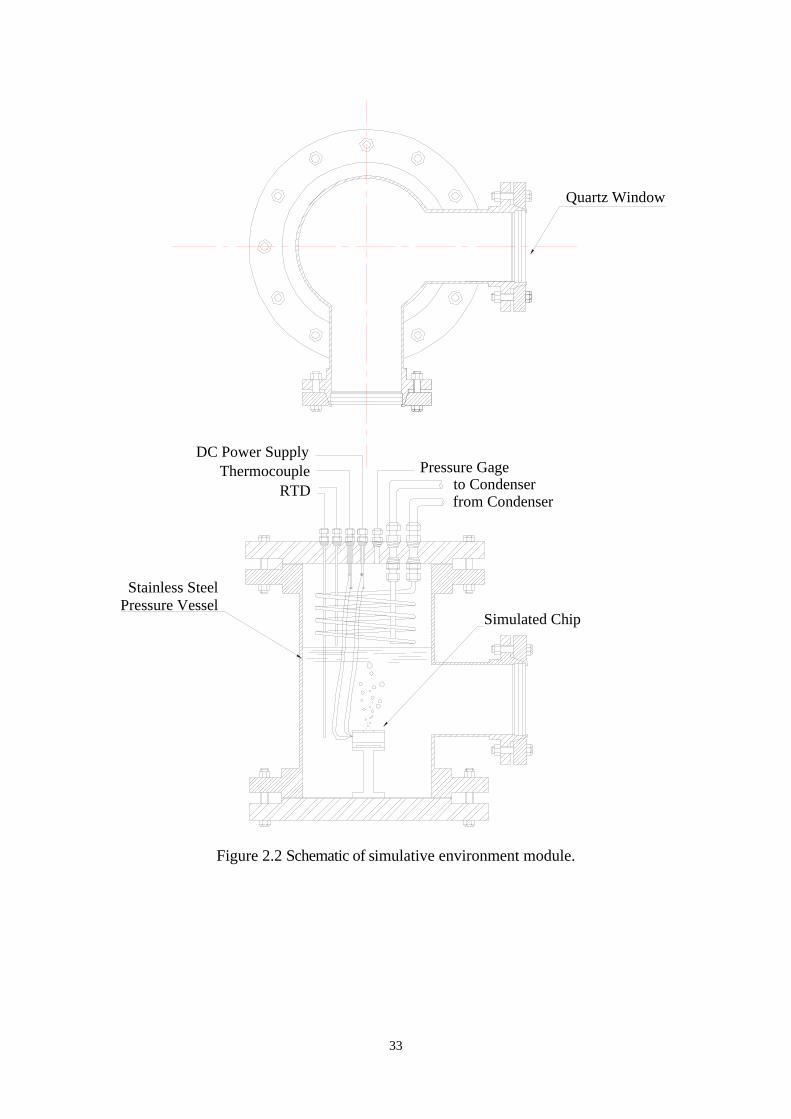
Simulated Chip
Quartz Window
Stainless SteelPressure Vessel
Pressure Gageto Condenserfrom Condenser
RTDThermocouple
DC Power Supply
Figure 2.2 Schematic of simulative environment module.
33

Figure 2.3 Schematic of saturated pool boiling heating module (unit:mm).
34

10
S
10
W
L10
SW
10
L
SW
L10
10
L
S
10
10
W
Figure 2.4 Schematic of finned surfaces (unit: mm).
35

PR AZ4620
Si3N4
Si(a)
(b)
(c)
(d)
(e)
(f)
Figure 2.5 Test artificial micro-cavity surface fabrication process flow.
36

Figure 2.6 SEM pictures of a test artificial micro-cavity surface (25×25 array, cavity
diameter 200µm, depth110µm).
37


![A laboratory extraction apparatus and its use in ...nvlpubs.nist.gov/nistpubs/jres/20/jresv20n1p83_A1b.pdf · Schicktanz] Laboratory E'J:traction Apparatus 85 II. APPARATUS AND EXPERIMENTAL](https://static.fdocuments.us/doc/165x107/5ab7b27e7f8b9a684c8bd2b9/a-laboratory-extraction-apparatus-and-its-use-in-laboratory-ejtraction-apparatus.jpg)


