Chapter 2. Evaluation of the Biological Activity of ...
29
C H A P T E R 2 Evaluation of the Biological Activity of Compounds: Techniques and Mechanism of Action Studies Iain G. Dougall 1 and John Unitt 2 1 IGD Consultancy Ltd, Loughborough, Leics, UK; 2 Sygnature Discovery Limited, BioCity, Nottingham, UK OUTLINE I. Introduction 15 II. Drug Discovery Approaches and Screening Cascades 16 A. Target Based Screening 16 B. Phenotypic Screening 16 III. In Vitro Assays 17 A. Primary Assays 17 B. Compound Interference in Primary Assays: Artifacts and False Positives 34 C. Assay Biostatistics 34 D. Selectivity, Cytotoxicity, and Species Cross-over. 37 E. Cellular and Tissue Functional Responses 38 IV. Ex Vivo Assays 38 V. In Vivo Assays 39 A. Pharmacokinetic Models 40 B. Efficacy Models 40 C. Safety Testing 41 Acknowledgements 42 References 42 I. INTRODUCTION Drugs are molecules that are designed to perturb biological systems (cells, isolated tissues, whole animals, and ultimately patients). The responses observed are, in most cases, the result of the drug interacting with proteins, which have the capacity to convert chemical information into biological information. These proteins include plasma membrane bound receptors such as G protein coupled receptors (GPCRs) and tyrosine kinase receptors, ion channels (both ligand gated and voltage operated), enzymes, transporters, and transcription factors such as the nuclear hormone receptors (NHRs), which bind to specific consensus sequences of DNA and modulate gene transcription. Many of these target classes have been very successfully exploited to produce pharmacological agents designed to treat human (and animal) diseases (Figure 2.1). However, a significant number of potentially therapeutically useful drug targets have proven to be less tractable to small molecule approaches. In many cases this is because the interactions in question are proteinprotein in nature and therefore difficult to modulate with conventional drugs. This realization has driven significant efforts in the field of biologicals. These large molecular weight agents, which include monoclonal antibodies, oligonucleotides, and small interfering RNAs (siRNA), 15 The Practice of Medicinal Chemistry. © 2015 Elsevier Ltd. All rights reserved.
Transcript of Chapter 2. Evaluation of the Biological Activity of ...

C H A P T E R
2
Evaluation of the Biological Activity ofCompounds: Techniques and Mechanism of
Action StudiesIain G. Dougall1 and John Unitt2
1IGD Consultancy Ltd, Loughborough, Leics, UK; 2Sygnature Discovery Limited,
BioCity, Nottingham, UK
O U T L I N E
I. Introduction 15
II. Drug Discovery Approaches andScreening Cascades 16A. Target Based Screening 16B. Phenotypic Screening 16
III. In Vitro Assays 17A. Primary Assays 17B. Compound Interference in Primary Assays:
Artifacts and False Positives 34C. Assay Biostatistics 34D. Selectivity, Cytotoxicity, and Species
Cross-over. 37
E. Cellular and Tissue FunctionalResponses 38
IV. Ex Vivo Assays 38
V. In Vivo Assays 39A. Pharmacokinetic Models 40B. Efficacy Models 40C. Safety Testing 41
Acknowledgements 42
References 42
I. INTRODUCTION
Drugs are molecules that are designed to perturb biological systems (cells, isolated tissues, whole animals, andultimately patients). The responses observed are, in most cases, the result of the drug interacting with proteins,which have the capacity to convert chemical information into biological information. These proteins includeplasma membrane bound receptors such as G protein coupled receptors (GPCRs) and tyrosine kinase receptors,ion channels (both ligand gated and voltage operated), enzymes, transporters, and transcription factors such asthe nuclear hormone receptors (NHRs), which bind to specific consensus sequences of DNA and modulate genetranscription. Many of these target classes have been very successfully exploited to produce pharmacologicalagents designed to treat human (and animal) diseases (Figure 2.1). However, a significant number of potentiallytherapeutically useful drug targets have proven to be less tractable to small molecule approaches. In many casesthis is because the interactions in question are protein�protein in nature and therefore difficult to modulate withconventional drugs. This realization has driven significant efforts in the field of biologicals. These large molecularweight agents, which include monoclonal antibodies, oligonucleotides, and small interfering RNAs (siRNA),
15The Practice of Medicinal Chemistry. © 2015 Elsevier Ltd. All rights reserved.

have significantly increased the armamentarium of researchers allowing them to probe the role of previouslyintractable targets in human disease (see Chapter 3). However, to date, with the exception of monoclonal antibo-dies (such as the anti-TNFs) very few of these biological agents have made it to the market. In addition, thehigher cost of large molecules means that small molecule drug programs remain an attractive proposition, evenfor chemically challenging targets.
The focus of this chapter is the description of how small molecules synthesized by medicinal chemists areassessed for biological activity (although many of the principles are equally applicable to large molecules). Suchagents have been the mainstay of pharmacological treatment of human disease for decades and remain a veryimportant class of drugs in the continuing search for new medicines to address unmet clinical needs.Historically, medicinal chemists used the naturally occurring ligands or substrates (for enzymes) of target pro-teins as starting points for small molecule-based research programs, although nowadays “hits” from highthroughput screens (HTS), fragment screens, or in silico screens are more likely to act as initial “leads.”Irrespective of the chemical basis of the program, the assays employed, the data generated, and their subsequentanalysis form the basis of screening cascades that are designed ultimately to identify and progress moleculeswith appropriate properties for clinical testing. If the target is novel, and in the absence of definitive data linkingit to human disease (e.g., genetic association data such as the link between the Cystic Fibrosis TransmembraneConductance Regulator (CFTR) dysfunction and cystic fibrosis (CF)), such clinical testing provides the ultimatevalidation (or invalidation) of the target.
II. DRUG DISCOVERY APPROACHES AND SCREENING CASCADES
A. Target Based Screening
Modern day drug discovery programs largely center on target based screening, i.e., they aim to identify com-pounds that modulate the activity of a target that is potentially implicated in a human disease. To this end,compounds are typically tested in a range of in vitro biological assays designed to measure primary activities(potency, intrinsic activity, and/or efficacy), selectivity (activity versus related and unrelated targets), cellulartoxicity, and physiologically relevant activity. The primary assay sits at the top of the screening cascade and dataderived from it drive understanding of structure-activity relationships (SAR), allowing compound optimization.Criteria are set at each level of the cascade for compound progression to the next assay. Compounds withsuitable robust properties progress to animal model testing with the aim of showing activity in a “disease rele-vant” setting as a prelude to picking a candidate drug (CD) for clinical trials. As drug discovery programs prog-ress from early (Hit and Lead Identification) to late (Lead Optimisation, Candidate Selection) phases, thescreening cascade evolves to become increasingly complex. Figure 2.2A illustrates a typical example of a screen-ing cascade, although it is important to realize that the cascade used will be target dependent.
B. Phenotypic Screening
Although target based screening has proven to be very successful in the discovery of new medicines, a majordisadvantage of the approach is that the evidence linking the target to the disease is often relatively weak, andthe hypothesis is only proven (or disproven) after considerable investment of time, effort, and money.
Number of launched drugs
Tar
gets
0 200 400 600 800
Protein ligand
Defence protein
Structural protein
Regulatory protein
Serum protein
Transporter
Enzyme
Receptor FIGURE 2.1 Number of Launched Small Molecule Drugs
by Protein Target Class. As of May 2014, according to ThomsonReuters Cortellis.
16 2. THE BIOLOGICAL ACTIVITY OF COMPOUNDS
I. GENERAL ASPECTS OF MEDICINAL CHEMISTRY

Phenotypic screening, on the other hand, starts from the premise that the assay readout has high disease rele-vance, and therefore active compounds are more likely to be clinically efficacious. The cell-based assays that aretypically employed also have the advantage that “hits” by definition have cellular activity: in target basedapproaches using isolated proteins, this property often has to be built in later. The disadvantage of this approachis that the mechanism of action (MOA) of the compounds in the assay is usually unknown, so subsequent optimi-zation of “hits” involves significant de-convolution activities. Nevertheless, phenotypic screens are becomingmore popular in the drug industry, driven by the increased availability of novel higher throughput technologiesand the success of this approach in identifying new “first in class” molecules [1] (Figure 2.2B). Examples of areasin which the approach has proven fruitful are neglected parasitic diseases such as human African trypanosomia-sis and cystic fibrosis. In the former example, compounds can be screened for trypanocidal activity against thewhole parasite [2]. In the case of CF, the well-understood genetic basis of the disease has encouraged screeningfor compounds that improve the functional activity of the defective protein (CFTR). This latter example is some-what of a “halfway house” between a target-based screen and a phenotypic screen: the target is clearly known,but improved function of CFTR can result from compound interaction with CFTR itself or with proteins involvedin its processing, trafficking and ion channel function. The recent approval of the CFTR potentiator, Kalydecot[3,4] is testament to the power of this approach.
III. IN VITRO ASSAYS
As outlined above, the initial phases of a target based screening cascade typically employ a range of in vitroassays. The exact system(s) used will be target and mechanism dependent. For example, a project targetingantagonists may use a binding assay as the primary screen, whereas one targeting agonists is more likely to use afunctional assay. The following sections give a basic introduction to some of the more commonly used types ofprimary assays outlining their advantages and disadvantages. The measurements made in these assays that aretypically reported to medicinal chemists, the properties of various different classes of drugs, and the principlesunderlying their analysis are also described.
A. Primary Assays
Glossary
A glossary of commonly used biochemical/pharmacological parameters is presented in Table 2.1 to assist thereader’s understanding of the following sections.
Primary Screen(A) (B)
FLIPR Ca2+ Flux (HEK-FPR1cells)
Secondary ScreenNeutrophil chemotaxis
In vivo ModelsfMLF-induced lung neutrophilia
Bacterial Infection/Smokingmodels
SelectivityFPRL1, other GPCRs eg C5aR
Species CrossoverMouse and Rat assays
DMPK
50
4028
17
5
25
30
83
13
31
30
20
10
0
Phenotypicscreening
Target-basedscreening
Modifiednaturalsubstances
Biologics
First-in-class drug
37%
23%
33%
7%
18%
51%
19%
8%
Follower drug
Per
cent
age
of N
ME
s
FIGURE 2.2 Screening Cascades and Drug Discovery Approaches. (A) A typical screening cascade for an early discovery program. Inthis instance the aim was to discover antagonists of the formyl peptide receptor, FPR1, as potential treatments for COPD. The receptor med-iates a number of effects on a range of cell types but is perhaps best known as an activator of neutrophils. Hence the focus of the cascade ison neutrophil biology. As the project proceeded, a number of other assays were introduced to the cascade including neutrophil and macro-phage superoxide generation and airway smooth muscle contraction. (B) The distribution of new drugs discovered between 1999 and 2008,according to the discovery strategy. Reprinted by permission from Swinney & Anthony, 2011 [1].
17III. IN VITRO ASSAYS
I. GENERAL ASPECTS OF MEDICINAL CHEMISTRY

1. Binding assays
The aim of binding experiments is to determine the affinity (the strength with which a compound binds to thetarget site) of the compound for the biological target. They are the simplest and most robust assays. Today, bind-ing assays are commonly run using recombinantly generated human protein or mammalian cell lines (such ashuman embyronic kidney 293 (HEK293) or Chinese hamster ovary (CHO) cells) engineered to express the humanversion of the target protein. Isolated protein, membrane preparations from cells, or whole cells can all be usedto measure the affinity of test compounds. Isolated proteins are often employed for enzyme targets whereasmembrane and cell preparations have been widely used in programs aimed at finding drugs that target GPCRsand ion channels. As it is impractical routinely to label test compounds, typically the measurements made areindirect, in that the ability of the test compound to inhibit binding of a standard labeled compound is assessed.Such assays depend of course on the availability of a suitably affine and selective labeled compound. Historicallythe label has been radioactive, but more recently fluorescently labeled compounds have also been employed.Increasingly, label free technologies such as that developed by Biacore [5], which use surface plasmon resonanceto measure binding events as changes in molecular mass, are being used in drug discovery programs. This tech-nique has the advantage of allowing real time measurements to be made. Thus, affinity, kinetics, and thermody-namics are easily studied (see Section IIIA (2)). It is also a very sensitive technique and therefore can detect thelow affinity interactions that are typical of low molecular weight fragments (,250 Da). The disadvantages of thistechnique are that the development of successful protein target immobilization can take considerable time andeffort, and its application is mainly with solubilised proteins like kinases rather than integral membrane receptorslike GPCRs.
TABLE 2.1 Glossary of Key Pharmacological/Biochemical Terms
Pharmacological/
biochemical term Definition
KA (pKA) Standard pharmacologic convention for the equilibrium dissociation constant of an agonist receptor complexwith units of M. It is a measure of affinity. (pKA52log10KA)
KB (pKB) Convention for the equilibrium dissociation constant of an antagonist receptor complex determined in afunctional assay. It has units of M and is a measure of affinity. (pKB52log10KB)
KD (pKD) Convention for the equilibrium dissociation constant of a ligand receptor complex measured in a binding assay.It has units of M. (pKD52log10KD)
Ki (pKi) The KB for an antagonist (or inhibitor) but measured in a binding study or enzyme assay. It has units of M.(pKi52log10Ki)
Km The Michaelis constant Km is the substrate concentration at which the reaction rate is half of Vmax. It has units ofM and is measure of the substrate’s affinity for the enzyme.
[A]50 or EC50 (pA50 orpEC50)
The effective concentration of an agonist producing 50 percent maximal response to that particular drug (notnecessarily 50 percent of the maximal response of the system). It has units of M and is a measure of agonistpotency. (pA50 and pEC5052log10A50 and 2 log10EC50).
IC50 (pIC50) The concentration (usually molar) of an inhibitor (receptor, enzyme antagonist) that blocks a given predefinedstimulus by 50 percent. It is a measure of inhibitor potency but is an empirical value in that its magnitude canvary with the strength of the stimulus to be blocked. (pIC5052log10IC50).
pA2 The negative logarithm of the molar concentration of an antagonist that produces a 2-fold shift to the right of anagonist concentration-effect curve. It is a measure of antagonist potency.
Intrinsic Activity A measure of agonist activity, it is the fractional response of an agonist (positive or inverse) relative to astandard full agonist. It is unit-less and ranges from 0 for antagonists to 1.0 for full agonists.
Efficacy (e or τ) A measure of the capacity of an agonist to produce a physiological response. It is unit-less but can have bothpositive and negative values (for inverse agonists).
ED50 The in vivo counterpart of EC50 referring to the dose (D) of agonist that produces 50 percent maximal effect
18 2. THE BIOLOGICAL ACTIVITY OF COMPOUNDS
I. GENERAL ASPECTS OF MEDICINAL CHEMISTRY

2. Binding Studies: Principles and Analysis
The simplest model of drug-receptor (or more generally protein) interaction is the Law of Mass Action inwhich the drug binds reversibly to the protein at a single site. Under such conditions, regardless of the assayemployed, ligand (L) binding to its receptor (R) at equilibrium is described by the following equation:
LR½ �5 ½Rtot�½L�½L�1KD
ð2:1Þ
where [LR] represents the concentration of ligand occupied receptors, [Rtot] the total receptor pool and KD is theligand equilibrium dissociation constant (offset rate constant (k2) divided by the onset rate constant (k1)), a mea-sure of the affinity of the ligand for its receptor. Eq. (2.1) describes a saturable curve with all the receptors beingoccupied at high ligand concentrations. KD represents the concentration of ligand that occupies 50 percent of[Rtot]. Thus, in principle the direct binding of a labeled compound to the target can be simply measured and theKD estimated from the midpoint of the saturation curve (Figure 2.3A). However, as it is clearly not practical tolabel all test compounds, the affinity of these is measured indirectly by assessing the displacement of a labeledligand. In such experiments, the ability of the test compound to inhibit a single concentration (usually at approxi-mately the KD or below) of labeled ligand is measured. They typically yield a sigmoidal curve (when the drugconcentration is expressed in log form) from which the IC50 (concentration of the test compound that produces50 percent inhibition of the specific binding of the labeled compound) can be measured (see Figure 2.3B). Curveparameter estimates are usually derived from direct fitting of the experimental data to simple mathematical equa-tions as described in Section IIIA (6). Assuming that the interaction between the labeled compound and the testcompound is competitive, the dissociation constant (Ki) of the test compound can be calculated from the Cheng-Prusoff [6] equation:
Ki 5IC50
11 ½L�=KDð2:2Þ
Proof of the assumption that the interaction is competitive requires further experimentation, such as studying theinhibition by the test compound with different concentrations of the labeled ligand. As is evident from Eq. (2.2), atconcentrations of L in excess of KD the IC50 estimate will increase proportionately (i.e., higher concentrations of Lwill require higher concentrations of test compound to displace it). It is therefore imperative that when IC50 valuesare used to compare compound activities, that this is done under identical conditions (i.e., [L]/KD should beconstant).
0
20
40
60
80
100
120
–11 –10 –9 –8 –7 –6
(ICI 118551) (log)10M
% s
peci
fic b
indi
ng
Inhibition analysis (indirect)
Ki =IC50
1 + (L)/KD
IC5 0= 1 nM
(L)/KD= 0.33pKi= 9.1
Cheng - prusoff correction
0
5000
10000
15000
0.0 1.0 2.0 3.0 4.0
(I125cyanopindolol) (nM)
c.p.
m.
KD= 0.3 nM
Saturation analysis (direct)(A) (B)
(Rtot)
Affinity = 1/KD= k1/k2
FIGURE 2.3 Binding Assays: Direct and Indirect Measurements. (A) A direct binding assay using I125 labeled cyanopindolol as a β2-adrenoceptor ligand. The curve describes a rectangular hyperbola which saturates at high ligand concentration. The ligand dissociation con-stant (KD) was estimated as 0.3 nM and is a measure of the ligand affinity. (B) A typical inhibition analysis using membranes expressing thehuman β2-adrenoceptor and employing 0.1 nM I125 cyanopindolol as the labeled ligand. The displacing ligand, the selective β2-adrenoceptorantagonist ICI 118551, produces complete inhibition of the specific binding yielding an IC50 of 1 nM. In this instance [L]/KD is ,1.0 so theIC50 is a good estimate of the Ki as calculated by the Cheng-Prusoff equation. Unpublished data.
19III. IN VITRO ASSAYS
I. GENERAL ASPECTS OF MEDICINAL CHEMISTRY

Since IC50 values do not infer a particular MOA, they are routinely used to compare the activities of com-pounds in binding assays. Other modes of compound binding beyond simple competition are discussed in thesections below on enzymes and functional studies.
The kinetics of drug binding are also most easily studied in simple binding assays rather than functionalassays where association and dissociation rates are more likely to be affected by diffusion barriers. Label freetechniques such as Biacore are being increasingly utilized for this purpose as illustrated in Figure 2.4A for inhibi-tors of p38α. Interestingly the compounds in this example have similar affinities (52 and 78 nM), but markedlydifferent kinetics (e.g., k1 values 2.23 104 and 1.73 106 M s21). Slow kinetics and hence longer residence timesare potentially advantageous compound characteristics [7,8], therefore such measurements are becoming increas-ingly important in drug discovery programs. An interesting example of a clinically used drug with unusualkinetics is the muscarinic antagonist, Tiotropium. It binds M2 and M3 receptor subtypes nonselectively (Ki valuesof 0.1 to 0.2 nM), but the compound has a much slower off rate (.10-fold) at the M3 subtype, enough to make ita physiologically selective M3 antagonist [9].
Finally, thermodynamic studies can be employed to determine the relative contributions of enthalpy andentropy to a compound’s binding energy. The Gibbs free energy of binding (ΔGÞ is made up of enthalpic andentropic contributions and for reversible binding events can described as:
ΔG5ΔH2TΔS ð2:3Þwhere ΔH defines enthalpy and ΔS, entropy at temperature T.
The relationship between binding affinity (KD) and temperature (T) is defined by the Van’t Hoff equation:
lnðKDÞ5 ðΔH=RÞð1=TÞ2ΔS=R ð2:4Þ
Biacore Thermodynamic AnalysisBiacore Kinetic Analysis(A) (B)
SB203580 Z44571002
1/T (K–1)
ln(K
D)
0.0032 0.0034 0.0036–19
–18
–17
–16
–15
–14
SB 203580
Z44571002
50
40
30
20ΔRU
10
0
0
Compound Name
Z44571002
SB203580 1.7e6 ± 1.7e5
N
N NN
NN
O
HNF
SO
2.2e4 ± 3e2 0.001 ± 8.0e6
0.130 ± 0.014 7.8e – 8
5.2e – 8 – 40
– 43 – 36
– 75 – 35
7.5
k1 k2 KD ΔG ΔH TΔS
100Time (s)
200
(SB203580) (nM)7.815.631.362.51252505001000
FIGURE 2.4 Binding Assays: Kinetic and Thermodynamic Measurements. Direct binding assay using the Biacore label free technique.The sensorgram (A) illustrates the time course of SB203580 binding to immobilized mitogen activated kinase p38α. The y-axis shows the masschange resulting from compound binding to p38α. At t5 0 a range of SB203580 concentrations were passed across the immobilized p38α tomeasure net association, and then at t5 50 s compound is replaced with buffer to initiate dissociation. The table shows the association (k1(M21s21)) and dissociation (k2 (s21)) rate constants as well as the equilibrium dissociation constants (KD (M)) for two compounds. (B)Thermodynamic analysis of two p38α inhibitors using Biacore. Enthalpy and entropy components of binding derived from the Van’t Hoffanalysis are detailed in the attached table. ΔG, ΔH and TΔS values are in kJ/mol. Unpublished data.
20 2. THE BIOLOGICAL ACTIVITY OF COMPOUNDS
I. GENERAL ASPECTS OF MEDICINAL CHEMISTRY

where R is the Gas Constant. Thus by performing binding kinetics at different temperatures and then plotting ln(KD) data as a function of 1/T, the relative enthalpy and entropy contributions to the compound’s binding energycan be determined (Figure 2.4B). Such measurements allow chemistry to be steered towards optimization ofeither component or both. Generally in drug design, effort is focused on making optimal interactions (electro-static, H-bonding etc.) with the target (enthalpic), whilst rigidifying the compound to reduce conformational(entropic) contributions (i.e., reduction in rotational freedom on binding).
3. Enzyme Assays
Enzymes are highly specific biological catalysts evolved to perform a broad range of biochemical transforma-tions under physiological conditions. They operate in multiple locations (e.g., cytoplasmic, lysosomal, and extra-cellular) and under different spatial constraints (e.g., membrane bound, soluble, multimer). The reactionscatalyzed by enzymes range in complexity from simple one-step chemical oxidations (e.g., alcohol dehydroge-nase) to targeted, subtle protein modifications (e.g., kinases, methylases, etc.). The nature of an enzyme’s activityis driven by precise substrate recognition at the active site (where the catalysis takes place) and through otherregulatory sites.
Nearly all enzyme-targeted drugs are inhibitors, so most enzyme assays are designed to detect inhibitors bymeasuring the blockade of product production � substrate depletion is generally not used as the high startingbackground makes it technically more difficult. In order to develop an enzyme assay, one needs active and pureenzyme, substrates (e.g., protein, lipid, sugar, metabolite etc.), and a way to measure product formation and agood understanding of the optimal conditions for enzyme activity. Sufficient enzyme needs to be produced in afunctionally active state at high purity (.95 percent) and in large amounts (.10 mg). To achieve this, enzymesare expressed recombinantly at high levels in various cell systems with tags (e.g., histidines) attached to aid puri-fication. These tags are genetically encoded such that they are expressed at the C or N termini of the protein, dis-tal from the active site and so less likely to affect the enzyme’s activity. Once enzyme overexpression has beenachieved, the enzyme is purified from the lysed cells by affinity chromatography using the attached tag (e.g.,nickel column for his tag), followed by size exclusion (gel filtration) or pI (ion exchange). Enzyme production isnot always straightforward and can require considerable optimization to reproducibly deliver a highly pure andactive product. Substrates are usually commercially available, but if proteins, they may have to be made in thesame way as the enzyme target. There are many different ways to measure product formation (Table 2.2), but theguiding principles are summarized below:
• Most enzyme assay readouts are now:• Light-based (e.g., fluorescence, luminescence, absorbance, fluorescence polarisation, HTRF, etc.)• Homogeneous (i.e., no separation steps, e.g., AlphaScreen)• Scalable (amenable to 384-well plates and HTS)
• Rarely:• ELISA (multiple wash steps)• Radiometric or HPLC (usually for metabolite, small molecule products)
TABLE 2.2 Enzyme Assay Techniques
Enzyme class Product Principle Type Detection examples
Protein kinases PhosphoproteinPhosphoproteinADP
Labeled antibodyLabeled antibodyCoupling enzyme
HomogeneousMulti-stepMulti-step
AlphaLisaELISALuciferase (luminescent product)
Metabolic enzymes Small molecule• no chromophore• no antibody detection
RadioactivityRadioactivity/ProximityMass/chargeLipophilicity/chargeCoupling enzyme
Multi-stepHomogeneousHomogeneousMulti-stepMulti-step
RadiometricRadiometric (SPA)LC-MS (RapidFire)HPLCVariety (secondary product)
Methyltransferases MethylhistoneMethylhistoneH2O2
Formate
Labeled antibodyLabeled antibodyCoupling enzymeCoupling enzyme
HomogeneousMulti-stepMulti-stepMulti-step
AlphaLisaELISAPeroxidase (Light-based product)Variety (secondary product)
21III. IN VITRO ASSAYS
I. GENERAL ASPECTS OF MEDICINAL CHEMISTRY

The overall enzyme catalyzed reaction process is summarized below:
E1 S2ES2EP-E1P
where E (enzyme), S (substrate), ES (enzyme:substrate complexes), EP (enzyme:product complexes) and P (prod-uct). Enzyme reactions are generally studied under steady state conditions in which [S] is in excess of [E] and thereaction rate is linear—for most enzymes, [E] is nM and [S] is μM or mM. Initially upon addition of substrate toenzyme, only a very small percentage of total substrate is turned over and the rate is linear, but as more substrateis consumed it becomes rate-limiting and the enzyme velocity slows, usually when .10 percent substrate isused. The relationship between [S] and initial enzyme rate (v) was initially described by Briggs and Haldane [10]:
v5Vmax½S�½S�1Km
ð2:5Þ
Where Vmax is the maximal rate (when [S]c[E]) and Km is the Michaelis constant ([S] at which v is Vmax/2).In essence, enzyme assays are designed to optimally measure product formation and its inhibition by test com-
pounds (I). It is important to show that the rate of product formation is proportional to [E] over the time courseof the assay (i.e., steady state), so that a decrease in product rate by [I] relates directly to a reduction in active [E]due to inhibitor occupancy or indirect reduction in the number of substrate accessible active sites (i.e., formationof [EI]). Enzyme inhibitor mechanisms are discussed later on in Section IIIA (4). To minimize insolubility issuesduring dilution, compounds are usually dissolved in DMSO (anhydrous) to 10 mM and subsequently diluted inDMSO in half-logarithmic steps (usually 7) to produce a range of concentrations. These compound DMSOsolutions are then diluted in assay media (large dilution, e.g., 25-fold) and then into the assay (small dilution,e.g., 4-fold) such that the final assay [DMSO] is tolerated (typically ,1 percent (v/v)). Visual inspection forinsolubility can be easily monitored during this process and fed back to the project team.
As with receptor functional and binding assays, compound potency is usually measured using an IC50 value(or pIC50 (2log10IC50)) and typically determined from an eight point concentration inhibition curve using a fourparameter logistic fit:
%I5 Imin 1ðImax 2 IminÞ½I�n½I�n 1 ½IC50�n
ð2:6Þ
where Imax is the maximal inhibition (usually B100 percent), Imin the minimal inhibition (B0 percent) and n theslope of the curve.
Robert Copeland’s book, Evaluation of Enzyme Inhibitors in Drug Discovery is highly recommended furtherreading [11].
4. Types of Enzyme Inhibition and Their Analysis
A. REVERSIBLE INHIBITORS
The majority of enzyme inhibitor drugs are reversible in that removal of the inhibitor (e.g., by dialysis) fullyrestores the enzymatic activity. Such inhibitors bind to their target enzyme through a combination of noncovalentinteractions, such as hydrogen bonding or ionic, hydrophobic, and Van der Waals interactions, and don’t gener-ally undergo any chemical transformation while enzyme bound. Their behavior is described by the followingequation:
E1 I"EI
where E represents the active enzyme, I the reversible inhibitor, and EI the inactive inhibitor-bound enzyme.Examples of drugs that are reversible enzyme inhibitors and their mechanisms of action are shown in Table 2.3.
Testing for reversible inhibition relies on separation of the inhibitor from the inhibitor bound enzyme, whichcan be achieved using differences in enzyme and inhibitor mass (i.e., enzyme: .30 000 Da, inhibitor: B400 Da)using a variety of techniques (e.g., dialysis, gel filtration, ultracentrifugation, etc.). By reducing free [I], EI com-plex dissociates leading to the recovery of enzyme activity. It is important during the pre-incubation of inhibitorwith enzyme prior to reversibility that substrate is included to ensure the enzyme turns over and the inhibitor isexposed to all enzyme states during its catalytic cycle. Two common techniques to demonstrate reversibleenzyme inhibition are jump dilution and immobilization. In the former, enzyme is incubated with inhibitor at103 IC50 to giveB90 percent inhibition, and then, after sufficient time to allow EI formation, the mixture is rap-idly (“jump”) diluted 100-fold in assay buffer so that the final [I] is 10-fold below the IC50 such that if fully
22 2. THE BIOLOGICAL ACTIVITY OF COMPOUNDS
I. GENERAL ASPECTS OF MEDICINAL CHEMISTRY

reversible onlyB9 percent inhibition would be expected. In contrast, if the inhibitor is irreversible, the jump dilu-tion would have little effect on the enzyme-inhibitor complex and the enzyme’s activity would still be inhibitedby B90 percent. Technical assay conditions may need to be fine-tuned to ensure slow dissociation is examinedand that sufficient active enzyme is present post “jump” dilution. The immobilization technique depends on theability to irreversibly immobilize the enzyme in a 96-well plate such that sufficient activity is retained for inhibi-tor studies. Immobilized enzyme is incubated with inhibitor and substrate to determine the pre-wash IC50,followed by washing to remove substrate and inhibitor, then re-measurement of enzyme activity withsubstrate (post-wash). Figure 2.5 illustrates this, showing no change in IC50 with washing for a mechanism-based,2-thioxanthine, irreversible myeloperoxidase inhibitor [12], but complete loss of inhibition on washing with areversible inhibitor [13].
TABLE 2.3 Examples of Reversible Enzyme Inhibitor Drugs
Example Structure Target
CrestorCompetitive
HMG CoA Reductase
EnalaprilCompetitive
Angiotensin converting enzyme
EtoposideNoncompetitive
Topoisomerase II
PD 098059Noncompetitive
MEK
MethotrexateUncompetitive
Dihydrofolate reductase
LithiumUncompetitive
Li1 IMPase
23III. IN VITRO ASSAYS
I. GENERAL ASPECTS OF MEDICINAL CHEMISTRY

B. IRREVERSIBLE INHIBITORS
In some cases, enzymes can be irreversibly inhibited through formation of a covalent bond between theenzyme and the inhibitor. Such inhibition due to the inherent chemical reactivity of an inhibitor is usually toononspecific and promiscuous to be a useful drug mechanism. More commonly, irreversible drugs are specificallyrecognized by their target enzyme as “pseudo-substrates” and converted to reactive products that covalentlyinactivate the enzyme. This mechanism-based irreversible inhibition provides target selectivity by virtue of struc-tural recognition of the inhibitor by the enzyme and the specific chemistry of the enzyme’s active site.
E1 I"EI-E2 I
Irreversible inhibition is eventually “reversed” over days in vivo after inhibitor administration has stopped, bythe de novo synthesis of new enzyme to replace that inactivated by the inhibitor. Examples of drugs that are irre-versible enzyme inhibitors are shown in Table 2.4.
The advantages of an irreversible drug are that with time it will inhibit all the enzyme such that high potenciesand ligand efficiencies can easily be obtained, leading to long duration of action in vivo. Potential disadvantagesare a higher risk of poor specificity, inability to quickly reverse in vivo effects if required, a need for a more com-plex set of in vitro assays to drive SAR (i.e., IC50 isn’t sufficient on its own), and reactive inhibitor intermediatesformed during enzyme inactivation have the potential to react with other proteins to form immunogenicadducts.
C. COMPETITIVE INHIBITORS
Inhibitors can reversibly bind to the free form of the enzyme, to substrate-bound enzyme catalytic forms, or toboth, such that an inhibitor’s potency can have different relationships to [S]. This is summarized by the enzymeturnover reaction scheme in the presence and absence of reversible inhibitors in Figure 2.6A. If inhibitor and sub-strate binding are mutually exclusive (i.e., inhibitor and substrate cannot bind to the enzyme at the same time),the inhibitor is competitive with respect to that substrate. Hallmark features of a competitive inhibitor are anincrease in Km, but no effect on the Vmax as illustrated in Figure 2.6B. Competitive inhibitors generally bind atthe enzyme’s active site and compete with substrate for occupancy.
D. NONCOMPETITIVE INHIBITORS
A noncompetitive inhibitor exhibits affinity for both the free enzyme (E) and the enzyme-substrate complexesand thus is defined by two equilibrium constants, one for EI (Ki) and one for the ESI complex (αKi). α describesthe relative affinity of I for E and ES. For example, when α5 1, then I has equal affinity for E and ES. Key
100 100806040200
–20–40–60
%In
hibi
tion
%In
hibi
tion
80
60
40
20
0
(Compound) (M)
Pre wash
IrreversibleHN
O(A) (B)O
N
OOH Reversible
NH
NH
NH
S N N
HN
Post wash
(Compound) (M)
–2010–6 10–5 10–6 10–5
FIGURE 2.5 Reversibility of Enzyme Inhibition. MPO inhibition by an irreversible (A) and a reversible (B) inhibitor using plate-basedimmobilized enzyme and removal by washing. Inhibition curves are shown for both types of compound before (black circles) and after (redcircles) inhibitor removal. Unpublished data.
24 2. THE BIOLOGICAL ACTIVITY OF COMPOUNDS
I. GENERAL ASPECTS OF MEDICINAL CHEMISTRY

TABLE 2.4 Examples of Irreversible Enzyme Inhibitor Drugs
Drug Structure Target
Nexium H1/K1ATPase in gastric parietal cells
Allopurinol Xanthine oxidase
Ibrutinib Bruton’s tyrosine kinase
5-Fluorouracil Thymidylate synthase
KM
Ki
Vmax[S] Vmax[S]
[S] + KM[S] + KM
αKi
αKM
E + S
EI
100
75
50
Enz
yme
velo
city
Enz
yme
velo
city
25
0
100
75
α = 1
50
25
0–8 –7 –6
Log10(Substrate)–5 –4 –3 –8 –7 –6
Log10(Substrate)–5 –4 –3
1 +[I ]Ki
ESI
+ +
II
E + PESkcat
1 +[I ]
αKi1 +
[I ]Ki
ν = ν =
(A)
(B) (C)
FIGURE 2.6 Competitive and Noncompetitive Enzyme Inhibition. Equations and graphs illustrating a general enzyme reaction schemefor reversible inhibitors (A), the substrate dependency of the steady state velocity for an enzyme in the presence of a range of competitive (B),and noncompetitive (C) inhibitor concentrations.
25III. IN VITRO ASSAYS
I. GENERAL ASPECTS OF MEDICINAL CHEMISTRY
features of a noncompetitive inhibitor are no effect on substrate Km and a decrease in Vmax as illustrated inFigure 2.6C. Noncompetitive inhibitors tend to bind to the enzyme at sites distinct from the active site and exerttheir effects allosterically.
E. UNCOMPETITIVE INHIBITORS
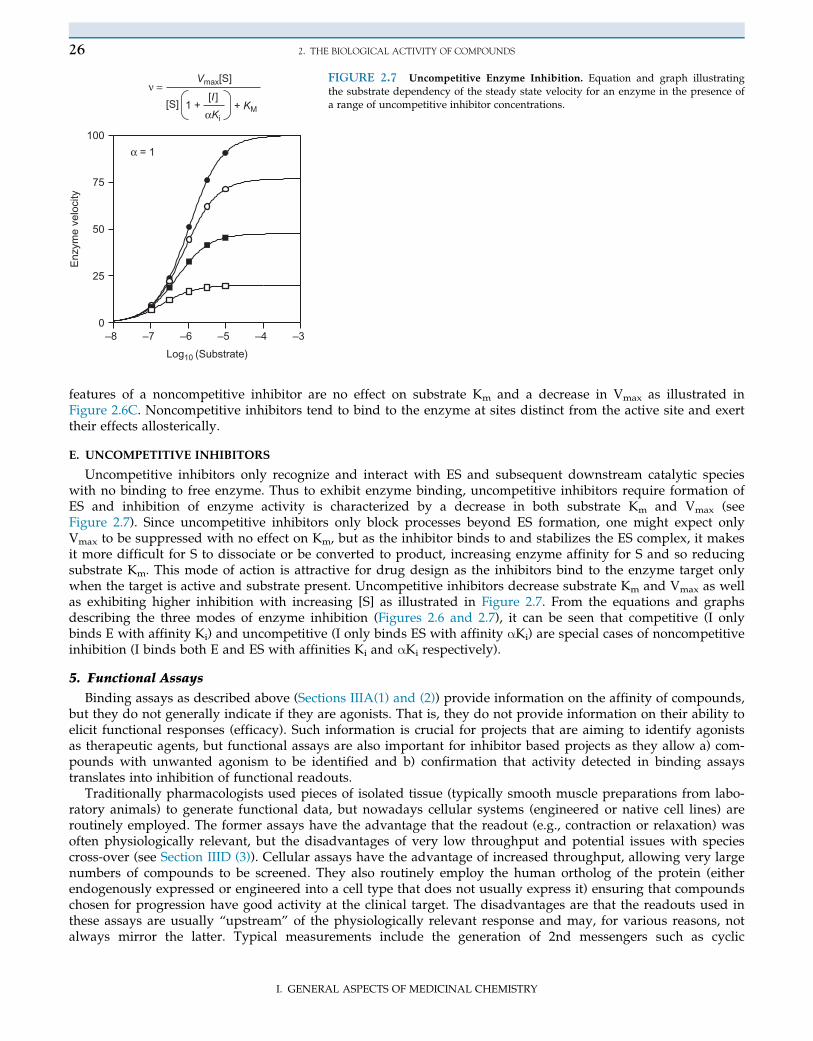
Uncompetitive inhibitors only recognize and interact with ES and subsequent downstream catalytic specieswith no binding to free enzyme. Thus to exhibit enzyme binding, uncompetitive inhibitors require formation ofES and inhibition of enzyme activity is characterized by a decrease in both substrate Km and Vmax (seeFigure 2.7). Since uncompetitive inhibitors only block processes beyond ES formation, one might expect onlyVmax to be suppressed with no effect on Km, but as the inhibitor binds to and stabilizes the ES complex, it makesit more difficult for S to dissociate or be converted to product, increasing enzyme affinity for S and so reducingsubstrate Km. This mode of action is attractive for drug design as the inhibitors bind to the enzyme target onlywhen the target is active and substrate present. Uncompetitive inhibitors decrease substrate Km and Vmax as wellas exhibiting higher inhibition with increasing [S] as illustrated in Figure 2.7. From the equations and graphsdescribing the three modes of enzyme inhibition (Figures 2.6 and 2.7), it can be seen that competitive (I onlybinds E with affinity Ki) and uncompetitive (I only binds ES with affinity αKi) are special cases of noncompetitiveinhibition (I binds both E and ES with affinities Ki and αKi respectively).
5. Functional Assays
Binding assays as described above (Sections IIIA(1) and (2)) provide information on the affinity of compounds,but they do not generally indicate if they are agonists. That is, they do not provide information on their ability toelicit functional responses (efficacy). Such information is crucial for projects that are aiming to identify agonistsas therapeutic agents, but functional assays are also important for inhibitor based projects as they allow a) com-pounds with unwanted agonism to be identified and b) confirmation that activity detected in binding assaystranslates into inhibition of functional readouts.
Traditionally pharmacologists used pieces of isolated tissue (typically smooth muscle preparations from labo-ratory animals) to generate functional data, but nowadays cellular systems (engineered or native cell lines) areroutinely employed. The former assays have the advantage that the readout (e.g., contraction or relaxation) wasoften physiologically relevant, but the disadvantages of very low throughput and potential issues with speciescross-over (see Section IIID (3)). Cellular assays have the advantage of increased throughput, allowing very largenumbers of compounds to be screened. They also routinely employ the human ortholog of the protein (eitherendogenously expressed or engineered into a cell type that does not usually express it) ensuring that compoundschosen for progression have good activity at the clinical target. The disadvantages are that the readouts used inthese assays are usually “upstream” of the physiologically relevant response and may, for various reasons, notalways mirror the latter. Typical measurements include the generation of 2nd messengers such as cyclic
Log10 (Substrate)
Enz
yme
velo
city
–8 –7 –6 –5 –4 –30
25
50
75
100
Vmax[S]
α = 1
[S] 1 +[I ]
+ KMαKi
ν =FIGURE 2.7 Uncompetitive Enzyme Inhibition. Equation and graph illustratingthe substrate dependency of the steady state velocity for an enzyme in the presence ofa range of uncompetitive inhibitor concentrations.
26 2. THE BIOLOGICAL ACTIVITY OF COMPOUNDS
I. GENERAL ASPECTS OF MEDICINAL CHEMISTRY

adenosine monophosphate (cAMP), Ca21, or inositol phosphates, and beta arrestin movement for GPCRs, ionfluxes or membrane potential changes for ion channels, and gene transcription for NHRs. The technologies formeasuring such readouts are constantly evolving but include FLIPRs, which uses a range of fluorescent dyes tomeasure changes in intracellular calcium concentration or membrane potential; antibody based technologies suchas AlphaLISA, which can be used to detect a range of substances including cAMP; and reporter gene assays,which use fluorescent or luminescent proteins under the control of target gene promoters to assess drug-inducedgene transcription. Again a major advantage of these technologies is their suitability for medium- to high-throughput screening. The nature of the readout can, however, generate difficulties in data analysis and inte-rpretation. For example, changes in intracellular Ca21 levels in response to agonists in FLIPRs assays are oftentransient in nature, which can result in failure to reach true equilibrium when potent competitive antagonists arestudied. In such hemi-equilibrium cases, the antagonists appear to be insurmountable, and this has the potentialto introduce errors into affinity estimations (see [14] and Section IIIA 6D).
6. Functional Studies and Their Analysis
By definition, functional studies involve analyzing agonist responses, either alone or in the presence of antago-nists (or inhibitors). Central to these analyses is the generation of agonist concentration-effect curves. Their defin-ing properties are described below. Subsequent sections describe the different classes of agonists and outlinehow their interaction with antagonists is analyzed to yield antagonist affinity estimates and MOA information.
A. AGONIST CONCENTRATION-EFFECT (E/[A]) CURVES
Agonist concentration-effect curves are typically sigmoidal (s-shaped) when plotted in semi-logarithmic form(E/log10[A]) and are described by four parameters: 1) a lower asymptote (β), which represents the basal state ofthe system; 2) an upper asymptote (α), which represents the maximum effect that the agonist produces in the sys-tem; 3) a location or potency ([A50] or EC50), which represents the concentration of agonist that produces an effectequal to 50 percent of α-β and 4) a slope parameter (n), which is a measure of the gradient of the curve at the[A50] level. A number of computational programs are available that allow estimates of these parameters to bemade by fitting experimental E/[A] curve data to the following form of the Hill equation (a saturable functionthat adequately describes curves of varying gradients):
E5 β1ðα2 βÞ½A�n½A�n 1 ½A50�n
ð2:7Þ
In practice, β5 0 in the majority of cases. That is, the basal effect level is ascribed a value of zero, and thereforemost E/[A] curve data can be adequately described by a 3-parameter Hill equation as illustrated in Figure 2.8. Itis the analysis of how the three curve parameters (α), [A]50, and n are affected by experimental manipulation thatallows drug-receptor interactions to be quantitatively described in terms of affinity (binding) and efficacy(response-eliciting capacity).
B. FULL AGONISTS, PARTIAL AGONISTS, AND INVERSE AGONISTS
The first step in agonist action is the formation of a reversible agonist-receptor (AR) complex, a process that isgenerally assumed to be governed by the Law of Mass Action. Accordingly, the equilibrium concentration of
0
20
40
60
80
100
–13 –12 –11 –10 –9 –8 –7
[TARC] (log10M)
% In
hibi
tion
of c
AM
Pα (Maximum = 82%)
[A]50 (Potency 0.1 nM)
n (slope = 1.0)
FIGURE 2.8 Agonist Concentration-Effect Curves. An agonist concentration-effect curve highlighting the parameters that define it: α (the maximum effect);[A50] (potency), the concentration of agonist that produces 50 percent of α; and n,a measure of the slope. [A50] values are often quoted as pA50 (2 log10[A50]). Inthis example, the [A50] is 10210 M and the pA50 is 10.0. Data shows TARC(CCL17) induced inhibitions of cAMP levels in CHO cells stably transfected withhuman CCR4. Unpublished data.
27III. IN VITRO ASSAYS
I. GENERAL ASPECTS OF MEDICINAL CHEMISTRY

agonist occupied receptors is a rectangular hyperbolic function (a special case of the Hill function where n5 1) ofthe agonist concentration (identical to Eq. (2.1)). This curve is defined by a maximal value of [Rtot], the totalreceptor concentration, and a midpoint value of KA, the agonist dissociation constant. KA determines how wellthe agonist binds; that is, it is a measure of the affinity of the agonist for its receptors. Agonist occupancy is sub-sequently amplified into functional effect by the biochemical/biophysical machinery of the cell/tissue, and this iswhat is measured experimentally in the form of an E/[A] curve. The efficiency of this transduction process canvary between agonists and across systems (i.e., it is both drug and tissue dependent). Agonist efficacy is a mea-sure of the efficiency of the transduction process. Full agonists have high efficacies and therefore can elicit themaximum effect (Emax) that the test system is capable of generating. Partial agonists by contrast have low efficacyand cannot elicit a maximum response (Figure 2.9).
Measuring the efficacy (and affinity) of full agonists is not straightforward because their occupancy is effi-ciently converted into effect and thus the [A50] is much lower than the KA. An experimental manipulation thatdecreases the efficacy of the agonist to a level where it behaves as a partial agonist (where [A50] approximatesKA) is therefore required. Irreversible antagonists have been used for this purpose as they covalently modifyreceptors, thereby decreasing [Rtot] (see Section IIIA 6D). An important consequence of efficacy being both adrug- and system-dependent parameter is that an agonist can demonstrate different behaviors in different sys-tems. Thus, a drug that exhibits partial agonism in one system may be a full agonist in another (with higher[Rtot] or more efficient transduction machinery) or effectively an antagonist in yet another (with lower [Rtot] orless efficient transduction machinery) (Figure 2.10).
As alluded to above, it can be difficult to measure the affinity and efficacy of agonists, and typically the infor-mation reported to the medicinal chemist is the potency ([A50] or, more often, pA50 (2log10[A50])) and the intrin-sic activity (IA) of the compound. The latter is a measure of the maximal activity of the test compound relative toa reference full agonist [16]. If the test agonist produces a maximum response less than the reference agonist,then the IA will be ,1.0. For example, in Figure 2.9 AR-C68397AA produces a maximum effect that is 69 percentof the reference full agonist isoprenaline, and thus is a partial agonist with an IA of 0.69. Such compounds are
Intrinsic activity =Max. 2
Max. 1
0
20
40
60
80
100
120
–10 –9 –8 –7 –6 –5[Agonist] (log10M)
% R
elax
atio
n
Isoprenaline (Full agonist)
AR-C68397AA (Partial agonist)
Maximum 2
Maximum 1= 0.69
FIGURE 2.9 Full Agonists, Partial Agonists and Intrinsic Activity.
Experimental data showing the β2-adrenoceptor mediated smooth musclerelaxing activity of the reference full agonist isoprenaline and the partialagonist AR-C68397AA in guinea pig isolated tracheal rings. The intrinsicactivity of AR-C68397AA was 0.69. Unpublished data.
Emax= 100n = 1τ = 100, 1, 0.1KA= 10–6 M
A(τ = 100)
B(τ = 1)
C(τ = 0.1)
Effe
ct
0
20
40
60
80
100
120
–10 –9 –8 –7 –6 –5 –4
[Agonist] (log10M)
FIGURE 2.10 System Dependence of Drug Effects. Simulated curvesshowing how the curve parameters of an agonist change in systems withvarying receptor expression. The receptor expression range is 1000-foldfrom curve A to curve C. In system A, the drug exhibits full agonism(IA5 1.0 and high efficacy (τ5 100)); in system B, it shows partial agonism(IA5 0.5 and low efficacy (τ5 1)); and in system C, it shows very weak par-tial agonism (IA5 0.09 and very low efficacy (τ5 0.1)). In system C thedrug effectively behaves as an antagonist as this level of IA is difficult todetect in most assay systems. The Operational Model of Agonism [15] wasused to simulate the data. In this model, τ is a measure of the efficacy ofthe agonist and incorporates both drug (intrinsic efficacy) and system(receptor number ([Rtot]) and coupling efficiency) parameters.
28 2. THE BIOLOGICAL ACTIVITY OF COMPOUNDS
I. GENERAL ASPECTS OF MEDICINAL CHEMISTRY

useful to the medicinal chemist as they help direct efforts to optimize the efficacy of compounds for therapeuticbenefit. For example, identification of partial agonists were important staging posts in the development of theantagonists propranolol and cimetidine [17,18]. Finally, it is important to emphasize that the IA scale does notdiscriminate between full agonists (i.e., all full agonists will have an IA of 1.0 but they may have differentefficacies).
Until relatively recently, agonist efficacy was considered only as a positive scalar associated with increasedreceptor activity. This dogma was challenged by the discovery of the phenomenon of constitutive receptor activa-tion and compounds that showed inverse agonism [19,20] That is, they decreased the level of constitutiveactivation, demonstrating negative efficacy (Figure 2.11). The most likely mechanism for inverse agonism is thatsuch compounds have a selectively higher affinity for the inactive state of the receptor and thereby uncouplespontaneously coupled (active) receptor species [21,22]. The existence of multiple receptor states also offers anexplanation for the phenomenon of “signaling bias or agonist trafficking,” whereby one agonist may direct sig-naling to a particular cascade while another agonist may not [23]. To date, inverse agonism has largely been aproperty detected in genetically engineered cells systems where receptors (or modified receptors) can beexpressed at supra-physiological levels. Many of the compounds that exhibit inverse agonism in such systemsbehave as competitive (neutral) antagonists with zero efficacy in more physiologically relevant assays. As such,the therapeutic relevance of inverse agonism remains largely unknown, but this now well-documented phenome-non has changed the way pharmacologists view drug-receptor interactions as well as resulting in there-classification of drugs that were formerly thought to be competitive antagonists (e.g., Ranitidine andPropranolol). Importantly, designing compounds with inverse agonist properties and/or signaling bias offers themedicinal chemist further opportunities in tailoring compounds to address unmet clinical needs. The advance-ment of a biased μ-opioid receptor agonist (TRV130) into clinical testing as an analgesic with low side-effectpotential serves as an example of how such new concepts of receptor function are being exploited [24].
C. OPTIMIZING AGONISTS
As discussed above, agonists bind to and activate receptors. The optimization of agonist properties thereforerelies on designing compounds with both good affinity and appropriate efficacy. Affinity can be measured inligand binding assays, but functional assays are required to provide estimates of IA or efficacy. In most cases, theaim of agonist based projects is to identify high potency, high efficacy agonists so that the drug dose ultimatelyadministered will be small and the effect large. In some instances however, partial agonists can have therapeuticadvantages. Thus, if the desirable therapeutic effect is observed in a tissue with high receptor number/couplingbut an undesirable side-effect is mediated in a tissue with low receptor number/coupling, a partial agonist ofappropriate efficacy could produce agonism in the former but be “silent” in the latter (compare curves A and Cin Figure 2.10). Finally, as described above, designing compounds that signal selectively through a particularpathway may provide further levels of therapeutic control.
D. ANALYSIS OF ANTAGONISTS
As with enzyme inhibitors, several different classes of antagonists with distinct mechanisms of action includ-ing irreversible competitive, reversible competitive, noncompetitive, and allosteric have been identified
(A)
KA
A + R AR (resting)
A + R* AR*(active)
KA
L
*
(B)
IsoprenalineDCILabetololPindololTimolol
–10 –9 –8 –7 –6 –5
[Ligand] (log10M)
pmol
cA
MP
/mg
prot
ein/
min
.
0
10
20
30
40
FIGURE 2.11 Inverse Agonism. (A) A simple two-state model in which the receptor exists in R (resting) orR� (active) states. In the absence of agonist (A), thedistribution of the two states is governed by the equilib-rium constant L. The agonist has affinities for the twostates governed by the dissociation equilibrium constants,KA and KA
�. (B) Production of cAMP in membranes ofSf9 cells expressing the human β2-adrenoceptor.Isoprenaline exhibits positive agonism but all the otherligands tested show varying degrees of inverse agonism(i.e., they decrease the basal level of cAMP production).Panel (B) reproduced with permission from Chidiac et al.,1994 [20].
29III. IN VITRO ASSAYS
I. GENERAL ASPECTS OF MEDICINAL CHEMISTRY

(Table 2.5). Their blockade of agonist-induced effects can be surmountable (rightward displacement of the E/[A]curve with no depression of the maximum (α)) or insurmountable (depression of the maximal agonist response(α)). It is important to realize that the profile of antagonism observed can show system dependence; that is, anantagonist can exhibit surmountable activity in one assay system and insurmountable activity in another, despitehaving the same mechanism of action (see Figure 2.14A and B). A common example of this phenomenon is thebehavior of high affinity competitive antagonists in FLIPRs assays in which the changes in intracellular calciumlevels measured are typically transient in nature. In these circumstances, true equilibrium is not reached as theagonist does not have sufficient time to access antagonist bound receptors resulting in apparentnonsurmountable antagonism [25,26]. This contrasts with the behavior of such antagonists in systems whereagonist responses are sustained (e.g., in many isolated tissue systems), true equilibrium is reached and theantagonism is surmountable.
The interaction of an antagonist with its receptors is described by a single parameter, affinity which equates topotency (unlike agonists where potency is dependent on both affinity and efficacy). By definition, antagonistshave an IA5 0 in functional assays, in which their affinity is measured by studying their receptor interactionwith an agonist. The affinity of antagonists can also be measured in binding assays (see Section IIIA (1)),
TABLE 2.5 Examples of Various Classes of Receptor Antagonists
Example Structure Target
IpratropiumCompetitive
M3-receptor
LosartanCompetitive
AT1-receptor
PhenoxybenzamineIrreversible
α-adrenoceptors (nonselective)
PicrotoxinNoncompetitive
GABAA-receptor
MaravirocAllosteric
CCR5
30 2. THE BIOLOGICAL ACTIVITY OF COMPOUNDS
I. GENERAL ASPECTS OF MEDICINAL CHEMISTRY

although if such systems are used it is essential to confirm lack of efficacy by subsequent testing in functionalassays. The following sections discuss the properties and analysis of the various classes of antagonists.
COMPETITIVE ANTAGONISTS Reversible competitive antagonists are probably the most important class ofantagonists, and a large number of clinically used drugs fall into this class. As outlined above for agonists, thefirst step in the action of these drugs is the formation of a reversible, relatively short-lasting, drug-receptor com-plex governed by the Law of Mass Action. In this mode of antagonism, the binding of the agonist and antagonistis mutually exclusive. The presence of the antagonist therefore decreases the probability that an agonist-receptorinteraction will occur. To achieve the same degree of agonist occupancy—and therefore the same effect—in thepresence of the antagonist as in its absence, the agonist concentration must be increased. The factor (r) by whichit must be increased depends on both the concentration of antagonist ([B]) used and on how well it binds (KB).This relationship, which was first described by Schild [27], is shown below:
r2 15 ½B�n=KB ð2:8Þwhere r5 [A50]/[A50]
c (location parameter of the E/[A] curve in the presence of the antagonist/location parame-ter of the E/[A] curve in the absence (c5 control) of the antagonist), KB is the antagonist equilibrium dissociationconstant, and n represents the stoichiometry of the interaction between the antagonist and the receptors (n5 1,when one molecule of antagonist binds to one receptor molecule).
Experimentally, a KB is estimated by studying the interaction of an agonist and antagonist over a wide range ofantagonist concentrations (the wider, the better). This is necessary because drugs which are not reversible competi-tive antagonists may appear to be so within a narrow range of concentrations. If the antagonist is truly competitive,it should produce parallel rightward displacement (i.e., no change in midpoint slope (n) occurs) of the E/log[A]curves with no change in the maximal response (α) (see Figure 2.12A). The analysis involves fitting experimentallyderived values of r at different concentrations of antagonist to the following form of Eq. (2.8) [28]. See Figure 2.12B.
log10ðr2 1Þ5nlog10½B�2 log10KB ð2:9ÞConsistency of the data with Eq. (2.9) is judged by the finding of a linear plot with a slope (n) of 1.0. Under
these conditions, the intercept on the x-axis (log10[B]) gives an estimate of KB. When n is significantly differentfrom 1, the intercept gives an estimate of pA2 (2log10KB/n). The pA2 is an empirical estimate of antagonist affin-ity and equates to the negative logarithm of the concentration of antagonist that produces a two-fold rightwardshift (r5 2) of the control E/[A] curve. Nonlinearity and slopes other than unity can result from many causes.For example, a slope of greater than 1 may indicate incomplete antagonist equilibration or removal of the antago-nist from the biophase (receptor compartment). A slope that is significantly less than 1 may indicate removal ofthe agonist by a saturable uptake process, or it may result from the interaction of the agonist with more than onereceptor. In the latter case, the Schild plot may be nonlinear with a clear inflexion. All of these potential compli-cating factors have been described in detail previously by Kenakin [29].
–11 –10 –9 –8 –7 –6 –5 –4
[AR–C68397AA] (log10M)
0
20
40
60
80
100
% R
elax
atio
n
Control3 nM ICI 118,55110 nM ICI 118,55130 nM ICI 118,551100 nM ICI 118,551
0
1
2
3
–10 –9 –8 –7 –6
[ICI 118,551] (log10M)
log 1
0(r–
1)
pKB = 9.1
(A) (B)
FIGURE 2.12 Competitive Antagonism in Functional Assays. Antagonism of the AR-C68397AA β2-adrenoceptor mediated relaxation ofrabbit isolated saphenous vein by the competitive antagonist ICI 118,551 (A). Note the concentration-dependent parallel rightward displacementof the control curves. (B) Illustrates the displacements (r values) in Schild plot form derived from one of the 5 experiments that make up in thedata in (A). The plot has a slope of unity and the intercept on the x-axis yields an estimate of 9.1 for the pKB (2log10KB). Unpublished data.
31III. IN VITRO ASSAYS
I. GENERAL ASPECTS OF MEDICINAL CHEMISTRY

Although Schild type analysis is the most robust method of assessing antagonist behavior in functional assays,the needs of modern high-throughput drug discovery programs dictate that it is used sparingly to assess themechanism of action for priority compounds. Routine screening of antagonist properties will more likely beassessed by doing a simpler functional Cheng-Prusoff type experiment (Figure 2.13) in which the effects of sev-eral concentrations of the test compound on the response to a single concentration of agonist are studied. Theexperimental data can then be fitted to the following equation [30]:
KB 5IC50
ð21ð½A�=½A50�ÞnÞ1=n 2 1ð2:10Þ
As was outlined above for binding studies, the estimated IC50 is dependent on the concentration of ligandemployed. In this case, the concentration of agonist ([A]) relative to its [A50] dictates the IC50 (and hence the esti-mated KB). Practically, the experimenter usually employs a concentration of agonist that is as close to the [A50] aspossible so that the IC50 is a good estimate of the KB. The shape of the agonist E/[A] curve is also important asevidenced by the inclusion of the slope parameter (n) in this form of the Cheng-Prusoff equation. When n5 1 theequation simplifies to a form equivalent to Eq. (2.2). Such analysis, although higher throughput, does not dis-criminate different modes of action of test compounds. For example, it will not differentiate competitive fromnoncompetitive compounds. Without additional proof that the interaction of agonist and antagonist is competi-tive, it is more appropriate to use the measured IC50 as a measurement of antagonist potency rather than calculat-ing a KB. As is the case with enzyme and binding assays the factor [A]/[A]50 should be kept constant so that IC50
values of different compounds can be easily compared.
IRREVERSIBLE, NONCOMPETITIVE, AND ALLOSTERIC ANTAGONISTS Several other forms of antagonists havebeen identified and will be discussed briefly. Irreversible antagonists form covalent bonds with the receptor pro-tein and thus prevent binding of agonists. They therefore effectively decrease the receptor pool and, by so doing,decrease the response eliciting capacity (efficacy) of the agonist, as this is dependent on [Rtot]. As equilibrium isnot attained, the antagonist affinity cannot be measured, but such agents (e.g., Phenoxybenzamine) form the basisof the receptor inactivation method developed by Furchgott [31] for estimating agonist affinities and efficacies.Practically, however, the reliance of this method on the availability of suitable alkylating agents excludes its usein most receptor systems.
Noncompetitive antagonists bind to receptors and make them functionally inoperative either by preclusion ofagonist binding (due to negligible dissociation of the antagonist during the response-gathering phase of theexperiment) or through some other biochemical mechanism that obviates agonist effect (e.g., pore blockade of ionchannels). Under these circumstances, increasing the agonist concentration cannot overcome the effect of theantagonist, and a distinctive feature of noncompetitive antagonists is the depressive effect they have on the
0
20
40
60
80
100
120
–8 –7 –6 –5 –4 –3
[Histamine] (log10M)
% H
ista
min
e M
ax.
pA50 = 5.8
Histamine H1–agonist in HeLa cells(FLIPR: Ca2+ readout)
(A) (B)
[A]/[A50] = 6.3pKB = 9.3
Antagonist Inhibition curve
KB =IC50
1 + [A]/[A50]
0
10000
20000
30000
–11 –10 –9 –8 –7 –6
FLI
PR
uni
ts
[Mepyramine] (log10M)
pIC50 = 8.4
Cheng–Prusoff correction
FIGURE 2.13 Cheng-Prusoff Analysis of Antagonism in Functional Assays. (A) Histamine concentration effect curve generated in HeLacells which endogenously express the human H1-receptor. 10 μM histamine (blue symbol) was chosen as the concentration of agonist to beused to assess the inhibitory effects of the H1-receptor antagonist mepyramine. (B) Mepyramine completely inhibited the Ca21 inducedhistamine response and yielded a pIC50 value of 8.4. As [A]/[A]50 was significantly greater than 1, the affinity (pKB) estimate (9.3) is consider-ably greater than the pIC50. Unpublished data.
32 2. THE BIOLOGICAL ACTIVITY OF COMPOUNDS
I. GENERAL ASPECTS OF MEDICINAL CHEMISTRY

maximal agonist response (α). The magnitude of the depression will however depend on the agonist under studyand the system used. This relates to the concept of receptor reserve whereby maximum agonist effects can beachieved at low levels of receptor occupancy (binding)—for example, 10 percent occupancy may be enough toproduce a maximum response and therefore there is a 90 percent receptor reserve. Receptor reserve depends onboth the receptor number ([Rtot]) and the efficiency of stimulus-response coupling as well as the intrinsic efficacyof the agonist. Hence, noncompetitive antagonists will have differing capabilities to depress the maximalresponse to the same agonist in different systems. The same will be true for different agonists in the same system.The potency of noncompetitive antagonists can be estimated using various models but as a “rule of thumb” thepA2 (2log[B]1 log (r2 1)), as defined above for competitive antagonists, gives a reasonably accurate estimate ofthe antagonist affinity (pKB) when measured at low levels of agonist response [14]. See Figure 2.14B.
All of the modes of antagonism described above are orthosteric; that is, the antagonist blocks access of the ago-nist to its binding site through steric hindrance. Allosteric antagonists in contrast bind to their own site on thereceptor to induce a change in conformation of the receptor, which in turn alters the affinity or efficacy of thereceptor for the agonist [33,34]. It is now clear that allosteric ligands can both increase and decrease the affinityand efficacy of other ligands, so allosteric modulators is a more appropriate term. Indeed, perhaps the bestknown therapeutically used allosteric modulators are the benzodiazepines, which increase the conductance of theGABAA receptor. One of the key properties of allosteric modulators is their saturability of effect, which can beevidenced in functional experiments such as Schild analysis where a curvilinear plot results (Figure 2.15).Similarly, in Cheng-Prusoff type analyses, such antagonists will produce less than 100 percent inhibition of theagonist response. This behavior results from the fact that while the allosterically modified receptor may havediminished affinity (and/or efficacy) for the agonist, the agonist can still produce receptor activation in thepresence of the modulator. As is evident from Figure 2.15B, use of concentration-ratios (r) at low antagonistconcentrations can yield reasonably accurate estimates of compound affinity.
Allosteric modulation offers a number of potential advantages over orthosteric antagonists. First, they canmodify (i.e., reduce or increase by a small amount) endogenous agonist signals without completely blockingthem, thus allowing fine-tuning of responses. Second, there is the potential to increase the duration of allostericeffect by loading the receptor compartment with large concentrations of modulator. Such large concentrationswill have no further effect than to prolong the saturated allosteric effect (i.e., the saturability of the allostericligand can be used to limit effect but increase duration). Another potential advantage of allosterism is increasedselectivity. Orthosteric antagonists often have limited selectivity across receptor subtypes. For example, most
Control
+ 3nM Antagonist
+ 10nM Antagonist
+ 30nM Antagonist
0
20
40
60
80
100
120
–9 –8 –7 –6 –5 –4 –3
[Agonist] (log10M)
Effe
ct
(A) (B)High receptor reserve(τ = 100)
Low receptor reserve(τ = 3)
0
20
40
60
80
–8 –7 –6 –5 –4 –3 –2
[Agonist] (log10M)
Effe
ct
r = 4.5pA2 = –log[B] + log (r–1)
= 8.5 + 0.54 = 9.04
r = 4.5
FIGURE 2.14 Noncompetitive Antagonism in Functional Assays. Simulations showing the effect of a noncompetitive antagonist onresponses to the same agonist in a system with high receptor reserve (A) or low receptor reserve (B). Increasing concentrations of the antago-nist (3, 10, 30 nM) cause more marked depression of the agonist maximum effect in the low reserve system. Data was simulated using a formof the Operational Model of agonism that assumes that antagonist binding precludes binding of the agonist [32]. The model parameters usedwere Em5 100, n5 1, τ5 100 (high reserve) or τ5 3 (low reserve), pKA5 5.0, pKB5 9.0. Estimates of the antagonist affinity (pKB) can be madeby fitting data directly to this model or approximated as pA252log[B]1 log(r2 1) when a concentration-ratio (r) measured at low responselevels is used (B).
33III. IN VITRO ASSAYS
I. GENERAL ASPECTS OF MEDICINAL CHEMISTRY

muscarinic receptor antagonists exhibit poor selectivity between the five known subtypes (M1�M5), presumablybecause they are competing with acetylcholine for very similar recognition sites. However, the surrounding pro-tein structure of the receptors are sufficiently different to offer the potential for selective stabilization of receptorconformations by allosteric modulators. These potential advantages of allosteric modulators remain largely theo-retical as very few such agents have to date reached the market. Nevertheless, the approval of the CCR5 antago-nist Maraviroc (Selzentrys) for the treatment of human immunodeficiency virus (HIV) infection demonstratedthe feasibility of this approach. This compound inhibits HIV entry by binding to a receptor site distinct fromwhere the viral gp120 envelope protein binds [36,37].
Finally, although the discussion above focuses on receptors, allosteric modulation of enzyme function is awell-known phenomenon. The availability of binding sites distinct from those for the substrate again offers thepotential for increased selectivity. For example, compounds designed to bind to an allosteric site in a particularprotein kinase are likely to have improved selectivity over compounds targeting the ATP binding site.
B. Compound Interference in Primary Assays: Artifacts and False Positives
Over the last decade, high throughput screening of large compound collections has been used to successfullyidentify new chemical starting points for drug discovery programs, notably the CCR5 antagonist Maraviroc.However, the identification of true actives (drugs that interact specifically with the target of interest) from a HTSoutput has in many cases been hampered by co-detection of large numbers of “active” compounds with eitherundesirable and/or nonselective mechanisms (i.e., false positives). Compounds can work in an assay nonspecifi-cally (i.e., not target related) through a variety of mechanisms, some of which are very easy to detect while othersare more intractable. This is briefly summarized in Table 2.6 and reviewed elsewhere [38].
Careful design of the primary assay and selection of compound library is therefore important in minimizingthe propensity to detect these undesirable promiscuous inhibitors. For example, the simple inclusion of detergentand/or protein in biochemical assays can have a profound effect on minimizing false positive detection [39].
C. Assay Biostatistics
It is not only important to understand how the biological properties of compounds are measured in variousin vitro assay systems but also to appreciate how consistently an assay performs. This is key to defining criteriafor validating compound test data, identifying SAR, and directing medicinal chemistry effort. Assay consistencyis usually measured by testing a standard compound (if one is available) and various controls (usually positiveand negative conditions to define signal-to-background) in each experiment. This is then used to monitor inter-assay performance on an experiment to experiment basis to ensure the assay can consistently measure the stan-dard compound and retain an acceptable assay window. Experiments are invalidated if the assay value for the
0
20
40
60
80
100
% In
hibi
tion
[Acetylcholine] (log10M)
–9 –8 –7 –6 –5 –4
(A) (B)
[Gallamine] (log10M)
–6 –5 –4 –3
Log 1
0(r-
1)
0
1
2
1.0
pKB = 6.03
0.65
α = 5.3 x10⁻³
FIGURE 2.15 Allosteric Antagonism. (A) The effects of acetylcholine (Ach) on the electrically evoked contractions of the guinea pig leftatrium in the absence (’) or presence of the allosteric modulator gallamine at the following concentrations: 10 μM (¢), 30 μM (£), 100 μM(V), 300 μM (&), and 500 μM (K). (B) The Schild plot of the data shown in (A). The solid line (slope5 1) denotes the behavior expected for acompetitive antagonist, whereas the dashed line shows the best fit linear regression (and associated slope factor) through the points. The curvethrough the points and associated parameter estimates represent the fit to an allosteric model. The estimated pKB was 6.03 and the α valueof 5.33 1023 equates to a gallamine-induced decrease in the affinity of ACh of 189-fold. Reproduced with permission from Christopoulos andKenakin, 2002 [35].
34 2. THE BIOLOGICAL ACTIVITY OF COMPOUNDS
I. GENERAL ASPECTS OF MEDICINAL CHEMISTRY

TABLE 2.6 Assay Interference Compounds
Property Typical structures Identification
Ease of
detection
Interference with assaysignal (e.g., fluorescent,singlet O2 quenchers)
e.g., Trypan Blue • Signal only counter-screen inabsence of target
• Chemical structure and properties
Easy
Irreversible proteindamage(e.g., oxidants)
e.g., Alkylidene barbiturates • Various redox assays• Chemical structure and properties
Easy
Reactivity (e.g., acylhalides)
• Time-dependent inhibition• Chemical structure and properties
Medium
Activity due to impurity Free metal ions • No SAR• Re-synthesis to high purity and
retest
Medium
Chemical instabilitya e.g., alloxan • Variable assay results that trackwith time after synthesis/dissolution
• Activity can be linked to instability• Compound stability assay by
LC/MS
Easy
Very low solubility(usually ,10 μM inaqueous)
e.g., nicardipine • Partial maximal inhibition due tolower free [compound] at hightotal concentrations
• Tendency for assay data at high[compound] to be more variable
• Test for solubility (light scatteringetc.)
• Increase assay [DMSO] if toleratedto improve solubility
• Assay signal interference due toinsolubility especially at high[compound]
Easy
Compound aggregationb,c e.g., Clotrimazole • Flat SAR, but not always• Nonselective within target class• Incomplete inhibition curves• No inhibition with detergent• Potency ranks with nanoparticle/
aggregate detection by DLS• Insensitive to [enzyme]• Noncompetitive• Can be time dependent
Difficult
aDorfmueller HC, Borodkin VS, Blair DE, Pathak S, Navratilova I, van Aalten DM. Substrate and product analogues as human O-GlcNAc transferase inhibitors. Amino Acids2010;40:781�92.bLaPlante SR, Carson R, Gillard J, Aubry N, Coulombe R, Bordeleau S, et al. Compound aggregation in drug discovery: Implementing a practical NMR assay for medicinalchemists J Med Chem 2013;56:51422 50.cSink R, Gobec S, Pecar S, Zega A. False positives in the early stages of drug discovery. Curr Med Chem 2010;17(34):4241.
35III. IN VITRO ASSAYS
I. GENERAL ASPECTS OF MEDICINAL CHEMISTRY

standard falls outside an acceptable range and/or the assay signal significantly changes. Typically a Z0 value [40]is routinely calculated to measure both the variability of the assay window (signal�background), the signal, andthe background values (Figure 2.16). For more detail see Assay Validation (http://www.ncbi.nlm.nih.gov/books/NBK83783/).
Control charts (Figure 2.17A) are used to monitor assay performance by tracking the standard compoundpEC50/pIC50 values over the duration of a drug discovery project. The 95 percent confidence interval indicatesthe range of pEC50 values within which the true population value can be expected to be found with 95 percent
Freq
uenc
y
3σc–
μc–
|μc+ – μc−| − (3σc+ + 3σc−) |μc+ – μc−| |μc+ – μc−|
= 1 –Z′ =(3σc+ + 3σc−)
μc+
Signal window
3σc+
Z′ values and high-throughput screening assays.
Z′ Value
Z′ = 1
1> Z′ ≥ 0.50.5 > Z′ > 00
< 0
Description of Assay
No variation (σ = 0)
σc+ and σc– touch
σc+ and σc– overlap
or infinite band of separationLarge dynamic rangeSmall dynamic rangeNo band of separation,
No band of separation,
Comments
Ideal assay
Excellent assayAdequate assayDubious quality
Impossiblefor screening
FIGURE 2.16 Assay Biostatistics: Z0 Values. Agraphical representation of variation of positive (C1)and negative (C2) assay signals and how they areused to calculate Z0 values. The table shows the guid-ing principles in using Z0 values to measure assay per-formance. Reproduced with permission from Kenakin [41].
Test occasions
pKi
0 20 40 60 80 100 120 140 160 180
8.0
8.2
8.4
8.6
8.8
9.0
9.2
Lower warning line
Upper warning line
10
10
6
2
0 5 10 15 20 25 30 35
(B)
(A)6
Fre
quen
cyF
requ
ency
2
7 7.5 8 8.5pEC50
EC50 : nM
9 9.5
FIGURE 2.17 Assay Biostatistics: Control Charts and Averaging Biological Data. (A) Control Chart. pKi values for a compound (y-axis)run as an assay quality control over a number of occasions (x-axis). Solid line is the arithmetic mean. The dotted lines (2x SD (95 percent)) anddashed lines (3x SD (99.7 percent)) on either side of the mean are the warning lines. Data points that drift beyond these warning lines indicateconcern over the quality of the assay data on these occasions. Unpublished data. (B) Log normal distribution of pEC50 values (upper panel)and skewed distribution of EC50 values (lower panel) converted from the same pEC50 values. Reproduced with permission from Kenakin [42].
36 2. THE BIOLOGICAL ACTIVITY OF COMPOUNDS
I. GENERAL ASPECTS OF MEDICINAL CHEMISTRY

certainty - this is generally a 3�4-fold range. Individual experiments in which the standard pEC50 falls outsidethis range should be investigated for any deviation in assay protocol, reagent batch, or process, and the experi-mental data rejected.
Overall an experiment is acceptable if the measured value (say IC50) for the standard falls within anacceptable potency range (i.e., mean6 95 percent C.I.) and Z0 . 0.5 for the signal and background values.
It is important to note that biological measurements are not always normally distributed and may need to betransformed prior to applying statistical tests to understand assay variability [43]. For example, IC50, EC50, Ki, etc.values are not normally distributed, so the mean IC50 of 10 μM and 100 μM is not the arithmetic mean, 55 μM,but the geometric mean, 32 μM. In contrast, pIC50, pEC50, pKi, etc. are usually normally distributed, so thesevalues should be used to interpret SAR and assay variability (e.g., SEM and SDn21) (Figure 2.17B).
A common question asked by the project chemist is, “What is the significant difference in potency betweencompound A and compound B as I need to know if compound A is more potent so I can design/synthesize thenext compounds based on this SAR?” The best answer to this is to determine the minimal significance ratio(MSR) ideally with a set of compounds with a broad range of potencies. Essentially, the MSR is the smallestpotency ratio between two compounds that is statistically significant. For a good assay, the MSR is ,3, meaningthat a 3-fold minimum in compound potency difference is significant. See http://www.ncbi.nlm.nih.gov/books/NBK83783/ for further detail on the experimental design and statistics behind an MSR calculation. Of course,determining the MSR depends on already having inhibitors with a range of potency and is generally performedin the assay development phase or when SAR unexpectedly changes or assay performance drifts.
D. Selectivity, Cytotoxicity, and Species Cross-over.
Before compounds are progressed to more complex in vitro assays and to in vivo testing, it is important toassess their selectivity, cytotoxicity liabilities, and activity at the target protein of the model species to be used.
1. Selectivity
Selectivity is typically initially tested at closely related family members of the target of interest. Thus if the tar-get was, for example, the purinoceptor P2Y12, then the activity of lead compounds at the other P2Y receptor sub-types would likely be assessed relatively early. As compounds are further optimized, selectivity screeningwidens and in this case might include other purinoceptors (P2X receptors and Adenosine receptors) and ulti-mately a large panel of receptors, enzymes, ion channels, and transporters. Such assays can either be established“in house” or outsourced to one of the many contract research organizations that offer such screening services.Practically, there is a technical and cost limitation to the number of selectivity assays that can be run, but it is notunusual for CDs to be tested in several hundred different assays. Such testing allows compounds with goodselectivity profiles to be identified, which greatly facilitates interpretation of data generated in more complex invitro systems and in vivo models. Ultimately, the hope is that good selectivity delivers clinical candidates withexcellent efficacy and minimal side-effects.
2. Cytotoxicity
A compound is cytotoxic when it damages the substructure or function of a cell, often leading to cell death,while toxicity generally refers to the damaging effects of compounds on whole organisms. Cytotoxicity is used totry to predict the in vivo toxicity of compounds and is often measured in parallel with drug target cell functionsto gauge how specific a compound is in affecting the desired cell function; the bigger the difference in compoundpotency between modulation of a desirable cell function and unwanted gross cytotoxicity, the better the com-pound. Cytotoxicity is most often determined by simply measuring the ability of a compound to kill cells, and avariety of methods are available (Table 2.7), each with different strengths and weaknesses (see [44] for furtherdetail). Assay selection is most often based on cost, throughput, technical capability, and target cell sensitivity.
3. Species Crossover
Usually—but not always—primary screening is carried out using the human version/ortholog of the targetprotein. This has the obvious advantage that compounds are screened against the ultimate target of clinical can-didates. This strategy does, however, necessitate that lead compounds are subsequently tested against the otherspecies that are typically used in drug discovery programs for both efficacy and toxicology testing. The mostcommon species employed are mice, rats, and dogs, but other species (guinea pigs, rabbits, mini-pigs, macaques,
37III. IN VITRO ASSAYS
I. GENERAL ASPECTS OF MEDICINAL CHEMISTRY

etc.) may also be used. In many cases, compounds have good activity at the target protein in these species andtherefore appropriate dosing regimens and straightforward data interpretation is possible. In instances (usuallyreceptor targets) where poor species cross-over is observed (low or no activity at the target in typically used spe-cies), it may be necessary to investigate less commonly used species or even to initiate a parallel chemistry effortto identify compounds that do have good species cross-over.
E. Cellular and Tissue Functional Responses
The initial in vitro characterization of test compounds is usually carried out in assay systems designed for sen-sitivity, speed, reproducibility, and cost rather than physiological or pathophysiological relevance (unless pheno-typic screening is being employed). The data generated is an important first stage in identifying interestingcompounds, but subsequent confirmation of activity in systems with better links to the targeted disease mecha-nism(s) is essential for compound progression. Differences in receptor number and/or coupling strength, com-pound penetration, and metabolism are among the factors that may vary between the primary and more diseaserelevant assays and can markedly change compound activity (see above). Positive data in the latter systems sig-nificantly increases confidence that lead compounds will modulate physiological processes implicated in humandisease. The systems employed will be target specific but often include a range of cellular and tissue assays.Typical examples of such assays include assessing the effects of compounds on the movement (chemotaxis) ofwhite blood cells for anti-inflammatory targets or on the tone of airway smooth muscle for bronchodilators(Figure 2.18). Such experiments can be complemented by ex vivo studies as described below and also aid in theinterpretation of in vivo experiments.
IV. EX VIVO ASSAYS
Ex vivo assays allow the effects of compounds to be studied in biological samples (e.g., tissues, blood, or cells)removed from intact animals or humans. Such experiments are very useful in that they provide evidence that thetarget and mechanism of action under study is operational in the species studied, as well as demonstrating drugabsorption and penetration to the desired site of action. Binding studies or functional studies can be used to mea-sure compound activity. For example, binding assays are often employed to measure receptor occupancy in brainsamples. A typical experiment might involve orally administering a test compound to rats at various doses (usu-ally a minimum of four doses plus vehicle is needed) and then terminating the animals at an appropriate timepost-dose. The whole brain (or relevant area) is then removed and homogenized and the ability of the test com-pound in the sample to inhibit the binding of a radio-ligand to the target of interest is measured. This allows thefractional occupancy of the test compound to be plotted as a function of dose administered. In the case of func-tional experiments, readouts such as up-regulation of adhesion molecules or shape change of inflammatory cellsin blood samples are typically used. Such readouts have the advantage that they can often also be employed inearly clinical trials as proof of mechanism biomarkers. This approach has been successfully applied to severalpotential anti-inflammatory targets including CXCR2, stimulation of which induces neutrophil activation. Lazaar
TABLE 2.7 Cytotoxicity Assay Guiding Principles
Cytotoxic principle Biomarker Detection Pros Cons
Cell metabolism unable to provide sufficient energy(in the form of ATP) for viable cell function
Intracellular [ATP] CellTiter-Glos SensitiveFastStable signalHTS
Expensive
Oxidative metabolism (mitochondrial) unable toprovide sufficient energy in the form of ATP forcell function
Dye reduction Alamar Blue(Resazarin)MTTWST
CheapFastHTS
Compoundinterference
Loss of plasma membrane integrity such thatintracellular enzymes leak out or extracellulardye leaks in
LDH/AK releaseTrypan Blue exclusion
ToxilLghtt EasyCheap
CompoundinterferenceCell counting, so lowthroughput
38 2. THE BIOLOGICAL ACTIVITY OF COMPOUNDS
I. GENERAL ASPECTS OF MEDICINAL CHEMISTRY

and colleagues [45] used CXCL1 (GRO)-induced up-regulation of the adhesion molecule CD11b to study theex vivo antineutrophilic effect of the oral CXCR2 antagonist, SB-656933, thereby allowing the effective dose of theantagonist to be estimated (Figure 2.19). By studying different time-points after dosing, ex vivo experiments canalso provide information on the duration of action of compounds.
V. IN VIVO ASSAYS
Compounds with suitable potency, efficacy, and selectivity at the primary target and that have shown activityin disease relevant in vitro systems also need to have good pharmacokinetics (PK) if they are to deliver in vivoefficacy and duration of action. To this end, compounds are routinely tested in a range of in vitro assays thatserve as models of drug absorption (e.g., Caco-2 cells), metabolism (e.g., rat microsomes, human hepatocytes,cytochrome P450 enzyme assays), and distribution (e.g., plasma protein and tissue binding) prior to in vivo
Human lung slices: Imaging of small airway function
Mig
ratio
n (%
cel
ls a
dded
)
Control
+ 1μM AR-C157573YY
[PGD2] (log10M)
0
10
20
30
40
–10.0 –9.0 –8.0 –7.0 –6.0
Chemotaxis of human Th2 cells
(B)
(A) FIGURE 2.18 Disease Relevant Cellular and Tissue
Functional Responses. (A) PGD2-induced migration ofhuman Th2 cells. These effects are mediated by the DP2
(CRTh2) receptor as evidenced by the blockade of theresponses with the selective DP2 receptor antagonist,AR-C157573YY (pA25 7.0). Unpublished data. (B)Carbachol (CCh)-induced constriction of a small airway(approximately 2mm in diameter) in a slice of humanlung. This response is mediated by the M3-muscarinicreceptor and explains the utility of M3-antagonists suchas Tiotropium in diseases such as COPD which arecharacterized by restricted airflow. Unpublished data.
1.2
1.1
1.0
0.9
0.8
0.7
Pea
k (0
–9h)
CD
IIb e
xpre
ssio
n (M
FS
)
0.6
0.5
0.40 100 200 300 400 500
Dose (mg)
600 700 800 900 1000 1100
FIGURE 2.19 Ex vivo Assays. Ex vivo assessment ofthe effect of the CXCR2 antagonist, SB-656933 on CD11bexpression on peripheral blood neutrophils followingstimulation of whole blood samples with 30 nM CXCL1. Adose-dependent inhibition of CD11b was observed reachingmaximum inhibition at concentrations of 400 mg SB-656933and above. Reproduced with permission from Lazaar et al.,2011 [45].
39V. IN VIVO ASSAYS
I. GENERAL ASPECTS OF MEDICINAL CHEMISTRY
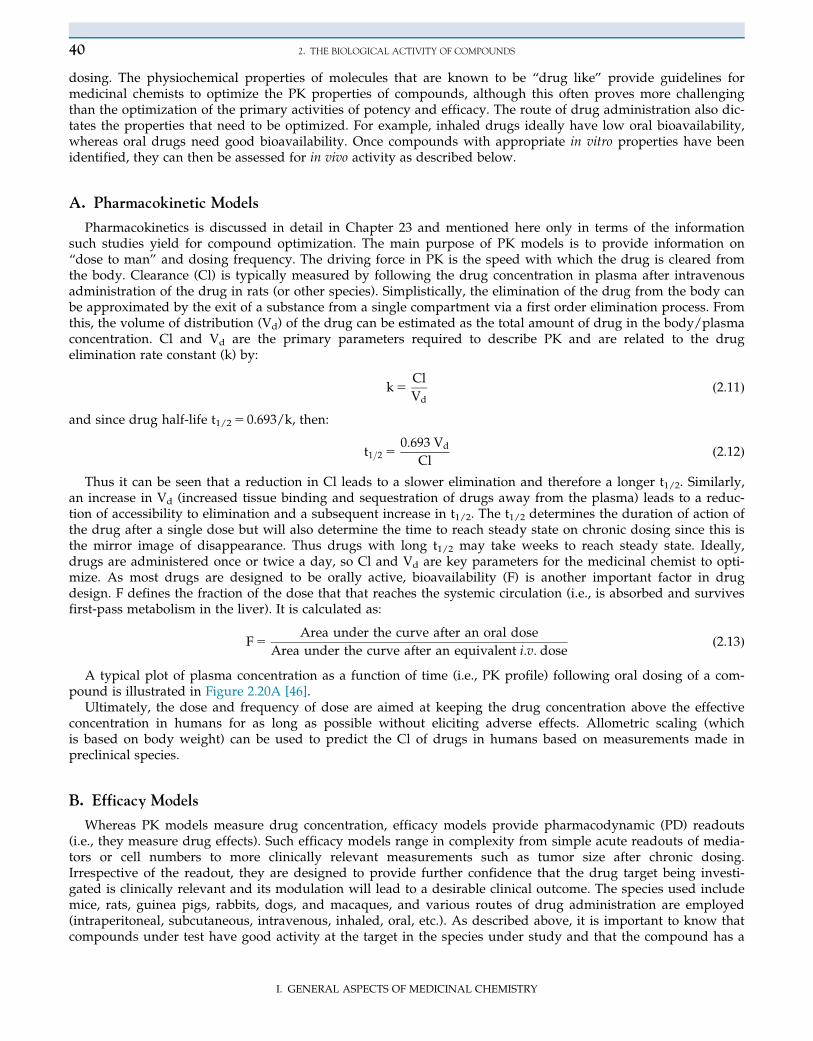
dosing. The physiochemical properties of molecules that are known to be “drug like” provide guidelines formedicinal chemists to optimize the PK properties of compounds, although this often proves more challengingthan the optimization of the primary activities of potency and efficacy. The route of drug administration also dic-tates the properties that need to be optimized. For example, inhaled drugs ideally have low oral bioavailability,whereas oral drugs need good bioavailability. Once compounds with appropriate in vitro properties have beenidentified, they can then be assessed for in vivo activity as described below.
A. Pharmacokinetic Models
Pharmacokinetics is discussed in detail in Chapter 23 and mentioned here only in terms of the informationsuch studies yield for compound optimization. The main purpose of PK models is to provide information on“dose to man” and dosing frequency. The driving force in PK is the speed with which the drug is cleared fromthe body. Clearance (Cl) is typically measured by following the drug concentration in plasma after intravenousadministration of the drug in rats (or other species). Simplistically, the elimination of the drug from the body canbe approximated by the exit of a substance from a single compartment via a first order elimination process. Fromthis, the volume of distribution (Vd) of the drug can be estimated as the total amount of drug in the body/plasmaconcentration. Cl and Vd are the primary parameters required to describe PK and are related to the drugelimination rate constant (k) by:
k5Cl
Vdð2:11Þ
and since drug half-life t1/25 0.693/k, then:
t1=2 50:693 Vd
Clð2:12Þ
Thus it can be seen that a reduction in Cl leads to a slower elimination and therefore a longer t1/2. Similarly,an increase in Vd (increased tissue binding and sequestration of drugs away from the plasma) leads to a reduc-tion of accessibility to elimination and a subsequent increase in t1/2. The t1/2 determines the duration of action ofthe drug after a single dose but will also determine the time to reach steady state on chronic dosing since this isthe mirror image of disappearance. Thus drugs with long t1/2 may take weeks to reach steady state. Ideally,drugs are administered once or twice a day, so Cl and Vd are key parameters for the medicinal chemist to opti-mize. As most drugs are designed to be orally active, bioavailability (F) is another important factor in drugdesign. F defines the fraction of the dose that that reaches the systemic circulation (i.e., is absorbed and survivesfirst-pass metabolism in the liver). It is calculated as:
F5Area under the curve after an oral dose
Area under the curve after an equivalent i:v: doseð2:13Þ
A typical plot of plasma concentration as a function of time (i.e., PK profile) following oral dosing of a com-pound is illustrated in Figure 2.20A [46].
Ultimately, the dose and frequency of dose are aimed at keeping the drug concentration above the effectiveconcentration in humans for as long as possible without eliciting adverse effects. Allometric scaling (whichis based on body weight) can be used to predict the Cl of drugs in humans based on measurements made inpreclinical species.
B. Efficacy Models
Whereas PK models measure drug concentration, efficacy models provide pharmacodynamic (PD) readouts(i.e., they measure drug effects). Such efficacy models range in complexity from simple acute readouts of media-tors or cell numbers to more clinically relevant measurements such as tumor size after chronic dosing.Irrespective of the readout, they are designed to provide further confidence that the drug target being investi-gated is clinically relevant and its modulation will lead to a desirable clinical outcome. The species used includemice, rats, guinea pigs, rabbits, dogs, and macaques, and various routes of drug administration are employed(intraperitoneal, subcutaneous, intravenous, inhaled, oral, etc.). As described above, it is important to know thatcompounds under test have good activity at the target in the species under study and that the compound has a
40 2. THE BIOLOGICAL ACTIVITY OF COMPOUNDS
I. GENERAL ASPECTS OF MEDICINAL CHEMISTRY

PK profile that allows adequate target coverage for the duration of the PD model. In instances where theortholog of the human target does not exist in mice or it has a different function, it may be possible to employtransgenic animals or xenografts. An example of the former approach is the transgenic expression of humanICAM-1 in mice allowing them to be infected with human rhinovirus (mouse ICAM-1 does not recognizerhinoviruses that infect humans) [47]. In the cancer field, xenografts of human tumor cells grown in mice arewidely used models. Although a vast range of models are available, it should be recognized that many ofthe efficacy models routinely employed in drug discovery programs are somewhat poor predictors of clinicalefficacy. Rather, they allow the investigators to study the effects of drugs on particular mechanisms of actionthat may (or may not) be relevant to the clinical disease being targeted. As an example, bleomycin-inducedlung inflammation and fibrosis is widely employed as a model to study the effects of drugs aimed at treatingidiopathic pulmonary fibrosis (IPF) (Figure 2.20B) [46]. Whereas the resultant lung pathology has some similar-ity with that observed in IPF, profound inflammation precedes the fibrosis, a sequence of events that does notappear to occur in the human disease. Nevertheless such models allow compound activity to be optimized andbuilds confidence that in vitro activity is indicative of in vivo activity. Ideally, compound dose-response infor-mation is generated over a wide dose range (just as it should be in in vitro studies), allowing estimations ofED50 or ID50 (effective doses of agonists or antagonists/inhibitors producing 50 percent of the maximumresponse) values and maximum effects to be generated and compared with in vitro estimates. PK measure-ments made during efficacy models allow PK-PD relationships to be further explored which assists in refining“dose to man” estimates made from prior PK studies.
Finally, for some diseases, useful animal models do not exist or are poorly characterized, necessitating pro-gression of drugs straight to the clinic from in vitro testing. CF is a good example of this in that compounds thatcorrect or potentiate CFTR function in vitro and that have good PK can readily be assessed for activity in humansusing surrogates of CFTR function such as nasal potential difference or skin sweat chloride.
C. Safety Testing
At the end of drug discovery and prior to going into human clinical studies, regulatory authorities (e.g., FDAand EMA) have to be convinced that a potential new drug is safe as well as efficacious. To achieve this, data are
Time (hours)
100
10
1
0.1
0.01
0.0011 2 4 8 16 24
3000(A) (B)
2500
2000
1500
1000
500
0Veh. 0 10 30
#
60
AM966 (mg·kg–1)
+ BLM
Dex.
BA
LF c
olla
gen
(μg·
ml–
1 )
AM
966
plas
ma
conc
(μM
)
FIGURE 2.20 In vivo Assays. (A) PK profile of the LPA1 receptor antagonist, AM699, after oral (10 mg/kg) administration to mice. Thedashed line represents the IC50 value for AM699 mediated inhibition of LPA responses in CHO cells expressing the murine LPA1 receptor.The profile indicates that at doses of 10 mg/kg and above, the compound provides IC50 coverage for $ 8 hours. (B) The efficacy of AM699 ina mouse 14-day bleomycin model. The compound was administered twice a day for 14 days and soluble collagen measured in the bronchoal-veolar lavage fluid as a marker of fibrosis (at day 14). Dexamethasone was included as a comparative compound since steroids are used astreatments for IPF despite their dubious efficacy. Reproduced with permission from Swaney et al., 2010 [46].
41V. IN VIVO ASSAYS
I. GENERAL ASPECTS OF MEDICINAL CHEMISTRY
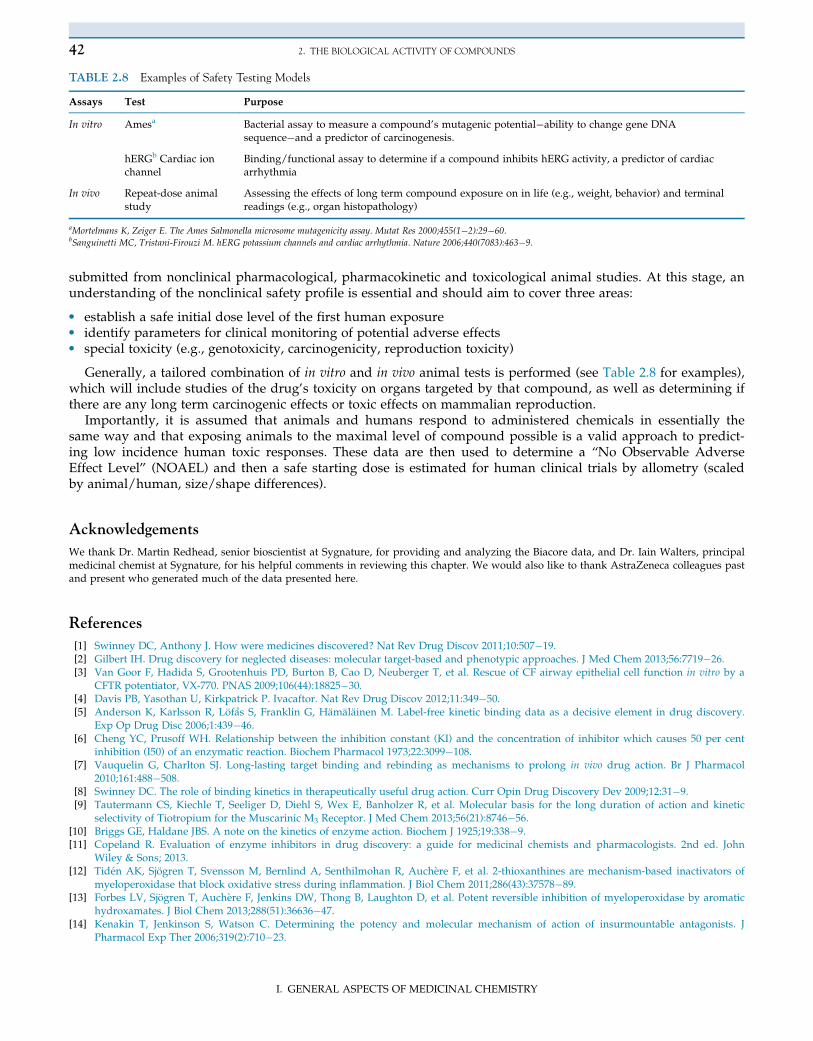
submitted from nonclinical pharmacological, pharmacokinetic and toxicological animal studies. At this stage, anunderstanding of the nonclinical safety profile is essential and should aim to cover three areas:
• establish a safe initial dose level of the first human exposure• identify parameters for clinical monitoring of potential adverse effects• special toxicity (e.g., genotoxicity, carcinogenicity, reproduction toxicity)
Generally, a tailored combination of in vitro and in vivo animal tests is performed (see Table 2.8 for examples),which will include studies of the drug’s toxicity on organs targeted by that compound, as well as determining ifthere are any long term carcinogenic effects or toxic effects on mammalian reproduction.
Importantly, it is assumed that animals and humans respond to administered chemicals in essentially thesame way and that exposing animals to the maximal level of compound possible is a valid approach to predict-ing low incidence human toxic responses. These data are then used to determine a “No Observable AdverseEffect Level” (NOAEL) and then a safe starting dose is estimated for human clinical trials by allometry (scaledby animal/human, size/shape differences).
Acknowledgements
We thank Dr. Martin Redhead, senior bioscientist at Sygnature, for providing and analyzing the Biacore data, and Dr. Iain Walters, principalmedicinal chemist at Sygnature, for his helpful comments in reviewing this chapter. We would also like to thank AstraZeneca colleagues pastand present who generated much of the data presented here.
References
[1] Swinney DC, Anthony J. How were medicines discovered? Nat Rev Drug Discov 2011;10:507�19.[2] Gilbert IH. Drug discovery for neglected diseases: molecular target-based and phenotypic approaches. J Med Chem 2013;56:7719�26.[3] Van Goor F, Hadida S, Grootenhuis PD, Burton B, Cao D, Neuberger T, et al. Rescue of CF airway epithelial cell function in vitro by a
CFTR potentiator, VX-770. PNAS 2009;106(44):18825�30.[4] Davis PB, Yasothan U, Kirkpatrick P. Ivacaftor. Nat Rev Drug Discov 2012;11:349�50.[5] Anderson K, Karlsson R, Lofas S, Franklin G, Hamalainen M. Label-free kinetic binding data as a decisive element in drug discovery.
Exp Op Drug Disc 2006;1:439�46.[6] Cheng YC, Prusoff WH. Relationship between the inhibition constant (KI) and the concentration of inhibitor which causes 50 per cent
inhibition (I50) of an enzymatic reaction. Biochem Pharmacol 1973;22:3099�108.[7] Vauquelin G, Charlton SJ. Long-lasting target binding and rebinding as mechanisms to prolong in vivo drug action. Br J Pharmacol
2010;161:488�508.[8] Swinney DC. The role of binding kinetics in therapeutically useful drug action. Curr Opin Drug Discovery Dev 2009;12:31�9.[9] Tautermann CS, Kiechle T, Seeliger D, Diehl S, Wex E, Banholzer R, et al. Molecular basis for the long duration of action and kinetic
selectivity of Tiotropium for the Muscarinic M3 Receptor. J Med Chem 2013;56(21):8746�56.[10] Briggs GE, Haldane JBS. A note on the kinetics of enzyme action. Biochem J 1925;19:338�9.[11] Copeland R. Evaluation of enzyme inhibitors in drug discovery: a guide for medicinal chemists and pharmacologists. 2nd ed. John
Wiley & Sons; 2013.[12] Tiden AK, Sjogren T, Svensson M, Bernlind A, Senthilmohan R, Auchere F, et al. 2-thioxanthines are mechanism-based inactivators of
myeloperoxidase that block oxidative stress during inflammation. J Biol Chem 2011;286(43):37578�89.[13] Forbes LV, Sjogren T, Auchere F, Jenkins DW, Thong B, Laughton D, et al. Potent reversible inhibition of myeloperoxidase by aromatic
hydroxamates. J Biol Chem 2013;288(51):36636�47.[14] Kenakin T, Jenkinson S, Watson C. Determining the potency and molecular mechanism of action of insurmountable antagonists. J
Pharmacol Exp Ther 2006;319(2):710�23.
TABLE 2.8 Examples of Safety Testing Models
Assays Test Purpose
In vitro Amesa Bacterial assay to measure a compound’s mutagenic potential�ability to change gene DNAsequence�and a predictor of carcinogenesis.
hERGb Cardiac ionchannel
Binding/functional assay to determine if a compound inhibits hERG activity, a predictor of cardiacarrhythmia
In vivo Repeat-dose animalstudy
Assessing the effects of long term compound exposure on in life (e.g., weight, behavior) and terminalreadings (e.g., organ histopathology)
aMortelmans K, Zeiger E. The Ames Salmonella microsome mutagenicity assay. Mutat Res 2000;455(1�2):29�60.bSanguinetti MC, Tristani-Firouzi M. hERG potassium channels and cardiac arrhythmia. Nature 2006;440(7083):463�9.
42 2. THE BIOLOGICAL ACTIVITY OF COMPOUNDS
I. GENERAL ASPECTS OF MEDICINAL CHEMISTRY

[15] Black JW, Leff P. Operational models of pharmacological agonism. Proc R Soc Lond [Biol] 1983;220:141�62.[16] Ariens EJ. Affinity and intrinsic activity in the theory of competitive inhibition. I. Problems and theory. Arch Int Pharmacodyn Ther
1954;99(1):32�49.[17] Stapleton MP. Sir James Black and propranolol. The role of the basic sciences in the history of cardiovascular pharmacology. Texas Heart
Inst J 1997;24:336�42.[18] Parsons ME. Histamine H2-receptor antagonists. In: Leff P, editor. Receptor based drug design, vol. 89. New York: Marcel Dekker, Inc;
1998. p. 195�206.[19] Costa T, Herz A. Antagonists with negative intrinsic activity at delta opioid receptors coupled to GTP-binding proteins. Proc Natl Acad
Sci USA 1989;86:7321�5.[20] Chidiac P, Hebert TE, Valiquette M, Dennis M, Bouvier M. Inverse agonist activity of beta-adrenergic antagonists. Mol Pharmacol
1994;45:490�9.[21] Leff P. The two-state model of receptor activation. Trends Pharmacol Sci 1995;16:89�97.[22] Bennett KA, Tehan B, Lebon G, Tate CG, Weir M, Marshall FH, et al. Pharmacology and structure of isolated conformations of the adeno-
sine A2A receptor define ligand efficacy. Mol Pharmacol 2013;83:949�58.[23] Kenakin T, Williams M. Defining and characterizing drug/compound function. Biochem Pharmacol 2014;87:40�63.[24] Soergel DG, Subach RA, Burnham N, Lark MW, James IE, Sadler BM, et al. Biased agonism of the mu opioid receptor by TRV130
increases analgesia and reduces on-target adverse effects versus morphine: a randomized, double-blind placebo-controlled crossoverstudy in healthy volunteers. Pain 2014;155(9):1829�35.
[25] Miller TR, Witte DG, Ireland LM, Kang CH, Roch JM, Masters JN, et al. Analysis of apparent non-competitive responses to competitiveH(1)-histamine receptor antagonists in fluorescent imaging plate reader-based calcium assays. J Biomol Screen 1999;4:249�58.
[26] Charlton SJ, Vauquelin G. Elusive equilibrium: the challenge of interpreting receptor pharmacology using calcium assays. Br J Pharmacol2010;161:1250�65.
[27] Schild HO. pAx and competitive drug antagonism. Br J Pharmacol 1949;4:277�80.[28] Arunlakshana O, Schild HO. Some quantitative uses of drug antagonists. Br J Pharmacol 1959;14:48�58.[29] Kenakin TP. The Schild regression in the process of receptor classification. Can J Physiol Pharmacol 1982;60:249�65.[30] Leff P, Dougall IG. Further concerns over Cheng-Prusoff analysis. Trends Pharmacol Sci 1993;14:110�12.[31] Furchgott RF. The use of β-haloalkylamines in the differentiation of receptors and in the determination of dissociation constants of receptor-
agonist complexes. In: Harper NJ, Simmonds AB, editors. Advances in Drug Research, 3. New York: Academic Press; 1966. p. 21�55.[32] Schmidt JA, Bell FM, Akam E, Marshall C, Dainty IA, Heinemann A, et al. Biochemical and pharmacological characterization of
AZD1981, an orally available selective DP2 antagonist in clinical development for asthma. Br J Pharmacol 2013;168(7):1626�38.[33] Urwyler S. Allosteric modulation of family C G-protein-coupled receptors: from molecular insights to therapeutic perspectives.
Pharmacol Rev 2011;63:59�126.[34] Muller CE, Schiedel AC, Baqi Y. Allosteric modulators of rhodopsin-like G protein-coupled receptors: opportunities in drug develop-
ment. Pharmacol Ther 2012;135:292�315.[35] Christopoulos A, Kenakin T. G protein-coupled receptor allosterism and complexing. Pharmacol Rev 2002;54:323�74.[36] Muniz-Medina VM, Jones S, Maglich JM, Galardi C, Hollingsworth RE, Kazmierski WM, et al. The relative activity of “function sparing”
HIV-1 entry inhibitors on viral entry and CCR5 internalization: Is allosteric functional selectivity a valuable therapeutic property? MolPharmacol 2009;75:490�501.
[37] Scholten DJ, Canals M, Maussang D, Roumen L, Smit MJ, Wijtmans M, et al. Pharmacological modulation of chemokine receptor func-tion. Br J Pharmacol 2012;165:1617�43.
[38] Shoichet BK. Screening in a spirit haunted world. Drug Discov Today 2006;11(13�14):607�15.[39] Ryan AJ1, Gray NM, Lowe PN, Chung CW. Effect of detergent on “promiscuous” inhibitors. J Med Chem 2003;46(16):3448�51.[40] Zhang J-H, Chung TD, Oldenburg KR. A simple statistical parameter for use in evaluation and validation of high throughput screening
assays. J. Biomol Screening 1999;4:67�72.[41] Kenakin TP. A pharmacology primer: Theory, applications, and methods. 3rd ed. Elsevier Academic Press; 2009. p 149�77.[42] Kenakin TP. A pharmacology primer: Theory, applications, and methods. 3rd ed. Elsevier Academic Press; 2009. p 1�19.[43] Hancock AA, Bush EN, Stanisic D, Kyncl JJ, Lin CT. Data normalization before statistical analysis: keeping the horse before the cart.
Trends Pharmacol Sci 1988;9(1):29�32.[44] Peternel L, Kotnik M, Prezelj A, Urleb U. Comparison of 3 cytotoxicity screening assays and their application to the selection of novel
antibacterial hits. J Biomol Screen 2009;14(2):142�50.[45] Lazaar AL, Sweeney LE, MacDonald AJ, Alexis NE, Chen C, Tal-Singer R. SB-656933, a novel CXCR2 selective antagonist, inhibits ex vivo
neutrophil activation and ozone-induced airway inflammation in humans. Br J Clin Pharmacol 2011;72(2):282�93.[46] Swaney JS, Chapman C, Correa LD, Stebbins KJ, Bundey RA, Prodanovich PC, et al. A novel, orally active LPA(1) receptor antagonist
inhibits lung fibrosis in the mouse bleomycin model. Br J Pharmacol 2010;160:1699�713.[47] Bartlett NW, Walton RP, Edwards MR, Aniscenko J, Caramori G, Zhu J, et al. Mouse models of rhinovirus-induced disease and exacerba-
tion of allergic airway inflammation. Nat Med 2008;14(2):199�204.
43REFERENCES
I. GENERAL ASPECTS OF MEDICINAL CHEMISTRY