Chapter 2 Corrosion basics and computer modeling · Corrosion basics and computer modeling V.G....
33
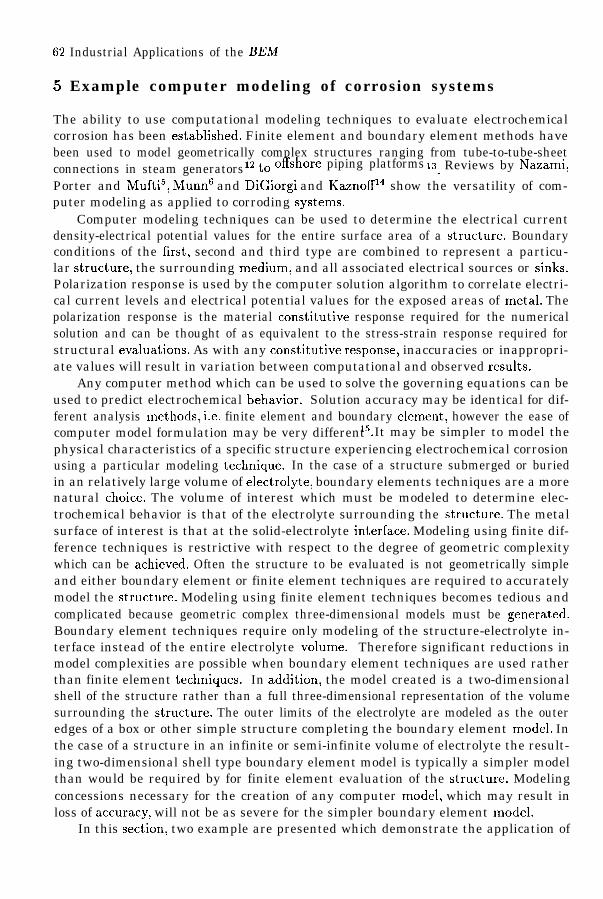
Chapter 2 Corrosion basics and computer modeling V.G. DeGiorgi Naval Research Laboratory, Department of the Navy, Washington D. C. 203755000, U.S.A. 1. A layman’s overview of corrosion 1.1 The cost of corrosion Corrosion is the destruction of material resulting from exposure and interaction with the environment. While common usage typically associates corrosion with metals, the destruction of non-metallic materials as a result of exposure to the environment can be considered corrosion; the disintegration of plastics when exposed to sunlight and the rotting of wood are examples of non-metallic corrosion. However, the concern of this chapter is corrosion of metals, especially electrochemical corrosion, and the ability to use computer modeling techniques to predict corrosion. Corrosion is a natural phenomenon which exists as part of our everyday life. In extreme situations catastrophic failures such as sudden collapse can result when corro- sion caused damage undermines the load bearing capability of a structure. Corrosion damage can also result in life threatening situations which are not as dramatic as structural collapse such as contamination by corrosion products from lead piping re- sulting in possible toxic levels of lead in drinking water supplies. The cost of corrosion damage is felt by industry, government and individuals re- gardless of gross earnings, political system or life styles. Repair or replacement costs for bridges and other highway structures are a major cost incurred by regional govern- ments. Repair and replacement costs are incurred by any industry which uses metal structures in processing or storage facilities. Individuals are subject to direct costs related to repair or replacement of personal property, such as automobiles or home hot water heaters, and to indirect costs in the form of higher taxes or higher product prices which result from government and industry costs. Corrosion is a major problem which must be addressed for safety, environment and economic reasons. Safety concerns are paramount in any situation. Environmen-
Transcript of Chapter 2 Corrosion basics and computer modeling · Corrosion basics and computer modeling V.G....
Chapter 2
Corrosion basics and computer modeling
V.G. DeGiorgi
Naval Research Laboratory, Department of the Navy, WashingtonD. C. 203755000, U.S.A.
1. A layman’s overview of corrosion
1.1 The cost of corrosion
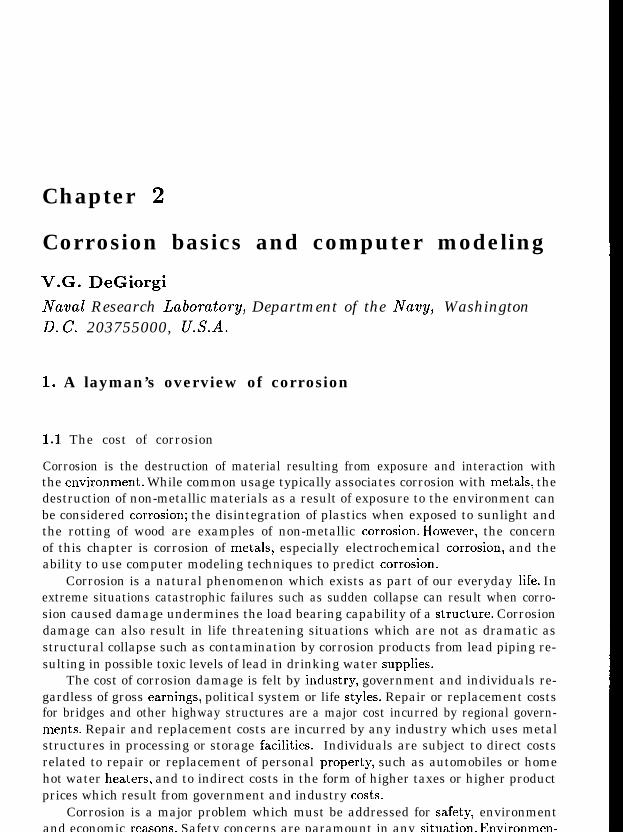
Corrosion is the destruction of material resulting from exposure and interaction withthe environment. While common usage typically associates corrosion with metals, thedestruction of non-metallic materials as a result of exposure to the environment canbe considered corrosion; the disintegration of plastics when exposed to sunlight andthe rotting of wood are examples of non-metallic corrosion. However, the concernof this chapter is corrosion of metals, especially electrochemical corrosion, and theability to use computer modeling techniques to predict corrosion.
Corrosion is a natural phenomenon which exists as part of our everyday life. Inextreme situations catastrophic failures such as sudden collapse can result when corro-sion caused damage undermines the load bearing capability of a structure. Corrosiondamage can also result in life threatening situations which are not as dramatic asstructural collapse such as contamination by corrosion products from lead piping re-sulting in possible toxic levels of lead in drinking water supplies.
The cost of corrosion damage is felt by industry, government and individuals re-gardless of gross earnings, political system or life styles. Repair or replacement costsfor bridges and other highway structures are a major cost incurred by regional govern-ments. Repair and replacement costs are incurred by any industry which uses metalstructures in processing or storage facilities. Individuals are subject to direct costsrelated to repair or replacement of personal property, such as automobiles or homehot water heaters, and to indirect costs in the form of higher taxes or higher productprices which result from government and industry costs.
Corrosion is a major problem which must be addressed for safety, environmentand economic reasons. Safety concerns are paramount in any situation. Environmen-
,.
48 Industrial Applications of the BEM
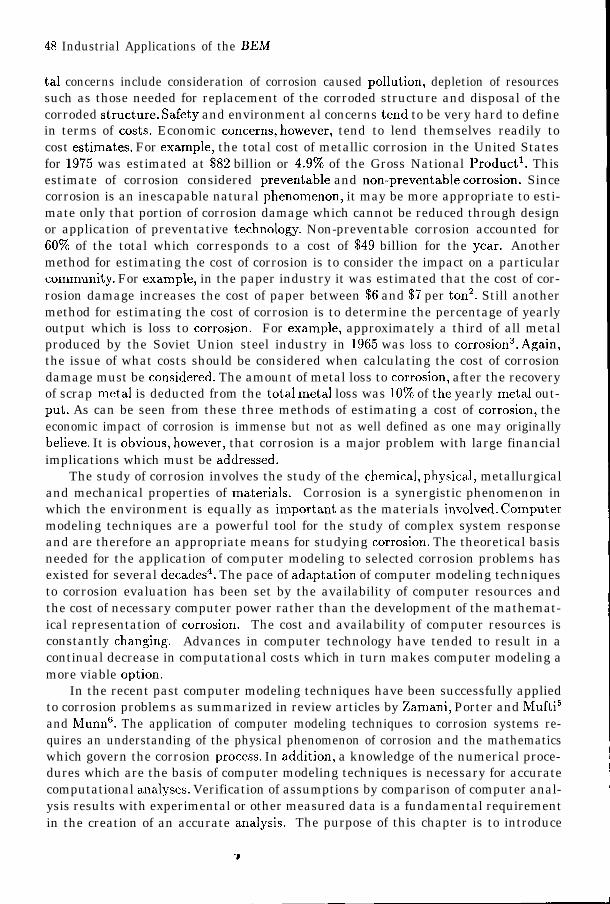
tal concerns include consideration of corrosion caused pollution, depletion of resourcessuch as those needed for replacement of the corroded structure and disposal of thecorroded structure. Safety and environment al concerns tend to be very hard to definein terms of costs. Economic concerns, however, tend to lend themselves readily tocost estimates. For example, the total cost of metallic corrosion in the United Statesfor 1975 was estimated at $82 billion or 4.9% of the Gross National Productl. Thisestimate of corrosion considered preventable and non-preventable corrosion. Sincecorrosion is an inescapable natural phenomenon, it may be more appropriate to esti-mate only that portion of corrosion damage which cannot be reduced through designor application of preventative technology. Non-preventable corrosion accounted for60% of the total which corresponds to a cost of $49 billion for the year. Anothermethod for estimating the cost of corrosion is to consider the impact on a particularcommunity. For example, in the paper industry it was estimated that the cost of cor-rosion damage increases the cost of paper between $6 and $7 per tonz. Still anothermethod for estimating the cost of corrosion is to determine the percentage of yearlyoutput which is loss to corrosion. For example, approximately a third of all metalproduced by the Soviet Union steel industry in 1965 was loss to corrosion. Again,the issue of what costs should be considered when calculating the cost of corrosiondamage must be considered. The amount of metal loss to corrosion, after the recoveryof scrap metal is deducted from the total metal loss was 10% of the yearly metal out-put. As can be seen from these three methods of estimating a cost of corrosion, theeconomic impact of corrosion is immense but not as well defined as one may originallybelieve. It is obvious, however, that corrosion is a major problem with large financialimplications which must be addressed.
The study of corrosion involves the study of the chemical, physical, metallurgicaland mechanical properties of materials. Corrosion is a synergistic phenomenon inwhich the environment is equally as important as the materials involved. Computermodeling techniques are a powerful tool for the study of complex system responseand are therefore an appropriate means for studying corrosion. The theoretical basisneeded for the application of computer modeling to selected corrosion problems hasexisted for several decades4. The pace of adaptation of computer modeling techniquesto corrosion evaluation has been set by the availability of computer resources andthe cost of necessary computer power rather than the development of the mathemat-ical representation of corrosion. The cost and availability of computer resources isconstantly changing. Advances in computer technology have tended to result in acontinual decrease in computational costs which in turn makes computer modeling amore viable option.
In the recent past computer modeling techniques have been successfully appliedto corrosion problems as summarized in review articles by Zamani, Porter and Mufti5and Munn6. The application of computer modeling techniques to corrosion systems re-quires an understanding of the physical phenomenon of corrosion and the mathematicswhich govern the corrosion process. In addition, a knowledge of the numerical proce-dures which are the basis of computer modeling techniques is necessary for accuratecomputational analyses. Verification of assumptions by comparison of computer anal-ysis results with experimental or other measured data is a fundamental requirementin the creation of an accurate analysis. The purpose of this chapter is to introduce
Corrosion basics and computer modeling 49
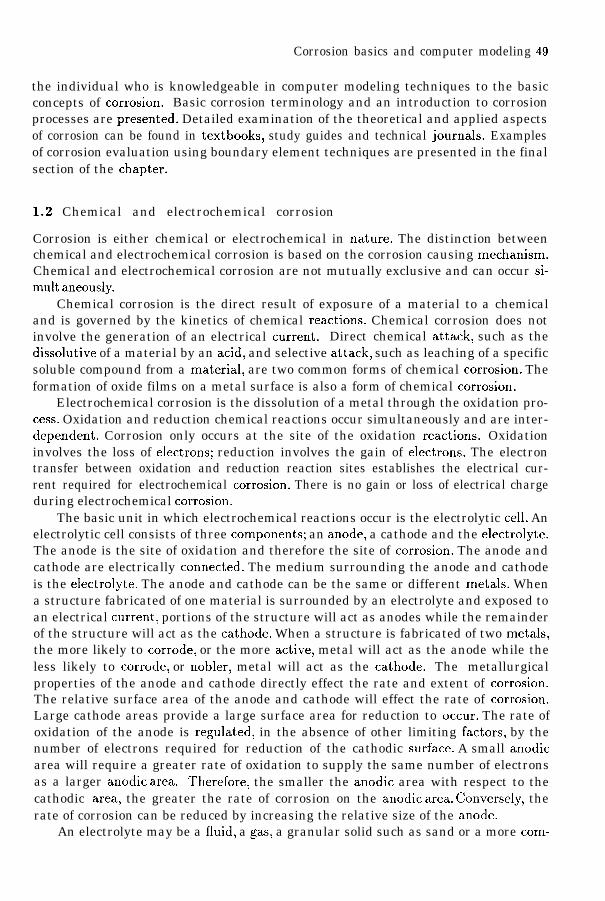
the individual who is knowledgeable in computer modeling techniques to the basicconcepts of corrosion. Basic corrosion terminology and an introduction to corrosionprocesses are presented. Detailed examination of the theoretical and applied aspectsof corrosion can be found in textbooks, study guides and technical journals. Examplesof corrosion evaluation using boundary element techniques are presented in the finalsection of the chapter.
1.2 Chemical and electrochemical corrosion
Corrosion is either chemical or electrochemical in nature. The distinction betweenchemical and electrochemical corrosion is based on the corrosion causing mechanism.Chemical and electrochemical corrosion are not mutually exclusive and can occur si-mult aneously.
Chemical corrosion is the direct result of exposure of a material to a chemicaland is governed by the kinetics of chemical reactions. Chemical corrosion does notinvolve the generation of an electrical current. Direct chemical attack, such as thedissolutive of a material by an acid, and selective attack, such as leaching of a specificsoluble compound from a material, are two common forms of chemical corrosion. Theformation of oxide films on a metal surface is also a form of chemical corrosion.
Electrochemical corrosion is the dissolution of a metal through the oxidation pro-cess. Oxidation and reduction chemical reactions occur simultaneously and are inter-dependent. Corrosion only occurs at the site of the oxidation reactions. Oxidationinvolves the loss of electrons; reduction involves the gain of electrons. The electrontransfer between oxidation and reduction reaction sites establishes the electrical cur-rent required for electrochemical corrosion. There is no gain or loss of electrical chargeduring electrochemical corrosion.
The basic unit in which electrochemical reactions occur is the electrolytic cell. Anelectrolytic cell consists of three components; an anode, a cathode and the electrolyte.The anode is the site of oxidation and therefore the site of corrosion. The anode andcathode are electrically connected. The medium surrounding the anode and cathodeis the electrolyte. The anode and cathode can be the same or different metals. Whena structure fabricated of one material is surrounded by an electrolyte and exposed toan electrical current, portions of the structure will act as anodes while the remainderof the structure will act as the cathode. When a structure is fabricated of two metals,the more likely to corrode, or the more active, metal will act as the anode while theless likely to corrode, or nobler, metal will act as the cathode. The metallurgicalproperties of the anode and cathode directly effect the rate and extent of corrosion.The relative surface area of the anode and cathode will effect the rate of corrosion.Large cathode areas provide a large surface area for reduction to occur. The rate ofoxidation of the anode is regulated, in the absence of other limiting factors, by thenumber of electrons required for reduction of the cathodic surface. A small anodicarea will require a greater rate of oxidation to supply the same number of electronsas a larger anodic area. Therefore, the smaller the anodic area with respect to thecathodic area, the greater the rate of corrosion on the anodic area. Conversely, therate of corrosion can be reduced by increasing the relative size of the anode.
An electrolyte may be a fluid, a gas, a granular solid such as sand or a more com-
50 Industrial Applications of the BEM
plex solid and fluid combination such as a saturated or partially saturated soil. Thecomposition and conducting properties of the electrolyte effect the rate and extent ofcorrosion. Environmental conditions such as temperature, humidity for gases, watercontent for soils and pressure effect the rate and extent of corrosion.
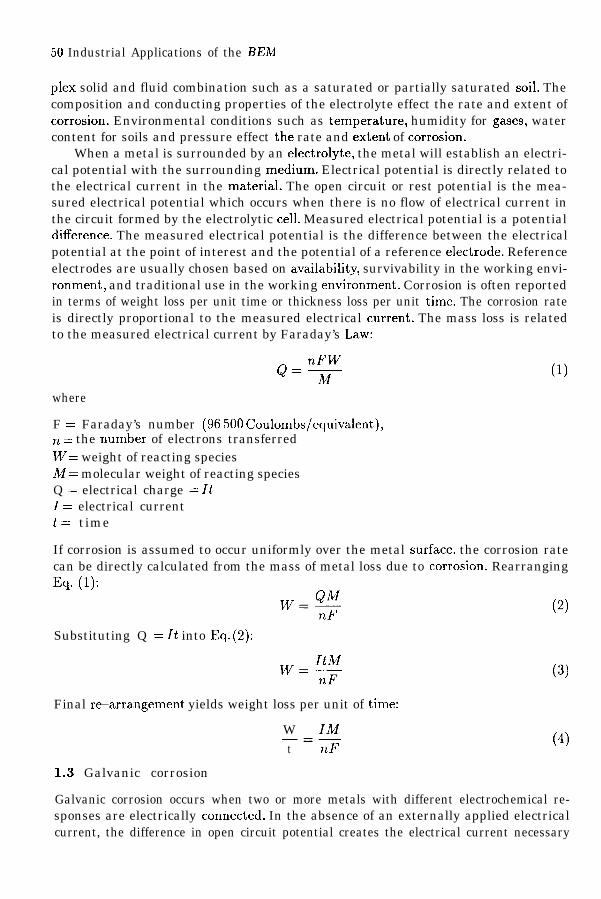
When a metal is surrounded by an electrolyte, the metal will establish an electri-cal potential with the surrounding medium. Electrical potential is directly related tothe electrical current in the material. The open circuit or rest potential is the mea-sured electrical potential which occurs when there is no flow of electrical current inthe circuit formed by the electrolytic cell. Measured electrical potential is a potentialdifference. The measured electrical potential is the difference between the electricalpotential at the point of interest and the potential of a reference electrode. Referenceelectrodes are usually chosen based on availability, survivability in the working envi-ronment, and traditional use in the working environment. Corrosion is often reportedin terms of weight loss per unit time or thickness loss per unit time. The corrosion rateis directly proportional to the measured electrical current. The mass loss is relatedto the measured electrical current by Faraday’s Law:
nFWQ=T
where
F = Faraday’s number (96 500 Coulombs/equivalent),~ = the number of electrons transferredW= weight of reacting speciesM= molecular weight of reacting speciesQ = electrical charge = It1 = electrical currentt = time
(1)
If corrosion is assumed to occur uniformly over the metal surface, the corrosion ratecan be directly calculated from the mass of metal loss due to corrosion. RearrangingEq. (l):
(2)
Substituting Q = It into Eq. (2):
(3)
Final re-arrangement yields weight loss per unit of time:
W IA4—=—t
(4)nF
1.3 Galvanic corrosion
Galvanic corrosion occurs when two or more metals with different electrochemical re-sponses are electrically connected. In the absence of an externally applied electricalcurrent, the difference in open circuit potential creates the electrical current necessary
Corrosion basics and computer modeJing 51
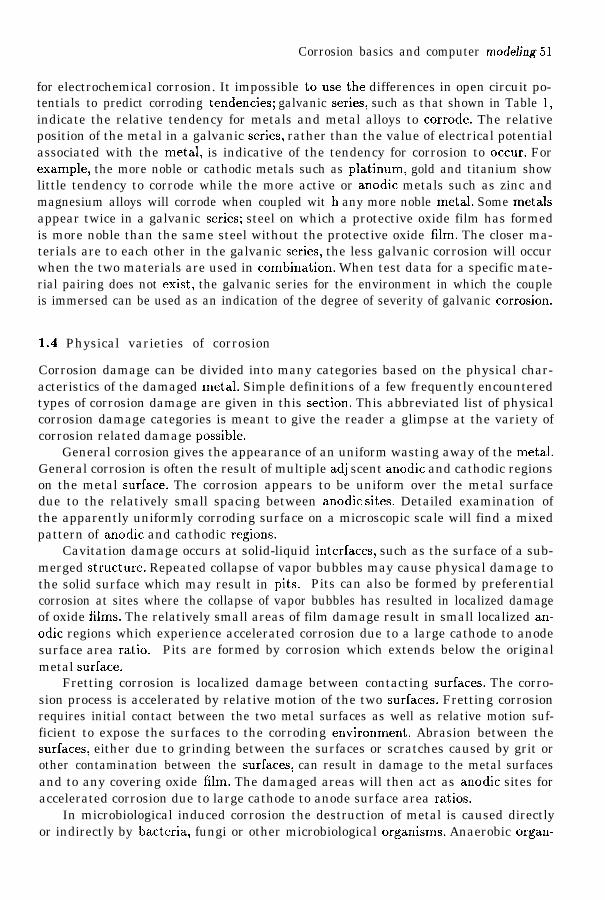
for electrochemical corrosion. It impossible tousethe differences in open circuit po-tentials to predict corroding tendencies; galvanic series, such as that shown in Table 1,indicate the relative tendency for metals and metal alloys to corrode. The relativeposition of the metal in a galvanic series, rather than the value of electrical potentialassociated with the metal, is indicative of the tendency for corrosion to occur. Forexample, the more noble or cathodic metals such as platinum, gold and titanium showlittle tendency to corrode while the more active or anodic metals such as zinc andmagnesium alloys will corrode when coupled wit h any more noble metal. Some metalsappear twice in a galvanic series; steel on which a protective oxide film has formedis more noble than the same steel without the protective oxide film. The closer ma-terials are to each other in the galvanic series, the less galvanic corrosion will occurwhen the two materials are used in combination. When test data for a specific mate-rial pairing does not exist, the galvanic series for the environment in which the coupleis immersed can be used as an indication of the degree of severity of galvanic corrosion.
1.4 Physical varieties of corrosion
Corrosion damage can be divided into many categories based on the physical char-acteristics of the damaged metal. Simple definitions of a few frequently encounteredtypes of corrosion damage are given in this section. This abbreviated list of physicalcorrosion damage categories is meant to give the reader a glimpse at the variety ofcorrosion related damage possible.
General corrosion gives the appearance of an uniform wasting away of the metal.General corrosion is often the result of multiple adj scent anodic and cathodic regionson the metal surface. The corrosion appears to be uniform over the metal surfacedue to the relatively small spacing between anodic sites. Detailed examination ofthe apparently uniformly corroding surface on a microscopic scale will find a mixedpattern of anodic and cathodic regions.
Cavitation damage occurs at solid-liquid interfaces, such as the surface of a sub-merged structure. Repeated collapse of vapor bubbles may cause physical damage tothe solid surface which may result in pits. Pits can also be formed by preferentialcorrosion at sites where the collapse of vapor bubbles has resulted in localized damageof oxide films. The relatively small areas of film damage result in small localized an-odic regions which experience accelerated corrosion due to a large cathode to anodesurface area ratio. Pits are formed by corrosion which extends below the originalmetal surface.
Fretting corrosion is localized damage between contacting surfaces. The corro-sion process is accelerated by relative motion of the two surfaces. Fretting corrosionrequires initial contact between the two metal surfaces as well as relative motion suf-ficient to expose the surfaces to the corroding environment. Abrasion between thesurfaces, either due to grinding between the surfaces or scratches caused by grit orother contamination between the surfaces, can result in damage to the metal surfacesand to any covering oxide film. The damaged areas will then act as anodic sites foraccelerated corrosion due to large cathode to anode surface area ratios.
In microbiological induced corrosion the destruction of metal is caused directlyor indirectly by bacteria, fungi or other microbiological organisms. Anaerobic organ-
52 Industrial Applications of the BEM
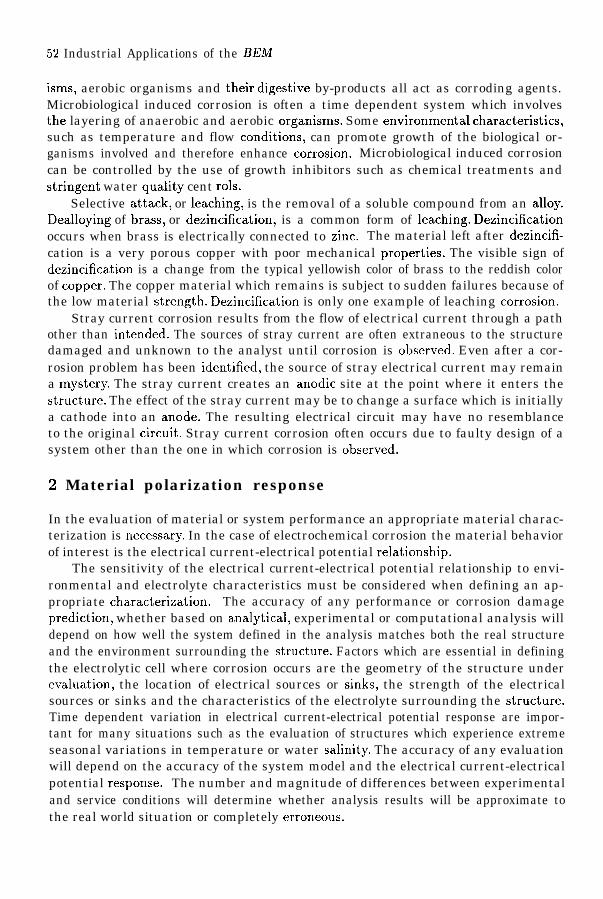
isms, aerobic organisms and their digestive by-products all act as corroding agents.Microbiological induced corrosion is often a time dependent system which involvesthe layering of anaerobic and aerobic organisms. Some environmental characteristics,such as temperature and flow conditions, can promote growth of the biological or-ganisms involved and therefore enhance corrosion. Microbiological induced corrosioncan be controlled by the use of growth inhibitors such as chemical treatments andstringent water quality cent rols.
Selective attack, or leaching, is the removal of a soluble compound from an alloy.Dealloying of brass, or dezincification, is a common form of leaching. Dezincificationoccurs when brass is electrically connected to zinc. The material left after dezincifi-cation is a very porous copper with poor mechanical properties. The visible sign ofdezincification is a change from the typical yellowish color of brass to the reddish colorof copper. The copper material which remains is subject to sudden failures because ofthe low material strength. Dezincification is only one example of leaching corrosion.
Stray current corrosion results from the flow of electrical current through a pathother than intended. The sources of stray current are often extraneous to the structuredamaged and unknown to the analyst until corrosion is observed. Even after a cor-rosion problem has been identified, the source of stray electrical current may remaina mystery. The stray current creates an anodic site at the point where it enters thestructure. The effect of the stray current may be to change a surface which is initiallya cathode into an anode. The resulting electrical circuit may have no resemblanceto the original circuit. Stray current corrosion often occurs due to faulty design of asystem other than the one in which corrosion is observed.
2 Material polarization response
In the evaluation of material or system performance an appropriate material charac-terization is necessary. In the case of electrochemical corrosion the material behaviorof interest is the electrical current-electrical potential relationship.
The sensitivity of the electrical current-electrical potential relationship to envi-ronmental and electrolyte characteristics must be considered when defining an ap-propriate characterization. The accuracy of any performance or corrosion damageprediction, whether based on analytical, experimental or computational analysis willdepend on how well the system defined in the analysis matches both the real structureand the environment surrounding the structure. Factors which are essential in definingthe electrolytic cell where corrosion occurs are the geometry of the structure underevaluation, the location of electrical sources or sinks, the strength of the electricalsources or sinks and the characteristics of the electrolyte surrounding the structure.Time dependent variation in electrical current-electrical potential response are impor-tant for many situations such as the evaluation of structures which experience extremeseasonal variations in temperature or water salinity. The accuracy of any evaluationwill depend on the accuracy of the system model and the electrical current-electricalpotential response. The number and magnitude of differences between experimentaland service conditions will determine whether analysis results will be approximate tothe real world situation or completely erroneous.

Corrosion basics and computer modeling 53
2.1 Polarization definitions
Polarization is the relationship between electrical current and electrical potential. Itis an observed behavior resulting from the combined effects of multiple oxidation andreduction react ions which are dependent on many variables. The relationship betweenelectrical current and electrical potential may or may not be linear. It may or maynot be possible to develop a mathematical function which represents the relationship.Polarization is generally referred to as a characteristic of the metal but is dependenton metal and electrolyte composition.
Anodic polarization response is the behavior of the corroding metal. Cathodicpolarization response is the behavior of the non-corroding metal. Much of the ap-plication of computer modeling techniques to corroding systems is in the evaluationof corrosion prevention systems. Corrosion prevention systems attempt to maintainthe metal of interest in the cathodic state so an understanding of the behavior ofnon-corroding met al is essential.
Polarization response is either activation or concentration controlled. Activationpolarization occurs when the electrical current-electrical potential relationship is con-trolled by the rate of a specific chemical reaction in the corrosion process. The onlylimitation imposed on the critical reaction is its associated rate of reaction. Idealizedcathodic activation polarization, Fig. 1, is:
qact = p log $to
(5)
where
q~~t = measured potential/3 = constant (Tafel slope)i. = initial electrical currenti= electrical current
Anodic response will follow the same mathematical form. Because activation polar-ization is limited by the kinetics of a specific reaction, the polarization response isdependent on temperature and all other parameters which effect the chemical reactionrate.
Concentration polarization occurs when corrosion is limited by whether a specificchemical reaction can occur. In other words, polarization is controlled by the con-centration of a chemical component required by a specific reaction in the corrosionprocess. One particular type of concentration polarization is diffusion controlled po-larization. In this case, the ion diffusion rate to the metal surface limits the rate ofthe reduction reaction since the diffusion rate limits the available of the required ion.Idealized diffusion rate limited cathodic concentration polarization response (Fig. 1)is:
RTa( ‘)
7/ . . . = 2.3#og 1 – :tL
(6)
where

54 Industrial Applications of the BEM
qconc = me-red potential
R = gas constantn = number of electrons transferredT. = absolute temperatureF = Faraday’s numberiL = limiting diffusion electrical currenti= electrical current
Eq. (6) is based on the Nernst equation.In summary, a limiting rate of a chemical reaction governs activation polarization
while the availability of a necessary chemical components governs concentration po-larizat ion.
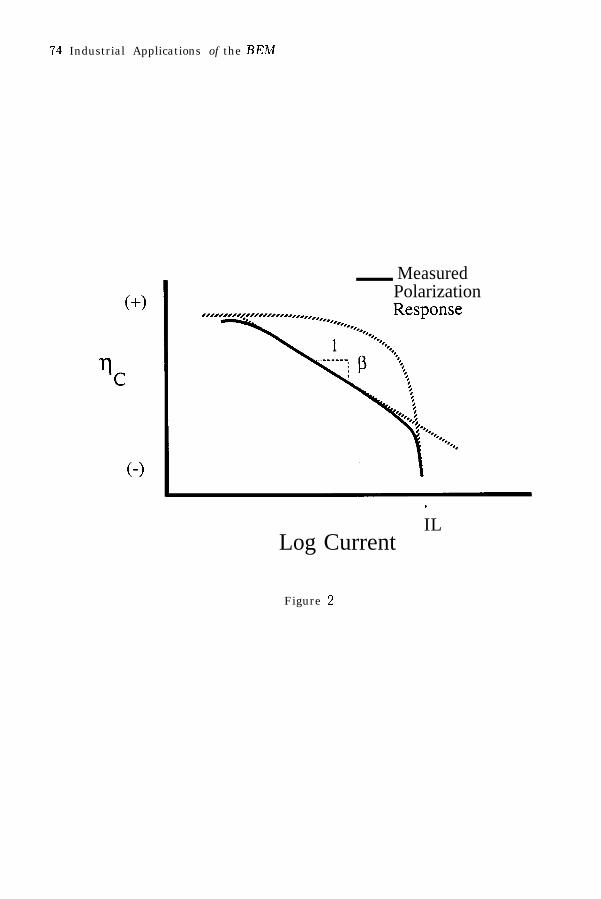
The total, or measured, polarization is a combination of activation and concen-tration polarization. Activation polarization usually controls for corrosion relatedreactions which have low chemical reaction rates while concentration polarization willbecome dominate when the governing reactions have higher reaction rates. Measuredpolarization response can be idealized by the linear combination of concentration andactivation polarization responses for cathodic polarization:
q. = Vact + qconc (7)
An idealized measured cathodic polarization curve is shown in Fig. 2.Linear polarization is, as the name implies, that portion of the total polarization
response which is linear in nature with respect the logarithm of the electrical currentdensity. The slope of the linear portion of the polarization curve is often referred toas the Tafel slope.
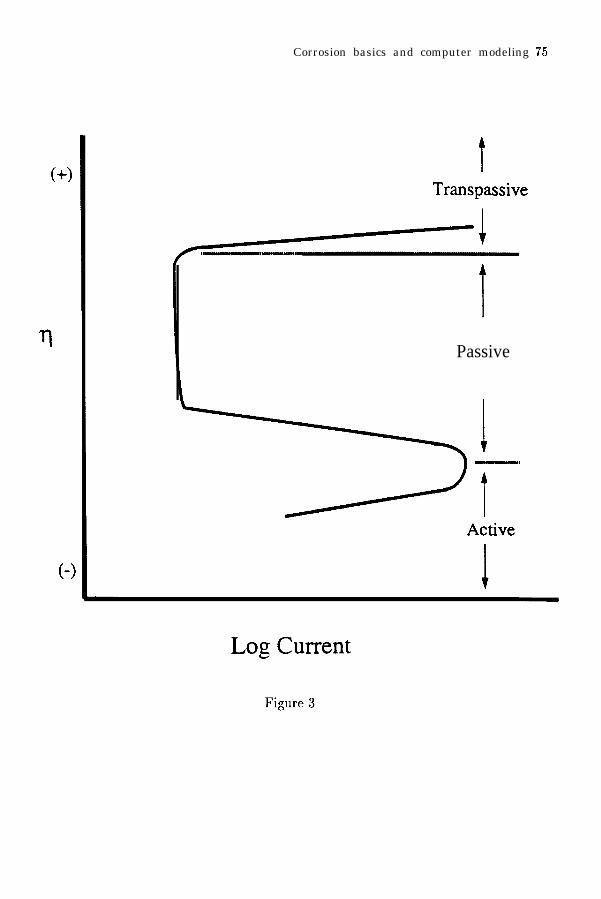
The effects of the formation of oxide films are not addressed by the polarizationcurves presented in Figs. 1 and 2. The formation of oxide films greatly reduces theelectrical current associated with a defined value of electrical potential and the po-larization relationship becomes multi-valued with respect to electrical current. Thevalue of electrical potential associated with an electrical current value will depend onwhether the reading is taken prior to oxide film formation, after film formation or afterfilm destruction. The effects of film formation is demonstrated for polarization whichis initially anodic in Fig. 3. The initial behavior of the metal can be described usingactivation polarization definition as given in Eq. (5). Prior to oxide formation themetal represented in Fig. 3 is exhibiting anodic behavior. The formation of an oxidefilm transforms the active material to a more noble material with a reduced tendencyto corrode and the electrical current density is reduced to a relatively small limitingvalue. The limit ing value of electrical current density may be as much as 106 timeslower than the maximum active region electrical current density7. At higher levels ofelectrical potential, oxide films tend to break down and the material is returned toan active state showing increased anodic polarization; this is the transpassive region.The formation of oxide films may cause a metal to shift from anodic to cathodic andfinally return to anodic behavior depending on the other metallic components of theelectrolytic cell.

Corrosion basics and computer modeling 55
2.2 Mixed potential response
When two metals are electrically connected and surrounded by an electrolyte, themeasured elect rical potential of both metals will change from the open circuit poten-tials. The cathodic metal will become more anodic and the anodic metal will becomemore cat hodic. The two metals will reach electrical potentials which are somewherebetween the open circuit potentials of the two metals.
The mixed potential theory defines this electrochemical corrosion behavior. Thehypotheses of the mixed potential theory are:
- Any electrochemical reaction can be divided into multiple partial oxidation andreduction reactions.
- There is no accumulation or loss of electrical charge during the electrochemicalcorrosion process.
The first hypothesis recognizes the chemical kinetics of electrochemical corrosion. Thesecond hypothesis requires that the oxidation and reduction reactions are in a stateof equilibrium. It is this balancing of reactions which causes the anodic and cathodicmetals to achieve some intermediate electrical potential when connected. The mixedpotential theory is one of the basic tools for the evaluation of electrochemical corro-sion. It is important to note that the concept of mixed potential is a theory which isbased on experimental observations and correlation between theoretical and experi-mental response should not be taken as proof of the theory8. This does not diminishthe importance of the theory.
2.3 Electrolyte characteristics
The amount of corrosion which occurs in any system is dependent on both the metaland the electrolyte. The corrosion response of a metal, represented by the measuredpolarization response, will vary depending on the constituents of the electrolyte andtheir concentrations. In establishing experimental criteria to determine polarizationresponse it is best to match experimental and service condition electrolytes as nearas possible. In order to introduce the complexities encountered due to electrolyteconstituents two characteristics of fluids, the hydrogen ion concentration and the dis-solved salt concentration, are briefly discussed.
Reviewing basic chemistry, the hydrogen ion concentration is measured by the pHof a solution. Metals which are stable in both acidic (pH < 7.0) and basic (pH > 7.0)solutions exhibit corrosion damage which is independent of hydrogen ion concentra-tion. Some metals, such as zinc and aluminum, exhibit a parabolic corrosion-hydrogenion concentration behavior; corrosion rates are high for high and low pfl values whilecorrosion rates are near zero for neutral and low pH values in both the acid and basicrange. More typical of metals is a direct relationship between rates of corrosion andlevel of acidity; the more acid the solution, the higher the rate of corrosion.
Dissolved salt concentration effects on the electrolyte-material system are depen-dent on the concentration and type of dissolved salts. In general, there are aggressivesalt ions and inhibitive salt ions. Aggressive ions accelerate corrosion activity whencompared to a salt free solution. In general inhibitive ions decrease the corrosion rate
56 Industrial Applications of the BEM
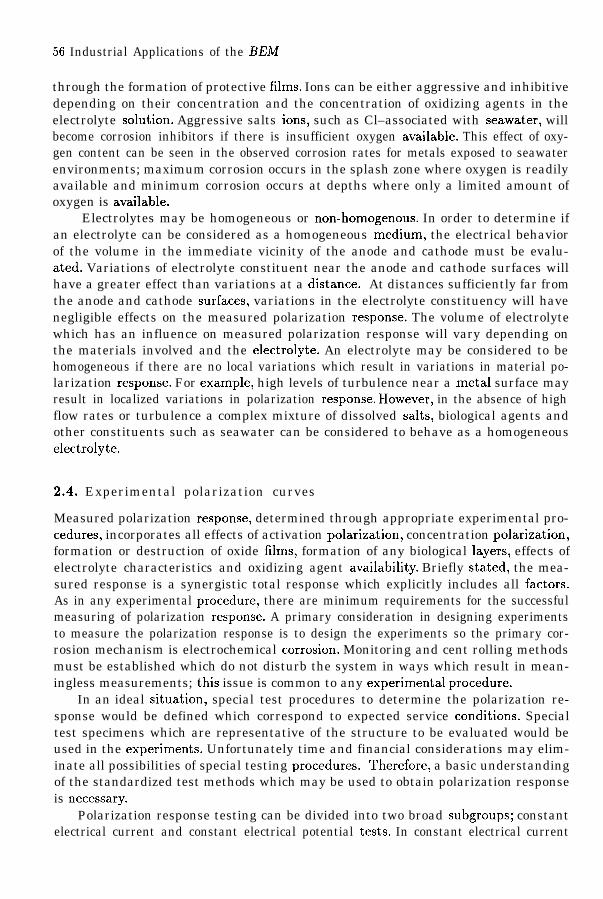
through the formation of protective films. Ions can be either aggressive and inhibitivedepending on their concentration and the concentration of oxidizing agents in theelectrolyte solution. Aggressive salts ions, such as Cl–associated with seawater, willbecome corrosion inhibitors if there is insufficient oxygen available. This effect of oxy-gen content can be seen in the observed corrosion rates for metals exposed to seawaterenvironments; maximum corrosion occurs in the splash zone where oxygen is readilyavailable and minimum corrosion occurs at depths where only a limited amount ofoxygen is available.
Electrolytes may be homogeneous or non-homogenous. In order to determine ifan electrolyte can be considered as a homogeneous medium, the electrical behaviorof the volume in the immediate vicinity of the anode and cathode must be evalu-ated. Variations of electrolyte constituent near the anode and cathode surfaces willhave a greater effect than variations at a distance. At distances sufficiently far fromthe anode and cathode surfaces, variations in the electrolyte constituency will havenegligible effects on the measured polarization response. The volume of electrolytewhich has an influence on measured polarization response will vary depending onthe materials involved and the electrolyte. An electrolyte may be considered to behomogeneous if there are no local variations which result in variations in material po-larization response. For example, high levels of turbulence near a metal surface mayresult in localized variations in polarization response. However, in the absence of highflow rates or turbulence a complex mixture of dissolved salts, biological agents andother constituents such as seawater can be considered to behave as a homogeneouselectrolyte.
2.4. Experimental polarization curves
Measured polarization response, determined through appropriate experimental pro-cedures, incorporates all effects of activation polarization, concentration polarization,formation or destruction of oxide films, formation of any biological layers, effects ofelectrolyte characteristics and oxidizing agent availability. Briefly stated, the mea-sured response is a synergistic total response which explicitly includes all factors.As in any experimental procedure, there are minimum requirements for the successfulmeasuring of polarization response. A primary consideration in designing experimentsto measure the polarization response is to design the experiments so the primary cor-rosion mechanism is electrochemical corrosion. Monitoring and cent rolling methodsmust be established which do not disturb the system in ways which result in mean-ingless measurements; this issue is common to any experimental procedure.
In an ideal situation, special test procedures to determine the polarization re-sponse would be defined which correspond to expected service conditions. Specialtest specimens which are representative of the structure to be evaluated would beused in the experiments. Unfortunately time and financial considerations may elim-inate all possibilities of special testing procedures. Therefore, a basic understandingof the standardized test methods which may be used to obtain polarization responseis necessary.
Polarization response testing can be divided into two broad subgroups; constantelectrical current and constant electrical potential tests. In constant electrical current
I
Corrosion basics and computer modeling 57
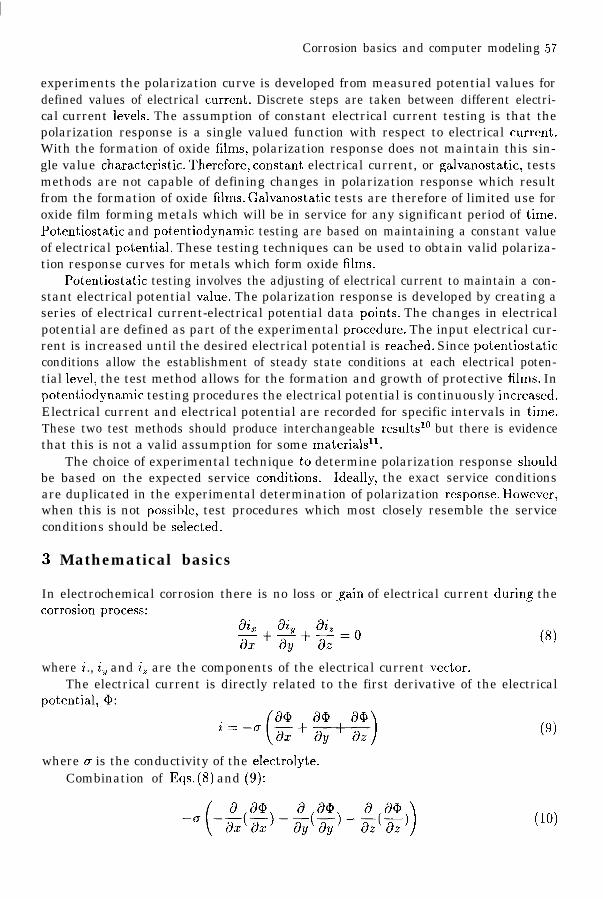
experiments the polarization curve is developed from measured potential values fordefined values of electrical current. Discrete steps are taken between different electri-cal current levels. The assumption of constant electrical current testing is that thepolarization response is a single valued function with respect to electrical current.With the formation of oxide films, polarization response does not maintain this sin-gle value characteristic. Therefore, constant electrical current, or galvanostatic, testsmethods are not capable of defining changes in polarization response which resultfrom the formation of oxide films. Galvanostatic tests are therefore of limited use foroxide film forming metals which will be in service for any significant period of time.Potentiostatic and potentiodynamic testing are based on maintaining a constant valueof electrical potential. These testing techniques can be used to obtain valid polariza-tion response curves for metals which form oxide films.
Potentiostatic testing involves the adjusting of electrical current to maintain a con-stant electrical potential value. The polarization response is developed by creating aseries of electrical current-electrical potential data points. The changes in electricalpotential are defined as part of the experimental procedure. The input electrical cur-rent is increased until the desired electrical potential is reached. Since potentiostaticconditions allow the establishment of steady state conditions at each electrical poten-tial level, the test method allows for the formation and growth of protective films. Inpotentiodynamic testing procedures the electrical potential is continuously increased.Electrical current and electrical potential are recorded for specific intervals in time.These two test methods should produce interchangeable resultsl” but there is evidencethat this is not a valid assumption for some materialsll.
The choice of experimental technique to determine polarization response shouldbe based on the expected service conditions. Ideally, the exact service conditionsare duplicated in the experimental determination of polarization response. However,when this is not possible, test procedures which most closely resemble the serviceconditions should be selected.
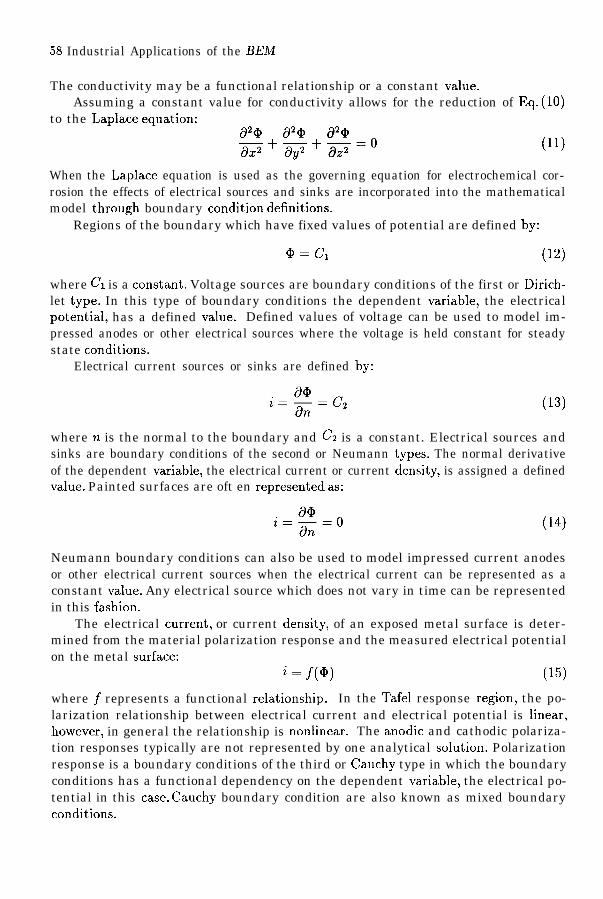
3 Mathematical basics
In electrochemical corrosion there is no loss or gain of electrical current during the
I
where i ., iv and i= are the components of the electrical current vector.The electrical current is directly related to the first derivative of the electrical I
where a is the conductivity of the electrolyte.Combination of Eqs. (8) and (9):
(lo)
58 Industrial Applications of the BEM
The conductivity may be a functional relationship or a constant value.Assuming a constant value for conductivity allows for the reduction of Eq. (10)
to the Laplace equation:i32@ + a2@ + 820~ ~ ~=o (11)
When the Laplace equation is used as the governing equation for electrochemical cor-rosion the effects of electrical sources and sinks are incorporated into the mathematicalmodel through boundary condition definitions.
Regions of the boundary which have fixed values of potential are defined by:
@=cl (12)
where (2’1 is a constant. Voltage sources are boundary conditions of the first or Dirich-let type. In this type of boundary conditions the dependent variable, the electricalpotential, has a defined value. Defined values of voltage can be used to model im-pressed anodes or other electrical sources where the voltage is held constant for steadystate conditions.
Electrical current sources or sinks are defined by:
(13)
where n is the normal to the boundary and L’z is a constant. Electrical sources andsinks are boundary conditions of the second or Neumann types. The normal derivativeof the dependent variable, the electrical current or current density, is assigned a definedvalue. Painted surfaces are oft en represented as:
(14)
Neumann boundary conditions can also be used to model impressed current anodesor other electrical current sources when the electrical current can be represented as aconstant value. Any electrical source which does not vary in time can be representedin this fashion.
The electrical current, or current density, of an exposed metal surface is deter-mined from the material polarization response and the measured electrical potentialon the metal surface:
i = ~(~) (15)
where ~ represents a functional relationship. In the Tafel response region, the po-larization relationship between electrical current and electrical potential is linear,however, in general the relationship is nonlinear. The anodic and cathodic polariza-tion responses typically are not represented by one analytical solution. Polarizationresponse is a boundary conditions of the third or Cauchy type in which the boundaryconditions has a functional dependency on the dependent variable, the electrical po-tential in this case. Cauchy boundary condition are also known as mixed boundaryconditions.
Corrosion basics and computer modeling 59,P /
4 Corrosion prevention
Corrosion is a natural phenomenon which cannot, using strict definitions, be elimi-nated. However, if the rate of corrosion can be reduced so that the amount of corrosionwhich occurs over the lifetime of a structure is negligible, corrosion has been, for allpractical purposes, eliminated. Good design practices and a knowledge of fundamen-tal corrosion behavior can be combined to greatly reduce corrosion damage. Oftenthe primary goal of computer modeling is to evaluate the performance of a corrosionprevention system.
Three common corrosion prevention techniques are summarized in this section;material selection based on electrical compatibility, cathodic protection and paintingor coating. The techniques described are not the only methods available to reducecorrosion. Each of the techniques can be readily modeling with existing boundaryelement techniques.
4.1 Material selection based on electrical compatibility
Galvanic corrosion occurs when materials having different open circuit potentials andpolarization responses are electrically connected. The amount of galvanic corrosionwhich occurs can be reduced by judicial selection of materials based on their locationin the galvanic series or by more detailed evaluation of the electrical current generatedwhen the two materials are connected. The magnitude of the electrical current willdepend on the electrolyte conductivity, the ratio of cathodic to anodic material surfacearea, and the cathodic and anodic material polarization behavior. All of these factorswill determine the driving force for the resulting electrical current. The greater theelectrical current generated, the greater the corrosion rate on the anodic material.
In the design of joints or connections in which two or more different materials areused, galvanic corrosion response must be taken into consideration. Material compat-ibility with respect to rest potential and possible corrosion damage is as important asbasic structural characteristics such as yield strength and ultimate strength.
Computer modeling techniques can be readily used to determine the galvanic cor-rosion electrical current associated with different material combinations. Parametricstudies can be performed to determine which, of all possible material combinations,results in the lowest galvanic electrical current and therefore the lowest corrosion rate.Computer models will explicitly address geometric and relative area concerns as wellas determining the effects of differences in polarization responses.
4.2 Cathodic protection
Cathodic protection uses electrochemical properties of metals to insure that the metalof interest becomes the cathode of an electrolytic cell. Corrosion is allowed to occurbut the electrochemical properties are taken advantage of in such a way that the an-ode is defined and corrosion damage is contained to a specific area.
In galvanic corrosion, the more active metal preferentially experiences corrosion.Cathodic protection using sacrificial anodes takes advantage of the galvanic propertiesof two metals. The sacrificial anode is a volume of metal added to the structure for

60 Industrial Applications of the BEM
the purpose of being destroyed by corrosion. The sacrificial anode metal is chosen sothat it is more active than the metal to be protected. Classical examples of sacrificialanode systems are zinc, aluminium and magnesium anodes used to protect steel struc-tures in aquatic or moist environments, such as seawater spray, partially saturatedsoils and saturated soils. Zinc, aluminium or magnesium are more active than steel sothese materials will become the anode and will preferentially corrode before corrosionoccurs on the cathode, i.e. the steel structure. Since the system is designed so thatthe anode is known, the length of time required for complete destruction of the anodeby corrosion can be determined. Prior to complete destruction of the sacrificial an-ode, additional sacrificial anodes can be placed on the structure providing a continualsupply of material which can corrode without effecting structural integrity.
Sacrificial anode cathodic protect ions systems are not perfect. Sacrificial anodesmay corrode non-uniformly and are not be able to adjust dynamically to increasedelectrical current demands which result from changes in the service conditions, envi-ronment or increased area to be protected due to surface damage. The structure itselfis required to have an increased load bearing capacity because of the added weightof the sacrificial anodes. Uneven corrosion of the anodes will also effect the systemcorrosion prevention performance. The region of cathodic material which can be pro-tected by a single anode is dependent on the metal’s polarization characteristics andthe conductivity of the electrolyte. Despite the limitations, sacrificial anode systemsare widely used.
Existing boundary element methods, which incorporate first, second and thirdtype boundary conditions capabilities, can be used for modeling sacrificial anodes.Sacrificial anodes can be defined as sources with physical dimensions and location orcan be defined as point sources. Prescribed voltage values along with defined polar-ization response completely define the anode material behavior.
Impressed current cathodic systems and sacrificial anode systems prevent corro-sion in the same manner; by catholically polarizing the material to be protected.Impressed current systems use an external power supply as the source of electronsrequired for polarization of the metal to be protected. An external power supply mayhave more than one location, or impressed current anode, where current is suppliedto the system.
Some problems associated with sacrificial anodes are eliminated by the use of im-pressed current systems. Impressed current systems can be adjusted to meet dynamicchanges in the system. Whether an impressed current system can adjust to provideadequate protection will depend on the system design. The added weight of sacrificialanodes is replaced by the added weight of the required power supplies. For a largestructure, the difference in added weight can be significant. The area which can beprotected by an impressed current anode is typically greater than the area which canbe protected by a sacrificial anode. The extent of metal which may be protected by asingle impressed current anode is dependent on the electrolyte conductivity and theavailable power supply. The cathodic material polarization response, of course, alsoplays a role in the extent of cathodic material which can be protected by a singleanode.
Impressed current systems may be modeled using existing boundary element tech-niques. The impressed current anodes can be defined with specific areas and locating.
Corrosion basics and computer modeling 61
They can be assigned values of electrical voltage or electrical current density. Theboundary conditions defining impressed current anodes are held constant through outthe analysis thus modeling a constant power supply.
4.3 Paints and coatings
Paints and coatings are used to protect from corrosion in the same manner; the paintor coating is used to isolate the metal to be protected from the environment. A coat-ing can be a layer of a non-corroding metal plated to the metal to be protected, apaint and primer system or a naturally forming surface film. The term ‘paint’ mayor may not imply cosmetic or ascetic purposes in addition to corrosion protection.Paints are a combination of pigment and medium containing the pigment. In thisbrief description of paint and coating systems, the terms paint and coating will beused interchangeably.
There are a wide variety of paints available and marketed for use as corrosioninhibitors. Different paints have been developed for different materials and environ-ments. The selection of a suitable paint is only the first step in the creation of aneffective corrosion prevention system. Surface preparation, application methods, num-ber of layers, combinations of different layers of different types of paints or primersand thickness of layers are features which define a paint system.
Unfortunately, painted surfaces are not free from defects regardless of the caretaken during application. Mechanical damage, such as scratches or chipping, andflaws from incorrect application procedures result in areas of exposed metal. Theseexposed areas can be either small or large. If only relatively small areas of metal areexposed through paint damage, corrosion can become severe. The remaining paintedsurface acts as the cathode while the small exposed region of metal acts as the an-ode. The large cathode to anode surface area ratio results in severe corrosion attackbecause of galvanic corrosion behavior. In order to avoid severe corrosion damage atsmall isolated areas of paint damage, secondary protective systems, such as cathodicprotection, are often used with painted surfaces.
Paint systems can be incorporated in boundary element models by defining anelectrical current density of zero for a well painted surface. Specific experimentallyobtained painted surface polarization data can also be used if a more exact solutionis required. Areas of paint damage can be modeled by assigning metal polarizationresponse to specified elements. Mesh size can become an issue when modeling a struc-ture which has small areas of paint damage. Extremely small damage on a relativelylarge structure may require combining local and global models for accurate represen-tation. Location of paint damage can be as crucial as the extent of paint damage.Identification of paint damaged areas should be based on observations from full scalestructures whenever possible. In the case of damage due to erosion, impingement orother effects which may occur randomly along the structure, statistical approachesmay be required to determine representative damage locations.
The descriptions of protection systems given are brief summaries. The design ofa corrosion protection system is a complex task. Detailed information on the threesystems described as well as other preventative measures can be found in the literature.
62 Industrial Applications of the BEM
5 Example computer modeling of corrosion systems
The ability to use computational modeling techniques to evaluate electrochemicalcorrosion has been established. Finite element and boundary element methods havebeen used to model geometrically complex structures ranging from tube-to-tube-sheet
13. Reviews by Nazami~12 to offshore piping platformsconnections in steam generatorsPorter and Mufti5, Munn6 and DiGiorgi and Kaznoff14 show the versatility of com-puter modeling as applied to corroding systems.
Computer modeling techniques can be used to determine the electrical currentdensity-electrical potential values for the entire surface area of a structure. Boundaryconditions of the first, second and third type are combined to represent a particu-lar structure, the surrounding medium, and all associated electrical sources or sinks.Polarization response is used by the computer solution algorithm to correlate electri-cal current levels and electrical potential values for the exposed areas of metal. Thepolarization response is the material constitutive response required for the numericalsolution and can be thought of as equivalent to the stress-strain response required forstructural evaluations. As with any constitutive response, inaccuracies or inappropri-ate values will result in variation between computational and observed results.
Any computer method which can be used to solve the governing equations can beused to predict electrochemical behavior. Solution accuracy may be identical for dif-ferent analysis methods, i.e. finite element and boundary element, however the ease of
15 It may be simpler to model thecomputer model formulation may be very different .physical characteristics of a specific structure experiencing electrochemical corrosionusing a particular modeling technique. In the case of a structure submerged or buriedin an relatively large volume of electrolyte, boundary elements techniques are a morenatural choice. The volume of interest which must be modeled to determine elec-trochemical behavior is that of the electrolyte surrounding the structure. The metalsurface of interest is that at the solid-electrolyte interface. Modeling using finite dif-ference techniques is restrictive with respect to the degree of geometric complexitywhich can be achieved. Often the structure to be evaluated is not geometrically simpleand either boundary element or finite element techniques are required to accuratelymodel the structure. Modeling using finite element techniques becomes tedious andcomplicated because geometric complex three-dimensional models must be generated.Boundary element techniques require only modeling of the structure-electrolyte in-terface instead of the entire electrolyte volume. Therefore significant reductions inmodel complexities are possible when boundary element techniques are used ratherthan finite element techniques. In addition, the model created is a two-dimensionalshell of the structure rather than a full three-dimensional representation of the volumesurrounding the structure. The outer limits of the electrolyte are modeled as the outeredges of a box or other simple structure completing the boundary element model. Inthe case of a structure in an infinite or semi-infinite volume of electrolyte the result-ing two-dimensional shell type boundary element model is typically a simpler modelthan would be required by for finite element evaluation of the structure. Modelingconcessions necessary for the creation of any computer model, which may result inloss of accuracy, will not be as severe for the simpler boundary element model.
In this section, two example are presented which demonstrate the application of

Corrosion basics and computer modeling 63
boundary element techniques to the evaluation of structures in infinite electrolytedomains. The infinite electrolyte domain is representative of structures set afloat indeep water or buried in thick soil strata. In both of these cases, the extent of theelectrolyte surrounding the structure is large in comparison to the size of the struc-ture. In the first example, a pipe of two different materials is submerged in a tank ofseawater. The galvanically generated electrical current is determined for a series ofdifferent connection geometries. The parametric study performed demonstrates theability to use computer modeling as a design tool to determine the configuration withthe lowest electrical current and therefore the lowest rate of corrosion. In the secondanalysis, the impressed current cathodic protection system of a ship is modeled andthe electrical current required to maintain protection against corrosion is determined.The second analysis addresses such issues as multiple material properties, complexgeometries and comparison with experimental results.
5.1 Piping system evaluation
One of the advantages of computer modeling is the capability of comparing systemperformance. This capability allows the designer to consider the effects of changes insystem design on overall system performance without the cost associated with per-forming an experimental evaluation of each configuration. The boundary elementtechnique example involves the determination of the most beneficial connection oftwo galvanically incompatible materials in a piping system which is submerged in sea-water. A parametric approach is used to determine the most desirable configuration.
The ideal piping system would be fabricated from one material and if two ma-terials were joined they would be electrically compatible minimizing the resultinggalvanic corrosion. Piping systems, however, often consist of several materials whichare electrically incompatible resulting in galvanic corrosion damage to the piping sys-tem. Piping systems commonly include a variety of connections such as piping of thesame diameter but different materials as well as pieces of piping of different diameterswhich may or may not be of the same material.
The boundary element technique example problems is the evaluation of possi-ble connections between two pieces of pipping of different materials. The two metalschosen for study are Inconnel and Copper–Nickel (CuNi) alloy. These particular met-als were chosen for the demonstration problem because the difference in open circuitpotentials and polarization response will result in galvanic corrosion. It is the intentof the computer modeling and analysis to determine how galvanic corrosion can beminimized for these two materials and not whether significant galvanic corrosion oc-curs. A commercial boundary element code was used in all evaluations. There wereno external applied electrical current or voltages. The only driving force used in theanalysis was the difference in material polarization responses for the Inconnel andCuNi alloy. The analysis used standard program features and no special computercoding to analyze the piping.
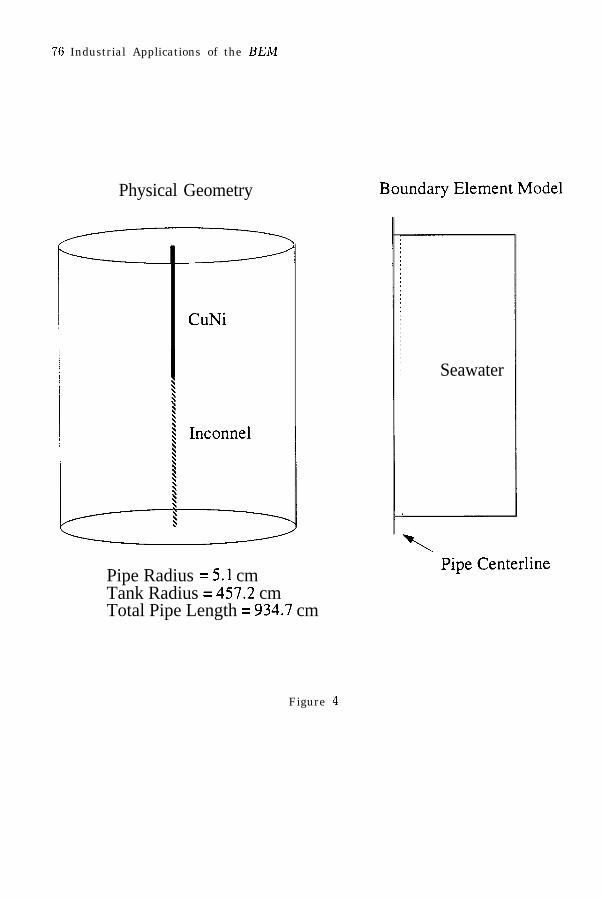
A straight pipe consisting of equal lengths of the 10.2 cm diameter Inconnel andCuNi alloy was evaluated. The total length of the pipe is 934.7 cm. The pipe is sub-merged in the center of a 914.4 cm diameter tank filled with seawater. A boundaryelement model of 260 elements and 463 nodes was created of the exterior surface of

64 Industrial Applications of the BEM
pipe and the surrounding seawater. Quadratic elements were used to model the pip-ing sections, linear elements were used to model the tank boundary. Small elementswere used in the region near the connection between the two materials in order to ac-curately capture the electrical current density and electrical potential gradients nearthe material interface. Axisymmetric modeling was used so that the model, shownin Fig. 4, represents the outline of a 1° slice of the circular piping and surroundingseawater. The volume of seawater surrounding the pipe is large but finite. Nonlinearpolarization response curvesll were used to characterize the material behavior. Theseawater was modeled as a homogeneous electrolyte with a constant conductivity of0.05 Ohms-l-cm-l.
The electrical current density does not vary significantly along the anodic sectionof piping with the maximum electrical current density of 4.8 x 10⁻⁶ to Amperes/cmzoccurring at the material interface. The approximately constant electric current den-sity will result in corrosion which will be uniform along the length of the CuNi sectionof piping. The amount of corrosion at any location can be approximated by thatcaused by the maximum electrical current density. The corrosion rate can be de-termined using Faraday’s law and the appropriate material properties, as shown inEq. (7). Based on the maximum electrical current density, the corrosion rate for thesubmerged pipe is 0.11 mm/yr.
The second pipe to be evaluated is fabricated from equal length sections of 30.4cmdiameter Inconnel pipe and 10.2 cm diameter CuNi pipe. The total length is 934.7cm. Four different piping connections were considered; a step connection, and a 121.9cm long taper of Inconnel. The piping was submerged in a 914.4 cm diameter tankfilled with seawater. The pipe and the tank were modeled using an axisymmetricboundary element model of 445 linear elements and 450 nodes was created of the stepconnection geometry. Element size was larger than that of the previous two materialstraight pipe model and the increase in element size was based on the results of theprevious analysis.
In all cases, step and taper connections, the maximum electrical current densityoccurs in the CuNi alloy, the anode, at the material interface. The maximum electricalcurrent densities for the different connection geometries are:
— step connection – 9.7 x 10⁻⁶ Amperes/cm2
— Inconnel taper -12.0 x 10⁻⁶ Amperes/cmz
- CuNi taper – 8.5 x 10⁻⁶ Amperes/cm2
It is apparent from the maximum electrical current density that the piping connectionwhich would result in the least amount of galvanic corrosion is the taper connectionwith the taper fabricated from CuNi alloy. The oxidation rate of the CuNi alloy mustbalance the reduction rate of the constant surface area of Inconnel. Therefore, thelowest corrosion rate will occur for the connection which has the smallest cathode toanode area ratio.
As demonstrated in this example, it is possible to evaluate the performance ofdifferent piping system configurations once materials have been selected. While notdemonstrated in the study presented, it is possible to generate corrosion rate infor-mation for different material combinations for similar piping system geometries. It is
Corrosion basics and computer modeling 65
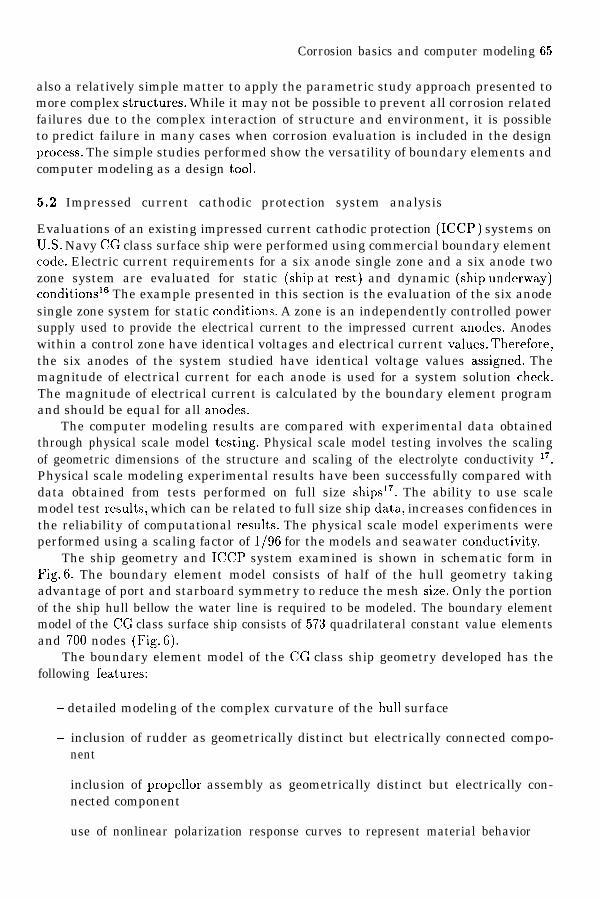
also a relatively simple matter to apply the parametric study approach presented tomore complex structures. While it may not be possible to prevent all corrosion relatedfailures due to the complex interaction of structure and environment, it is possibleto predict failure in many cases when corrosion evaluation is included in the designprocess. The simple studies performed show the versatility of boundary elements andcomputer modeling as a design tool.
5.2 Impressed current cathodic protection system analysis
Evaluations of an existing impressed current cathodic protection (ICCP ) systems onU.S. Navy CG class surface ship were performed using commercial boundary elementcode. Electric current requirements for a six anode single zone and a six anode twozone system are evaluated for static (ship at rest) and dynamic (ship underway)conditions16 The example presented in this section is the evaluation of the six anodesingle zone system for static conditions. A zone is an independently controlled powersupply used to provide the electrical current to the impressed current anodes. Anodeswithin a control zone have identical voltages and electrical current values. Therefore,the six anodes of the system studied have identical voltage values assigned. Themagnitude of electrical current for each anode is used for a system solution check.The magnitude of electrical current is calculated by the boundary element programand should be equal for all anodes.
The computer modeling results are compared with experimental data obtainedthrough physical scale model testing. Physical scale model testing involves the scalingof geometric dimensions of the structure and scaling of the electrolyte conductivity 17.Physical scale modeling experimental results have been successfully compared withdata obtained from tests performed on full size ships17. The ability to use scalemodel test results, which can be related to full size ship data, increases confidences inthe reliability of computational results. The physical scale model experiments wereperformed using a scaling factor of 1/96 for the models and seawater conductivity.
The ship geometry and ICCP system examined is shown in schematic form inFig. 6. The boundary element model consists of half of the hull geometry takingadvantage of port and starboard symmetry to reduce the mesh size. Only the portionof the ship hull bellow the water line is required to be modeled. The boundary elementmodel of the CG class surface ship consists of 573 quadrilateral constant value elementsand 700 nodes (Fig. 6).
The boundary element model of the CG class ship geometry developed has thefollowing features:
- detailed modeling of the complex curvature of the hull surface
— inclusion of rudder as geometrically distinct but electrically connected compo-nent
inclusion of propellor assembly as geometrically distinct but electrically con-nected component
use of nonlinear polarization response curves to represent material behavior

66 Industrial Applications of the BEM
— use of three separate materials (steel, nickel–aluminum–bronze (n–a–b) andpaint) to model separate regions of the ship.
The impressed current anodes have finite areas and fixed locations and are explicitlyincluded in the boundary element model through use of constant voltage boundaryconditions. The total electrical current into the system through the impressed currentanodes and the total electrical current leaving the system through the exposed metalsections are compared as a check on the accuracy of the calculated solution.
Three different materials are used to model the hull, propellor and rudder in themodel. The hull is assumed to be undamaged paint and therefore no electrical currentis allowed to be transmitted to the hull surface. The propellor and rudder are modeledas bare nickel-aluminum-bronze (n-a-b) and steel, respectively. Nonlinear representa-tions of polarization response were used for steel and n-a-b. Seawater is defined as ahomogeneous elect rolyte with a constant conductivity of 0.05 Ohms-l cm-l.
The material configuration of the physical scale model test specimens and thesurface ship as represented by the computer models are different. There are four differ-ences between physical scale model test ship and computer model material definitions.These differences must be taken into consideration when comparing global and localresults. The first two differences are a result of mesh refinement limits resulting fromtime and financial limitations. The scale model test ship contains the bilge keel. Theboundary element does not. The bilge keel can be idealized as a narrow ridge whichis perpendicular to the hull as shown in Fig. 5. The bilge keel acts as a deflector andshields a portion of the hull from electrical current flow and the associated electricalpotential of the seawater at the hull surface. The boundary element does not containthe bilge keel because it was felt at the time of original modeling that the bilge keeldoes not act as a significant geometric feature. Subsequent work indicates that thismay not have been a valid assumption. The physical scale model test ship also con-tains docking blocks which represent 1910 of the total surface area. The docking blocksare bare steel and are located along the port-starboard centerline. The docking blockswere not included in the computer model because of the mesh size limits resultingfrom time and financial limitations. Docking blocks are relatively small geometricfeatures and it was felt that they were smaller than the level of detail required. Thethird and four differences in the two models deal directly with the representation ofthe rudder and propellor. The rudder in the physical scale model test ship is painted.The rudder in the boundary element model was bare steel. It was the intent of theoriginal computer model to represent extreme damage to the rudder. Finally in theboundary element model the propellor is modeled as a solid disk as opposed to thedetailed propellor of the physical scale model test ship. These variations in materialassignments for different components will effect the tot al required electrical currentbecause of differences in exposed metal areas.
It is often unfortunately the case that experimental and computer models are notidentical. The reasons for differences in the two models can vary from miscommuni-cation to inability to create as refined a computer model as necessary. The analystmust recognize the areas of difference and be able to identify results which can becompared. The ideal situation occurs when there is an one-to-one correspondencebetween experimental specimens and computer models. In this case, the value which

Corrosion basics and computer modeling 67
can be meaningfully compared is the total electrical current absorbed by the propel-lor.
ICCP systems are controlled by defining a target electrical potential associatedwith a specified reference cell. Corrosion will not occur when steel is catholically po-larized to an electrical potential of -0.85 volts measured with a Silver-Silver Chloride(Ag/AgCl) electrode. Physical scale model experimental results used for comparisonare for reference cell readings of -0.85 Ag/AgCl. In the boundary element analysis,a reference cell potential range of -0.83 to -0.87 volts Ag/AgCl is used to define thetarget condition. In order to bound all possible solutions, upper and lower bound solu-tions are defined based on electrical current requirements. The upper bound solutionis defined as that which requires more electrical current and is therefore associatedwith a reference cell reading of -0.87 volts Ag/AgCl. One design problem associatedwith ICCP systems is the ability to locate a reference cell which is truly representativeof the hull surface condition. It is also possible to determine, by examination of allhull surface potentials, how well the reference cell reading represents the potential ofthe entire hull surface.
Since the boundary element program uses an iterative solution technique it ispossible that the electrical current values associated with impressed current anodesmay not be exactly equal for anodes within a zone. The solution tolerance will effectthe variation in currents determined as part of the boundary element solution. Be-cause of the iterative nature of the solution procedure a tolerance on electrical currentequivalency is required to determine solution acceptance with regards to the criteriaimposed on each power supply zone. The impressed current anodes belonging to thesame zone must have a total electrical current input within 0.5 Amperes of the otheranodes attached to the same power supply for the solution to be considered valid.
The current and voltages required for a lower bound solution (reference cell at-0.83 volts Ag/AgCl) for the single zone system at static conditions are:
VA = V’ = VC = –1.3 volts, 1A = IB = Ic = 3.2 to 3.4 Amperes (16)
where the locations of anodes A, 1? and C are as defined in Fig. 5. The range inelectrical current for anodes is due to the iterative nature of the boundary elementtechnique. A more refined mesh and tighter convergence tolerances will eliminate thisvariation. The negative voltage value indicates voltage supplied to the system for theparticular boundary element formulation used in the analysis.
The upper bound solution (reference cell at -0.87 volts Ag/AgCl ) requirementsare:
VA = VB = VC = –1.45 volts, 1A = IB = IC = 3.7 to 4.0 Amperes (17)
Electrical potential profiles for the port-starboard centerline and for the side of thehull at a depth of 3.0 m. are shown in Fig. 7. Computer and physical scale modeltest data show similar trends.
Physical scale model and computer results indicate that electrical potential valueson the rudder and propellor are less than required for corrosion prevention despitethe electrical potential at the reference cell. The range in electrical potential on therudder side tip of the propellor is -0.76 to -0.82 volts Ag/AgCl. The physical scalemodel measured electrical potential for the same location is -0.72 volts Ag/AgCl.

68 Industrial Applications of the BEM
Despite the good agreement in electrical potential values, both along the two pro-files chosen and for a specific point, there is a large discrepancy in the total electricalcurrent calculated from physical scale model tests and the computer modeling solu-tions. Boundary element solutions result in a range of total current required from20.2 to 23.8 Amperes. Of this total, 10.0 to 10.6 Amperes is delivered to the propel-lor. Physical scale test data indicates a total current requirement of 63.9 Ampereswith 43.1 Amperes delivered to the propellor. Possible explanations of the differencein the amount of electrical current delivered to the propellor are the uncertainty inthe material polarization response curves used in the computational model and thepresence of the bilge keel in the physical scale model. The n-a-b polarization curvewas determined using filtered seawater and small laboratory test specimens 1. Thelaboratory data used may not be the most appropriate for the conditions and materialsurface features of the n-a-b used in the physical scale experiments. It is possible thatmore appropriate polarization curves may result in increased accuracy of computerresults. The bilge keel has been observed to act to deflect the flow of electrical currentand may be partially shielding the reference cell in the experiments.
Based on the analysis performed the boundary element method has been demon-strated to accurately predict global behavior. Differences between experimental andcomputational results can be attributed to variation inherent in the material polariza-tion response and to geometric characteristics not included in the boundary elementmodel. Additional mesh refinement, which will allow for inclusion of the dockingblock and bilge keel features should also result in an improvement in total electricalcurrent requirements. It is interesting to note the relative sensitivity of the electricalpotential profile and total electrical current. Electrical potential profiles, which area global structure response, are less sensitive to mesh refinement and material char-acterization issues than total electrical current, which is the integration of the localcurrent density response.
Once the desired accuracy of computer modeling is obtained and verified by com-parison with experimental data, the versatility of computer modeling can be exploitedby the analysis. Power supply zones connecting various anodes can be created bychanging the defined voltage or electrical current or current density boundary con-ditions for anode elements. By simply changing the value of boundary conditiondefinitions the analyst can explore all possible power zone combinations and powersource limitations. The reference cell location, which may or may not yield electricalpotential values which are indicative of potential levels in regions of interest such asthe propellor, can be changed to any existing node location and need not be pre-define. Electrical potential profiles and contours which show the global response ofthe ship can be used to determine system performance. Anode placement can bealtered by redefining prescribed boundary conditions to different elements. Differentoperating conditions, defined by temperature, salinity or ship speed, can be evaluatedby changing the resistivity of seawater and the material polarization response. Thelist of possible combinations is, for all practical purposes, endless.
Corrosion basics and computer modeling 69
5.3 Summary
The two examples presented in this section demonstrate the versatility of the bound-ary element method. The ability to modify existing systems, whether by changes inmaterials or geometry, is a powerful aspect of computer analysis. The examination ofbeneficial or adverse effects of design variations, intentional or as a result of fabricationdifficulties, are another positive feature of computer analysis. While understanding ofthe mathematics of the computer programming and of the physical phenomena is nec-essary for the successful completion of a computer analysis, this should not deter onefrom the use of this powerful tool. Commercial boundary element computer codes arereadily available or it is possible to create special purpose codes within a reasonableamount of time based on the existing technology. In summary, the corrosion charac-teristics of a system may be determined using existing computer modeling techniques.
References and Suggested Reading
R e f e r e n c e s
1. Economic Effects of Metallic Corrosion in the United States, National Bureau of Stan-dards, NBS Special Publication 511-1, U. S. Dept. of Commerce, May 1978.
2. Fontana, M. G., Corrosion Engineering, McGraw Hill, New York, 1986, p. 1.
3. Tomashaw, N. D., Theory of Corrosion and Protection of Metals, The Science ofCorrosion, The Macmillan Company, New York, 1966, p. 5.
4. Peterson, M. H., Physical and Mathematical Modeling of Current Distribution and
5
6.
Cathodic Protection, 8th Inter-naval Corrosion Conference, Proceedings, Plymouth,England, 1988, p. 1-9.
Zamani, N. G., Porter, J. F. and Mufti, A. A., A Survey of Computational Effortsin the Field of Corrosion Engineering, International Journal of Numerical Methods inEngineering, Vol. 23, 1986, p. 1295-1311.
Munn, R. S., A Review of the Development of Computational Corrosion Analysisfor Spatial Corrosion Modeling Through Its Maturity in the Mid-1980 s- , ComputerModeling in Corrosion, ASTM STP 1154, American Society for Testing and Materials,Philadelphia, 1991, p. 215-228.
7. Jones, D. A., Principles and Prevention of Corrosion, Maximilian Publishing Co.,New York, 1992, p. 118.
8. Jones, D. A., Principles and Prevention of Corrosion, Maximilian Publishing Co.,New York, 1992, p. 92.
9. Corrosion Basics, An Introduction, National Association of Corrosion Engineers, Ho-uston, 1984, p. 151.

70 Industrial Applications of the BEM
10.
11.
12.
13.
14.
15.
16.
17.
18.
Jones, D. A., Principles and Prevention of Corrosion, Maximilian Publishing Co.,New York, 1992, p. 123.
Hack, H. P. and Scully, J. R., Galvanic Corrosion Prediction Using Long and Short-Term Polarization Curves, Corrosion, Vol. 43, No. 3, 1986, p. 79-90
Scully, J. R. and Hack, H. P., Prediction of Tube-Tubesheet Galvanic Corrosion UsingFinite Element and Wagner Number Analysis, Galvanic Corrosion, ASTM STP 978,Philadelphia, PA, 1988, p. 136-157.
Strommen, R. D., Computer Modeling of Offshore Cathodic Protection Systems:Methods and Experience, Computer Modeling in Corrosion, ASTM STP 1154, Amer-ican Society of Testing and Materials, Philadelphia, 1992, p. 229-247.
DeGiorgi, V. G. and Kaznoff, A. I., A Review of Computational Simulation Tech-niques, Corrosion Forms and Control for Infrastructure, ASTM STP 1137, AmericanSociety for Testing and Materials, Philadelphia, 1992, pp. 77-89.
Fu, J. W., Numerical Modeling for Galvanic Corrosion and Cathodic Protection Anal-ysis, Computers in Corrosion Control, Proceedings of the Corrosion/86 Symposiumon Computers in Corrosion Control, National Association of Corrosion Engineers,Houston, TX, U. S. A., p. 161-175.
DeGiorgi, V. G., Lucas, K. E., Thomas, E. D. and Shimko, M. J., Boundary ElementEvaluation of ICCP Systems Under Simulated Service Conditions, Boundary ElementTechnology VII, Computational Mechanics Publications, Southampton, 1992, p. 405-422.
Thomas, E. D. and Parks, A. R., Physical Scale Modeling of Impressed Current Ca-thodic Protection Systems, Corrosion 89, Paper 274, National Association of CorrosionEngineers, Houston, TX, 1989.
Thomas, E. D., Lucas, K. E., and Parks, A. R., Verification of Physical Scale Model-ing with Shipboard Trials, Corrosion 90, Paper 370, National Association of CorrosionEngineers, Houston, TX, 1990.
Suggested Reading
Theoretical
●
●
●
Fontana, M. G., Corrosion Engineering, McGraw Hill, New York, 1986
Jones, D. A., Principles and Prevention of Corrosion, Maximilian Publishing Co.,New York, 1992
Tomashaw, N. D., Theory of Corrosion and Protection of Metals, The Science ofCorrosion, The Macmillan Company, New York, 1966


72 Industrial Applications of the BEM
Galvanic Series
Metals Exposed to seawater
Noble (Cathodic)
Platinum
Gold
Titanium
Silver
Type 316, 317 Stainless Steels (Passive, with Oxide Film)
Nickel
Nickel-Aluminum-Bronze
7030 Copper Nickel
Lead
Tin Bronzes
Silicone Bronzes
Manganese Bronze
Copper
Tin
Naval Brass, Red Brass, Yellow Brass
Type 316, 317 Stainless Steel (Active, without Oxide Film)
Low Alloy Steel
Mild Steel, Cast Iron
Aluminium Alloys
Zinc
Magnesium
Active (Anodic - Corroding Surface)
Table 1

(+)
Tc
(-)
(+)
~c
(-)
Activation Polarization
P
Log Current
ConcentrationPolarization
LimitingCurrent
Log Current
Figure 1
74 Industrial Applications of the BEM
(+)
llc
MeasuredPolarization
,,,,,,/,,~,//////0.0.,/.,.,,,
(-)
.
ILCurrentLog
Figure 2
Corrosion basics and computer modeling 75
t
Transpassive
Passive
!—,1
Active
76 Industrial Applications of the BEM
Physical Geometry
CuNi
Pipe Radius = 5.1 cmTank Radius = 457.2 cmTotal Pipe Length = 934.7 cm
Seawater
Figure 4

Corrosion basics and computer modeling 77
%“/
Bilge KeelRudder
Propellor
Source Anodes - A, B, CReference Cell - R
Figure 5

78 Industrial Applications of the BEM
Figure 6

-1.5
‘1.25
l-l -1
‘AtiAK!o.75
-0.5
-0.25
-1.5
-1.25
n -1(Ag/AgCl)
-0.75
-0.5
-0.25
Frame
Depth = 3.0 m.
~●