Preference Share Issue August 2005 Preference Share Issue August 2005.
36 | P a g e
Chapter 2
Conceptual Framework of Sales Promotion Schemes, Consumer
preference & Brand Equity perception:
2.1 Sales Promotion in India
2.2 FMCG Sector in India
2.3 FMCG products Categories and Sales Promotion Schemes
2.3.1 Identification of Attributes and Attributes Levels
2.4 Brand Definition
2.5 Branding Evolution
2.6 Brand Equity and Perception
2.7 Aakar‘s Brand Equity Framework
2.8 References

37 | P a g e
Chapter 2
2.1 Sales Promotions in India:
The FMCG sector which had kept the highest advertisement expenses as the
proportion of sales, has kept the ad expenses almost proportionate to growth in net
sales. The elasticity of advertisement of the sector stood at 0.80 per cent to their net
sales during the analyzed period. Income and expenditure statement of the major
companies in the segment analyzed for the FMCG companies, which used to be
fervent advertisers in the past, have marginally hiked their ad budget in 2008-09 in
comparison with 2007-08.
According to the analysis of FMCG sector, Hindustan Unilever Limited increased its
advertising costs in 2008-09 by 48 per cent to 2,130.92 crore which was at 440.22
crore in 2007-08. Another FMCG major, ITC Limited, spent nearly 33 per cent more
in 2008-09 than the previous year, as the company earned 8.37 per cent growth in net
sales during the same period whereas Britannia which spent about 17.47 per cent
more on advertisements in 2008-09 as compared to the previous year recorded a
growth of 20.44 per cent in the same period.
Dabur spent nearly 14.85 per cent more on advertisements in 2008-09 as against the
corresponding period of previous year while the company‘s net sales increased by 15
per cent in 2008-09. Marico Limited which cut its advertising expenses in 2008-09 by
6.05 per cent saw a growth rate of 22.52 per cent in the net sales figure in 2008-09 as
compared to 2007-08.

38 | P a g e
2.2 Fast Moving Consumer Goods (FMCG) Sector of India:
Companies
Parameters 2008-2009
(value in
Crore)
2007-2008
(value in
Crore)
%
Change
Elasticity
Britannia
Advertising and
Sales Promotions
211.18
179.78 17.47 1.17
1.17
Net Sales 3,112.21
2,584.10
20.44
Marico Ltd.
Advertising and
Sales Promotions
169.56
180.47
-6.05
-
3.73
Net Sales 1,917.17
1,564.74 22.52
ITC Advertising and
Sales Promotions
502.30
377.54 33.05 0
0.25
Net Sales 23,143.53
21,355.94 8.37
Dabur
Advertising and
Sales Promotions
284.93
248.10 14.85
1.01 Net Sales 2,396.16
2,083.40 15.01
HUL
Advertising and
Sales Promotions
2,130.92
1,440.22 47.96
0.98
Net Sales 21,649.51
14,715.10 47.12
39 | P a g e
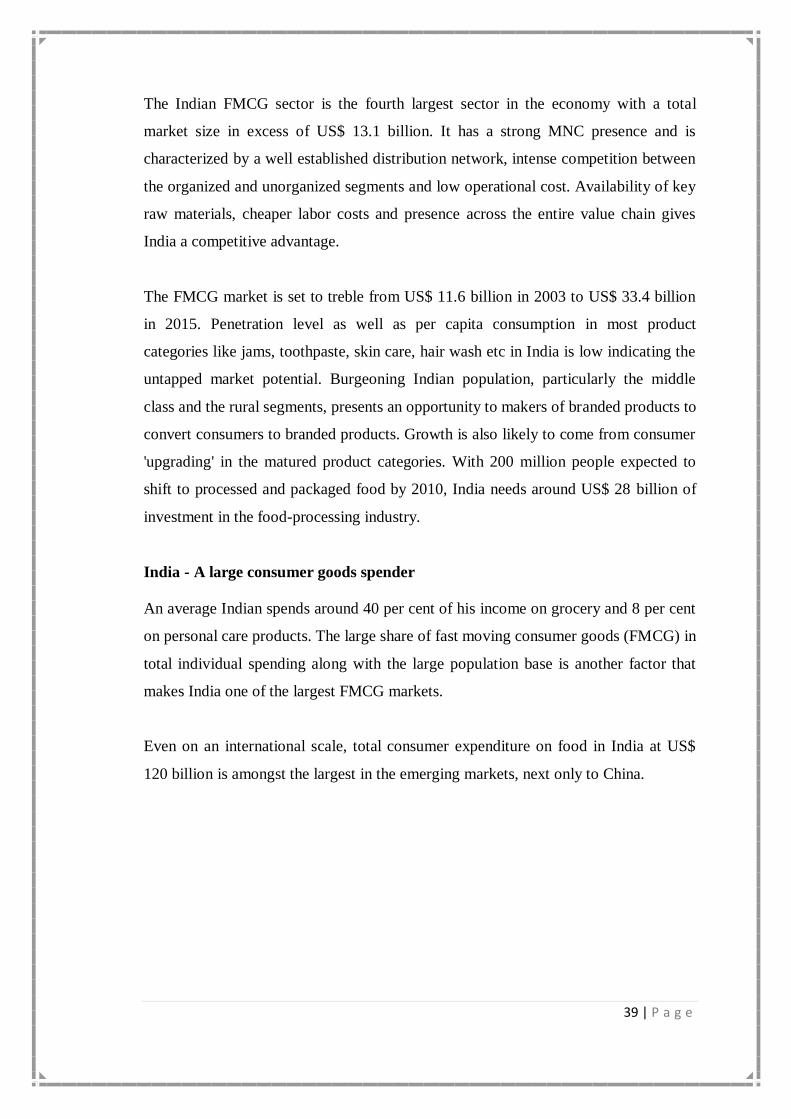
The Indian FMCG sector is the fourth largest sector in the economy with a total
market size in excess of US$ 13.1 billion. It has a strong MNC presence and is
characterized by a well established distribution network, intense competition between
the organized and unorganized segments and low operational cost. Availability of key
raw materials, cheaper labor costs and presence across the entire value chain gives
India a competitive advantage.
The FMCG market is set to treble from US$ 11.6 billion in 2003 to US$ 33.4 billion
in 2015. Penetration level as well as per capita consumption in most product
categories like jams, toothpaste, skin care, hair wash etc in India is low indicating the
untapped market potential. Burgeoning Indian population, particularly the middle
class and the rural segments, presents an opportunity to makers of branded products to
convert consumers to branded products. Growth is also likely to come from consumer
'upgrading' in the matured product categories. With 200 million people expected to
shift to processed and packaged food by 2010, India needs around US$ 28 billion of
investment in the food-processing industry.
India - A large consumer goods spender
An average Indian spends around 40 per cent of his income on grocery and 8 per cent
on personal care products. The large share of fast moving consumer goods (FMCG) in
total individual spending along with the large population base is another factor that
makes India one of the largest FMCG markets.
Even on an international scale, total consumer expenditure on food in India at US$
120 billion is amongst the largest in the emerging markets, next only to China.

40 | P a g e
2.3 FMCG Categories of products and Sales Promotion Schemes:
2.3.1 Product Category: Detergent Cake As on 31 -03 - 2010
Brand Type Weight (gms) Price ( Rs) Scheme
Nirma White detergent cake 250 5 ~
Blue detergent cake 190 6 ~
Super 250 9 ~
Surf excel Detergent cake 75 8 Rs 1 off
Detergent cake 4*192 90 Rs 10 off
Detergent cake 120 13 ~
Combi pack 200 24 ~
Wheel Active 6*190 31 ~
Green 182 5 20 % free
Tide Detergent cake 250 17 ~
Rin Detergent cake 100 6 Rs. 1 off
Advance 5*200 58 Rs. 10 off
Hipolin Shakti 6*180 34 ~

41 | P a g e
2.3.2 Product Category: Cooking Oil As on 31 -03 - 2010
Brand Types Weight Price (Rs) Scheme
Rani Groundnut Oil 15kg. 1185 ~
15lt. 1095 ~
5lt. 380 ~
Cotton seed Oil 15kg. 760 ~
15lt. 680 ~
5lt. 250 ~
Gulab Groundnut Oil 15 kg. 1190 ~
15lt. 1100 ~
5lt. 380 ~
Cotton seed Oil 15kg. 760 ~
Rajmoti Groundnut Oil 15kg. 1180 ~
15lt. 1070 ~
Cotton seed Oil 15kg. 720 ~
Tirupati Cotton seed Oil 15kg. 790 ~
5lt. 250 ~
corn oil 15lt. 770 ~
Ekka Groundnut Oil 15lt. 1150 ~
5lt. 350 ~
Cotton seed Oil 15lt. 750 ~
5lt. 240 ~
Fortune Sunflower Oil 15lt. Tin 890 ~
15lt.can 900 ~
5lt. 320 ~
Soyabean Oil 15lt.tin 830 ~
5lt. 310 ~
Mustard Oil 5lt. 350 ~
Nutrela Sunflower Oil 15lt.tin 840 ~
15lt.can 850 ~
15kg.tin 910 ~
Soyabean Oil 5lt. 290 ~
Corn Drop Corn Oil 15lt.tin 860 ~
15lt.can 860 ~
5lt. 320 ~

42 | P a g e
2.3.3 Product Category: Energy Drink As on 31 -03 – 2010
Brand Types/ Flavor
Weight
(gram)
Price
(Rs) Scheme
Complan Kesar Badam 175 97 ~
Complan Kesar Badam 400 190 ~
Complan Chocolate 200 94 ~
Complan Chocolate 500 185 ~
Complan
(bottle) Chocolate 500 195 ~
Horlicks b Chocolate 500 145 ~
Horlicks Chocolate 500 138 ~
Horlicks Chocolate 200 70 ~
Horlicks Junior Horlicks 500 160 ~
Horlicks Junior Horlicks 200 75 ~
Horlicks Chocolate tin 1000 250 free tin
Boost b Chocoblast 500 142
skipping rope
free
Boost Chocoblast 500 135
skipping rope
free
Dabur Chyawan junior 500 131 ~
Dabur
Chyawan junior
B 500 138 ~
Bornvita ++ B 500 138 ~
Bornvita ++ 500 131 ~
Bornvita ++ 350 99 ~
Bornvita Little champs 200 90 ~
Bornvita Little champs 500 175 ~
Bornvita ++ 1000
Free box &
Save Rs 21

43 | P a g e
2. 3. 4 Product Category: Deodorant As on 31 -03 – 2010
Brand Types/ Flavor Weight Price (Rs) Scheme
Spinz Samba 150ml 135 ~
Spinz Tango 150ml 135 ~
Spinz Black Magic 150ml 135 ~
Spinz Rock N Roll 150ml 135 ~
Nivia Dry Comfort 150ml 145 ~
Nivia For Man 150ml 169
Free Pepsi my can
250ml
Dove 167ml 160 Shop free 75gm Rs. 33
Spinz Race 150ml 145 ~
Spinz sports 150ml 145 ~
Spinz club 150ml 145 ~
Reebok Reegame 150 165 5.1fl.oz
Reebok Reenergy 150 166 5.1fl.oz
Reebok Recharge 150 167 5.1fl.oz
Z 200 145 50ml free
44 | P a g e
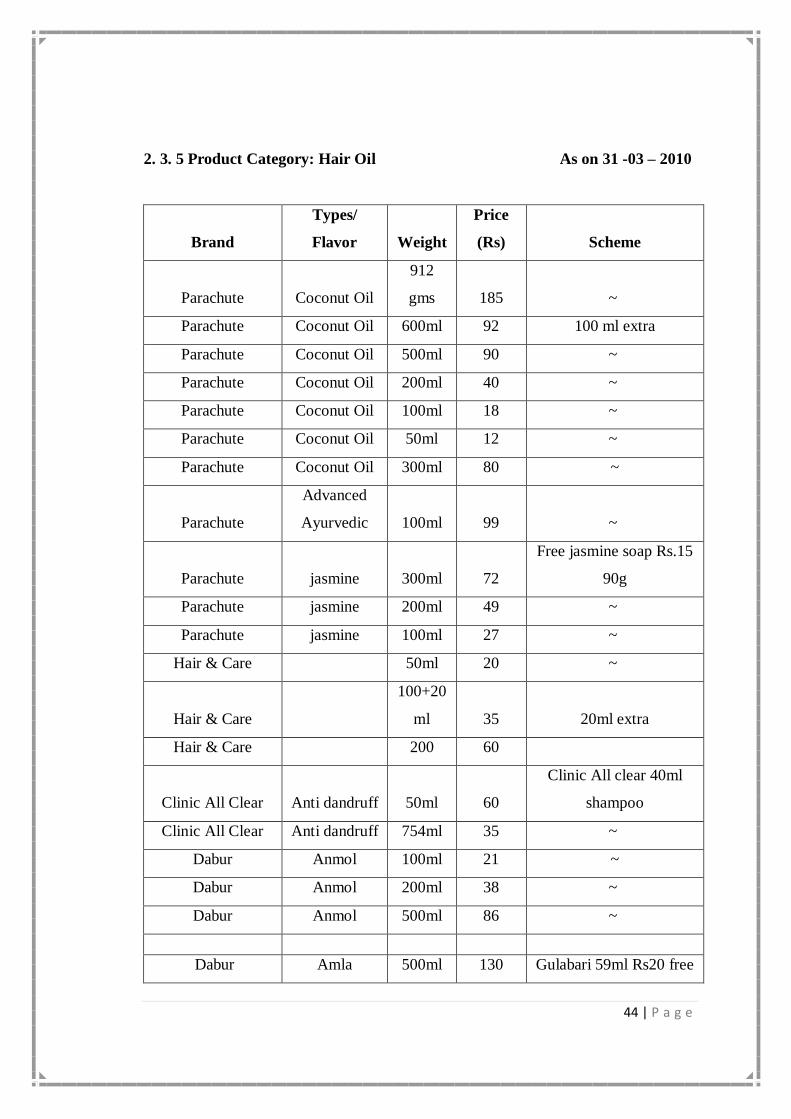
2. 3. 5 Product Category: Hair Oil As on 31 -03 – 2010
Brand
Types/
Flavor Weight
Price
(Rs) Scheme
Parachute Coconut Oil
912
gms 185 ~
Parachute Coconut Oil 600ml 92 100 ml extra
Parachute Coconut Oil 500ml 90 ~
Parachute Coconut Oil 200ml 40 ~
Parachute Coconut Oil 100ml 18 ~
Parachute Coconut Oil 50ml 12 ~
Parachute Coconut Oil 300ml 80 ~
Parachute
Advanced
Ayurvedic 100ml 99 ~
Parachute jasmine 300ml 72
Free jasmine soap Rs.15
90g
Parachute jasmine 200ml 49 ~
Parachute jasmine 100ml 27 ~
Hair & Care 50ml 20 ~
Hair & Care
100+20
ml 35 20ml extra
Hair & Care 200 60
Clinic All Clear Anti dandruff 50ml 60
Clinic All clear 40ml
shampoo
Clinic All Clear Anti dandruff 754ml 35 ~
Dabur Anmol 100ml 21 ~
Dabur Anmol 200ml 38 ~
Dabur Anmol 500ml 86 ~
Dabur Amla 500ml 130 Gulabari 59ml Rs20 free

45 | P a g e
Brand
Types/
Flavor Weight
Price
(Rs) Scheme
Dabur
300ml 85
Dabur Red toothpaste
50g
Dabur
100ml 32
Dabur ~ 50ml 16 ~
Bajaj Almond
Drops ~ 300ml 95 ~
Bajaj Almond
Drops ~ 200ml 67 40g Colgate of Rs 12
Bajaj Almond
Drops ~ 100ml 40 ~
Bajaj Almond
Drops ~ 75ml 29 ~
Bajaj Almond
Drops ~ 50ml 22 ~
Bajaj Almond
Drops ~ 20ml 10 ~
Dabur Vatika ~ 300ml 85 ~
Dabur Vatika ~ 150ml 45 ~
Dabur Vatika ~ 75ml 23 ~
Dabur Vatika ~ 200ml 70 ~

46 | P a g e
2.3.6 Product Category: Hair Colour As on 31 -03 – 2010
Brand Types Weight
Price
(Rs) Scheme
Garnier
(Men/Women
) Natural black 40 gm 120
Garnier shampoo
worth Rs. 36
Developer 60 ml 120
Brown 60 ml 120 ~
Darkest
Brown 60 ml 120 ~
Light Brown 60 ml 120 ~
Burgandy 60 ml 120 ~
Copper red 60 ml 150
Garnier fairness
cream worth Rs. 75
Intense red 60 ml 150
Garnier fairness
cream worth Rs. 75
Garnier (men)
Darekest
brown 60 ml 79 ~
Natural black 60 ml 79 ~
Burgandy 60 ml 79 ~
Revlon
Medium
brown 40 gm 145 ~
Developer 60ml 145 ~
Natural black 60ml 145 ~
Brown black 60ml 145 ~
Darkest
brown 60ml 145 ~
Burgandy 60ml 145 ~
Light golden
brown 60ml 145 ~
Revlon
(Ammonia
free) Black 40ml 300 ~
Developer 40ml 300
Soft black 40ml 300 ~
Deep
burgandy 40ml 300 ~
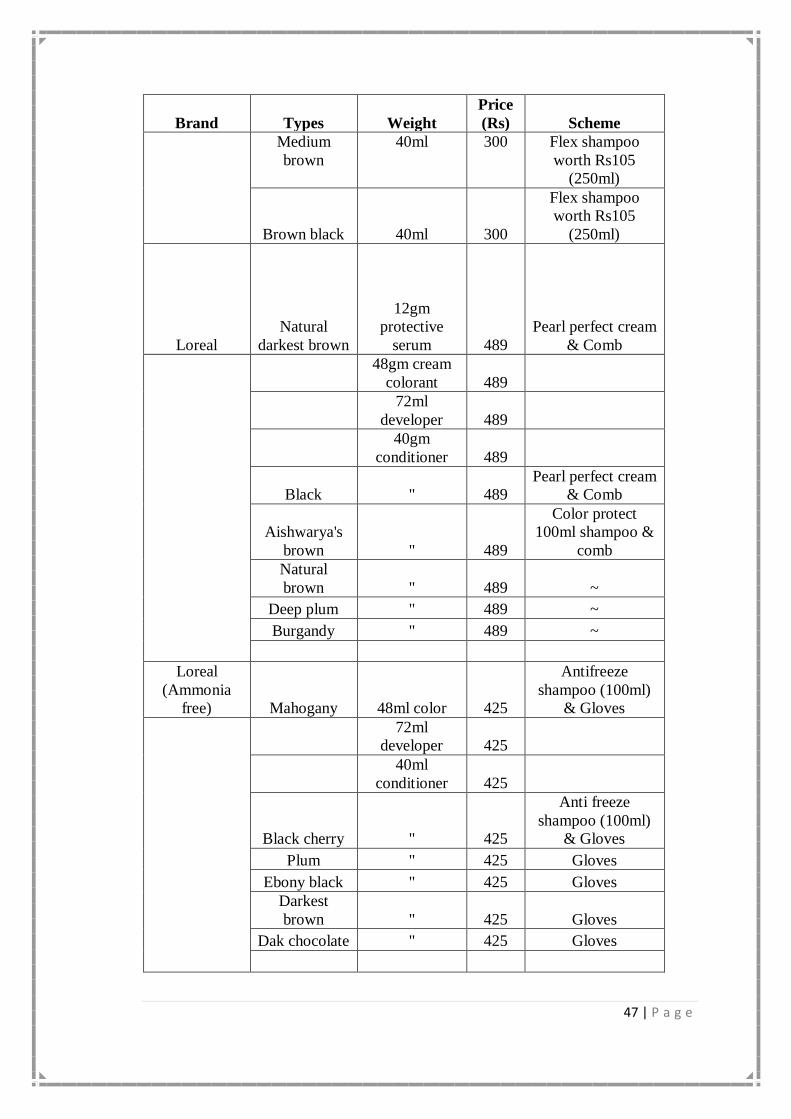
47 | P a g e
Brand Types Weight
Price
(Rs) Scheme
Medium
brown
40ml 300 Flex shampoo
worth Rs105
(250ml)
Brown black 40ml 300
Flex shampoo
worth Rs105
(250ml)
Loreal
Natural
darkest brown
12gm
protective
serum
489
Pearl perfect cream
& Comb
48gm cream
colorant 489
72ml
developer 489
40gm
conditioner 489
Black " 489
Pearl perfect cream
& Comb
Aishwarya's
brown " 489
Color protect
100ml shampoo &
comb
Natural
brown " 489 ~
Deep plum " 489 ~
Burgandy " 489 ~
Loreal
(Ammonia
free) Mahogany 48ml color 425
Antifreeze
shampoo (100ml)
& Gloves
72ml
developer 425
40ml
conditioner 425
Black cherry " 425
Anti freeze
shampoo (100ml)
& Gloves
Plum " 425 Gloves
Ebony black " 425 Gloves
Darkest
brown " 425 Gloves
Dak chocolate " 425 Gloves

48 | P a g e
2.3.7 Product Category: Shaving Cream As on 31 -03 – 2010
Brand Types Weight Price Scheme
Palmolive Refreshing 30 29 ~
84 45 20% Extra
Menthol 84 45 20% Extra
Godrej Lime Fresh 91 50 30% Extra
Rich Foam 91 45 30% Extra
20 18 ~
Fa Cool wave 91 50 30% Extra
Menthol 84 42 20% Extra
Denim ~ 70 55 ~
~ 30 20 ~
Old Spice Mask 70 55 ~
70 55 ~
Original 30 29 ~
70 55 ~
Gillette Ultra Comfort 60 55 ~
Tough Beard 60 55 ~
V John Premium 31 25 30% Extra
Lime Fresh 125 24 ~
70 18 ~
30 12 ~
Menthol 125 24 ~
70 18 ~
Vasmol ~ 30 12 ~
Extra Leather 125 20 ~
Lemony 125 20 ~
Splash 125 20 ~

49 | P a g e
2.3.8 Product Category: Fairness Cream As on 31 -03 – 2010
Brand Types Weight Price Scheme
Fair & lovely Total fairness 25 37 ~
Anti marks 25 45 ~
Winter care 25 37 ~
Men's active 25 36 ~
Ayurvedic 25 37 ~
Total fairness 50 68 ~
Anti marks 50 80 ~
Winter care 50 68 ~
Men's active 50 66 ~
Ayurvedic 50 62 ~
Total fairness 80 90 ~
Ponds ~ 25 65 ~
~ 50 185 Face Wash 50 gms Rs. 60
Olay Natural white 20 99 ~
50 299 ~
Fair ever Fruit fair ever 20 35 ~
50 65 ~
Vicco turmeric
~ 30 83 ~
~ 50 121 ~
~ 70 140 Vicco Paste Free
Fair one ~ 25 35 15ml Fair one scrub free
Revlon Touch & glow 50 110 ~
~
Loreal Perfect white 50 499 ~
Garnier Garnier light 18 69 45gm Face wash free
~ 40 125 ~
Neutrogena Fine fairness 50 299 ~

50 | P a g e
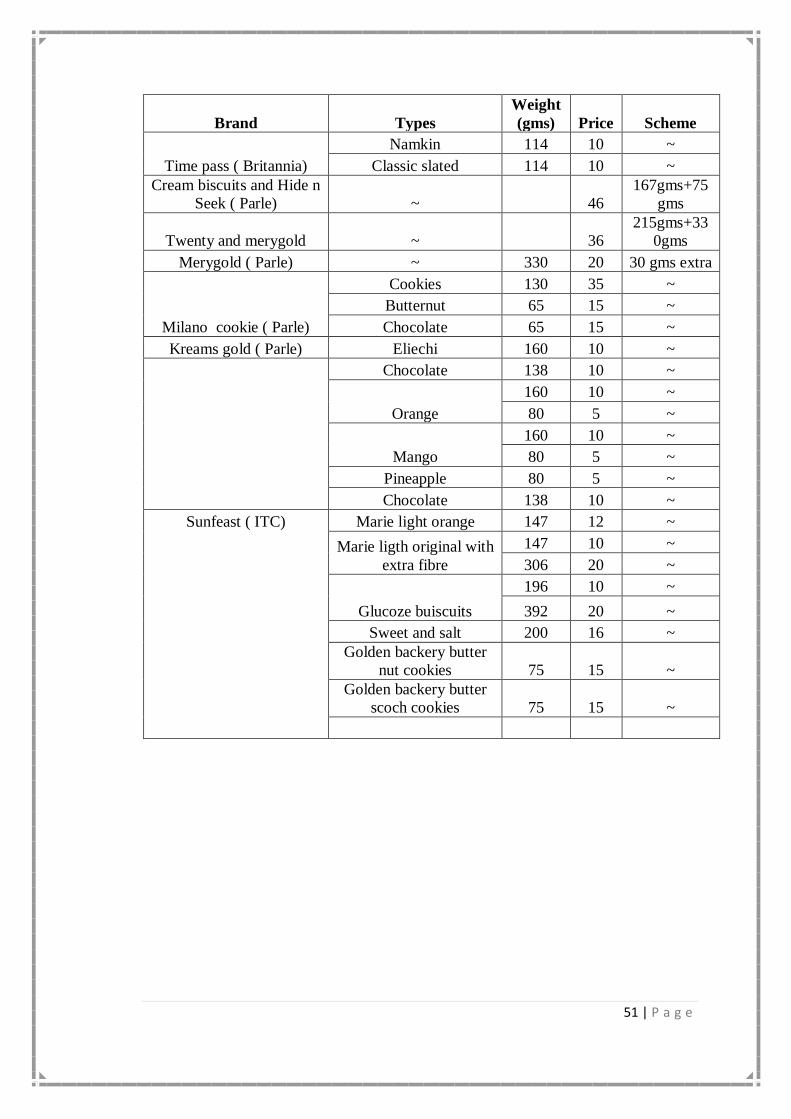
2.3.9 Product Category: Biscuits As on 31 -03 – 2010
Brand Types
Weight
(gms) Price Scheme
Coconut (Surya Agro) ~ 320 50 ~
Marielite (Surya Agro) ~ 350 35 ~
CNC (Surya Agro) ~ 240 30 ~
Tasty treat (Unibic) ~ 400 56 Rs.16 Off
Marie gold (Unibic) ~ 304 20 ~
Cream Biscuits Bourne born 175 25 ~
Cream for fun
Mango 175 25 ~
Chocolate 175 25 ~
Bourne born ( Britannia) ~ 169 22 ~
Tigre ( Britannia) ~ 201 10 ~
402 20 ~
Cream biscuits (
Britannia) Orange 176 10 16gms free
Eliechi 176 10 16gms free
Chocolate 72 5 ~
Treat ( Britannia) Jimjam 100 14 ~
200 25 ~
Masti orange 200 20 ~
100 12 ~
Eliechi fun 100 12 ~
Gooday ( Britannia)
Butter
90 10 ~
180 20 ~
Kesar 90 13 ~
Pista badam 90 16 ~
Cookies ( Britannia)
Chocolate 90 18 ~
Chocolate chip 75 15 ~
Nice time ( Britannia) ~ 173 18 ~
Vita marigold (
Britannia) ~ 278 27 ~
Milkbikis ( Britannia)
~ 178 24 ~
~ 89 15 ~
Bourne born ( Britannia) ~ 78 10 ~
50 50 tasty- tasty (
Britannia)
~ 113 10 ~
Maska Chaska 66 10 ~
51 | P a g e
Brand Types
Weight
(gms) Price Scheme
Time pass ( Britannia)
Namkin 114 10 ~
Classic slated 114 10 ~
Cream biscuits and Hide n
Seek ( Parle) ~ 46
167gms+75
gms
Twenty and merygold ~ 36
215gms+33
0gms
Merygold ( Parle) ~ 330 20 30 gms extra
Milano cookie ( Parle)
Cookies 130 35 ~
Butternut 65 15 ~
Chocolate 65 15 ~
Kreams gold ( Parle) Eliechi 160 10 ~
Chocolate 138 10 ~
Orange
160 10 ~
80 5 ~
Mango
160 10 ~
80 5 ~
Pineapple 80 5 ~
Chocolate 138 10 ~
Sunfeast ( ITC) Marie light orange 147 12 ~
Marie ligth original with
extra fibre
147 10 ~
306 20 ~
Glucoze buiscuits
196 10 ~
392 20 ~
Sweet and salt 200 16 ~
Golden backery butter
nut cookies 75 15 ~
Golden backery butter
scoch cookies 75 15 ~

52 | P a g e
2.3.10 Product Category: Tooth Paste As on 31 -03 – 2010
Brand Types
Weigh
t
Pric
e Scheme
Dabur-babul Natural calcium
380gm
s 54 2 toothbrushes Free
Natural calcium
135gm
s 18 50% free
Natural calcium 50gms 10 1 toothbrush Free
Dabur-red Red
200gm
s 54 1 toothbrush Free
Red 50gms 13 ---
Meswak ---
200gm
s 30 ---
---
100gm
s 18 ---
Close up active-gel Red hot
300gm
s 92 Save 18 Rs.
Red hot
150gm
s 54 ---
Red hot 40gms 15 ---
Red hot 35gms 10 ---
Menthol-chill
150gm
s 55 ---
Menthol-chill 80gms 32 ---
Milk-calcium
150gm
s 57 ---
Milk-calcium 80gms 32 ---
Lemon-mint
150gm
s 55 ---
Lemon-mint 80gms 32 ---
Peppermint-splash
150gm
s 55 ---
Peppermint-splash 80gms 32 ---
Pepsodent 2 in 1 Germicheck plus
300gm
s 77 Save 13 Rs.
2 in 1 Germicheck plus
200gm
s 56 Save 4 Rs.
2 in 1 Germicheck plus
170gm
s 50 20gms Free
2 in 1 Germicheck plus 80gms 25 ---
2 in 1 Germicheck plus 40gms 10 ---
2 in 1 Germicheck plus 20gms 5 ---
Whitening
150gm
s 52 ---
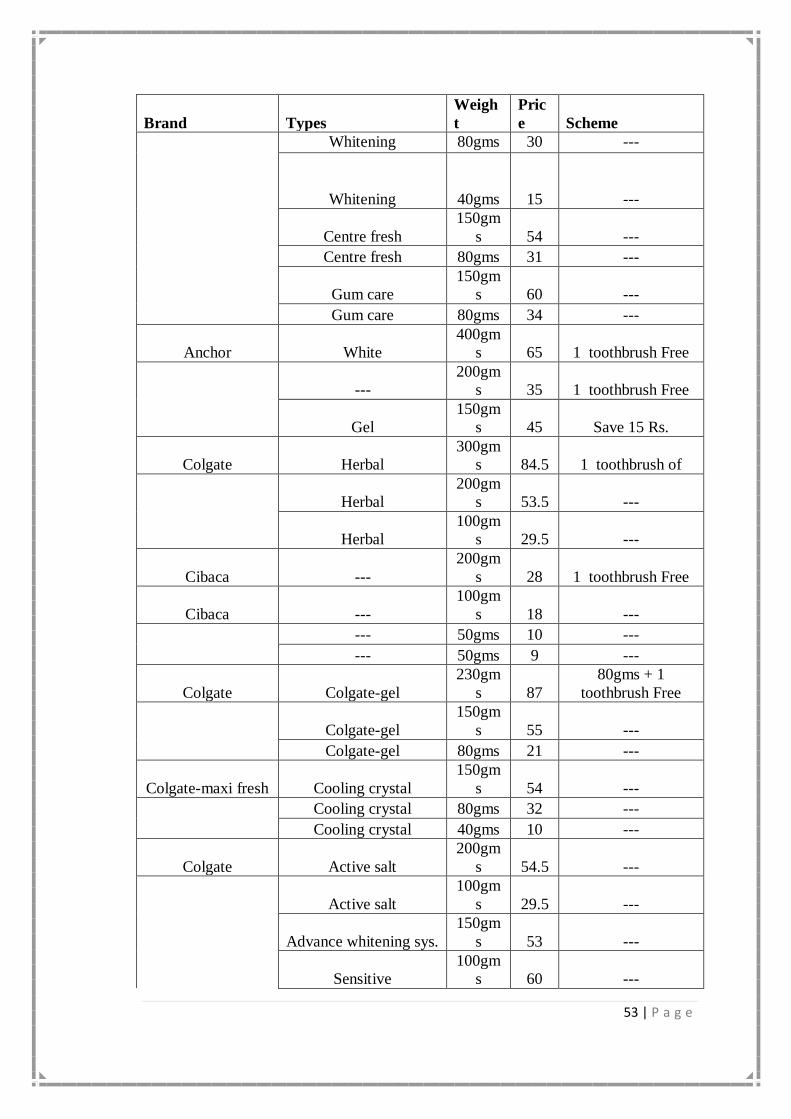
53 | P a g e
Brand Types
Weigh
t
Pric
e Scheme
Whitening 80gms 30 ---
Whitening
40gms
15
---
Centre fresh
150gm
s 54 ---
Centre fresh 80gms 31 ---
Gum care
150gm
s 60 ---
Gum care 80gms 34 ---
Anchor White
400gm
s 65 1 toothbrush Free
---
200gm
s 35 1 toothbrush Free
Gel
150gm
s 45 Save 15 Rs.
Colgate Herbal
300gm
s 84.5 1 toothbrush of
Herbal
200gm
s 53.5 ---
Herbal
100gm
s 29.5 ---
Cibaca ---
200gm
s 28 1 toothbrush Free
Cibaca ---
100gm
s 18 ---
--- 50gms 10 ---
--- 50gms 9 ---
Colgate Colgate-gel
230gm
s 87
80gms + 1
toothbrush Free
Colgate-gel
150gm
s 55 ---
Colgate-gel 80gms 21 ---
Colgate-maxi fresh Cooling crystal
150gm
s 54 ---
Cooling crystal 80gms 32 ---
Cooling crystal 40gms 10 ---
Colgate Active salt
200gm
s 54.5 ---
Active salt
100gm
s 29.5 ---
Advance whitening sys.
150gm
s 53 ---
Sensitive
100gm
s 60 ---

54 | P a g e
Brand Types
Weigh
t
Pric
e Scheme
Sensitive 50gms 35 ---
Maxi white-crystal
mint
150gm
s 57 ---
Total-clear mint
150gm
s 65 ---
Total-clear mint 75gms 35 ---
Dora explora 80gms 44 ---
Bubble 80gms 44 ---
Kids strawberry 80gms 44 ---
Amway Glister
100gm
s 120
40%off(scheme
once in a Year)
55 | P a g e
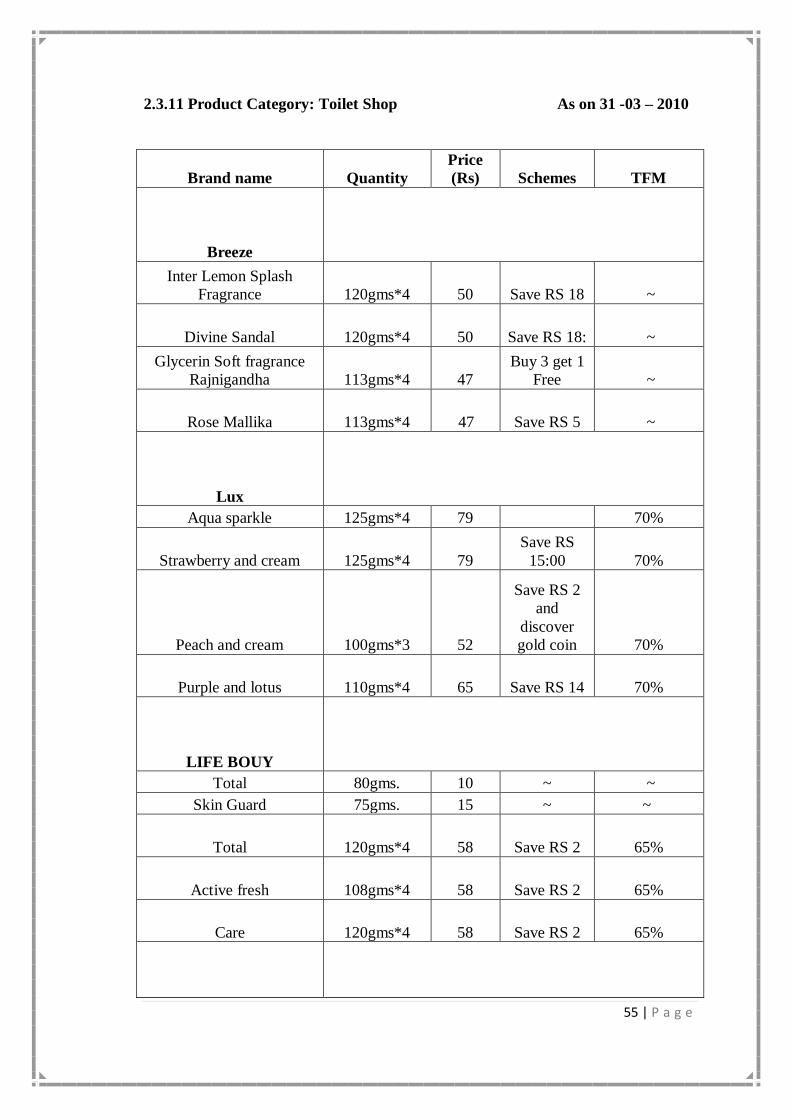
2.3.11 Product Category: Toilet Shop As on 31 -03 – 2010
Brand name Quantity
Price
(Rs) Schemes TFM
Breeze
Inter Lemon Splash
Fragrance 120gms*4 50 Save RS 18 ~
Divine Sandal 120gms*4 50 Save RS 18: ~
Glycerin Soft fragrance
Rajnigandha 113gms*4 47
Buy 3 get 1
Free ~
Rose Mallika 113gms*4 47 Save RS 5 ~
Lux
Aqua sparkle 125gms*4 79
70%
Strawberry and cream 125gms*4 79
Save RS
15:00 70%
Peach and cream 100gms*3 52
Save RS 2
and
discover
gold coin 70%
Purple and lotus 110gms*4 65 Save RS 14 70%
LIFE BOUY
Total 80gms. 10 ~ ~
Skin Guard 75gms. 15 ~ ~
Total 120gms*4 58 Save RS 2 65%
Active fresh 108gms*4 58 Save RS 2 65%
Care 120gms*4 58 Save RS 2 65%

56 | P a g e
Brand name Quantity
Price
(Rs) Schemes TFM
Dettol
Skin care 108gms 29 ~ 71%
Original 108gms 29 ~ 71%
Original 108gms*3 75 Save RS 12 71%
Fresh 120gms*3 75 Save RS12 71%
Cool 120gms*3 75 Save RS 12 71%
Skin care 70gms*3 54
Free Head
& Shoulder
shampoo
worth RS
12 71%
Fresh 70gms*3 54
Free Head
& Shoulder
shampoo
worth RS
12 71%
Original 70gms*3 47 Save RS 7 71%
Dyna
Milk and almond 114gms*4 51 Buy 3 get 1 76%
Lime and aloe Vera 114gms*4 51 Buy 3 get 1 76%
Milk and rose 114gms*4 51 Buy 3 get 1 76%
Sandal and saffron 114gms*4 51 Buy 3 get 1 76%
Dove
Cream beauty bar 71 gms 33 ~ ~
Fresh moisturizer 95 gms 45 ~ ~
Pink 100 gms 50 ~ ~
value pack 300 gms 125 Save RS 7 ~
~

57 | P a g e
Brand name Quantity
Price
(Rs) Schemes TFM
Cinthol
Deo musk 92gms. 22
~
fresh lime 81gms.*4 52 Save Rs. 16 ~
fresh aqua 81gms.*4 52 Save Rs. 16 ~
No. 1
Moisturizing cream 92gms.*4 50 Save Rs. 8 ~
Lime & aloe Vera 104gms.*4 50 Save Rs. 8 ~
Natural 104gms.*4 50 Save Rs. 8 ~
Rose 104gms.*4 50 Save Rs. 8 ~
Jasmine 104gms.*4 50 Save Rs. 8 ~
Sandal 109gms.*4 50 Save Rs. 8 ~
Fairglow (Natural Oxy -G) 109gms.*4 80 Save Rs. 20 ~
Vigil (strong) 68gms.*4 39 Save Rs. 9 ~
58 | P a g e
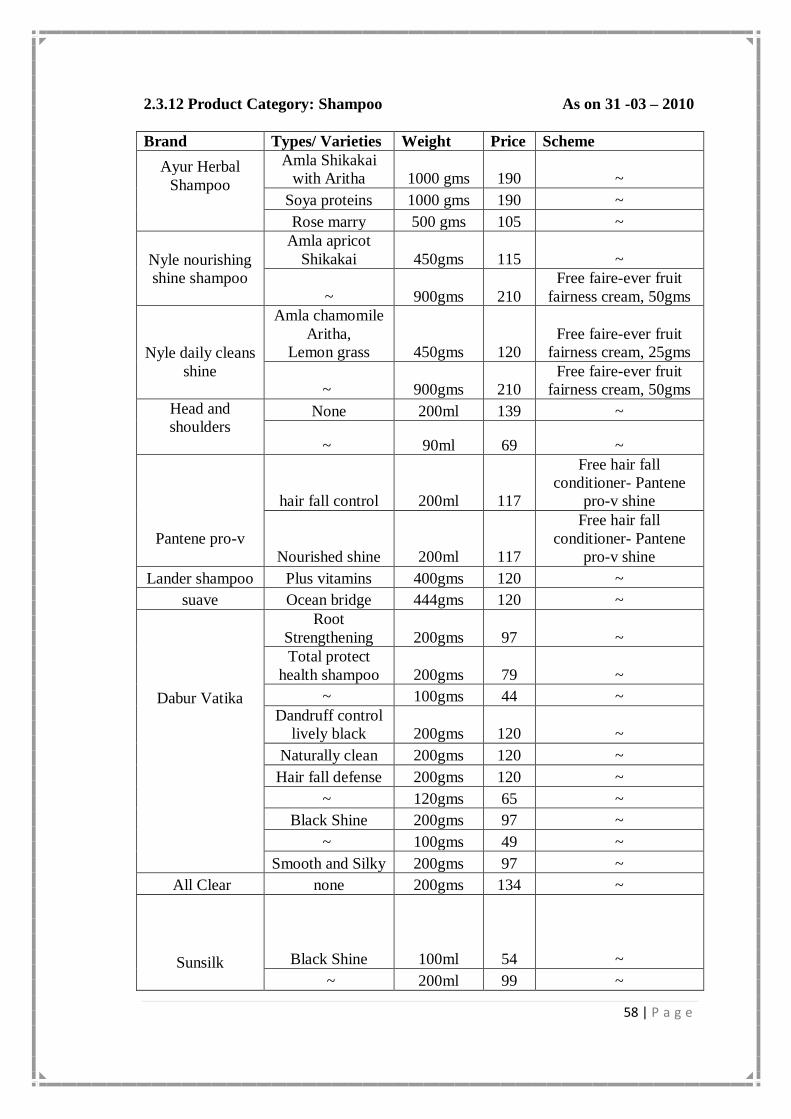
2.3.12 Product Category: Shampoo As on 31 -03 – 2010
Brand Types/ Varieties Weight Price Scheme
Ayur Herbal
Shampoo
Amla Shikakai
with Aritha 1000 gms 190 ~
Soya proteins 1000 gms 190 ~
Rose marry 500 gms 105 ~
Nyle nourishing
shine shampoo
Amla apricot
Shikakai 450gms 115 ~
~ 900gms 210
Free faire-ever fruit
fairness cream, 50gms
Nyle daily cleans
shine
Amla chamomile
Aritha,
Lemon grass 450gms 120
Free faire-ever fruit
fairness cream, 25gms
~ 900gms 210
Free faire-ever fruit
fairness cream, 50gms
Head and
shoulders
None 200ml 139 ~
~ 90ml 69 ~
Pantene pro-v
hair fall control 200ml 117
Free hair fall
conditioner- Pantene
pro-v shine
Nourished shine 200ml 117
Free hair fall
conditioner- Pantene
pro-v shine
Lander shampoo Plus vitamins 400gms 120 ~
suave Ocean bridge 444gms 120 ~
Dabur Vatika
Root
Strengthening 200gms 97 ~
Total protect
health shampoo 200gms 79 ~
~ 100gms 44 ~
Dandruff control
lively black 200gms 120 ~
Naturally clean 200gms 120 ~
Hair fall defense 200gms 120 ~
~ 120gms 65 ~
Black Shine 200gms 97 ~
~ 100gms 49 ~
Smooth and Silky 200gms 97 ~
All Clear none 200gms 134 ~
Sunsilk
Black Shine
100ml
54
~
~ 200ml 99 ~

59 | P a g e
Brand Types/ Varieties Weight Price Scheme
Sunsilk
Anti dandruff
shampoo 200ml 97 ~
Damaged hair
reconstruction 200ml 99 ~
Dream soft and
Smooth 200ml 99 ~
~ 400ml 169 ~
Luscious & thick
Long 400ml 169 ~
Hair Fall Solution 400ml 169 ~
Garnier Fructice
~
100ml+100
gms 115
Fortifying shampoo &
conditioner- Rs 23 Off
~
200ml+200
gms 209
Fortifying shampoo &
conditioner- Rs 48 Off
~
100ml+100
gms 110
Silk & shine shampoo
and conditioner- Rs 22
Off
~
200ml+200
gms 209
Silk & shine shampoo
and conditioner- Rs 47
Off
~
100ml+100
gms 110
Dry & damage, Rs 22
Off
~
200ml+200
gms 209
Dry & damage, Rs 47
Off
~
100ml+100
gms 110
Long & Strong- Rs 22
Off
Anti dandruff
shampoo 400ml 215 ~
Normal shampoo 400ml 199 ~
200ml 117 ~
Silk n shine
shampoo 200ml 117 ~
2in 1 shampoo 200ml 99 ~
100ml 54 ~
New color protect
Conditioner 90gms 80 ~
Himalaya
Anti hair fall
shampoo 200ml 120 ~
400ml 199 ~
Himalaya
Protein shampoo 200ml 105 ~
~ 400ml 180 ~
softness and
shine 200ml 105 ~

60 | P a g e
2.3.13 Product Category: Face Wash As on 31 -03 – 2010
Brand Types/ Varieties Weight Price
Schem
e
Lakme (HUL)
Strawberry 100gms 99 ~
50gms 60 ~
Matt effect 100gms 110 ~
50gms 70 ~
pure defense 100gms 165 ~
50gms 99 ~
Fundamentals 100gms 125 ~
Dove fresh moisturizer 50ml 65 ~
Gentle Exfoliating 50ml 65 ~
Pond's
Pears 60gms 45 ~
Clear Solution 50gms 33 ~
Perfect Matte 50gms 60 ~
Daily Face Wash 50gms 35 ~
Intensive Moisture 50gms 60 ~
Garnier
Essential 50gms 38 ~
Gentle Face Wash (Light) 48gms 65 ~
Pure (Purifying micro
particels) 75ml 99 ~
Gel Face Wash 125ml 99 ~
Fresh 50ml 57 ~
Nivea Visage Refreshing water 75ml 45 ~
Himalaya (Ayurvedic)
Neem Face Wash 50ml 45 ~
Gental Exfoliating 50ml 55 ~
Oil Balancing Gel 50ml 40 ~
Hydrating 50ml 40 ~
Himalaya (Ayurvedic)
Neem Face Wash 50ml 45 ~
Gentle Exfoliating 50ml 55 ~
Oil Balancing Gel 50ml 40 ~
Hydrating 50ml 40 ~
Everyuth (Zydus Cadila)
Fruit Face Wash 72gms 40
20%
Extra
Menz Scrub 75gms 60 No
Lemon 75gms 60
20%
Extra
Neem Face Wash 72gms 35
20%
Extra
Cream Face Wash 72gms 35
20%
Extra
Light & Clear 60gms 50
20%
Extra

61 | P a g e
Brand Types/ Varieties Weight Price
Schem
e
Menz Scrub 75gms 70 ~
Menz pollution defense 75gms 60 ~
Intensive Moisturizer 75gms 65 ~
Fair One (Elder Pharma) Face scrub 60ml 45 ~
No Marks (Ozone
Ayurvedic)
Face Wash Ayurvedic 60ml 36 ~
No Pimple No Marks 60ml 45 ~
Clearasil (Reckitt‘s
Benckiser)
Daily Face Wash 50ml 55 ~
~
Neutrogena
Deep Clean Gentle Scrub 50gms 95 ~
Foaming Cleanser 50gms 85 ~
Deep Clean Facial Cleaner 200ml 320 ~
Clean & Clear Foaming Facial 100gms 60 ~
Foaming Facial 50gms 35 ~
Olay Natural White 50gms 99 ~
Total Effect 50gms 125 ~
Ayur
Lemon & Honey Face
Wash 50ml 33 ~
Tulsi & Neem Face Wash 50ml 33 ~
62 | P a g e
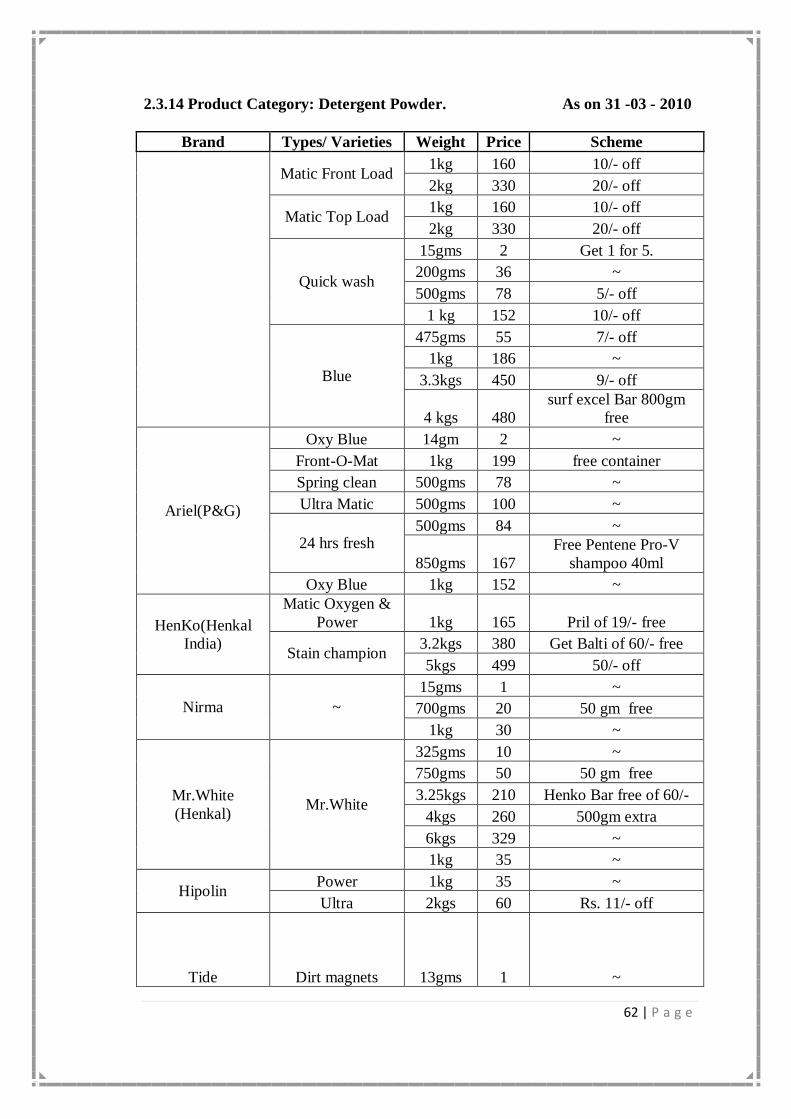
2.3.14 Product Category: Detergent Powder. As on 31 -03 - 2010
Brand Types/ Varieties Weight Price Scheme
Matic Front Load 1kg 160 10/- off
2kg 330 20/- off
Matic Top Load 1kg 160 10/- off
2kg 330 20/- off
Quick wash
15gms 2 Get 1 for 5.
200gms 36 ~
500gms 78 5/- off
1 kg 152 10/- off
Blue
475gms 55 7/- off
1kg 186 ~
3.3kgs 450 9/- off
4 kgs 480
surf excel Bar 800gm
free
Ariel(P&G)
Oxy Blue 14gm 2 ~
Front-O-Mat 1kg 199 free container
Spring clean 500gms 78 ~
Ultra Matic 500gms 100 ~
24 hrs fresh 500gms 84 ~
850gms 167
Free Pentene Pro-V
shampoo 40ml
Oxy Blue 1kg 152 ~
HenKo(Henkal
India)
Matic Oxygen &
Power 1kg 165 Pril of 19/- free
Stain champion 3.2kgs 380 Get Balti of 60/- free
5kgs 499 50/- off
Nirma ~
15gms 1 ~
700gms 20 50 gm free
1kg 30 ~
Mr.White
(Henkal) Mr.White
325gms 10 ~
750gms 50 50 gm free
3.25kgs 210 Henko Bar free of 60/-
4kgs 260 500gm extra
6kgs 329 ~
1kg 35 ~
Hipolin Power 1kg 35 ~
Ultra 2kgs 60 Rs. 11/- off
Tide
Dirt magnets
13gms
1
~

63 | P a g e
Brand Types/ Varieties Weight Price Scheme
13gms 1 ~
~
200gms 10 50 gm extra
500gms 35 ~
2kgs 140 ~
Jasmine & Rose
500gms 35 ~
2kgs 140 7/- off
4kgs 880 20/- off
Wheel (HUL)
Active gold 600gms 30 ~
Active gold 4kgs 200 ~
Active 650gms 20 2/- off
Active L&J 1kg 30 ~
2kgs 60
Two Rin Bar of Rs.10/-
free
Active Wheel 18gms 1 ~
300gms 10 25 gm extra
Rin(HUL)
Jasmine fresh
500gms 25 Rs. 10/- off
1kg 50 ~
4kg 195 Save Rs. 85/-
Rin
750gms 50 ~
1kg 70
Rin Bar 200gm of
Rs.10/- free
4kgs 195 Save Rs. 85/-
Rin advance 125gms 5 ~
6kgs 415 Save Rs.116/-
Considering above mentioned FMCG Product categories, it can be observed that two
types of sales promotion schemes are very popular among the marketers is Price off
and value added sales promotion schemes. Again in value added schemes free gift and
% extra are widely used. This is applicable across International, National and Local
brands of the FMCG. Furthermore from the point of views of consumer‘s benefits,
there are immediate and delayed types of benefits offered by various sales promotion
schemes. Among two types of benefits immediate benefits are widely used.
While discussing with the experts and academician it is found that the medium
through which sales promotion schemes awareness created among consumers also
plays important role to prefer the particular sales promotion scheme.

64 | P a g e
Going with it, for measuring the consumer preference of sales promotion schemes
four attributes and their levels have been identified as mentioned below.
2.3.1 Identification of Attributes & Attributes Levels:
Serial No Name of the Attribute Attribute Levels
1 Brand Type 1. International
2. National
3. Local
2 Awareness Medium 1. Point of purchase
material
2. Mass Media
3. Word of Mouth
3 Type of Sales promotion Schemes 1. Price off
2. Value Added
4. Type of Benefits 1. Immediate
2. Delayed
2.4 Brand Defined:
There are many definitions of what branding is and the common thread in most of
these definitions is that a brand must be clearly differentiated. The earlier definition of
a brand was proposed by the American Marketing Association ―a brand is a name,
term, sign, symbol, or design, or a combination of them, intended to identify the
goods or services of one seller or group of sellers and to differentiate them from those
of competitors‖ (O‘Malley, 1991:107). Although this definition was criticized for
being too product-oriented and with an emphasis on visual features as a differentiating
factor, Dibb, Simkin, Pride, & Ferrell (1997) modified this original definition to a
name, term, design, symbol or any other feature that identifies one seller's good or
service as distinct from those of other sellers. The key change in the definition by

65 | P a g e
Dibbs et al (1997) is ―any other feature‖ as this allows for intangibles such as brand
image as a point of differentiation and not only the tangible visual features.
Ambler (2003) takes on similar viewpoint to that of Dibb et al (1997) by expanding
the definition further as a name, symbol or design that identifies one or more product
and it is something that is bought by the consumers. Ambler (2003) further emphasize
the difference between a product and a brand by highlighting that unlike a product,
which can be produced in a factory and it can be copied by a competitor, a brand is
unique. Earlier definitions by Ambler (1995) was based on a consumer oriented
approach by defining a brand as a promise of the bundles of attributes that someone
buys and provide satisfaction.
The attributes that make up a brand may be real or illusory, rational or emotional,
tangible or invisible. Wood (2000) supports this view and highlights that a brand can
be defined from different perspective such as consumers' perspective and/or from the
brand owner's perspective. In addition, brands are sometimes defined in terms of their
purpose, and sometimes described by their characteristics.
According to Leiser (2004), the understanding of brands today is far beyond the
simplistic view of a logo, tagline or advertising image but a set of expectations and
associations evoked from experience with a company or product. Furthermore, it is all
about how customers think and feel about what the business or product can deliver
across the board. Batey (2008) elicit differences between a product and a brand as
follows: You buy a product for what it does; you choose a brand for what it means.
• A product sits on retailer‘s shelves; a brand exists in consumers‘ minds.
• A product can quickly be outdated; a brand is timeless.
• A product can be copied by a competitor; a brand is unique.
Davis (2002) reiterates that consumers do not have a relationship with a product or
service but he/she may have a relationship with a brand because a brand is a set of
promises and therefore the strongest brands own a place in the consumer‘s mind.
Furthermore, strong brands can increase the value of a company as investors are

66 | P a g e
willing to pay more for intangible asset such as a strong brand (Motameni and
Shahrokhi, 1998; Davis 2002; Ambler, 2003; Rooney, 1995). In the context of this
research paper, the question could be asked ―What is a strong brand?‖
According to Aaker (1996), a strong brand has a strong brand equity which is a set of
assets such as: brand name awareness, brand loyalty, perceived quality and brand
associations. However building strong brands is a challenge in today‘s environment as
there are substantial pressures and barriers both internal and external. Aaker (1996),
further highlights that one needs to understand these pressures and barriers in order to
develop strong brand strategies. Some of the barriers highlighted by Aaker (1996) are:
price, proliferation of competitors, fragmented media and so forth.
Barron (2003) takes on a view that strong brands are built on a solid internal
foundation based on four fundamentals:
• Create brand intent
• Align the organization
• Deliver customer experience
• Measure and refine
Creating brand intent maximizes the area of intersection between what a company
does well and distinctively and what its targeted customers want or need. When brand
intent is clear, it is important the whole organization is aligned to ensure that the
entire organization is able to deliver the brand intent as this will help deliver customer
experience through organizational capability and processes. Finally, a good evaluation
programme will ensure that brands stay on
intent (Barron, 2003).
Nandan (2005) suggests that strong brands have two very key distinct features namely
brand image and brand identity however no matter how good a company is such as
having a unique vision, strong management or superior product if the core benefits of
the brand are not clearly communicated to the right target audience, the brand will
ultimately fail. This is evidenced by well known strong brands such as Coke, Pepsi,
67 | P a g e
Mac Donald‘s, Nike, Apple etc. that are always communicated with clear benefits,
brand image and identity. Also, managers of strong brands understand the changing
needs of consumers and the micro and macro environments. According to Davis
(2000), an understanding of competitors is vital in building a strong brand and the
failure to understand one's competitors is ultimately the failure to know one's
customers: who they are, how they think, and how the brand can be adapted to meet
their needs.
Strong brands are developed over time and the branding literature increasingly
suggests that the strength of a brand is not due to the strength of creating a difference
in customer perceptions but rather brand strength is due to the meaning that the brand
creates (Kay, 2005). Brands however need to be relevant and appeal to the new
generation of consumers and that is why branding has evolved over the years and
strong brands are always being revitalized to maintain relevancy and to attract new
consumers.
2.5 The evolution of branding:
The definition of branding has evolved over the years and the Oxford English
dictionary (Oxford, 2009) traces the development of the word ―brand‖ from the
German word ―brandr‖ which referred to the mark made by burning with a hot iron
and its usage was first noted in 1552. According to Jevons (2005), branding was
discovered long before the earliest definition of marketing in 1561 which therefore
strongly suggests that branding was defined before the marketing subject was
discovered. Over the years the definition of branding has evolved from referring to a
brand as a name, symbol or logo‖ (O‘Malley, 1991:107) to people‘s perception about
a product or a company (Barron, 2003) and over time definitions within the business
literature have included value enhancement or adding value (Jevons, 2005).
According to Rooney (1995), the use of branding by big business is nothing new and
branding itself is more than one hundred years old with the majority of countries
having started trademark acts to establish the legality of a protected asset as far back
as 1890. The years 1800 through to 1925 were known as the richest period of name

68 | P a g e
giving (Hambleton, 1987). The 90‘s saw a change in branding with a focus on
creating mutually beneficial situations for the consumer and the brand. According to
Berry (1993), many companies realized that they needed adequate price control
measures and effective and efficient brand building activities to strengthen the brand
equity. Companies started applying brands to more diverse settings where the role of
branding has become more important.
The harsher environments in the 90‘s forced organizations to work harder to gain
profits and thus there was a shift in the way brand management was organized as it
became a team effort within organizations with a focus on enhancing the customer
experience (de Chernatony, 1996). The concept of branding also became more
globalised with global brands gaining more recognition and value. According to
Motameni and Shahrokhi (1998), brands that are available in many different countries
have more value than brands that are available in a fewer markets.
Over the years, companies have used branding as part of marketing strategy to grow
and diversify their businesses and during the 1980‘s, brands were used as valuable
assets for takeovers on the open market and this saw a rise in acquisition of branded
companies (Rooney, 1995). The increase in acquisitions in the 80‘s resulted in many
brands suffering because of the change in management that is always associated with
acquisitions and this resulted in many brands losing a clear image in the consumers
mind (Rooney, 1995).
According to Beverland (2005), brands have always been commercial agents and
brand managers take pride in their ability to meet the needs of their target market.
However, these two desires are in conflict with the recent trend towards positioning
brands as ―authentic,‖ emphasizing the timeless values desired by consumers while
downplaying apparent commercial motives. The dual problem for the firm is in
creating images of authenticity while dealing with the challenge that authenticity
presents for brand management. As such brands that seem to be too focused on the
bottom line and not on societal issues are sometimes viewed as not authentic.
69 | P a g e
According to Henkel, Tomczak, Heitmann & Herrmann (2007), market saturation and
consumer confusion have changed the role of branding dramatically during the last
decades. Consumers therefore try to handle the flood of apparently exchangeable
products and services by demanding those goods that provide a holistic and coherent
consumption experience. As a result, brands are no longer simple product labels, but
they are communication platforms towards customers and other stakeholders that
convey specific attributes of products or services as well as company values and
mission statements. Kunde (2002), highlights that today, however the western world
is over supplied and there is an over abundance of everything and we live in an era of
excess. Offering more of the same is no longer a viable option and differentiation and
uniqueness are important. Kunde (2002) further highlights that there is only one place
that marketers must be serious about and that is the human mind.
As highlighted in the earlier sections, consumers do not purchase products but
purchase brands and therefore top of mind awareness is important. If your brand can
maintain top of mind awareness and is unique and clearly differentiated, it becomes
easier for consumers to select this brand over those of competitors and it becomes part
of their repertoire. However no matter how much marketing support goes behind a
brand, it is important that the right message about what the brand stand for is
communicated. Today, brand management is still as complex as it was before as
brands are not static but evolve all the time and the role of brand custodians is to
ensure that the brand remains relevant in consumers‘ mind and repertoire.
2.6 Brand Equity and Perception:
Brand equity is normally used by most organizations as a measure of how strong the
brand is. Brand equity has been considered in many contexts, Aaker (1991), defines
brand equity from a consumer perspective of brand loyalty, awareness, perceived
quality and brand image whilst other authors such as Farquhar (1989) define brand
equity from a financial perspective (added value endowed by the brand). Because
brand equity is so important for marketers, many invest millions in marketing
activities that are meant to increase it; however there seem to be no link between

70 | P a g e
brand equity measures and financial performance. Many organizations track brand
equity consistently in order to ascertain consumer satisfaction, awareness and loyalty
amongst other things. Although this is a good practice, it does not add value if this
information is not shared with the rest of the organization especially the executives.
According to Ambler (2003), there is a big difference between measuring brand
valuation, market share and brand equity and more often than not most companies
focus on brand valuation rather than brand equity. Brand equity is the asset itself
whilst brand valuation measures what the asset is worth. It is therefore logical to put
measures in place to track how the asset (brand equity) is performing. In essence,
building strong brand equity can influence future consumer behaviour and therefore
increase the value of a brand (Ambler, 2003). According to a survey on top 100 most
valuable global brands 2009, knowing a brand‘s value is important as it enables
business leaders, investors and other stakeholders to make better decisions such as the
return on investment in marketing initiatives (Millward Brown, 2008). The brand
value is calculated based on the intrinsic value of the brand derived from its ability to
generate demand and is based on customer opinion (brand equity) and financial
performance (Millward Brown, 2008). This therefore supports the view that brand
equity tracking is important to ensure that the value of the asset is sustained.
A study conducted by Hong-bumm, Woo & Jeong (2003), on the effect of consumer-
based brand equity on firm‘s financial performance, they concluded that a lack of
brand equity in hotel firms can damage potential sales flow and that strong brand
equity can cause a significant increase in revenue. These findings were based on the
fact that consumers base their choice of hotel and how much they are prepared to pay
on key factors such as: brand loyalty, awareness, perceived quality and brand image
all of these which are key components of measuring brand equity.
From the discussion above, it is evident that brands are the heart of any business and
if well managed, they can help increase the firm‘s financial value however the
question is how many organizations are focusing on the short term (sales and market
share) versus long term (investing in brand building activities that will drive long term
growth and thus creating sustainable financial growth value of the firm).

71 | P a g e
Brand equity is another concept that is closely related to branding and brand
management. The concept of brand equity was invented in 1980‘s and only gained
popularity in the 1990‘s (Aaker, 1991). It is therefore still a relatively new and
complex concept that is often difficult to describe. The steadily growing literature
contains several often divergent viewpoints on the dimensions of brand equity, the
factors that influence it, the perspectives from which it should be studied, and the
ways to measure it. However, there is agreement among researchers on the general
definition of the concept. Brand equity is defined as the marketing effects or outcomes
that accrue to a product with its brand name compared with those that would accrue if
the same product did not have the brand name (Aaker 1991; Dubin, 1998; Farquhar
1989; Keller 2003; Leuthesser 1988).
Ambler (2003: 281), defines brand equity as ― an important intangible asset for the
company, it can be seen as the reservoir of results gained by good marketing but not
yet delivered to the profit and loss account‖. Yoo, Donthu & Lee (2000), define brand
equity as the difference in consumer choice between a branded and unbranded product
given the same level of product features. Aaker (1991) defines it as a set of assets and
liabilities connected to a brand that add to or detract from its value to the customer
and to the business and creating brand equity profile involves the identification of the
various customer associations with a brand and levels of customer awareness and
loyalty that set it apart from competitors. Leiser (2004), concur and adds that all those
associations (positive, negative and neutral) evoked from customer experience with a
brand combine to create the brand‘s equity.
Because brand equity is such a complex subject, it can be viewed from a variety of
perspectives. Motameni and Shahrokhi (1998), highlights that although brand equity
is generally viewed from two perspectives such as: marketing decision making and
financial perspective, there is a need to view brands from a global perspective
especially since successful maintenance of global image and recognition translates
into hard currency in international business as is the case with the likes of
McDonald‘s and Coca Cola. Marketing decision includes aspects such as awareness,
loyalty, quality and propriety brand assets with an aim of improving efficiency of the

72 | P a g e
marketing process. Financial decision on the other hand involves financial market
value based techniques (Motameni and Shahrokhi, 1998).
Best (2005), defines brand equity the way the term equity in business is normally
defined as depicted in figure 2.2 below. According to Best (2005) in a business, the
owners equity is the value of the owner‘s holdings in the company and is determined
by the difference between what a company owns in assets and what a company owes
in liabilities, therefore the larger the ratio of assets to liabilities the greater the owner‘s
equity. Brand equity can also be assessed the same way and to calculate brand equity
one must simply subtract the total brand liability score from the total brand asset score
(Best, 2005).
Brand equity can also be used to distinctly separate selling from marketing as in
essence selling seeks an immediate order for a product and aims to increase the
revenue line of a profit and loss account immediately whilst marketing invests
resources before it expects to reap the rewards (Ambler, 2003). Brand equity has
become the most valuable asset for many companies. Kohli and Thakor (1997), make
a very good point by highlighting that consumers do not buy jeans but buy Levi‘s and
no one buys corn flakes but Kellogg‘s and furthermore, the strength of the brand
names have resulted in acquisitions amounting to billions for the following
companies:
Nestle acquired Perrier for $2.5 billion.
Phillip Morris acquired Kraft for $13 billion.
Nabisco was sold for over $25 billon.
According to Ambler (2003) there is also a distinct difference between the asset
(brand equity) and what the asset is worth (brand valuation). Brand equity also plays
an important role in increasing the value of the business and companies pay good
money for these assets (Ambler, 2003; Motameni and Shahrokhi, 1998). Aaker (1996)
highlights that there are four major assets through which brand equity generates value
and these are: brand name and awareness, brand loyalty, perceived quality and brand
associations
73 | P a g e
Because of the value that brand equity adds for shareholders, it is still surprising that
there are still debates as to whether brand equity building activities are important or
not and as a result companies that are focused on short term gains do not perceive
brands as important assets. By viewing brands as assets, companies are better able to
put their brand building expenditure in context with the value that those brands
deliver (Davis, 2002).
According to Yoo et al (2000), there are several dimensions of brand equity and any
marketing action has the potential to affect brand equity because it represents the
effect of accumulated marketing investments into the brand. Furthermore, brand name
recognition with strong associations, perceived quality of product, and brand loyalty
can be developed through careful long-term investments. In a study to examine
selected marketing mix and brand equity, Yoo et al (2000), recognized that there are
two types of marketing management efforts from a long term perspective of brand
management namely: brand building activity and brand-harming activity. It was
observed that frequent use of price promotions is a typical example of brand-harming
activity whilst high advertising spending, high price and distribution through retailers
with store images and high distribution intensity are good examples of brand-building
activity. The results of regular price cutting can negatively affect brand equity as a
perception is created that product quality has been compromised. In their
recommendations, Yoo et al (2000), suggests that managers should avoid frequent
price cuts or a consistent low price strategy because they lower perceived quality and
product image.
From the above discussion, it is evident that brand equity is a major marketing asset
of many firms and that it can be used to drive long-term growth and deliver value for
shareholders. Although brand equity plays a significant role in increasing shareholder
value, it is important that measures are put in place to track it. It is a well known fact
that what is not measured is not managed and therefore tracking and measuring brand
equity assist in creating brands that consistently deliver on their promise. As brand
equity is an intangible asset, most people struggle to quantify it however various tools
are available that have been used effectively by many organizations to measure brand
equity.
74 | P a g e
An attempt to define the relationship between customers and brands produced the
term ``brand equity'' in the marketing literature. The concept of brand equity has been
debated both in the accounting and marketing literatures, and has highlighted the
importance of having a long-term focus within brand management. Although there
have been significant moves by companies to be strategic in the way that brands are
managed, a lack of common terminology and philosophy within and between
disciplines persists and may hinder communication.
Brand equity, like the concepts of brand and added value has proliferated into
multiple meanings. Accountants tend to define brand equity differently from
marketers, with the concept being defined both in terms of the relationship between
customer and brand (consumer-oriented definitions), or as something that accrues to
the brand owner (company-oriented definitions). It has been simplified that the variety
of approaches, by providing a classification of the different meanings of brand equity
as:
The total value of a brand as a separable asset when it is sold, or included on a
balance sheet;
A measure of the strength of consumers' attachment to a brand;
A description of the associations and beliefs the consumer has about the brand.
The first of these is often called brand valuation or brand value, and is the meaning
generally adopted by financial accountants. The concept of measuring the consumers'
level of attachment to a brand can be called brand strength (synonymous with brand
loyalty). The third could be called brand image, though used the term brand
description. When marketers use the term ``brand equity'' they tend to mean brand
description or brand strength. Brand strength and brand description are sometimes
referred to as ``consumer brand equity'' to distinguish them from the asset valuation
meaning.
Brand description is distinct because it would not be expected to be quantified,
whereas brand strength and brand value are considered quantifiable. Brand value may

75 | P a g e
be thought to be distinct as it refers to an actual or notional business transaction, while
the other two focus on the consumer. There is an assumed relationship between the
interpretations of brand equity. This relationship implies the causal chain shown in
Figure 1.
Figure 1
The brand equity chain
Very simply, brand description (or identity or image) is tailored to the needs and
wants of a target market using the marketing mix of product, price, place, and
promotion. The success or otherwise of this process determines brand strength or the
degree of brand loyalty. A brand's value is determined by the degree of brand loyalty,
as this implies a guarantee of future cash flows.
It has been considered that using the term brand equity creates the illusion that an
operational relationship exists between brand description, brand strength and brand
value that cannot be demonstrated to operate in practice. This is not surprising, given
that brand description and brand strength are, broadly speaking, within the remit of
marketers and brand value has been considered largely an accounting issue. However,
for brands to be managed strategically as long-term assets, the relationship outlined in
Figure 1 needs to be operational within the management accounting system. The
efforts of managers of brands could be reviewed and assessed by the measurement of
brand strength and brand value, and brand strategy modified accordingly, Whilst not a
simple process, the measurement of outcomes is useful as part of a range of diagnostic
tools for management.
Whilst there remains a diversity of opinion on the definition and basis of brand equity,
most approaches consider brand equity to be a strategic issue, albeit often implicitly.
76 | P a g e
It has been suggested that managers of brands choose between taking profits today or
storing them for the future, with brand equity being the ``. . . store of profits to be
realised at a later date.
This definition of brand equity distinguishes the brand asset from its valuation. This
approach is intrinsically strategic in nature, with the emphasis away from short-term
profits. Davis (1995) also emphasizes the strategic importance of brand equity when
he defines brand value (one form of brand equity) as `` the potential strategic
contributions and benefits that a brand can make to a company.'' In this definition,
brand value is the resultant form of brand equity in Figure 1, or the outcome of
consumer-based brand equity.
Keller (1993) also takes the consumer-based brand strength approach to brand equity,
suggesting that brand equity represents a condition in which the consumer is familiar
with the brand and recalls some favourable, strong and unique brand associations.
Hence, there is a differential effect of brand knowledge on consumer response to the
marketing of a brand. This approach is aligned to the relationship described in Figure
1, where brand strength is a function of brand description.
It has been related that brand equity to added value by suggesting that brand equity
involves the value added to a product by consumers' associations and perceptions of a
particular brand name. It is unclear in what way added value is being used, but brand
equity fits the categories of brand description and brand strength as outlined above.
Leuthesser (1988) offers a broad definition of brand equity as: the set of associations
and behaviour on the part of a brand's customers, channel members and Parent
Corporation that permits the brand to earn greater volume or greater margins than it
could without the brand name.
Marketers tend to describe, rather than ascribe a figure to, the outcomes of brand
strength. It has been suggested that brand equity increases the probability of brand
choice, leads to brand loyalty and ``insulates the brand from a measure of competitive
threats.'' Aaker (1991) suggests that strong brands will usually provide higher profit
77 | P a g e
margins and better access to distribution channels, as well as providing a broad
platform for product line extensions.
Brand extension is a commonly cited advantage of high brand equity, Keller and
Aaker (1992) suggesting that successful brand extensions can also build brand equity.
Loken and John (1993) and Aaker (1993) advise caution in that poor brand extensions
can erode brand equity.
Farquhar (1989) suggests a relationship between high brand equity and market power
asserting that: The competitive advantage of firms that have brands with high equity
includes the opportunity for successful extensions, resilience against competitors'
promotional pressures, and creation of barriers to competitive entry.
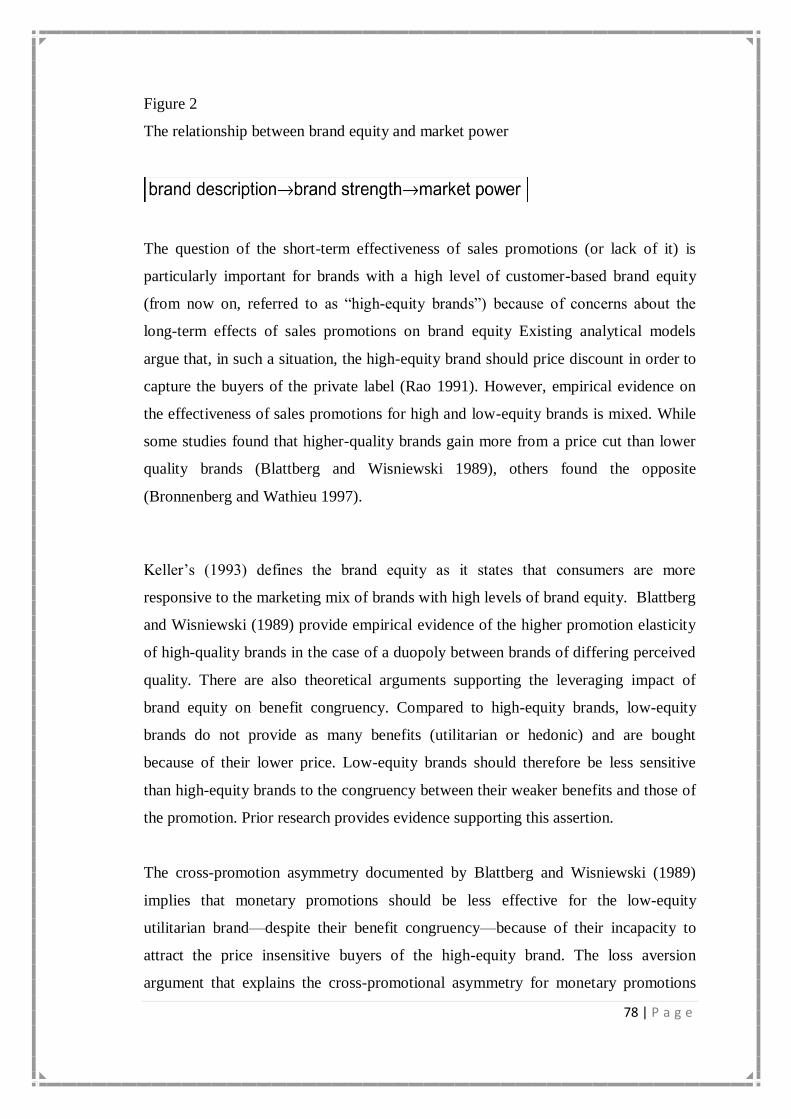
This relationship is summarized in Figure 2. Figure 2 indicates that there can be more
than one outcome determined by brand strength apart from brand value. It should be
noted that it is argued by Wood (1999) that brand value measurements could be used
as an indicator of market power.
Achieving a high degree of brand strength may be considered an important objective
for managers of brands. If we accept that the relationships highlighted in Figures 1
and 2 are something that we should be aiming for, then it is logical to focus our
attention on optimizing brand description. This requires a rich understanding of the
brand construct itself. Yet, despite an abundance of literature, the definitive brand
construct has yet to be produced. Subsequent discussion explores the brand construct
itself, and highlights the specific relationship between brands and added value. This
relationship is considered to be key to the variety of approaches to brand definition
within marketing, and is currently an area of incompatibility between marketing and
accounting.
78 | P a g e
Figure 2
The relationship between brand equity and market power
The question of the short-term effectiveness of sales promotions (or lack of it) is
particularly important for brands with a high level of customer-based brand equity
(from now on, referred to as ―high-equity brands‖) because of concerns about the
long-term effects of sales promotions on brand equity Existing analytical models
argue that, in such a situation, the high-equity brand should price discount in order to
capture the buyers of the private label (Rao 1991). However, empirical evidence on
the effectiveness of sales promotions for high and low-equity brands is mixed. While
some studies found that higher-quality brands gain more from a price cut than lower
quality brands (Blattberg and Wisniewski 1989), others found the opposite
(Bronnenberg and Wathieu 1997).
Keller‘s (1993) defines the brand equity as it states that consumers are more
responsive to the marketing mix of brands with high levels of brand equity. Blattberg
and Wisniewski (1989) provide empirical evidence of the higher promotion elasticity
of high-quality brands in the case of a duopoly between brands of differing perceived
quality. There are also theoretical arguments supporting the leveraging impact of
brand equity on benefit congruency. Compared to high-equity brands, low-equity
brands do not provide as many benefits (utilitarian or hedonic) and are bought
because of their lower price. Low-equity brands should therefore be less sensitive
than high-equity brands to the congruency between their weaker benefits and those of
the promotion. Prior research provides evidence supporting this assertion.
The cross-promotion asymmetry documented by Blattberg and Wisniewski (1989)
implies that monetary promotions should be less effective for the low-equity
utilitarian brand—despite their benefit congruency—because of their incapacity to
attract the price insensitive buyers of the high-equity brand. The loss aversion
argument that explains the cross-promotional asymmetry for monetary promotions
79 | P a g e
applies to non-monetary promotions as well. Non-monetary promotions should be less
effective for the low-equity hedonic brand than for its high-equity counterpart because
the buyers of high-equity brands are more reluctant to trade down in hedonic product
benefits (a loss) than buyers of low-equity brands are to trade up (a gain).
Perhaps because coupons and temporary price reductions are the most common form
of sales promotions, most research has assumed that monetary savings is the only
consumer benefit of sales promotions. Consequently, while many studies have
examined the costs of promotion usage, comparatively few have examined their
benefits to the consumer. It has been concluded that:
1. Sales promotions can provide consumers with an array of hedonic and
utilitarian benefits beyond monetary savings. Hedonic benefits include value-
expression, entertainment, and exploration. Along with simple monetary
savings, utilitarian benefits also include product quality and shopping
convenience.
2. Non-monetary promotions provide more hedonic benefits and fewer utilitarian
benefits than monetary promotions. All benefits, except quality, contribute to
the overall evaluation of monetary and nonmonetary promotions. However,
each type of promotion is primarily evaluated based on the dominant benefits
it provides.
3. For high-equity brands, sales promotions are more effective when they
provide benefits that are congruent with those provided by the product being
promoted. Specifically, monetary promotions are more effective for utilitarian
products than for hedonic products. Conversely, non-monetary promotions are
relatively more effective for hedonic products than for utilitarian products.
In this research Definition of brand equity given by Aakar has been taken as a
working definition of Brand Equity, as it is a consumer oriented definition of Brand
Equity.

80 | P a g e
2.7 Aaker‟s Brand Equity Frame work:
Brand
Loyalty
Reduced marketing costs, Trade
Leverage
Attracting new customer
Create awareness
Reassurance
Time to respond to competitive threats
B
R
A
N
D
E
Q
U
I
T
Y
Brand
Awareness
Anchor to which other Association can
be attached
Familiarity – Liking
Signal of substance/commitment
Brand to be considered
Perceived
Quality
Reason to buy,
Differentiate/Position, Price,
Channel Member interests,
Extensions
Brand
Associations
Help process/Retrieve
information,
Differentiate/Position, Reason to
buy, Create positive
attitude/feelings, Extensions
Other
Proprietary
Brand Assets
Competitive Advantage
Provide value
to customer by
enhancing
customers
Interpretation/P
rocessing of
information
Confidence in
the purchase
decision
Use satisfaction
Provide value
to firm by
enhancing
Efficien
cy &
Effectiv
eness of
marketi
ng
progra
m
Brand
Loyalty
Prices/
Margins
Brand
Extensi
ons
Brand
Leverag
e
Compet
itive
Advant
age

81 | P a g e
Above Mentioned sources have been considered to measure Brand Equity perception
namely, Brand Loyalty, Brand Awareness, Perceived Quality and Brand Associations
considering the sales promotion schemes.

82 | P a g e
2.8 References:
Aaker, D. (1991), Managing Brand Equity: Capitalizing on the value of a
Brand Name, The Free Press, New York, NY.
Aaker, D. (1996). Building Strong Brands, Free Press, New York, NY.
Ambler, T. (2003), Marketing and the bottom line, 2nd edition. London,
Prentice Hall.
Ambler, T. (1995), ‗Building Brand Relationship‘, December 1, Financial
Times.
Barron, J. (2003), ‗How strong brands get on intent and stay there‘ Journal of
Business Strategy, 3: 36-41.
Barwise, P. and Farley, J.U. (2004), ‗Marketing Metrics: Status of Six Metrics
in Five Countries‘, European Management Journal, 22 (3): 257-262
Batey, M. (2008), Brand Meaning, Taylor & Francis Group, New York
Berry, J. (1993), ‗Brand Equity‘, Brandweek, 34: 20-24.
Best, R.J. (2005), Market-based management: strategies for growing customer
value and profitability. 4th edition. Pearson: Prentice Hall.
Beverland, M. (2005), ‗Brand Management and the challenge of authenticity‘,
Journal of Product and Brand Management, 14 (7): 460-461
Blattberg and Kenneth J. Wisniewski (1989), ―Price-Induced Patterns of
Competition,‖ Marketing Science, 8 (4), 81-100.

83 | P a g e
Bronnenberg, Bart J. and Luc Wathieu (1997), ―Asymmetric Promotion
Effects and Brand Positioning,‖ Marketing Science, Vol. 15 (4), 379-94.
Chandon, Pierre and Brian Wansink (1999), ―When and Why Does Consumer
Stockpiling Accelerate Consumption?‖ working paper No. 99-201, London
Business School.
De Chernatony, L. (1996), ‗Integrated brand building using brand
taxanomies‘, Marketing Intelligence and Planning, 14 (7): 40-45
Davis, S. (2002), Brand Asset Management: how businesses can profit from
the power of brand, Journal of Consumer Marketing, 19 (4): 351- 358.
Dibb, S., Simkin, L., Pride, W.M. & Ferrell, O.C. (1997), Marketing:
Concepts and Strategies, 3rd European ed., Houghton Mifflin,
Dunn, M. and Davis, S. (2004), Handbook of Business Strategy, MCB UP
Limited.
Dubin, J. A. (1998), ‗The Demand for Branded and Unbranded Products: An
Econometric Method for Valuing Intangible Assets‘, Studies in Consumer
Demand: Econometric Methods Applied to Market Data. Norwell, MA:
Kluwer Academic Publishers, 77-127.
Farquhar, P. (1989), ‗Managing Brand Equity,‘ Marketing Research, 1 (9): 24-
33.
Hambleton, R. (1987), The branding of America, Yankee Books, New York.
Henkel, S., Tomczak, T, Heitmann, M. & Herrmann, A. (2007), Managing
brand consistent employee behaviors: relevance and managerial control of
behavioral branding. Journal of Product & Brand management, 16 (5): 310-
320

84 | P a g e
Hong-bumm, K. and Woo, G.K., Jeong, A.A. (2003), ‗The effect of consumer
based brand equity on firms‘ financial performance‘, Journal of Consumer
Marketing, 20 (4): 335-351
Jevons, C. (2005),. ‗Names, brands, branding: beyond the signs, symbols,
products and services‘, Journal of Product & Brand Management, 12 (2): 117-
118.
Kay, M.J. (2005), Strong brands and corporate brands, European Journal of
Marketing, 40 (7/8): 742-760
Keller, K. L. (1993), ‗Conceptualizing, Measuring, and Managing Customer
Based Brand Equity,‘ Journal of Marketing, 57 (1), 1-22.
Keller, Kevin Lane (1993), ―Conceptualizing, Measuring, and Managing
Customer-based Brand Equity,‖ Journal of Marketing, 57 (1), 1-22.
Kish, P., Riskey D.R. & Kerin, R.A. (2001), ‗Measurement and tracking
Brand equity in the market place: The PepsiCo experience‘, International
marketing Review, 18 (1):91-96
Kohli, C. and Thakor, M. (1997), Branding consumer goods: insights from
theory and practice, Journal of Consumer Marketing, 14 (3): 206- 219
Kunde, J. (2002), Unique Now or Never, Pearson Hall, Harlow
Leiser, M. (2004), Handbook of Business Strategy, MCB UP Limited
Leuthesser, L. (1988), ‗Defining, Measuring, and Managing Brand Equity,‘
Working Paper No. 88-104, Marketing Science Institute, Cambridge, MA.
LisaWood. (2000) Brands and brand equity: definition and management,
Management Decision, 38(9), 662-669.
85 | P a g e
Millward Brown, (2008), Recession marketing presentation [online].
Available from:<http://www.bizzcommunity.com
Motameni, R. and Shahroki, M. (1998), ‗Brand equity valuation: a global
perspective‘, Journal of Product & Brand Management, 7 (4): 275- 290
Nandan, S. 2005. An exploration of the brand identity-brand image linkage: A
communications perspective, Journal of Brand Management, 12 (4): 264-278
O‘Malley, D. (1991), ‗Brand means businesses, Accountancy, 107: 107-108
Oxford Dictionary. 2009. [Online]. Available from:
<http://www.askoxford.com/concise_oed/branding>, Oxford University Press.
Rajagopal. (2008), ‗Measuring brand performance through metrics
application‘, Measuring Business Excellence, 12 (1): 29-38
Rao, Ram C. (1991), ―Pricing and Promotions in Asymmetric Duopolies,‖
Marketing Science, 10 (2), 131-44.
Rooney, J.A. (1995), ‗Branding: a trend for today and tomorrow‘, Journal of
Product & Brand Management, 4 (4): 48-55
Rust, R.T., Ambler, T., Carpenter, G. S., Kumar V. & Srivastava, R. K.
(2004), ‗Measuring Marketing Productivity: Current Knowledge and Future
Directions‘, Journal of Marketing, 68 (10): 76-89
Wood, L. (2000), ‗Brands and brand equity: definition and management‘
Management Decision, 38 (9): 662-669
86 | P a g e
Yoo, B., Donthu, N. & Lee, S. (2000), ‗An examination of selected marketing
mix elements and brand equity‘, Academy of Marketing Science Journal, 28
(2): 195-211