
Chapter 2 Classifying Electoral Systems - Harvard … 2 Classifying ... Before we can examine the...
26
ELECTORAL ENGINEERING ~ CHAPTER 2 3/10/2003 6:30 PM 1 Chapter 2 Classifying Electoral Systems Before we can examine the impact of rules on voting behavior and political representation, we first need to outline a typology of the main families of electoral systems and classify their sub-types. The most important institutions influencing electoral rules can be divided into three nested components, ranging from the most diffuse to the most specific levels. • The constitutional structure represents the broadest institutional context, denoted most importantly by whether the executive is presidential or parliamentary, whether the national legislature is bicameral or unicameral, and whether power is centralized in unitary government or more widely dispersed through federal arrangements. • The ‘electoral system’ concerns multiple aspects of electoral law and the most basic features involve the ballot structure, determining how voters can express their choices, the electoral threshold, or the minimum votes needed by a party to secure representation, the electoral formula, determining how votes are counted to allocate seats, and the district magnitude, referring to the number of seats per district. Electoral systems are categorized in this study into three primary families, majoritarian, combined, and proportional, each with many subsidiary types. • Lastly electoral procedures concern more detailed rules, codes of conduct, and official guidelines, including practical and technical issues that can also prove important to the outcome, such as the distribution of polling places, rules governing the nomination procedure for candidates, the qualifications for citizenship, facilities for voter registration and for casting a ballot, the design of the ballot paper, procedures for scrutiny of the election results, the use of compulsory voting, the process of boundary revisions, and regulations governing campaign finance and election broadcasting. The constitutional structure is obviously important by setting the institutional context for many aspects of political behavior, but systematic comparison of all these features it also well beyond the scope of this limited study 1 . This chapter focuses instead upon classifying electoral systems used in all independent nation-states around the globe, to examine their distribution worldwide. Subsequent chapters consider specific electoral procedures and legal rules in more detail, such as the use of statutory gender quotas on women’s representation or the impact of voting facilities on turnout. The way that electoral rules work is illustrated by examples from the countries under comparison in the CSES study. Electoral systems can be compared at every level of office - Presidential, parliamentary, supranational and sub-national – but to compare like-with-like this chapter focuses on national elections, including systems used for parliamentary elections for the lower house and for Presidential contests. The Classification of Electoral Systems Ever since the seminal work of Maurice Duverger (1954) and Douglas Rae (1967), a flourishing literature has classified the main types of electoral systems and sought to analyze their consequences 2 . Any classification needs to strike a difficult balance between being detailed enough to reflect subtle and nuanced differences between systems, which can be almost infinitely varied, while also being sufficiently parsimonious and clear so as to distinguish the major types that are actually used around the globe. Worldwide, excluding dependent territories, we can compare the electoral system for the lower house of parliament in 191 independent nation states. Of these nations, seven authoritarian regimes currently lack a working, directly elected parliament, including Saudi Arabia, Brunei, and Libya. Electoral systems in the remaining countries are classified into three major families (see Figure 2.1), each including a number of sub-categories: majoritarian formula (including First-Past-the-Post, Second Ballot, the Block vote, Single Non-Transferable Vote, and Alternative Voting systems) 3 ; combined systems (incorporating both majoritarian and proportional formula); and proportional formula (including Party Lists as well as the Single Transferable Vote systems). [Figure 2.1 about here] The comparison in Figure 2.1 shows that in elections to the lower house, about half of all
-
Upload
hoangkhanh -
Category
Documents
-
view
218 -
download
3
Transcript of Chapter 2 Classifying Electoral Systems - Harvard … 2 Classifying ... Before we can examine the...

ELECTORAL ENGINEERING ~ CHAPTER 2 3/10/2003 6:30 PM
1
Chapter 2 Classifying Electoral Systems
Before we can examine the impact of rules on voting behavior and political representation, we first need to outline a typology of the main families of electoral systems and classify their sub-types. The most important institutions influencing electoral rules can be divided into three nested components, ranging from the most diffuse to the most specific levels.
• The constitutional structure represents the broadest institutional context, denoted most importantly by whether the executive is presidential or parliamentary, whether the national legislature is bicameral or unicameral, and whether power is centralized in unitary government or more widely dispersed through federal arrangements.
• The ‘electoral system’ concerns multiple aspects of electoral law and the most basic features involve the ballot structure, determining how voters can express their choices, the electoral threshold, or the minimum votes needed by a party to secure representation, the electoral formula, determining how votes are counted to allocate seats, and the district magnitude, referring to the number of seats per district. Electoral systems are categorized in this study into three primary families, majoritarian, combined, and proportional, each with many subsidiary types.
• Lastly electoral procedures concern more detailed rules, codes of conduct, and official guidelines, including practical and technical issues that can also prove important to the outcome, such as the distribution of polling places, rules governing the nomination procedure for candidates, the qualifications for citizenship, facilities for voter registration and for casting a ballot, the design of the ballot paper, procedures for scrutiny of the election results, the use of compulsory voting, the process of boundary revisions, and regulations governing campaign finance and election broadcasting.
The constitutional structure is obviously important by setting the institutional context for many aspects of political behavior, but systematic comparison of all these features it also well beyond the scope of this limited study1. This chapter focuses instead upon classifying electoral systems used in all independent nation-states around the globe, to examine their distribution worldwide. Subsequent chapters consider specific electoral procedures and legal rules in more detail, such as the use of statutory gender quotas on women’s representation or the impact of voting facilities on turnout. The way that electoral rules work is illustrated by examples from the countries under comparison in the CSES study. Electoral systems can be compared at every level of office - Presidential, parliamentary, supranational and sub-national – but to compare like-with-like this chapter focuses on national elections, including systems used for parliamentary elections for the lower house and for Presidential contests.
The Classification of Electoral Systems Ever since the seminal work of Maurice Duverger (1954) and Douglas Rae (1967), a flourishing
literature has classified the main types of electoral systems and sought to analyze their consequences2. Any classification needs to strike a difficult balance between being detailed enough to reflect subtle and nuanced differences between systems, which can be almost infinitely varied, while also being sufficiently parsimonious and clear so as to distinguish the major types that are actually used around the globe. Worldwide, excluding dependent territories, we can compare the electoral system for the lower house of parliament in 191 independent nation states. Of these nations, seven authoritarian regimes currently lack a working, directly elected parliament, including Saudi Arabia, Brunei, and Libya. Electoral systems in the remaining countries are classified into three major families (see Figure 2.1), each including a number of sub-categories: majoritarian formula (including First-Past-the-Post, Second Ballot, the Block vote, Single Non-Transferable Vote, and Alternative Voting systems)3; combined systems (incorporating both majoritarian and proportional formula); and proportional formula (including Party Lists as well as the Single Transferable Vote systems).
[Figure 2.1 about here]
The comparison in Figure 2.1 shows that in elections to the lower house, about half of all

ELECTORAL ENGINEERING ~ CHAPTER 2 3/10/2003 6:30 PM
2
countries worldwide use majoritarian formula, while one-third use proportional formula, and the remainder employ combined systems. As discussed earlier, electoral systems vary according to a number of key dimensions; the most important concern the electoral formula, ballot structures, effective thresholds, district magnitude, malapportionment, assembly size, and the use of open/closed lists. Within the family of proportional systems, for example, in Israel the combination of a single national constituency and a low minimum vote threshold allows the election of far more parties than in Poland, which has a 7% threshold and small electoral districts. Moreover electoral laws and administrative procedures, broadly defined, regulate campaigns in numerous ways beyond the basic electoral formulae, from the administration of voting facilities to the provision of political broadcasts, the rules of campaign funding, the drawing of constituency boundaries, the citizenship qualifications for the franchise, and the legal requirements for candidate nomination.
Majoritarian formula Worldwide in total 91 out of 191 countries use majoritarian formula in national election to the
lower house of parliament. The aim of majoritarian electoral systems is to create a ‘natural’ or a 'manufactured’ majority, that is, to produce an effective one-party government with a working parliamentary majority while simultaneously penalising minor parties, especially those with spatially dispersed support. In 'winner take all' elections, the leading party boosts its legislative base, while the trailing parties get meager rewards. The design aims to concentrate legislative power in the hands of a single-party government, not to generate parliamentary representation of all minority views. This category of electoral systems can be subdivided into those where the winner needs to achieve a simple plurality of votes, or those where they need to gain an absolute majority of votes (50+ percent).
Plurality Elections The system of 'first-past-the-post’ (FPTP) or single-member plurality elections is used for election
to the lower chamber in 54 countries worldwide, including the United Kingdom, Canada, India, the United States, and many Commonwealth states. This is the oldest electoral system, dating back at least to the 12th Century, and also the simplest. Plurality electoral systems can also use multimember constituencies, for example some dual-member seats persisted in Britain until 1948. As discussed later, the Bloc Vote continues to be employed in nine nations such as Bermuda and Laos, using multi-member districts with plurality thresholds. But today first-past-the-post elections for the lower house at Westminster are all based on single-member districts with candidate-ballots. The basic system of how FPTP works in parliamentary general elections is widely familiar: countries are divided into territorial single-member constituencies; voters within each constituency cast a single ballot (marked by a ‘X’) for one candidate (see Figure 2.2); the candidate with the largest share of the vote in each seat is elected; and in turn the party with the largest number of parliamentary seats forms the government. Under first-past-the-post candidates usually do not need to pass a minimum threshold of votes to be elected4, nor do they require an absolute majority of votes to be elected, instead all they need is a simple plurality i.e. one more vote than their closest rivals. Hence in seats where the vote splits almost equally three ways, the winning candidate may have only 35% of the vote, while the other contestants fail with 34% and 32% respectively. Although two-thirds of all voters supported other candidates, the plurality of votes is decisive.
[Figure 2.2 about here]
Under this system, the party share of parliamentary seats, not their share of the popular vote, counts for the formation of government. Government may also be elected without a plurality of votes, so long as they have a parliamentary majority. In 1951, for instance, the British Conservative party was returned to power with a sixteen-seat majority in parliament based on 48.0 percent of the popular vote, although Labour won slightly more (48.8 percent) of the vote. In February 1974 the reverse pattern occurred: the Conservatives gained a slightly higher share of the national vote but Labour won more seats and formed the government. Another example is the 2000 US presidential contest, where across the whole country, out of over 100 million votes cast, the result gave Gore a lead of 357,852 in the popular vote, or 0.4%, but Bush beat Gore by 271 to 267 votes in the Electoral College. Moreover under first-past-the-post, governments are commonly returned without a majority of votes. No governing party in the UK has won as much as half the popular vote since 1935. For instance in 1983 Mrs. Thatcher was returned with a landslide of seats, producing a substantial parliamentary majority of 144, yet with the support of less than a third of the total electorate (30.8 percent).

ELECTORAL ENGINEERING ~ CHAPTER 2 3/10/2003 6:30 PM
3
One of the best-known features of winner-takes-all elections is that they create high thresholds for minor parties with support that is spatially dispersed across many constituencies. In single-member seats, if the candidates standing for the minor parties frequently come 2nd, 3rd or 4th, then even although these parties may obtain substantial support across the whole country, nevertheless they will fail to win a share of seats that is in any way reflects their share of the national vote. This characteristic is the basis of Maurice Duverger’s well-known assertion that “simple-majority single ballot system favors the two party system” whereas “both the simple-majority system with second ballot and proportional representation favor multi-partyism”5. As discussed fully in the next chapter, the accuracy of these claims has attracted much debate in the literature6. One important qualification to these generalizations is the recognition that first-past-the-post is based on territorial constituencies and the geographical distribution of votes is critical to the outcome for minor parties, and for minority social groups7. Green parties, for example, which usually have shallow support spread evenly across multiple constituencies, do far less well under FPTP than nationalist parties with support concentrated in a few areas. Hence, for example, in the 1993 Canadian elections the Progressive Conservatives won 16.1 percent of the vote but suffered a chronic meltdown reducing their parliamentary representation to only two MPs. In contrast the Bloc Quebecois, concentrated in one region, won 18.1 percent of the vote, but returned a solid phalanx of 54 MPs. In the same election, the New Democratic Party won even fewer votes (6.6 percent), but they emerged with 9 MPs, far more than the Progressive Conservatives8. In a similar way, in America ethnic groups with concentrated support, such as African-American or Latino voters in inner-city urban areas, can get more representatives into the US Congress than groups like Korean-Americans which are widely dispersed across multiple legislative districts9.
Malapportionment (producing constituencies containing different sized electorates) and gerrymandering (the intentional drawing of electoral boundaries for partisan advantage) can both exacerbate partisan biases in constituency boundaries, but electoral geography is also a large part of the cause. Single-member constituencies usually contain roughly equal numbers of the electorate; for example the United States is divided into 435 Congressional districts each including roughly equal populations, with one House representative per district. Boundaries are reviewed at periodic intervals, based on the census, to equalize the electorate. Yet the number of electors per constituency can vary substantially within nations, where boundary commissions take account of ‘natural’ communities, where census information is incomplete or flawed, or where periodic boundary reviews fail to keep up with periods of rapid migration. There are also substantial differences cross-nationally: India, for example, has 545 representatives for a population of 898 million, so that each Member of Parliament serves about 1.6 million people. By contrast, Ireland has 166 members in the Dial for a population of 3.5 million, or one seat per 21,000 people. The geographic size of constituencies also varies a great deal within countries, from small, densely packed inner-city seats to sprawling and more remote rural areas.
The way that FPTP systems work in practice can be illustrated most clearly with illustrations from the elections compared in the CSES surveys, including the 1997 British general election, the 1997 Canadian election, and the 1996 United States presidential and Congressional elections10. Although all Anglo-American democracies, important differences in how these systems operate include variations in the number of parties contesting elections, the size of the legislatures, the number of electors per district, the dominant types of social cleavages in the electorate, the geographic distribution of voters, the regulations governing campaign finance and party election broadcasts, and the maximum number of years between elections.
The system of first-past-the-post used for Westminster elections to the British House of Commons generally produces a manufactured ‘winner’s bonus’, exaggerating the proportion of seats won by the party in first place compared with their proportion of votes. For proponents of plurality elections, this bias is a virtue since it can guarantee a decisive outcome at Westminster, and a workable parliamentary majority, even in a close contest in the electorate11. One simple and intuitive way to capture the size of the ‘winner’s bonus’ produced by any electoral system is to divide the proportion of votes into the proportion of seats. A ratio of 1:1 would suggest no bias at all. But in contrast the size in the bias in the ‘winner’s bonus’ at Westminster has fluctuated over time but also gradually risen since the 1950s until in the 1997 election, the winner’s bonus was the second highest ever recorded in the postwar era (only surpassed by the 2001 election). This phenomenon is the product of three factors: the geographical spread of party support in Britain, the effects of anti-Conservative tactical voting, and disparities in the

ELECTORAL ENGINEERING ~ CHAPTER 2 3/10/2003 6:30 PM
4
size of constituency electorates12. The 1997 British general election witnessed one of the most dramatic results in British postwar history, where eighteen years of Conservative government under Margaret Thatcher and then John Major were replaced by the Labour landslide of seats under the prime ministerial leadership of Tony Blair. The UK is divided into 659 single-member parliamentary constituencies where voters cast a single ballot and MPs are elected on a simple plurality of votes. At Westminster, the party share of parliamentary seats, not their share of the popular vote, counts for the formation of the government. Under first-past-the-post British governments are commonly elected with less than a majority of votes; in 1997 Tony Blair was returned with almost two-thirds of the House of Commons, and a massive parliamentary majority of 179 out of 659 seats, based on 43.3% of the UK vote. As the party in first place Labour enjoyed a seats: votes ratio of 1.47 whereas in contrast, with 30.7% of the vote, the Conservatives gained only 25% of all seats, producing a seats: votes ratio of 0.81.
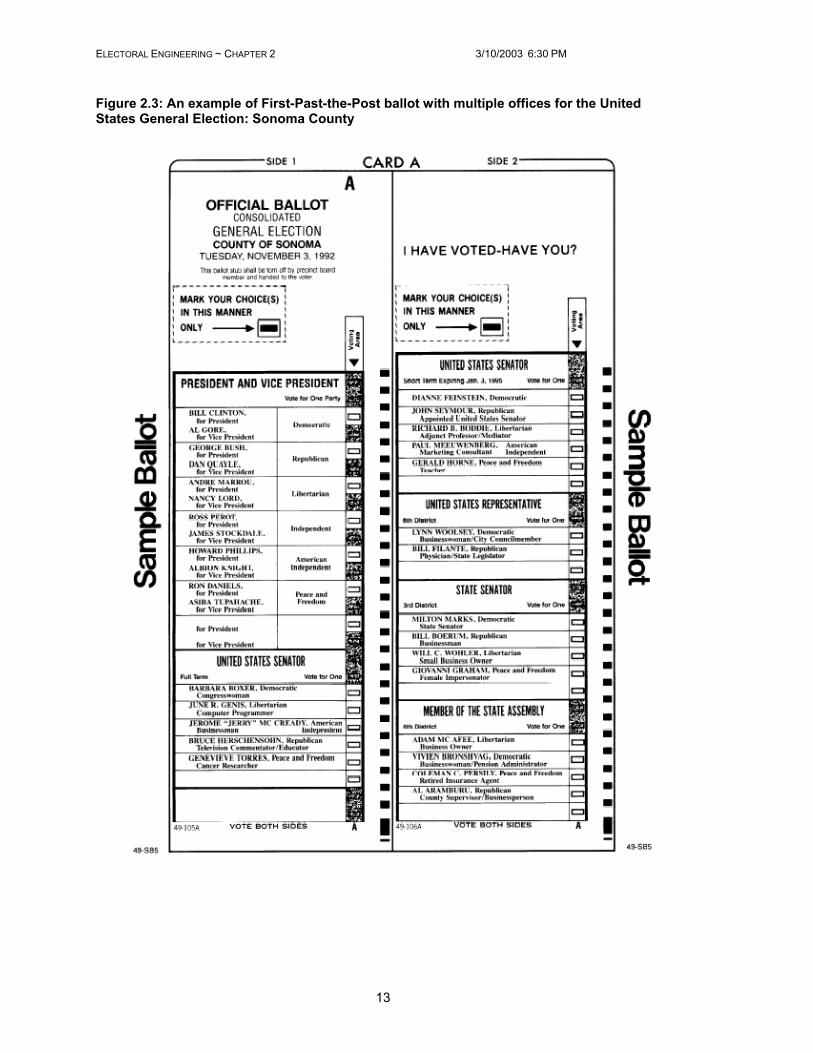
The US system is also based on first-past-the-post in single-member districts for multiple offices including Congressional races for the House and Senate, and the system of the Electoral College used for presidential contest. The ballot paper presents the voter with more complex choices than in Britain due to multi-level elections, as shown by Figure 2.3, as well as by the use of referendum and initiatives in many states, and the sheer frequency of primary, congressional and presidential elections. The winner’s bonus under majoritarian systems is also exemplified by the outcome of the 1996 American presidential elections pitting the incumbent, President Bill Clinton, against the Republican nominee, Senator Bob Dole; in this contest President Clinton was returned with 70.4% of the Electoral College vote, mainly by winning the largest states, but this substantial lead was based on only 50.1% of the popular vote across the whole country. In 1996 the Congressional results for the 435 seat House of Representatives was highly proportional, however, because FPTP leads to proportional results in two-party systems when the vote totals of the two parties are fairly close. Roughly in accordance with the ‘cube’ law, disproportionality increases as the vote totals diverge.
[Figure 2.3 about here]
The 1997 Canadian federal election saw at least a partial consolidation of the multiparty system that had developed so dramatically with the emergence of two new parties, the Bloc Québécois and Reform, during the 1993 contest. The result of the 1997 Canadian election saw the return of the Liberals under the leadership of Jean Chrétien, although with a sharply reduced majority of only four seats, and with 38% of the popular vote13. The Bloc Québécois lost its status as the official opposition, dropping from 54 to 44 seats after a sharp decline in support. By contrast, the Reform party moved into second place in the House of Commons, with 60 seats, although with its strongest base in the West. Both the Progressive Conservatives and the New Democratic Party improved their positions after their disastrous results in 1993. The level of proportionality in the Canadian system was similar to that found in the British general election, with the Liberal party and the Bloc Québécois enjoying the highest votes-to-seats bonus, and both countries had far lower in proportionality than the United States. The existence of a multiparty system within plurality elections could be expected to lead for stronger calls for electoral reform by moving towards a proportional or combined formula, but the regional basis of party competition allows minor parties to be elected to parliament despite the hurdles created by the Canadian electoral system14.
STNV, the Cumulative Vote, the Limited Vote, and the Bloc Vote Many other variants on majoritarian formula are available. From 1948 to 1993, Japanese voters
used the Single Non-Transferable Vote for the lower house of the Diet, where each citizen casts a single vote in small multi-member district. Multiple candidates from the same party compete with each other for support within each district. Those candidates with the highest vote totals (a simple plurality) are elected. Under these rules, parties need to consider how many candidates to nominate strategically in each district, and how to make sure that their supporters spread their votes across all their candidates. The system has been classified as ‘semi-proportional’ (Reynolds and Reilly), or even ‘proportional’ (Sartori) but it seems preferable to regard this as a variation of the majoritarian family, since candidates need a simple plurality of votes in their district to be elected and there is no quota or requirement for proportionality across districts. The system continues to be employed for parliamentary elections in Jordan and Vanuatu, as well as for two-thirds of the legislators in the Taiwanese elections under comparison (see Combined Systems below)15. Other alternatives that fall within the majoritarian category, although not employed at national level for the lower house, include the Cumulative Vote where

ELECTORAL ENGINEERING ~ CHAPTER 2 3/10/2003 6:30 PM
5
citizens are given as many votes as representatives, and where votes can be cumulated on a single candidate (used in dual-member seats in 19th Century Britain where voters could ‘plump’ both votes for one candidate and in the State of Illinois until 1980). The Limited Vote system is similar, but citizens are given fewer votes than the number of members to be elected (used in elections to the Spanish Senate). The Bloc Vote system is similar to first-past-the-post but with multi-member districts. Each elector is given as many votes as there are seats to be filled and they are usually free to vote for individual candidates regardless of party. The candidates winning a simple plurality of votes in each constituency win office. This system has been used for national parliamentary elections in nine countries including in Laos, Thailand and Mauritius. Such contests allow citizens to prioritize particular candidates within parties, as well as maintaining the link between representatives and local communities. On the other hand where electors cast all their votes for a single party, rather than distinguishing among candidates for different parties, this can exaggerate the disproportionality of the results and give an overwhelming parliamentary majority to the leading party.
Second Ballot Elections Other systems use alternative mechanisms to ensure that the winning candidate gets an overall
majority of votes. Second Ballot systems (also known as ‘runoff’ elections) are used in two-dozen nations worldwide for election to the lower house. In these, any candidate obtaining an absolute majority of votes (50 percent or more) in the first round is declared elected. If no candidate reaches a majority in this stage of the process, a second round of elections is held between the two candidates with the highest share of the vote. The traditional way that this process is understood is that the first vote is regarded as largely expressive or sincere (voting ‘with the heart’), whereas the second is regarded as the more decisive ballot between the major contenders, where strategic considerations and alliances among left and right party blocs come into stronger play (voting ‘with the head’). In the countries under comparison, the second ballot system was employed for two-thirds of the seats in the Lithuanian combined system, as well as in seven of the presidential elections. Runoff elections are also most common in presidential elections but they are also used for elections to the lower house in France, in eleven ex-French colonies (including Chad, Haiti, Mali, and Gabon), in seven authoritarian ex-Soviet Eastern European states (such as Belarus, Kyrgystan, Moldova, Uzbekistan, Kazakhstan) and in some unreconstructed Communist states (Cuba and North Korea), as well as in Louisiana. This system can be seen as encouraging centrist party competition, as well as bolstering the legitimacy of the eventual winner, by ensuring that they receive the support of at least half the public. On the other hand the rules harshly penalize minor parties and the need for citizens to go to the polls on at least two occasions in rapid succession can induce voter fatigue, thereby depressing turnout. This phenomenon was exemplified by the May-June 2002 French elections where voters were called to the polls four times following non-concurrent Presidential and parliamentary elections.
Alternative Vote The Alternative Vote, used in elections to the Australian House of Representatives and in Ireland
for Presidential elections and by-elections, is also majoritarian. This system, or ‘preferential voting’ as it is commonly known in Australia, was introduced for Australian federal elections in 1919 and in now employed in all states except Tasmania, which uses STV16. Australia is divided into 148 single-member constituencies. Instead of a simple 'X' on the ballot paper, voters rank their preferences among candidate (1,2,3...) (see Figure 2.4). To win, candidates need an absolute majority of votes. Where no one candidate wins over 50 per cent after first preferences are counted, then the candidate with the least votes is eliminated, and their votes are redistributed amongst the other candidates. The process continues until an absolute majority is secured. In the 1996 Australian federal elections under comparison, for example, the victory of the conservative Liberal-National coalition ended the longest period of Labor party government in Australia’s history. The contest saw an extremely close call on the first preferences, with both the Australian Labour Party and the Liberal party getting an identical share of the vote (38.7 percent). In the final preferences, however, the ALP won 46.4 percent compared with 53.6 percent for non-ALP candidates. As a result the Liberal-National government won 93 seats, and a substantial majority, while Labor won only 4917. This process worked as intended by translating an extremely close result in the first preference vote into a decisive majority of parliamentary seats for the leading party elected to government. This process systematically discriminates against those parties and candidates at the bottom of the poll to promote single-party government for the winner. The Alternative

ELECTORAL ENGINEERING ~ CHAPTER 2 3/10/2003 6:30 PM
6
Vote functions in many ways similarly to the Second Ballot system, with the important distinction that there is no opportunity for citizens to revote, nor for parties to create new alliances, in the light of the outcome of the first preference ballots. The balloting and counting process is also more efficient, avoiding repeated trips to the polling station and possible falls in turnout due to voter fatigue.
[Figure 2.4 about here]
Proportional Representation Formula Adversarial democracies and majoritarian electoral systems emphasize popular control by the
party in government. By contrast, consensus democracies and proportional representation electoral systems focus on the inclusion of all voices, emphasizing the need for and bargaining and compromise within parliament, government, and the policymaking process. The basic principle of proportional representation (PR) is that parliamentary seats are allocated according to the proportion of votes cast for each party. The main variations concern the use of open or closed lists of candidates, the formula for translating votes into seats, the level of the electoral threshold, and the size of the district magnitude. The Party List system exemplifies proportional formula but the Single Transferable Vote system (STV) should also be included in this category, since this system allocates seats based on quotas.
Party Lists Systems
Proportional electoral systems based on party lists in multimember constituencies are widespread throughout Western Europe. Worldwide 62 out of 191 countries use Party List PR (see Figure 2.1). Party lists may be open as in Norway, Finland, the Netherlands and Italy, in which case voters can express preferences for particular candidates within the list. Or they may be closed, as in Israel, Portugal, Spain and Germany, in which case voters can only select which party to support, and each party decides the ranking of their candidates on the list. The rank order of candidates on the party list determines who is elected to parliament. In Israel all the country is one constituency divided into 120 seats, but often lists are regional, as in the Czech Republic where 200 total members are elected from eight regional lists. Proportional Party List electoral systems are used in 15 of the countries under comparison in the CSES dataset18. A typical ballot paper from South Africa is illustrated in Figure 2.5.
[Figure 2.5 about here]
The electoral formula for the lower house legislative elections varies among proportional systems (see Table 2.1). Votes can be allocated to seats based on the highest averages method. This requires the number of votes for each party to be divided successively by a series of divisors, and seats are allocated to parties that secure the highest resulting quotient, up to the total number of seats available. The most widely used is the d’Hondt formula, using divisors (such as 1,2,3 etc), employed in Poland, Romania, Spain and Israel. The 'pure' Sainte-Laguë method, used in New Zealand, divides the votes with odd numbers (1,3,5,7 etc). The 'modified' Sainte-Laguë replace the first divisor by 1.4 but is otherwise identical to the pure version. An alternative is the largest remainder methods, which uses a minimum quota, which can be calculated, in a number of ways. In the simplest with the Hare quota, used in Denmark and Costa Rica, and for the list constituencies in Taiwan, Ukraine and Lithuania, the total number of valid votes in each constituency is divided by the total number of seats to be allocated. The Droop quota, used in South Africa, the Czech Republic, and Greece, raises the divisor by the number of seats plus one, producing a slightly less proportional result.
Other important differences in countries under comparison within the PR category include the formal threshold that parties must pass to qualify for seats. It should be noted that the formal threshold set by statute or specified in constitutional requirements is distinct from the effective vote threshold, which is the actual minimum share of the vote that leads to gaining at least one seat. The formal threshold ranges from the lowest level of 0.67% of the national vote, used in the Netherlands, up to 7 percent of the vote, used in Poland. Worldwide one of the highest vote thresholds is in Turkey, with a 10% hurdle whereas there is no formal threshold in some countries such as South Africa, where less that 0.25% of the national vote is necessary for election. The formal threshold can have an important impact upon proportionality and the opportunities for minor parties. District magnitude, or the mean number of seats per constituency, also varies substantially. In Israel, for example, all 120 members of the Knesset run in one nation-wide constituency. By contrast, in Spain the 350 members are elected in fifty list districts, each district electing seven members on average. Generally under PR systems, the larger the district

ELECTORAL ENGINEERING ~ CHAPTER 2 3/10/2003 6:30 PM
7
magnitude, the more proportional the outcome, and the lower the hurdles facing smaller parties.
Single Transferable Vote
The other alternative system in the proportional category is the ‘Single Transferable Vote’ (STV), currently employed in legislative elections in Ireland, Malta, and for the Australian Senate19. The system can be classified as proportional because of the use of the quota for election. Under this system, each country is divided into multi-member constituencies that each have about four or five representatives. Parties put forward as many candidates as they think could win in each constituency. Voters rank their preferences among candidates in an ordinal fashion (1st, 2nd, 3rd,...). The total number of votes is counted, and then the number of seats divides this vote total in the constituency to produce a quota. To be elected, candidates must reach the minimum quota. When the first preferences are counted, if no candidates reach the quota, then the candidate with the least votes is eliminated, and their votes redistributed according to second preferences. This process continues until all seats are filled. Proponents argue that by allowing citizens to identify a rank order for their preferences within parties, or by ballot-splitting their votes across different parties, STV provides greater freedom of choice than other systems20. Moreover by retaining proportionality, these rules also generate a fair outcome in terms of the votes-to-seats ratio.
Combined Systems Moreover an increasing number of countries, including Italy, New Zealand, and Russia, use
‘combined’ systems, employing different electoral formulae in the same contest, although with a variety of alternative designs. In this regard we follow Massicotte and Blais in classifying ‘combined’ systems (otherwise known as ‘mixed’, ‘hybrid’ or ‘side-by-side’ systems) according to their mechanics, not by their outcome21. If we followed the later strategy, such as defining or labeling electoral systems based on their level of proportionality, then this approach could create circular arguments. There is an important distinction within this category, which is overlooked in some discussions, between combined-dependent systems, where both parts are interrelated, and combined-independent systems, where two electoral formulae operate in parallel towards each other.
Combined-Dependent Systems Combined-dependent systems, exemplified by the German and New Zealand parliamentary
elections, include both single-member and party list constituencies, but the distribution of seats is proportional to the share of the vote cast in the party list. As a result the outcome of combined-dependent systems is closer to the ‘proportional’ than the ‘majoritarian’ end of the spectrum, although the logic of voter choice in these systems means that they still remain different from pure PR. The best-known application is in Germany, where electors can each cast two votes (see Figure 2.6). Half the members of the Bundestag (328) are elected in single-member constituencies based on a simple plurality of votes. The remaining MPs are elected from closed party lists in each region (Land). Parties, which receive, less than a specified minimum threshold of list votes (5 per cent) are not be entitled to any seats. The total number of seats, which a party receives in Germany, is based on the Niemeyer method, which ensures that seats are proportional to second votes cast for party lists. Smaller parties which received, say, 10 per cent of the list vote, but which did not win any single-member seats outright, are topped up until they have 10 per cent of all the seats in Parliament. It is possible for a party to be allocated 'surplus' seats when it wins more district seats in the single-member district vote than it is entitled to under the result of the list vote.
[Figure 2.6 about here]
New Zealand is also classified as a ‘combined-dependent system’, because the outcome is proportional to the party list share of the vote. The ‘Mixed Member Proportion’ (MMP) system (as it is known in New Zealand) gives each elector two votes, one for the district candidate in single-member seats and one for the party list22. As in Germany, the list PR seats compensate for any disproportionality produced by the single-member districts. In total 65 of the 120 members of the House of Representatives are elected in single-member constituencies based on a simple plurality of votes in single-member districts. The remainder is elected from closed national party lists. Parties receiving less than 5% of list votes fall below the minimal threshold to quality for any seats. All other parties are allocated seats based on the Sainte-Laguë method, which ensures that the total allocation of seats is highly proportional to the share of votes cast for party lists. Smaller parties which received, say, 10 per cent of the list vote, but

ELECTORAL ENGINEERING ~ CHAPTER 2 3/10/2003 6:30 PM
8
which did not win any single-member seats outright, are topped up until they have 10 per cent of all the seats in the House of Representatives. The 1996 New Zealand election saw the entry of six parties into parliament and produced a National-New Zealand First coalition government.
Combined-Independent Systems Other electoral systems under comparison can be classified as ‘combined-independent’ systems,
following the Massicotte and Blais distinction, with two electoral systems used in parallel, exemplified by the Ukraine and Taiwan 23. In these systems the votes are counted separately in both types of seat so that the share of the vote for each party cast in the party lists is unrelated to the distribution of seats in the single-member districts. As a result combined-independent systems are closer to the ‘majoritarian’ than the ‘proportional’ end of the spectrum.
The March 1996 elections to the National Assembly in Taiwan exemplify this system. The Taiwanese National Assembly is composed of 334 seats, of which 234 are filled by the single non-transferable vote (SNTV). Voters cast a single vote in one of 58 multimember districts, each with 5-10 seats. The votes of all candidates belonging to the same party in all districts are aggregated into party votes and the list PR seats are allocated among those parties meeting the 5% threshold. There are 80 PR list seats on a nationwide constituency and 20 PR list seats reserved for the overseas Chinese community. Taiwan has a three party system, with the Nationalist Party (KMT) dominant since 1945, the Democratic Progressive Party, founded in 1986, providing the main opposition and the New Party, founded in 1993, with the smallest support. The major cleavage in Taiwanese party politics is the issue of national identity, dividing those who identify themselves as mainlanders who favor reunification with China and many native Taiwanese who favor independence. The New Party is commonly considered most pro-unification and the Democratic Progressive Party the most pro-independence24.
The Ukrainian elections also illustrate how combined-independent systems work. The 29 March 1998 parliamentary contests were the second elections held since Ukrainian independence. Ukrainian voters could each cast two ballots. Half the deputies were elected by First-Past-The-Post in single-member districts and others were elected from nation-wide party lists, with a 4% threshold. Unlike the system in New Zealand and Germany, the two systems operated separately so that many smaller parties were elected from the single-member districts. The 1998 elections were contested by 30 parties and party blocks, although only ten of these groups could be said to have a clear programmatic profile and organizational base25. The Ukrainian result produced both an extremely fragmented and unstable party system: 8 parties were elected via party lists and 17 won seats via the single-member districts, along with 116 Independents. The election produced the highest Effective Number of Parliamentary Parties (5.98) in the countries under comparison, and it also generated also fairly disproportional votes: seats ratio that benefited the larger parties. Ethnicity was reflected in the appeal of particular parties, including the Russophile Social Liberal Union, the Party of Regional Revival, and the Soyuz (Union) party, and also in the way that ethnic-Russians were twice as likely to support the Communist party as ethnic-Ukrainians26.
For the comparison of the consequences of electoral systems, such as the link between different types of formula and patterns of party competition or electoral turnout, this study compares the broadest range of countries worldwide that is available from sources of international data. For the survey analysis, however, we compare a more limited range of legislative and presidential elections. For parliamentary elections for the lower house, in the countries under comparison in Module I of the CSES dataset, fifteen elections were held from 1996 to 2002 using proportional electoral systems. Ten nations held parliamentary elections using combined electoral systems, including independent and dependent sub-types. Lastly four countries held parliamentary elections for the lower house under majoritarian rules. There are also many important differences in electoral systems within each category, summarized in Table 2.1, for example in the ballot structure of first-past-the-post in the UK and the Alternative Vote in Australia, in the proportion of members elected in single-member and proportional districts in combined systems, as well as in the level of electoral thresholds facing minor parties.
[Table 2.1 about here]
The distribution of electoral systems around the world, illustrated in Table 2.2 and Figure 2.7, confirms the regional patterns and the residual legacy stamped upon constitutions by their colonial histories. Three-quarters of the former-British colonies continue to use a majoritarian electoral system

ELECTORAL ENGINEERING ~ CHAPTER 2 3/10/2003 6:30 PM
9
today, as do two-thirds of the ex-French colonies. By contrast, three-quarters of the former-Portuguese colonies, two-thirds of the ex-Spanish colonies, and all the former Dutch colonies use proportional electoral systems today. The post-communist states freed from rule by the Soviet Union divided almost evenly among the three major electoral families, although slightly more countries (37%) have adopted proportional systems. While Eastern Europe leans towards majoritarian arrangements, Central Europe adopted more proportional systems.
[Figure Table 2.2 and 2.7 about here]
Presidential Electoral Systems The countries under comparison in Module I of the CSES dataset also allow comparison of ten
presidential elections, illustrated in Table 2.2, all held under majoritarian or plurality rules27. The simple plurality First-Past-the-Post was used in Mexico and Taiwan. The 2nd ballot 'majority-runoff' system (also known as the ‘double ballot’) is used worldwide in fifteen of the 25 countries with direct Presidential elections, including in Austria, Columbia, Finland, Russia, France, Belarus, and Russia, and in seven of the nations under comparison in the CSES dataset. In these elections, if no candidate gets at least 50% of the vote in the first round, then the top two candidates face each other in a second round to insure a majority of votes for the leading candidate. This system is exemplified by the 1996 Russian Presidential election, where 78 candidates registered to run for election, of which 17 qualified for nomination. In the first round Boris Yeltsin won 35.3 percent of the vote, with Gennadii Zyuganov, the Communist candidate; close behind with 32 percent, and Alexander Lebed third with 14.5 percent of the vote. After the other candidates dropped out, and Lebed swung his supporters behind Yeltsin, the final result of the second election was a decisive 53.8 percent of the vote for Yeltsin against 40.3 percent for Zyuganov28. Runoff elections aim to consolidate support behind the major contenders and to encourage broad cross-party coalition building in the final stages of the campaign.
The United States uses the unique device of the Electoral College. The president is not decided directly by popular vote, instead popular votes are collected within each state and, since 1964, the District of Columbia. Each state casts all of its electoral votes for the candidate receiving a plurality of votes within each state (the unit rule). Each state is allowed as many electoral votes as it has senators and representatives in Congress. This means that even sparsely populated states like Alaska have at least three electoral votes. Nevertheless the most populous states each cast by far the greatest number of electoral votes, and therefore presidential contenders devote most attention and strategic resources (spending, political ads, and visits) during the campaign to these states, such as New York, California, New Jersey, Pennsylvania, Ohio, Florida, Illinois, Michigan and Texas, especially when polls suggest that the race is close in these areas. The importance of these rules is exemplified by the outcome of the 2000 election, where Republican George W. Bush won a 271-266 majority in the electoral college despite the fact that his opponent, Al Gore, won about half a million more popular votes. The results called attention to the need to alter the electoral college, which has not experienced major reform since 1804, despite the fact that many critics have regarded the system as archaic, outmoded, and essentially undemocratic29. Other important variations among the presidential electoral systems under comparison include the length of office, ranging from four to six years, and whether presidential elections are held in conjunction with legislative contests, which could be expected to strengthen the party coat-tails of presidential candidates and therefore create stronger legislative-executive links, or whether they are held separately, which reinforces the separation of powers.
[Table 2.3 about here]
The consequences of different arrangements also generate different electoral decisions by citizens, including how often they are called to the ballot box and what choices they face. Table 2.4 illustrates the major variations in the countries and national election under comparison. The least demands are in parliamentary democracies such as Australia and Britain where citizens only cast one ballot at national level, although there are many other types of contest such as Australian state and local elections, and British elections to the European parliament, as well as to the Scottish Parliament and Welsh Assembly and to local government. By contrast at national level Russian citizens are called to the polls twice for the 2nd ballot presidential elections, as well as casting two votes for the Duma. The other nations present different demands upon citizens ranging between these extremes. Obviously greater options for voting provide citizens with more opportunity for political expressions, for example with spilt-

ELECTORAL ENGINEERING ~ CHAPTER 2 3/10/2003 6:30 PM
10
ticket voting between levels, but at the same time frequent demands from successive elections at multiple levels of office carries the danger of voter fatigue.
[Table 2.4 about here]
Conclusion: The Consequences of Electoral Systems Often the choice of electoral system seems mechanistic, abstract, and highly technical, with
constitutional engineering designed to bring about certain objectives. But the issue of how the electoral system should function reflects essentially contested normative concepts of representative government. For advocates of adversarial democracy, the most important considerations for electoral systems are that the votes cast in elections (not the subsequent process of coalition building) should determine the party or parties in government. The government should be empowered to implement their programme during their full term of office, without depending upon the support of minority parties. The government should remain accountable for their actions to parliament, and ultimately to the public. And at periodic intervals the electorate should be allowed to judge the government’s record, evaluate prospective policy platforms offered by the opposition parties, and cast their votes accordingly. Minor parties in third or fourth place are discriminated against by majoritarian elections for the sake of governability. From this perspective, proportional elections are ineffective since they can produce indecisive outcomes, unstable regimes, disproportionate power for minor parties in ‘kingmaker’ roles, and a lack of clear-cut accountability and transparency in decision-making.
By contrast, proponents of consensual democracy argue that majoritarian systems place too much faith in the winning party, especially in plural societies divided by ethnic conflict, with too few constraints on government during their term of office. For the vision of consensual democracy, the electoral system should promote a process of conciliation, consultation, and coalition-building within parliaments. Parties above a minimum threshold should be included in the legislature in rough proportion to their level of electoral support. The party or parties in government should craft policies based on a consensus among their coalition partners. Moreover the composition of parliament should reflect the main divisions in society and the electorate, so that all citizens have spokespersons articulating their interests, perspectives and concerns in national debates. In this view, majoritarian systems over-reward the winner, producing 'an elected dictatorship’ where a government based on a plurality can steamroller its policies, and implement its programmes, without the need for consultation and compromise with other parties in parliament or other groups in society. The unfairness and disproportionate results of plurality electoral systems, outside of two-party contests, means that some voices in the electorate are systematically excluded from public debate.
We can conclude, agnostically, that there is no single 'best' electoral system: the central arguments between adversarial and consensual democratic theorists represent irresolvable value conflicts. For societies, which are divided by deep-rooted ethnic, religious or ethnic conflict, like Mali, Bosnia, or Israel, proportional electoral systems may prove more inclusive, as Lijphart argues. But, as others warn, PR elections may also reinforce, rather than ameliorate, such cleavages30. For states, which are highly centralized, like Britain or New Zealand, majoritarian systems can insulate the government from the need for broader consultation and for democratic checks and balances. In constitutional design it appears that, despite the widespread appeal of the rhetoric of 'electoral engineering' for optimal decision-making, in practice there are no easy choices. A wide range of alternative rules can potentially influence the impact of these electoral systems both on patterns of voting behavior and political representation. The ‘mechanical’ effects of electoral rules are easier to predict that the ‘psychological’ ones, and in both cases many effects are highly contingent, since they are embedded within many other institutional, political, cultural and social contexts. The next chapters go on to discuss the normative debates about electoral systems in more detail and then considers some of the most important consequences of electoral rules for voting behavior, including for party competition, the strength of social cleavages and partisan identification, and patterns of electoral turnout.

ELECTORAL ENGINEERING ~ CHAPTER 2 3/10/2003 6:30 PM
11
Figure 2.1 Electoral systems used worldwide for the lower house of parliament, 1997
Notes: FPTP First Past the Post; 2nd Ballot; Block Vote; AV Alternative Vote; SNTV Single Non-Transferable Vote; STV Single Transferable Vote. Systems are classified in May 1997 based on Appendix A in Andrew Reynolds and Ben Reilly. Eds. The International IDEA Handbook of Electoral System Design. Stockholm: International Institute for Democracy and Electoral Assistance. For more details see http://www.aceproject.org/
AV2
2nd Ballot24
Majority26
FPTP54
Bloc Vote9
SNTV2
Plurality65
Majoritarian91
Independent21
Dependent8
Combined29
STV2
Closed35
Open27
Party List62
PR64
No direct elections7
Nation States191
Adversarial Democracy and Government Accountability
Consensual democracy and Parliamentary Inclusiveness

ELECTORAL ENGINEERING ~ CHAPTER 2 3/10/2003 6:30 PM
12
Figure 2.2. An example of the First-Past-the-Post ballot in the UK general election
ELECTORAL ENGINEERING ~ CHAPTER 2 3/10/2003 6:30 PM
13
Figure 2.3: An example of First-Past-the-Post ballot with multiple offices for the United States General Election: Sonoma County

ELECTORAL ENGINEERING ~ CHAPTER 2 3/10/2003 6:30 PM
14
Figure 2.4: An example of the Alternative Vote ballot for the Australian House of Representatives

ELECTORAL ENGINEERING ~ CHAPTER 2 3/10/2003 6:30 PM
15
Figure 2.5: An example of the Party List ballot for the South African Parliament

ELECTORAL ENGINEERING ~ CHAPTER 2 3/10/2003 6:30 PM
16
Figure 2.6: An example of a Combined or Mixed-Member ballot used for the German Bundestag

ELECTORAL ENGINEERING ~ CHAPTER 2 3/10/2003 6:30 PM
17
Figure 2.7: The world of electoral systems, 1997
Majoritarian Combined Proportional No elections

ELECTORAL ENGINEERING ~ CHAPTER 2 3/10/2003 6:30 PM
18
Table 2.1: Electoral Systems for the Lower House of Parliament, selected elections under comparison, 1996-2002 TYPE OF DISTRICTS
Year of Election
Electoral System
Party List
Formula Formal vote
thresh-hold (%)
Total N. of MPs
N. Of SMD MPs
N. Of List MPs
Total number
of Districts for Lists
Voting Age Population
(VAP)
Average VAP per member
Mean District Mag. List
seats
Prop. ENPP Max. Years
between Elections
Majoritarian Australia 1996 AV None Majority None 148 148 0 0 13 547 900 91,500 1 84 2.61 3 Canada 1997 FPTP None Plurality None 301 301 0 0 23 088 800 78,300 1 83 2.98 5
UK 1997 FPTP None Plurality None 659 659 0 0 45 093 500 68,400 1 80 2.11 5 USA 1996 FPTP None Plurality None 435 435 0 0 196 511 000 436,700 1 94 1.99 2
Combined-Independent Japan 1996 FPTP+PR Closed D’ Hondt 500 300 200 11 96 672 700 193,400 18 86 2.93 4
Korea, Republic of 2000 FPTP+PR Closed LR-Hare 5 299 253 46 1 34 364 700 114, 900 46 84 2.36 4 Russia 1999 FPTP+PR Closed LR-Hare 5 450 225 225 1 109 212 000 242,700 225 89 5.40 4 Taiwan 1996 SNTV+PR Closed LR-Hare 5 334 234/27 100 2 14 340 600 42,900 50 95 2.46 4 Ukraine 1998 FPTP+PR Closed LR-Hare 4 450 225 225 1 38 939 100 86,500 225 86 5.98 5
Combined-Dependent Germany 1998 FPTP+PR Closed LR-Hare 5 656 328 328 1 65 942 100 100,000 328 94 3.30 4 Hungary 1998 2nd Ballot+PR Closed D’ Hondt 5 386 176 210 20 7 742 900 20,000 8 86 3.45 4
New Zealand 1996 FPTP+PR Closed St Laguë 5 120 65 55 1 2 571 800 21,400 55 96 3.78 3 Mexico 1997 FPTP+PR Closed LR-Hare 2 500 300 200 5 55 406 900 110,800 40 92 2.86 3
Thailand 2001 FPTP+PR Closed D’ Hondt 5 500 400 100 1 42 663 000 85, 000 100 88 2.92 4 Proportional
Belgium 1999 PR Lists Open D’ Hondt 0 150 0 150 20 8 000 000 53 300 8 96 9.05 4 Czech Republic 1996 PR Lists Open LR-Droop 5 200 0 200 8 7 859 200 39,300 25 89 4.15 4
Denmark 1998 PR Lists Open St. Laguë 2 179 0 179 17 4 129 000 23,000 8 98 4.92 4 Iceland 1999 PR Lists Closed LR-Hare 63 0 63 9 196 604 3,120 6 98 3.45 4
Israel 1996 PR Lists Closed D’ Hondt 1.5 120 0 120 1 3 684 900 30,700 120 96 5.63 5 Netherlands 1998 PR Lists Closed D’ Hondt 0.67 150 0 150 1 11 996 400 80,000 150 95 4.81 4
Norway 1997 PR Lists Closed St. Laguë 4 165 0 165 19 3 360 100 20,000 9 95 4.36 4 Peru 2000 PR Lists Open D’ Hondt 0 120 0 120 1 15 187 000 127 000 120 98 3.81 4
Poland 1997 PR Lists Open D’ Hondt 7 460 0 460 52 27 901 700 60,700 9 82 2.95 4 Portugal 2002 PR Lists Closed D’ Hondt 230 0 230 22 8 882 561 38,619 10 93 2.61 4 Romania 1996 PR Lists Closed D’ Hondt 3 343 0 343 42 16 737 300 48,800 8 82 3.37 4 Slovenia 1996 PR Lists Open LR-Hare 3 90 0 90 8 1 543 000 17,000 11 84 5.52 4
Spain 1996 PR Lists Closed D’ Hondt 3 350 0 350 52 31 013 030 88,600 7 93 2.73 4 Sweden 1998 PR Lists Open St. Laguë 4 349 0 349 29 6 915 000 19,800 11 97 4.29 4
Switzerland 1999 PR Lists Panachage D’ Hondt 0 200 0 200 26 5 736 300 28,700 8 93 5.08 4 Notes: PR Proportional Representation; FPTP First Past the Post; AV Alternative Vote; SMD Single-member Districts; List Party List; SMD Single-member Districts; List Party List. For the measures of proportionality and ENPP see Table A1. ENPP is the Effective Number of Parliamentary Parties calculated following the method of Laakso and Taagepera (1979). Prop. The Index of Proportionality is calculated following as the difference between a party’s share of the vote and its share of the total seats in Parliament, summed, divided by two, and subtracted from 100. Theoretically it can range from 0 to 100. This is a standardized version of the Loosemore-Hanby index. For details see Rose, Munro and Mackie (1998). The formal vote threshold is the minimum share of the vote (in the district or nation) required by law to qualify for a seat, and this is distinct from the informal threshold or the actual minimum share of the vote required to win a seat. Note that the classification distinguishes between combined dependent systems, where the outcome depends upon the proportion of votes cast in the party lists, and independent combined systems used in Japan, Russia and Korea where the single-member districts and party lists operate in parallel. It should be noted that Belgium subsequently introduced a 5% formal vote threshold for the May 2003 general elections. Voting Age Population: IDEA Voter Turnout from 1945 to 1997. www.idea.int Sources: Successive volumes of Electoral Studies; Richard Rose, Neil Munro and Tom Mackie. 1998. Elections in Central and Eastern Europe Since 1990. Strathclyde: Center for the Study of Public Policy; Richard Rose (ed) International Encyclopedia of Elections. Washington DC: CQ Press 2000; http://www.aceproject.org/ ; Lawrence LeDuc, Richard G. Niemi and Pippa Norris. Eds. 2002. Comparing Democracies 2: New Challenges in the Study of Elections and Voting. London: Sage. Table 1.2; CSES Macro-Level Dataset.

ELECTORAL ENGINEERING ~ CHAPTER 2 3/10/2003 6:30 PM
19

ELECTORAL ENGINEERING ~ CHAPTER 2 3/10/2003 6:30 PM
20
Table 2.2. Type of electoral system in use by past colonial history British France Portugal Spain Netherlands Belgium Soviet
UnionOther None All
Majoritarian First-Past-The-Post 62.7 10.7 66.7 3.7 42.9 26.3 29.3 Second Ballot 5.1 39.3 4.8 25.9 10.5 13.0 Bloc Vote 6.8 10.7 4.8 7.1 4.9 Alternative Vote 3.4 1.1 Single Non-Transferable Vote 1.7 3.6 1.1Combined Combined-independent 3.4 14.3 14.3 14.3 29.6 14.3 5.3 11.4 Combined-dependent 1.7 14.3 3.7 15.8 4.3Proportional Party List PR 11.9 21.4 85.7 61.9 100.0 33.3 37.0 35.7 42.1 33.7 Single Transferable Vote 3.4 1.1 Total number of states 59 28 7 21 4 3 27 16 19 184Note: The percentage of each colonial group using different types of electoral systemsCountries were classified by electoral system using the typology and sources in Figure 2.1 and by their predominant colonial history from the CIA World Fact book, 2002. www.cia.org. The comparison covers 191 nation-states worldwide, excluding the seven states without direct elections during this period.

ELECTORAL ENGINEERING ~ CHAPTER 2 3/10/2003 6:30 PM
21
Table 2.3: Direct elections for president/prime minister, selected elections under comparison, 1996-2001 Type Year of Election Electoral System In conjunction
with legislative elections
Voting Age Population
Vote/VAP Max. Years between Elections
Belarus Majoritarian 2001 2nd Ballot Yes 7 585 000 81.3 5Chile Majoritarian 1999 2nd Ballot No 10 066 000 72.8 6Israel (i) Majoritarian 1996 2nd Ballot Yes 3 995 000 84.5 4Lithuania Majoritarian 1997 2nd Ballot No 2 740 000 70.7 5Mexico Plurality 2000 FPTP Yes 62 685 000 60.0 6Peru Majoritarian 2000 2nd Ballot Yes 15 430 000 78.6 5Romania Majoritarian 1996 2nd Ballot Yes 16 737 000 78.1 4Russia Majoritarian 2000 2nd Ballot No 109 037 000 68.8 5Taiwan Plurality 1996 FPTP Yes 14 154 000 76.9 4USA Majoritarian 1996 Electoral College Yes 196 511 000 49.3 4Note: (i) Direct elections for the Prime Minister in Israel, not the president. Sources: See Table 2.1

ELECTORAL ENGINEERING ~ CHAPTER 2 3/10/2003 6:30 PM
1
Table 2.4: The parliamentary and presidential elections under comparison Lower House of Parliament Presidential
Vote District Vote Party List
Vote Party List Candidate Preferential
Vote 1st 2nd Australia Belarus Belgium Canada Chile Czech Republic Denmark Germany Hungary Iceland Israel (i) Japan Korea, Rep Lithuania Mexico Netherlands New Zealand Norway Peru Poland Portugal Romania Russia Slovenia Spain Sweden Switzerland Taiwan Thailand UK Ukraine USA Note: This does not count other electoral options on the ballot, such as for local, regional, state-level, upper house/Senate, European, or other elected office, or any referenda issues.
(i) Note Israel includes direct elections for the Prime Minister, not president.

ELECTORAL ENGINEERING ~ CHAPTER 2 3/10/2003 6:30 PM
2
1 For comparative overviews of constitutional structures and issues of constitutional design see Samuel E.
Finer. 1995. Comparing Constitutions. Revised ed. Oxford: Oxford University Press; Arend Lijphart. 1999.
Patterns of Democracy. New Haven: Yale University Press; Dennis C. Mueller. 2000. Constitutional
Democracy. Oxford: Oxford University Press; Matthew Soberg Shugart and John M. Carey. 1992.
Presidents and Assemblies: Constitutional Design and Electoral Dynamics. Cambridge: Cambridge
University Press; Joachim Jens Hesse. Ed. 1995. Constitutional Policy and Change in Europe. Oxford:
Oxford University Press; Andrew Reynolds and Scott Mainwaring. Eds. 2002. The Architecture of
Democracy. Oxford: Oxford University Press.
2 Maurice Duverger. 1954. Political Parties, Their Organization and Activity in the Modern State. New
York: Wiley; Douglas W. Rae 1967. The Political Consequences of Electoral Laws. New Haven: Yale
University Press. Useful summaries are provided by André Blais and Louis Massicote. 1997. ‘Electoral
formulas: A macroscopic perspective.’ European Journal of Political Research. 32 (1): 107-129; André
Blais and Louis Massicote. 2002. ‘Electoral Systems.’ In Comparing Democracies 2: Elections and Voting
in Global Perspective. Eds. Lawrence LeDuc, Richard G. Niemi and Pippa Norris. London: Sage.
3 It can be argued that a further distinction needs to be drawn between majority and plurality elections,
given the higher effective electoral threshold used in the former. The contrast is evident for example
between First-Past-the-Post used in Canadian parliamentary elections, which requires a plurality of votes
(winning at least one more vote than any other candidate) to gain office and the Second Ballot system
used in the Russian Presidential elections, which requires an absolute majority to win office. Nevertheless
the classification used in this study is more parsimonious, the ballot structure used for plurality and
majoritarian elections is similar (casting a vote for a single candidate), and it is the standard typology
used in the literature.
4 In a few countries using plurality presidential elections, such as Costa Rica and Argentina, there is a
minimum threshold requirement, otherwise a runoff is held.
5 Maurice Duverger. 1954. Political Parties, Their Organization and Activity in the Modern State. New
York: Wiley. Pp217,239.
6 Douglas W. Rae 1967. The Political Consequences of Electoral Laws. New Haven: Yale University
Press.; William H. Riker. 1976. ‘The number of political parties: A reexamination of Duverger’s law.’
Comparative Politics 9: 93-106; William H. Riker. 1982. ‘The two-party system and Duverger’s Law: an
essay on the history of political science.’ American Political Science Review 76: 753-766; William H.
Riker. 1986. ‘Duverger’s Law Revisited.’ In Electoral Laws and Their Political Consequences, ed. Bernard
Grofman and Arend Lijphart. New York: Agathon Press, Inc; Maurice Duverger. 1986. ‘Duverger’s Law:
forty years later.’ In Electoral Laws and their Political Consequences. Ed. Bernard Grofman and Arend

ELECTORAL ENGINEERING ~ CHAPTER 2 3/10/2003 6:30 PM
3
Lijphart. New York: Agathon Press; Arend Lijphart, 1994. Electoral Systems and Party Systems. Oxford:
Oxford University Press.
7 See for example Ron Johnston, Charles Pattie, Danny Dorling and David Rossiter.2001. From Votes to
Seats: The Operation of the UK electoral System since 1945. Manchester: Manchester University Press.
8 For details see M.J. Hinich, M.C Munger, S. De Marchi. 1998. ‘Ideology and the construction of
nationality: The Canadian elections of 1993.’ Public Choice. 97(3): 401-428.
9 Wilma Rule and Joseph Zimmerman. 1992. United States Electoral Systems: Their Impact on Women
and Minorities. New York: Praeger.
10 For details of these elections see Pippa Norris. 1997 ‘Anatomy of a Labour Landslide.’ In Britain Votes
1997. Edited by Pippa Norris and Neil Gavin. Oxford: Oxford University Press. pp.1-24; Geoffrey Evans
and Pippa Norris. Eds. 1999. Critical Elections: British Parties and Voters in Long-term Perspective.
London: Sage; Gerald Pomper. 1997. The Election of 1996. Chatham, NJ: Chatham House.
11 For a discussion see Pippa Norris. 2002. ‘The Twilight of Westminster? Electoral Reform and its
Consequences’ Political Studies. 49:877-900.
12 John Curtice. 2001. ‘The Electoral System: Biased to Blair.’ In Britain Votes, 2001. Ed. Pippa Norris.
Oxford: Oxford University Press; David Rossiter, Ron Johnston, Charles Pattie, Danny Dorling, Ian
MacAllister and H. Tunstall. 1999. ‘Changing biases in the operation of the UK's electoral system, 1950–
97’ British Journal of Politics and International Relations.
13 See Lawrence LeDuc. 1998. ‘The Canadian Federal Election of 1997.’ Electoral Studies 17(1): 132-
137; Neil Nevitte, André Blais, Elisabeth Gidengil and Richard Nadeau. 2000. Unsteady State: The 1997
Canadian Federal Election. Oxford: Oxford University Press.
14 For the debate about electoral reform in Canada see the Law Commission of Canada. 2002. Renewing
Democracy: Debating Electoral Reform in Canada. Discussion Paper. JL2-20/2002. Ottowa: Law
Commission of Canada.
15 Bernard Grofman, Sung-Chull Lee, Edwin A. Winckler and Brian Woodall. Eds. 1997. Elections in
Japan, Korea and Taiwan under the Single Non-Transferable Vote: The Comparative Study of an
Embedded Institution. Ann Arbor: University of Michigan Press.
16 Marian Sawer Ed. 2001. Elections: Full, Free and Fair. Sydney: The Federation Press. For details of
the 1996 Australian election see: Clive Bean, Scott Bennett, Marian Simms and John Warhurst (eds).
1997. The Politics of Retribution: The 1996 Australian Federal Election. Sydney: Allen & Unwin; Clive
Bean. 1997. ‘Australia’s Experience with the Alternative Vote.’ Representation 34(2): 103-110.
17 Clive Bean. 1996. ‘The 1996 Australian Federal Election.’ Electoral Studies 15(3): 422-424.
18 For details of these election see: Richard Rose, Neil Munro and Tom Mackie. 1998. Elections in Central

ELECTORAL ENGINEERING ~ CHAPTER 2 3/10/2003 6:30 PM
4
and Eastern Europe Since 1990. Strathclyde: Center for the Study of Public Policy; Dennis Deletant and
Peter Saini-Davies. 1998. ‘The Romanian Elections of November 1996.’ Representation. 35(2/3): 155-
167; David Nachmias and Itai Sened. 1998. ‘The Bias of Pluralism: The Redistributional Effects of the
New Electoral Law in Israel's 1996 Election.’ In Asher Arian and Michal Shamir (eds.) Election in Israel -
1996, Albany: SUNY Press; Reuven Y. Hazan. 1996. ‘Presidential Parliamentarism: Direct Popular
Election of the Prime Minister, Israeli's New Electoral and Political System.’ Electoral Studies 15(1): pp.
21-37; Reuven Y. Hazan. ‘Three Levels of Election in Israel: The 1996 Party, Parliamentary and Prime
Ministerial Elections.’ Representation. 34(3/4): 240-249.
19 Shaun Bowler and Bernard Grofman. Eds. 2000. Elections in Australia, Ireland and Malta under the
Single Transferable Vote: Reflections on an Embedded Institution. Ann Arbor: University of Michigan
Press.
20 See, for example, the arguments of Enid Lakeman. 1974. How Democracies Vote. London: Faber and
Faber.
21 For a discussion and classification of ‘mixed systems’ see Louise Massicotte and Andre Blais. 1999.
‘Mixed Electoral Systems: A Conceptual and Empirical Survey.’ Electoral Studies 18(3): 341-366;
Matthew Soberg Shugart and Martin P. Wattenberg. Eds. 2001. Mixed-Member Electoral Systems: The
Best of Both Worlds? New York: Oxford University Press. Combined systems are also sometimes known
as ‘mixed’, ‘mixed-member’, or ‘hybrid’.
22 See Jonathan Boston, Stephen Levine, Elizabeth McLeay, and Nigel S. Roberts. 1996. New Zealand
Under MMP: A New Politics? Auckland: Auckland University Press; Gallagher 1996; Jack Vowles, Peter
Aimer, Susan Banducci and Jeffrey Karp. 1998. Voters’ Victory? New Zealand’s First Election under
Proportional Representation. Auckland: Auckland University Press.
23For a discussion see Louise Massicotte and André Blais. 1999. ‘Mixed Electoral Systems: A Conceptual
and Empirical Survey.’ Electoral Studies 18(3): 341-366.
24 John Fuh-Sheng Hsieh and Emerson M.S. Niou. 1996. ‘Taiwan’s March 1996 Elections.’ Electoral
Studies. 15(4): 545-550; Bernard Grofman. 1997. ‘SNTV, STV, and Single-Member District Systems:
Theoretical Comparisons and Contrasts.’ In Elections in Japan, Korea and Taiwan under the Single Non-
Transferable Vote: The Comparative Study of an Embedded Institution. Ed. Bernard Groffman, Sung-
Chull Lee, Edwin A. Winckler and Brian Woodall. Ann Arbor: University of Michigan Press.
25 Sarah Birch. 1997. ‘Ukraine: the Perils of Majoritarianism in a New Democracy.’ In The International
IDEA Handbook of Electoral System Design, Eds.Andrew Reynolds and Ben Reilly. Stockholm:
International Institute for Democracy and Electoral Assistance; Sarah Birch and Andrew Wilson. 1999.
‘The Ukrainian parliamentary elections of 1998.’ Electoral Studies 18(2): 276-282; Sarah Birch. 1998.
‘Electoral Reform in Ukraine: The 1988 Parliamentary Elections.’ Representation. 35(2/3): 146-154.

ELECTORAL ENGINEERING ~ CHAPTER 2 3/10/2003 6:30 PM
5
26 Sarah Birch and Andrew Wilson. 1999. ‘The Ukrainian parliamentary elections of 1998.’ Electoral
Studies 18(2): 276-282
27 For a worldwide comparison see André Blais, Louis Massicote and Agnieszka Dobrzynska. 1997.
‘Direct presidential elections: a world summary.’ Electoral Studies 16 (4): 441-455. For their
consequences see also Mark P. Jones. 1995. Electoral Laws and the Survival of Presidential
Democracies. Notre Dame: University of Notre Dame Press.
28 Stephen White, Richard Rose and Ian McAllister. 1996. How Russia Votes. New Jersey: Chatham
House.
29 F.A. Shelley. 2002. ‘The Electoral College and the election of 2000.’ Political Geography. 21 (1): 79-83.
30 George Tsebelis. 1990. ‘Elite Interaction and Constitution Building in Consociational Democracies.’
Journal of Theoretical Politics. 2: 5-29.


![Electoral Laws Amendment Act [No. 34 of 2003] · act no. 34,2003 electoral laws amendment act, 2003 (6) [had] has reported for voting at that voting station [at the time prescribed](https://static.fdocuments.us/doc/165x107/5b9b9bd209d3f2aa588d690b/electoral-laws-amendment-act-no-34-of-2003-act-no-342003-electoral-laws.jpg)


