Chapter 2: Arctic Climate - Past and Present - Arctic Climate Impact
40
Contents Summary . . . . . . . . . . . . . . . . . . . . . . . . . . . . . . . . . . . . . . . . . . . . . .22 2.1. Introduction . . . . . . . . . . . . . . . . . . . . . . . . . . . . . . . . . . . . . . . .22 2.2.Arctic atmosphere . . . . . . . . . . . . . . . . . . . . . . . . . . . . . . . . . . .23 2.2.1. Climatology . . . . . . . . . . . . . . . . . . . . . . . . . . . . . . . . . . . . . . . . . . .24 2.2.2.Variability modes . . . . . . . . . . . . . . . . . . . . . . . . . . . . . . . . . . . . . . .24 2.2.2.1. Arctic/North Atlantic Oscillation . . . . . . . . . . . . . . . . . . . .24 2.2.2.2. Pacific Decadal Oscillation . . . . . . . . . . . . . . . . . . . . . . . . .26 2.3. Marine Arctic . . . . . . . . . . . . . . . . . . . . . . . . . . . . . . . . . . . . . . . .26 2.3.1. Geography ............................................26 2.3.2. Influence of temperate latitudes . . . . . . . . . . . . . . . . . . . . . . . . . .27 2.3.3.Arctic Ocean . . . . . . . . . . . . . . . . . . . . . . . . . . . . . . . . . . . . . . . . . .29 2.3.4. Sea ice . . . . . . . . . . . . . . . . . . . . . . . . . . . . . . . . . . . . . . . . . . . . . . .30 2.4.Terrestrial water balance . . . . . . . . . . . . . . . . . . . . . . . . . . . . . .31 2.4.1. Permanent storage of water on land . . . . . . . . . . . . . . . . . . . . . .31 2.4.2. Hydrology of freshwater in the Arctic . . . . . . . . . . . . . . . . . . . . . .31 2.5. Influence of the Arctic on global climate . . . . . . . . . . . . . . . . .32 2.5.1. Marine connections . . . . . . . . . . . . . . . . . . . . . . . . . . . . . . . . . . . .32 2.5.1.1. Ice-albedo feedback to warming and cooling . . . . . . . . . .33 2.5.1.2. Freshwater feedback to poleward transport of heat and freshwater . . . . . . . . . . . . . . . . . . . . . . . . . . . . . . . . . . . . .33 2.5.2. Sea level . . . . . . . . . . . . . . . . . . . . . . . . . . . . . . . . . . . . . . . . . . . . .33 2.5.3. Greenhouse gases . . . . . . . . . . . . . . . . . . . . . . . . . . . . . . . . . . . . . .34 2.6.Arctic climate variability in the twentieth century . . . . . . . . .34 2.6.1. Observing systems and data sources . . . . . . . . . . . . . . . . . . . . . . .34 2.6.2. Atmospheric changes . . . . . . . . . . . . . . . . . . . . . . . . . . . . . . . . . . .35 2.6.2.1. Land-surface air temperature . . . . . . . . . . . . . . . . . . . . . . .35 2.6.2.2. Precipitation . . . . . . . . . . . . . . . . . . . . . . . . . . . . . . . . . . . .39 2.6.2.3. Sea-level pressure . . . . . . . . . . . . . . . . . . . . . . . . . . . . . . . .42 2.6.2.4. Other variables . . . . . . . . . . . . . . . . . . . . . . . . . . . . . . . . .42 2.6.3. Marine Arctic . . . . . . . . . . . . . . . . . . . . . . . . . . . . . . . . . . . . . . . . .44 2.6.4.Terrestrial system . . . . . . . . . . . . . . . . . . . . . . . . . . . . . . . . . . . . . .45 2.7.Arctic climate variability prior to 100 years BP . . . . . . . . . . . .46 2.7.1. Pre-Quaternary Period . . . . . . . . . . . . . . . . . . . . . . . . . . . . . . . . . .46 2.7.2. Quaternary Period . . . . . . . . . . . . . . . . . . . . . . . . . . . . . . . . . . . . .47 2.7.3. Last interglacial and glaciation . . . . . . . . . . . . . . . . . . . . . . . . . . . .48 2.7.3.1. Last interglacial:The Eemian . . . . . . . . . . . . . . . . . . . . . . . .48 2.7.3.2. Last glaciation:Wisconsinan/ Weichselian . . . . . . . . . . . . .48 2.7.4. Last glacial/interglacial transition through to mid-Holocene . . . . .49 2.7.4.1. Last glacial/interglacial transition . . . . . . . . . . . . . . . . . . . .49 2.7.4.2. Early to mid-Holocene . . . . . . . . . . . . . . . . . . . . . . . . . . . .50 2.7.5. Last millennium . . . . . . . . . . . . . . . . . . . . . . . . . . . . . . . . . . . . . . . .52 2.7.6. Concluding remarks . . . . . . . . . . . . . . . . . . . . . . . . . . . . . . . . . . . .54 2.8. Summary and key findings . . . . . . . . . . . . . . . . . . . . . . . . . . . . .54 Acknowledgements . . . . . . . . . . . . . . . . . . . . . . . . . . . . . . . . . . . . . .55 References . . . . . . . . . . . . . . . . . . . . . . . . . . . . . . . . . . . . . . . . . . . . .55 Chapter 2 Arctic Climate: Past and Present Lead Author Gordon McBean Contributing Authors Genrikh Alekseev, Deliang Chen, Eirik Førland, John Fyfe, Pavel Y. Groisman, Roger King, Humfrey Melling, Russell Vose, Paul H.Whitfield
Transcript of Chapter 2: Arctic Climate - Past and Present - Arctic Climate Impact
Contents
Summary . . . . . . . . . . . . . . . . . . . . . . . . . . . . . . . . . . . . . . . . . . . . . .222.1. Introduction . . . . . . . . . . . . . . . . . . . . . . . . . . . . . . . . . . . . . . . .222.2.Arctic atmosphere . . . . . . . . . . . . . . . . . . . . . . . . . . . . . . . . . . .23
2.2.1. Climatology . . . . . . . . . . . . . . . . . . . . . . . . . . . . . . . . . . . . . . . . . . .242.2.2.Variability modes . . . . . . . . . . . . . . . . . . . . . . . . . . . . . . . . . . . . . . .24
2.2.2.1.Arctic/North Atlantic Oscillation . . . . . . . . . . . . . . . . . . . .242.2.2.2. Pacific Decadal Oscillation . . . . . . . . . . . . . . . . . . . . . . . . .26
2.3. Marine Arctic . . . . . . . . . . . . . . . . . . . . . . . . . . . . . . . . . . . . . . . .262.3.1. Geography . . . . . . . . . . . . . . . . . . . . . . . . . . . . . . . . . . . . . . . . . . . .262.3.2. Influence of temperate latitudes . . . . . . . . . . . . . . . . . . . . . . . . . .272.3.3.Arctic Ocean . . . . . . . . . . . . . . . . . . . . . . . . . . . . . . . . . . . . . . . . . .292.3.4. Sea ice . . . . . . . . . . . . . . . . . . . . . . . . . . . . . . . . . . . . . . . . . . . . . . .30
2.4.Terrestrial water balance . . . . . . . . . . . . . . . . . . . . . . . . . . . . . .312.4.1. Permanent storage of water on land . . . . . . . . . . . . . . . . . . . . . .312.4.2. Hydrology of freshwater in the Arctic . . . . . . . . . . . . . . . . . . . . . .31
2.5. Influence of the Arctic on global climate . . . . . . . . . . . . . . . . .322.5.1. Marine connections . . . . . . . . . . . . . . . . . . . . . . . . . . . . . . . . . . . .32
2.5.1.1. Ice-albedo feedback to warming and cooling . . . . . . . . . .332.5.1.2. Freshwater feedback to poleward transport of heat and
freshwater . . . . . . . . . . . . . . . . . . . . . . . . . . . . . . . . . . . . .332.5.2. Sea level . . . . . . . . . . . . . . . . . . . . . . . . . . . . . . . . . . . . . . . . . . . . .332.5.3. Greenhouse gases . . . . . . . . . . . . . . . . . . . . . . . . . . . . . . . . . . . . . .34
2.6.Arctic climate variability in the twentieth century . . . . . . . . .342.6.1. Observing systems and data sources . . . . . . . . . . . . . . . . . . . . . . .342.6.2.Atmospheric changes . . . . . . . . . . . . . . . . . . . . . . . . . . . . . . . . . . .35
2.6.2.1. Land-surface air temperature . . . . . . . . . . . . . . . . . . . . . . .352.6.2.2. Precipitation . . . . . . . . . . . . . . . . . . . . . . . . . . . . . . . . . . . .392.6.2.3. Sea-level pressure . . . . . . . . . . . . . . . . . . . . . . . . . . . . . . . .422.6.2.4. Other variables . . . . . . . . . . . . . . . . . . . . . . . . . . . . . . . . .42
2.6.3. Marine Arctic . . . . . . . . . . . . . . . . . . . . . . . . . . . . . . . . . . . . . . . . .442.6.4.Terrestrial system . . . . . . . . . . . . . . . . . . . . . . . . . . . . . . . . . . . . . .45
2.7.Arctic climate variability prior to 100 years BP . . . . . . . . . . . .462.7.1. Pre-Quaternary Period . . . . . . . . . . . . . . . . . . . . . . . . . . . . . . . . . .462.7.2. Quaternary Period . . . . . . . . . . . . . . . . . . . . . . . . . . . . . . . . . . . . .472.7.3. Last interglacial and glaciation . . . . . . . . . . . . . . . . . . . . . . . . . . . .48
2.7.3.1. Last interglacial:The Eemian . . . . . . . . . . . . . . . . . . . . . . . .482.7.3.2. Last glaciation:Wisconsinan/ Weichselian . . . . . . . . . . . . .48
2.7.4. Last glacial/interglacial transition through to mid-Holocene . . . . .492.7.4.1. Last glacial/interglacial transition . . . . . . . . . . . . . . . . . . . .492.7.4.2. Early to mid-Holocene . . . . . . . . . . . . . . . . . . . . . . . . . . . .50
2.7.5. Last millennium . . . . . . . . . . . . . . . . . . . . . . . . . . . . . . . . . . . . . . . .522.7.6. Concluding remarks . . . . . . . . . . . . . . . . . . . . . . . . . . . . . . . . . . . .54
2.8. Summary and key findings . . . . . . . . . . . . . . . . . . . . . . . . . . . . .54Acknowledgements . . . . . . . . . . . . . . . . . . . . . . . . . . . . . . . . . . . . . .55References . . . . . . . . . . . . . . . . . . . . . . . . . . . . . . . . . . . . . . . . . . . . .55
Chapter 2
Arctic Climate: Past and Present
Lead AuthorGordon McBean
Contributing AuthorsGenrikh Alekseev, Deliang Chen, Eirik Førland, John Fyfe, Pavel Y. Groisman, Roger King, Humfrey Melling, Russell Vose,Paul H.Whitfield
22 Arctic Climate Impact Assessment
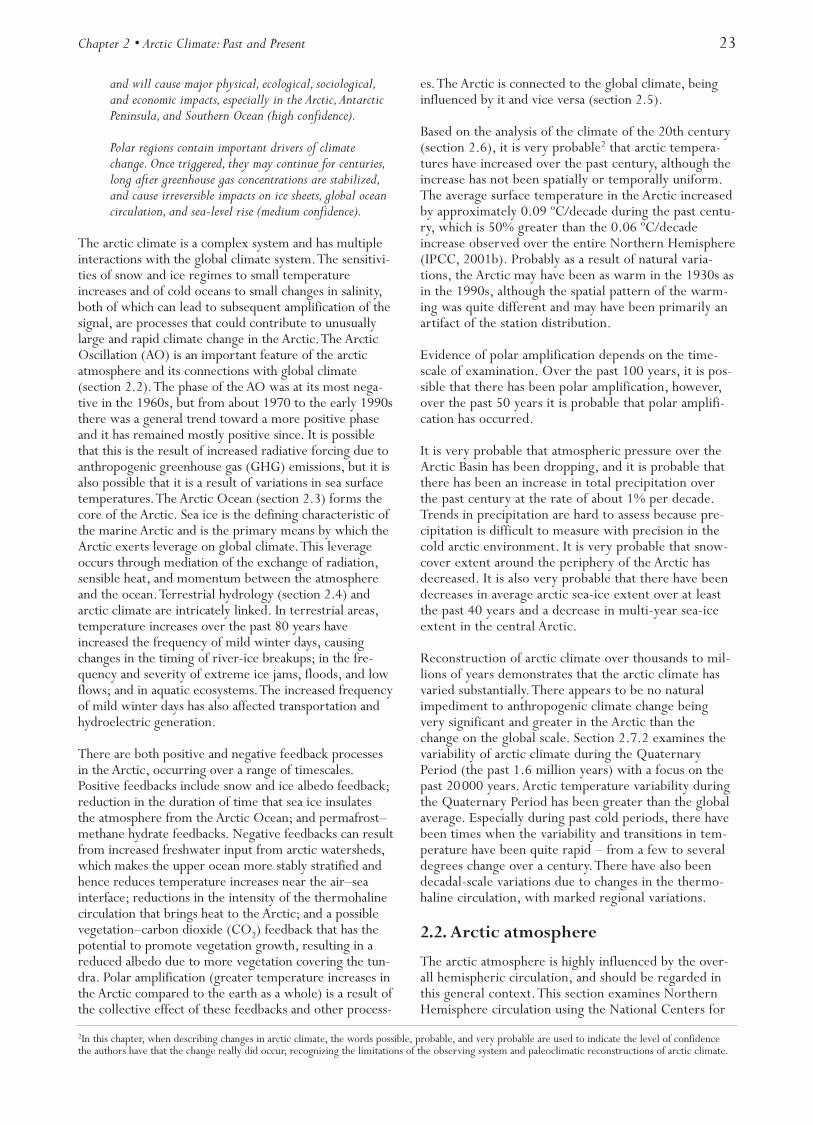
Reconstruction of arctic climate over the past thousandsto millions of years demonstrates that arctic climate canvary substantially.There appears to be no naturalimpediment to anthropogenic climate change beingvery significant and greater in the Arctic than thechange at the global scale. Especially during past coldperiods, there have been times when temperature tran-sitions have been quite rapid – from a few to severaldegrees change over a century.
2.1. Introduction
The Arctic is the northern polar component of theglobal climate system.The global climate system hasbeen thoroughly examined in the recent reports of theIntergovernmental Panel on Climate Change (IPCC,2001a,b,c), which include discussion of the impacts ofclimate change in the Arctic (IPCC, 2001a). Arctic cli-mate is characterized by a low amount or absence ofsunlight in winter and long days during summer.Although these solar inputs are a dominant influence,arctic climate exhibits significant spatial and temporalvariability. As a result, the Arctic is a collection ofregional climates with different ecological and physicalclimatic characteristics.
The cryosphere is a prominent feature of the Arctic,present as snow, ice sheets, glaciers, sea ice, andpermafrost.The physical properties of snow and iceinclude high reflectivity, low thermal conductivity, andthe high latent heat required to convert ice to liquidwater; these contribute significantly to the regionalcharacter of arctic climate.
The arctic climate interacts with the climates of moresouthern latitudes through the atmosphere, oceans, andrivers. Because of these regionally diverse features, anexact geographic definition of the Arctic is not appro-priate and this chapter focuses on the northernmostareas (usually north of 60º N), while acknowledginginteractions with more southerly areas.
The observational database for the Arctic is quitelimited, with few long-term stations and a paucity ofobservations in general.The combination of a sparseobservational dataset and high variability makes it diffi-cult to distinguish with confidence between the signalsof climate variability and change.
With respect to the polar regions, the IntergovernmentalPanel on Climate Change (IPCC, 2001a) stated:
Changes in climate that have already taken place aremanifested in the decrease in extent and thickness ofArctic sea ice, permafrost thawing, coastal erosion,changes in ice sheets and ice shelves, and altereddistribution and abundance of species in polar regions(high confidence).
Climate change in polar regions is expected to be amongthe largest and most rapid of any region on the Earth,
Summary
The arctic climate is defined by a low amount or absenceof sunlight in winter and long days during summer, withsignificant spatial and temporal variation.The cryosphereis a prominent feature of the Arctic.The sensitivities ofsnow and ice regimes to small temperature increases andof cold oceans to small changes in salinity are processesthat could contribute to unusually large and rapid cli-mate change in the Arctic.
The arctic climate is a complex system with multipleinteractions with the global climate system.The phaseof the Arctic Oscillation was at its most negative in the1960s, exhibited a general trend toward a more positivephase from about 1970 to the early 1990s, and hasremained mostly positive since. Sea ice is a primarymeans by which the Arctic exerts leverage on globalclimate, and sea-ice extent has been decreasing. In ter-restrial areas, temperature increases over the past 80years have increased the frequency of mild winter days,causing changes in aquatic ecosystems; the timing ofriver-ice breakups; and the frequency and severity ofextreme ice jams, floods, and low flows.
The observational database for the Arctic is quite limit-ed, with few long-term stations and a paucity of obser-vations in general, making it difficult to distinguish withconfidence between the signals of climate variability andchange. Based on the analysis of the climate of the 20thcentury, it is very probable that the Arctic has warmedover the past century, although the warming has notbeen uniform. Land stations north of 60º N indicatethat the average surface temperature increased byapproximately 0.09 ºC/decade during the past century,which is greater than the 0.06 ºC/decade increase aver-aged over the Northern Hemisphere. It is not possibleto be certain of the variation in mean land-station tem-perature over the first half of the 20th century becauseof a scarcity of observations across the Arctic beforeabout 1950. However, it is probable that the pastdecade was warmer than any other in the period of theinstrumental record.
Evidence of polar amplification depends on the time-scale of examination. Over the past 100 years, it is pos-sible that there has been polar amplification, however,over the past 50 years it is probable that polar amplifi-cation has occurred.
It is very probable that atmospheric pressure over theArctic Basin has been dropping, and it is probable thatthere has been an increase in total precipitation over thepast century at the rate of about 1% per decade.Trends inprecipitation are hard to assess because it is difficult tomeasure with precision in the cold arctic environment.It is very probable that snow-cover extent around theperiphery of the Arctic has decreased. It is also very prob-able that there have been decreases in average arctic sea-ice extent over at least the past 40 years and a decrease inmulti-year sea-ice extent in the central Arctic.
Chapter 2 • Arctic Climate: Past and Present 23
and will cause major physical, ecological, sociological,and economic impacts, especially in the Arctic,AntarcticPeninsula, and Southern Ocean (high confidence).
Polar regions contain important drivers of climatechange. Once triggered, they may continue for centuries,long after greenhouse gas concentrations are stabilized,and cause irreversible impacts on ice sheets, global oceancirculation, and sea-level rise (medium confidence).
The arctic climate is a complex system and has multipleinteractions with the global climate system.The sensitivi-ties of snow and ice regimes to small temperatureincreases and of cold oceans to small changes in salinity,both of which can lead to subsequent amplification of thesignal, are processes that could contribute to unusuallylarge and rapid climate change in the Arctic.The ArcticOscillation (AO) is an important feature of the arcticatmosphere and its connections with global climate(section 2.2).The phase of the AO was at its most nega-tive in the 1960s, but from about 1970 to the early 1990sthere was a general trend toward a more positive phaseand it has remained mostly positive since. It is possiblethat this is the result of increased radiative forcing due toanthropogenic greenhouse gas (GHG) emissions, but it isalso possible that it is a result of variations in sea surfacetemperatures.The Arctic Ocean (section 2.3) forms thecore of the Arctic. Sea ice is the defining characteristic ofthe marine Arctic and is the primary means by which theArctic exerts leverage on global climate.This leverageoccurs through mediation of the exchange of radiation,sensible heat, and momentum between the atmosphereand the ocean.Terrestrial hydrology (section 2.4) andarctic climate are intricately linked. In terrestrial areas,temperature increases over the past 80 years haveincreased the frequency of mild winter days, causingchanges in the timing of river-ice breakups; in the fre-quency and severity of extreme ice jams, floods, and lowflows; and in aquatic ecosystems.The increased frequencyof mild winter days has also affected transportation andhydroelectric generation.
There are both positive and negative feedback processesin the Arctic, occurring over a range of timescales.Positive feedbacks include snow and ice albedo feedback;reduction in the duration of time that sea ice insulatesthe atmosphere from the Arctic Ocean; and permafrost–methane hydrate feedbacks. Negative feedbacks can resultfrom increased freshwater input from arctic watersheds,which makes the upper ocean more stably stratified andhence reduces temperature increases near the air–seainterface; reductions in the intensity of the thermohalinecirculation that brings heat to the Arctic; and a possiblevegetation–carbon dioxide (CO2) feedback that has thepotential to promote vegetation growth, resulting in areduced albedo due to more vegetation covering the tun-dra. Polar amplification (greater temperature increases inthe Arctic compared to the earth as a whole) is a result ofthe collective effect of these feedbacks and other process-
es.The Arctic is connected to the global climate, beinginfluenced by it and vice versa (section 2.5).
Based on the analysis of the climate of the 20th century(section 2.6), it is very probable2 that arctic tempera-tures have increased over the past century, although theincrease has not been spatially or temporally uniform.The average surface temperature in the Arctic increasedby approximately 0.09 ºC/decade during the past centu-ry, which is 50% greater than the 0.06 ºC/decadeincrease observed over the entire Northern Hemisphere(IPCC, 2001b). Probably as a result of natural varia-tions, the Arctic may have been as warm in the 1930s asin the 1990s, although the spatial pattern of the warm-ing was quite different and may have been primarily anartifact of the station distribution.
Evidence of polar amplification depends on the time-scale of examination. Over the past 100 years, it is pos-sible that there has been polar amplification, however,over the past 50 years it is probable that polar amplifi-cation has occurred.
It is very probable that atmospheric pressure over theArctic Basin has been dropping, and it is probable thatthere has been an increase in total precipitation overthe past century at the rate of about 1% per decade.Trends in precipitation are hard to assess because pre-cipitation is difficult to measure with precision in thecold arctic environment. It is very probable that snow-cover extent around the periphery of the Arctic hasdecreased. It is also very probable that there have beendecreases in average arctic sea-ice extent over at leastthe past 40 years and a decrease in multi-year sea-iceextent in the central Arctic.
Reconstruction of arctic climate over thousands to mil-lions of years demonstrates that the arctic climate hasvaried substantially.There appears to be no naturalimpediment to anthropogenic climate change beingvery significant and greater in the Arctic than thechange on the global scale. Section 2.7.2 examines thevariability of arctic climate during the QuaternaryPeriod (the past 1.6 million years) with a focus on thepast 20000 years. Arctic temperature variability duringthe Quaternary Period has been greater than the globalaverage. Especially during past cold periods, there havebeen times when the variability and transitions in tem-perature have been quite rapid – from a few to severaldegrees change over a century.There have also beendecadal-scale variations due to changes in the thermo-haline circulation, with marked regional variations.
2.2. Arctic atmosphere
The arctic atmosphere is highly influenced by the over-all hemispheric circulation, and should be regarded inthis general context.This section examines NorthernHemisphere circulation using the National Centers for
2In this chapter, when describing changes in arctic climate, the words possible, probable, and very probable are used to indicate the level of confidencethe authors have that the change really did occur, recognizing the limitations of the observing system and paleoclimatic reconstructions of arctic climate.
24 Arctic Climate Impact Assessment
Environmental Prediction/National Center for Atmo-spheric Research reanalyses for the period from 1952 to2003 (updated from Kalnay et al., 1996). Section 2.2.1describes the main climatological features, while section2.2.2 discusses the two major modes of variability: theAO (and its counterpart, the North Atlantic Oscillation)and the Pacific Decadal Oscillation. Because much of theobserved change in the Arctic appears to be related topatterns of atmospheric circulation, it is important thatthese modes of atmospheric variability be described.
2.2.1. Climatology
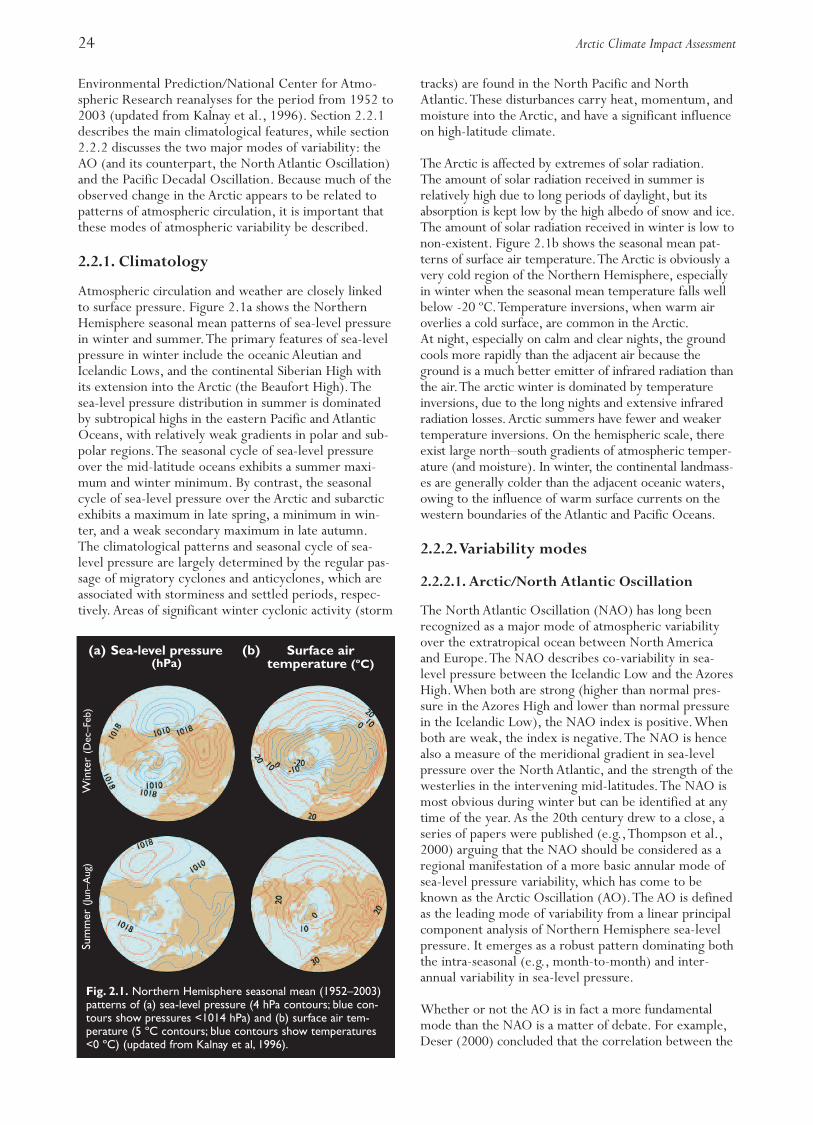
Atmospheric circulation and weather are closely linkedto surface pressure. Figure 2.1a shows the NorthernHemisphere seasonal mean patterns of sea-level pressurein winter and summer.The primary features of sea-levelpressure in winter include the oceanic Aleutian andIcelandic Lows, and the continental Siberian High withits extension into the Arctic (the Beaufort High).Thesea-level pressure distribution in summer is dominatedby subtropical highs in the eastern Pacific and AtlanticOceans, with relatively weak gradients in polar and sub-polar regions.The seasonal cycle of sea-level pressureover the mid-latitude oceans exhibits a summer maxi-mum and winter minimum. By contrast, the seasonalcycle of sea-level pressure over the Arctic and subarcticexhibits a maximum in late spring, a minimum in win-ter, and a weak secondary maximum in late autumn.The climatological patterns and seasonal cycle of sea-level pressure are largely determined by the regular pas-sage of migratory cyclones and anticyclones, which areassociated with storminess and settled periods, respec-tively. Areas of significant winter cyclonic activity (storm
tracks) are found in the North Pacific and NorthAtlantic.These disturbances carry heat, momentum, andmoisture into the Arctic, and have a significant influenceon high-latitude climate.
The Arctic is affected by extremes of solar radiation.The amount of solar radiation received in summer isrelatively high due to long periods of daylight, but itsabsorption is kept low by the high albedo of snow and ice.The amount of solar radiation received in winter is low tonon-existent. Figure 2.1b shows the seasonal mean pat-terns of surface air temperature.The Arctic is obviously avery cold region of the Northern Hemisphere, especiallyin winter when the seasonal mean temperature falls wellbelow -20 ºC.Temperature inversions, when warm airoverlies a cold surface, are common in the Arctic.At night, especially on calm and clear nights, the groundcools more rapidly than the adjacent air because theground is a much better emitter of infrared radiation thanthe air.The arctic winter is dominated by temperatureinversions, due to the long nights and extensive infraredradiation losses. Arctic summers have fewer and weakertemperature inversions. On the hemispheric scale, thereexist large north–south gradients of atmospheric temper-ature (and moisture). In winter, the continental landmass-es are generally colder than the adjacent oceanic waters,owing to the influence of warm surface currents on thewestern boundaries of the Atlantic and Pacific Oceans.
2.2.2.Variability modes
2.2.2.1. Arctic/North Atlantic Oscillation
The North Atlantic Oscillation (NAO) has long beenrecognized as a major mode of atmospheric variabilityover the extratropical ocean between North Americaand Europe.The NAO describes co-variability in sea-level pressure between the Icelandic Low and the AzoresHigh.When both are strong (higher than normal pres-sure in the Azores High and lower than normal pressurein the Icelandic Low), the NAO index is positive.Whenboth are weak, the index is negative.The NAO is hencealso a measure of the meridional gradient in sea-levelpressure over the North Atlantic, and the strength of thewesterlies in the intervening mid-latitudes.The NAO ismost obvious during winter but can be identified at anytime of the year. As the 20th century drew to a close, aseries of papers were published (e.g.,Thompson et al.,2000) arguing that the NAO should be considered as aregional manifestation of a more basic annular mode ofsea-level pressure variability, which has come to beknown as the Arctic Oscillation (AO).The AO is definedas the leading mode of variability from a linear principalcomponent analysis of Northern Hemisphere sea-levelpressure. It emerges as a robust pattern dominating boththe intra-seasonal (e.g., month-to-month) and inter-annual variability in sea-level pressure.
Whether or not the AO is in fact a more fundamentalmode than the NAO is a matter of debate. For example,Deser (2000) concluded that the correlation between the
Sea-level pressure (hPa)
Surface air temperature (ºC)
(a) (b)
Sum
mer
(Jun–
Aug
)W
inte
r(D
ec–F
eb)
Fig. 2.1. Northern Hemisphere seasonal mean (1952–2003)patterns of (a) sea-level pressure (4 hPa contours; blue con-tours show pressures <1014 hPa) and (b) surface air tem-perature (5 ºC contours; blue contours show temperatures<0 ºC) (updated from Kalnay et al, 1996).
Chapter 2 • Arctic Climate: Past and Present 25
Pacific and Azores high-pressure areas was not significant,and that the AO cannot therefore be viewed as reflectingsuch a teleconnection. Ambaum et al. (2001) found thateven the correlation between the Pacific and Icelandic–Arctic low-pressure centers was not significant.Theyargue that the AO is mainly a reflection of similar behav-ior in the Pacific and Atlantic basins. Regardless, the AOand NAO time series are very highly correlated, and formost applications (including this assessment), either para-digm can be used. Before proceeding with a descriptionof the AO/NAO, two cautionary points must be men-tioned. First, while the AO/NAO is obviously dominant,it explains only a fraction (i.e., 20 to 30%) of the totalvariability in sea-level pressure. Second, because theAO/NAO index is derived from a linear statistical tool,it cannot describe more general nonlinear variability.Monahan et al. (2003) have shown that hemispheric vari-ability is significantly nonlinear, and the AO provides onlythe optimal linear approximation of this variability.
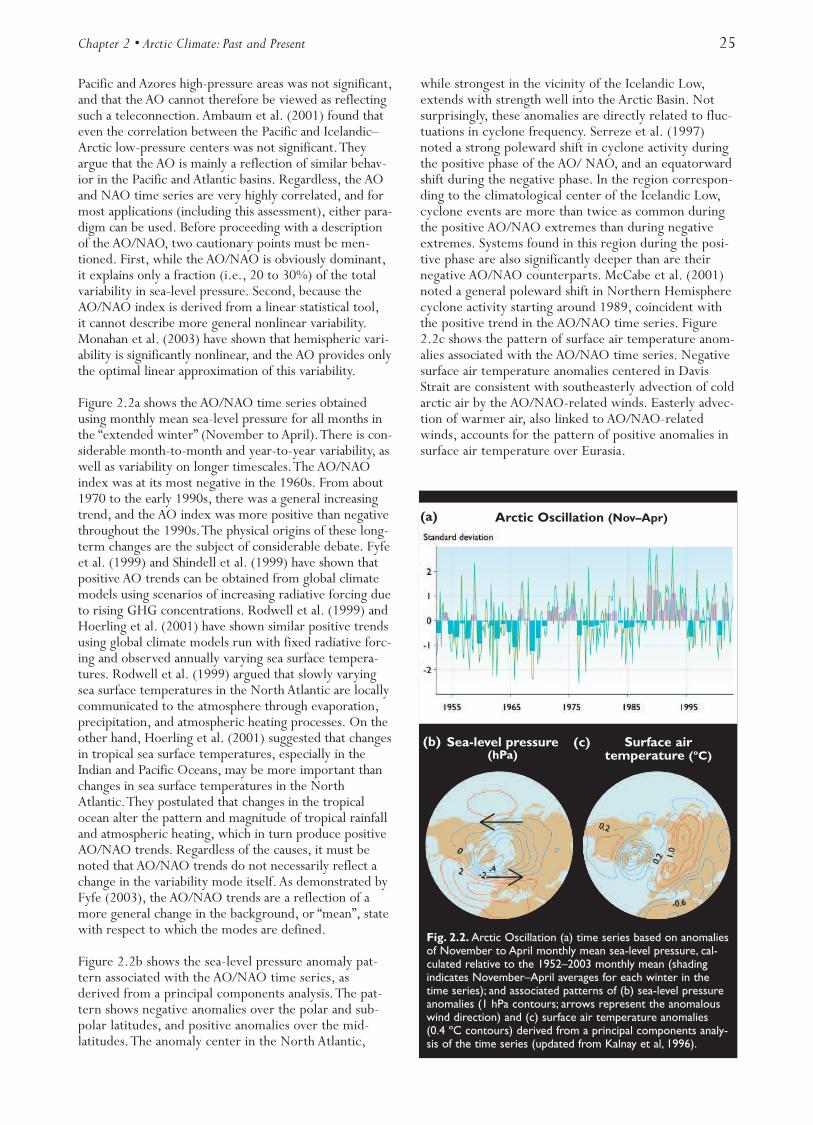
Figure 2.2a shows the AO/NAO time series obtainedusing monthly mean sea-level pressure for all months inthe “extended winter” (November to April).There is con-siderable month-to-month and year-to-year variability, aswell as variability on longer timescales.The AO/NAOindex was at its most negative in the 1960s. From about1970 to the early 1990s, there was a general increasingtrend, and the AO index was more positive than negativethroughout the 1990s.The physical origins of these long-term changes are the subject of considerable debate. Fyfeet al. (1999) and Shindell et al. (1999) have shown thatpositive AO trends can be obtained from global climatemodels using scenarios of increasing radiative forcing dueto rising GHG concentrations. Rodwell et al. (1999) andHoerling et al. (2001) have shown similar positive trendsusing global climate models run with fixed radiative forc-ing and observed annually varying sea surface tempera-tures. Rodwell et al. (1999) argued that slowly varyingsea surface temperatures in the North Atlantic are locallycommunicated to the atmosphere through evaporation,precipitation, and atmospheric heating processes. On theother hand, Hoerling et al. (2001) suggested that changesin tropical sea surface temperatures, especially in theIndian and Pacific Oceans, may be more important thanchanges in sea surface temperatures in the NorthAtlantic.They postulated that changes in the tropicalocean alter the pattern and magnitude of tropical rainfalland atmospheric heating, which in turn produce positiveAO/NAO trends. Regardless of the causes, it must benoted that AO/NAO trends do not necessarily reflect achange in the variability mode itself. As demonstrated byFyfe (2003), the AO/NAO trends are a reflection of amore general change in the background, or “mean”, statewith respect to which the modes are defined.
Figure 2.2b shows the sea-level pressure anomaly pat-tern associated with the AO/NAO time series, asderived from a principal components analysis.The pat-tern shows negative anomalies over the polar and sub-polar latitudes, and positive anomalies over the mid-latitudes.The anomaly center in the North Atlantic,
while strongest in the vicinity of the Icelandic Low,extends with strength well into the Arctic Basin. Notsurprisingly, these anomalies are directly related to fluc-tuations in cyclone frequency. Serreze et al. (1997)noted a strong poleward shift in cyclone activity duringthe positive phase of the AO/ NAO, and an equatorwardshift during the negative phase. In the region correspon-ding to the climatological center of the Icelandic Low,cyclone events are more than twice as common duringthe positive AO/NAO extremes than during negativeextremes. Systems found in this region during the posi-tive phase are also significantly deeper than are theirnegative AO/NAO counterparts. McCabe et al. (2001)noted a general poleward shift in Northern Hemispherecyclone activity starting around 1989, coincident withthe positive trend in the AO/NAO time series. Figure2.2c shows the pattern of surface air temperature anom-alies associated with the AO/NAO time series. Negativesurface air temperature anomalies centered in DavisStrait are consistent with southeasterly advection of coldarctic air by the AO/NAO-related winds. Easterly advec-tion of warmer air, also linked to AO/NAO-relatedwinds, accounts for the pattern of positive anomalies insurface air temperature over Eurasia.
Arctic Oscillation (Nov–Apr)(a)
Sea-level pressure(hPa)
Surface air temperature (ºC)
(b) (c)
Fig. 2.2. Arctic Oscillation (a) time series based on anomaliesof November to April monthly mean sea-level pressure, cal-culated relative to the 1952–2003 monthly mean (shadingindicates November–April averages for each winter in thetime series); and associated patterns of (b) sea-level pressureanomalies (1 hPa contours; arrows represent the anomalouswind direction) and (c) surface air temperature anomalies(0.4 ºC contours) derived from a principal components analy-sis of the time series (updated from Kalnay et al, 1996).
26 Arctic Climate Impact Assessment
2.2.2.2. Pacific Decadal Oscillation
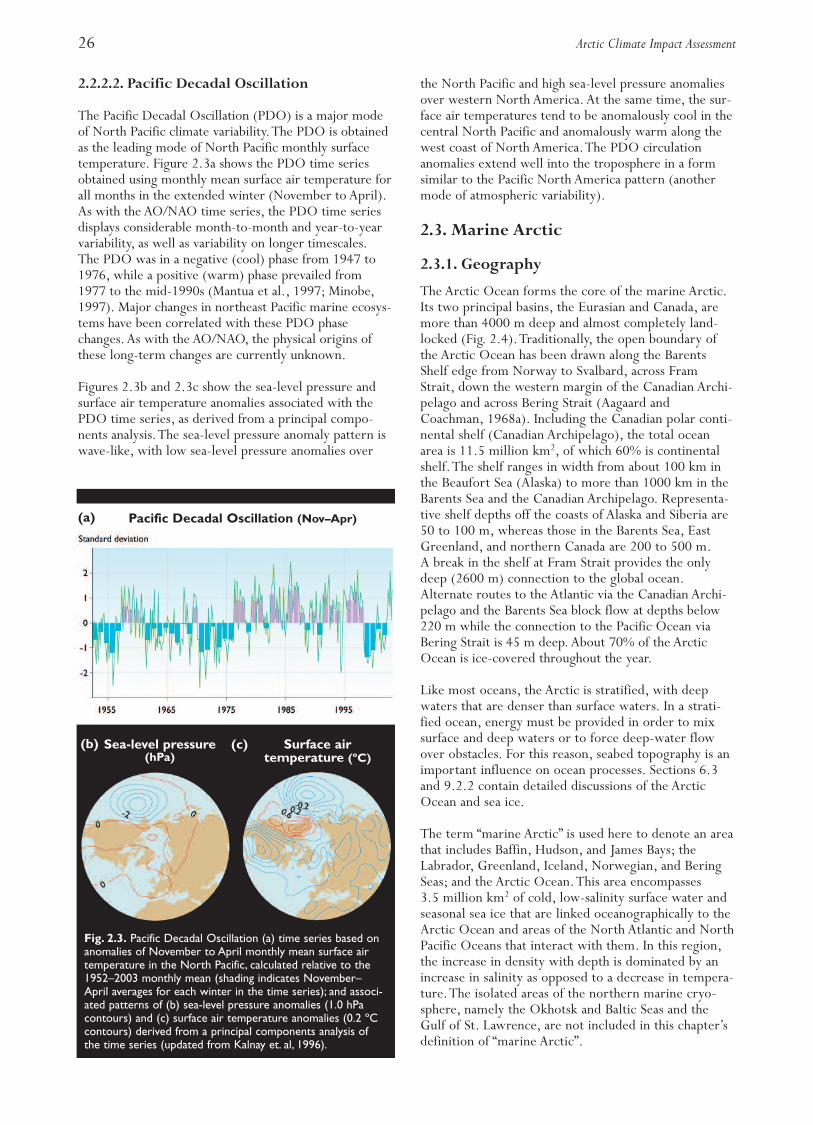
The Pacific Decadal Oscillation (PDO) is a major modeof North Pacific climate variability.The PDO is obtainedas the leading mode of North Pacific monthly surfacetemperature. Figure 2.3a shows the PDO time seriesobtained using monthly mean surface air temperature forall months in the extended winter (November to April).As with the AO/NAO time series, the PDO time seriesdisplays considerable month-to-month and year-to-yearvariability, as well as variability on longer timescales.The PDO was in a negative (cool) phase from 1947 to1976, while a positive (warm) phase prevailed from1977 to the mid-1990s (Mantua et al., 1997; Minobe,1997). Major changes in northeast Pacific marine ecosys-tems have been correlated with these PDO phasechanges. As with the AO/NAO, the physical origins ofthese long-term changes are currently unknown.
Figures 2.3b and 2.3c show the sea-level pressure andsurface air temperature anomalies associated with thePDO time series, as derived from a principal compo-nents analysis.The sea-level pressure anomaly pattern iswave-like, with low sea-level pressure anomalies over
the North Pacific and high sea-level pressure anomaliesover western North America. At the same time, the sur-face air temperatures tend to be anomalously cool in thecentral North Pacific and anomalously warm along thewest coast of North America.The PDO circulationanomalies extend well into the troposphere in a formsimilar to the Pacific North America pattern (anothermode of atmospheric variability).
2.3. Marine Arctic
2.3.1. Geography
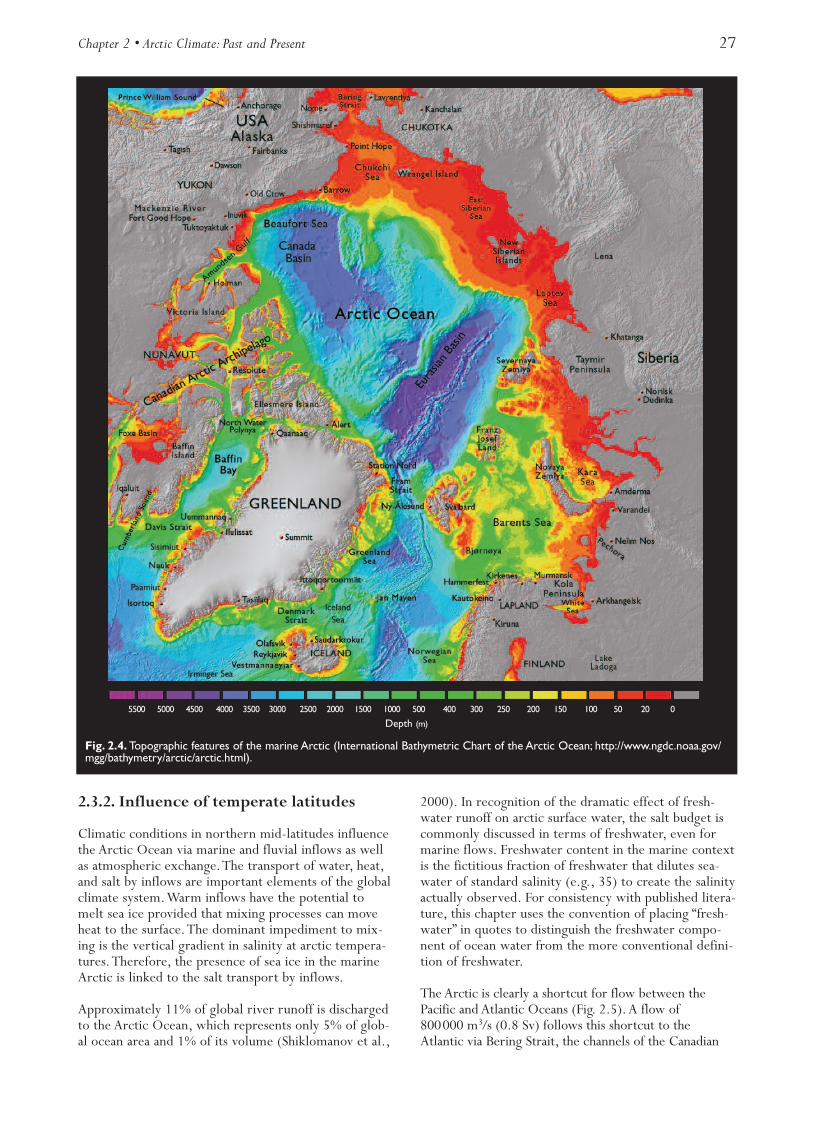
The Arctic Ocean forms the core of the marine Arctic.Its two principal basins, the Eurasian and Canada, aremore than 4000 m deep and almost completely land-locked (Fig. 2.4).Traditionally, the open boundary ofthe Arctic Ocean has been drawn along the BarentsShelf edge from Norway to Svalbard, across FramStrait, down the western margin of the Canadian Archi-pelago and across Bering Strait (Aagaard andCoachman, 1968a). Including the Canadian polar conti-nental shelf (Canadian Archipelago), the total oceanarea is 11.5 million km2, of which 60% is continentalshelf.The shelf ranges in width from about 100 km inthe Beaufort Sea (Alaska) to more than 1000 km in theBarents Sea and the Canadian Archipelago. Representa-tive shelf depths off the coasts of Alaska and Siberia are50 to 100 m, whereas those in the Barents Sea, EastGreenland, and northern Canada are 200 to 500 m.A break in the shelf at Fram Strait provides the onlydeep (2600 m) connection to the global ocean.Alternate routes to the Atlantic via the Canadian Archi-pelago and the Barents Sea block flow at depths below220 m while the connection to the Pacific Ocean viaBering Strait is 45 m deep. About 70% of the ArcticOcean is ice-covered throughout the year.
Like most oceans, the Arctic is stratified, with deepwaters that are denser than surface waters. In a strati-fied ocean, energy must be provided in order to mixsurface and deep waters or to force deep-water flowover obstacles. For this reason, seabed topography is animportant influence on ocean processes. Sections 6.3and 9.2.2 contain detailed discussions of the ArcticOcean and sea ice.
The term “marine Arctic” is used here to denote an areathat includes Baffin, Hudson, and James Bays; theLabrador, Greenland, Iceland, Norwegian, and BeringSeas; and the Arctic Ocean.This area encompasses3.5 million km2 of cold, low-salinity surface water andseasonal sea ice that are linked oceanographically to theArctic Ocean and areas of the North Atlantic and NorthPacific Oceans that interact with them. In this region,the increase in density with depth is dominated by anincrease in salinity as opposed to a decrease in tempera-ture.The isolated areas of the northern marine cryo-sphere, namely the Okhotsk and Baltic Seas and theGulf of St. Lawrence, are not included in this chapter’sdefinition of “marine Arctic”.
Pacific Decadal Oscillation (Nov–Apr)(a)
Sea-level pressure (hPa)
Surface air temperature (ºC)
(b) (c)
Fig. 2.3. Pacific Decadal Oscillation (a) time series based onanomalies of November to April monthly mean surface airtemperature in the North Pacific, calculated relative to the1952–2003 monthly mean (shading indicates November–April averages for each winter in the time series); and associ-ated patterns of (b) sea-level pressure anomalies (1.0 hPacontours) and (c) surface air temperature anomalies (0.2 ºCcontours) derived from a principal components analysis ofthe time series (updated from Kalnay et. al, 1996).
Chapter 2 • Arctic Climate: Past and Present 27
2.3.2. Influence of temperate latitudes
Climatic conditions in northern mid-latitudes influencethe Arctic Ocean via marine and fluvial inflows as wellas atmospheric exchange.The transport of water, heat,and salt by inflows are important elements of the globalclimate system.Warm inflows have the potential tomelt sea ice provided that mixing processes can moveheat to the surface.The dominant impediment to mix-ing is the vertical gradient in salinity at arctic tempera-tures.Therefore, the presence of sea ice in the marineArctic is linked to the salt transport by inflows.
Approximately 11% of global river runoff is dischargedto the Arctic Ocean, which represents only 5% of glob-al ocean area and 1% of its volume (Shiklomanov et al.,
2000). In recognition of the dramatic effect of fresh-water runoff on arctic surface water, the salt budget iscommonly discussed in terms of freshwater, even formarine flows. Freshwater content in the marine contextis the fictitious fraction of freshwater that dilutes sea-water of standard salinity (e.g., 35) to create the salinityactually observed. For consistency with published litera-ture, this chapter uses the convention of placing “fresh-water” in quotes to distinguish the freshwater compo-nent of ocean water from the more conventional defini-tion of freshwater.
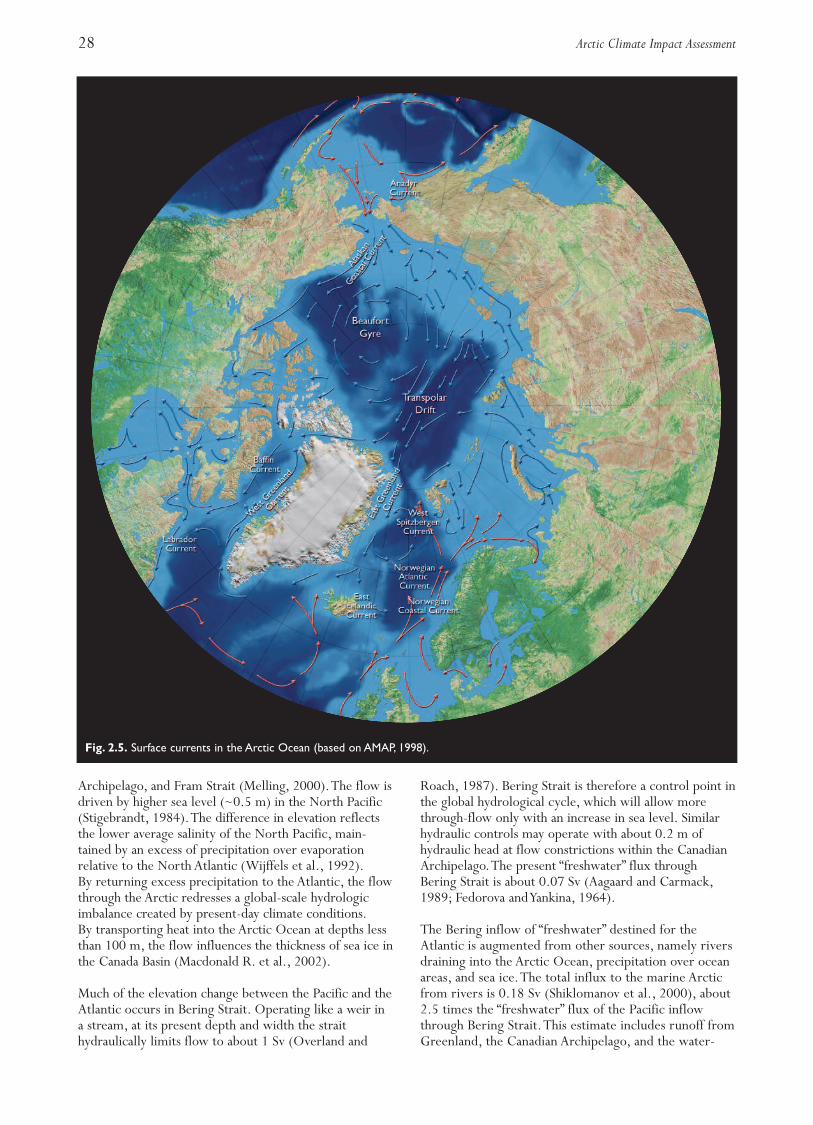
The Arctic is clearly a shortcut for flow between thePacific and Atlantic Oceans (Fig. 2.5). A flow of800000 m3/s (0.8 Sv) follows this shortcut to theAtlantic via Bering Strait, the channels of the Canadian
5500 5000 4500 4000 3500 3000 2500 2000 1500 1000 500 400 300 250 200 150 100 50 20 0
Depth (m)
Fig. 2.4. Topographic features of the marine Arctic (International Bathymetric Chart of the Arctic Ocean; http://www.ngdc.noaa.gov/mgg/bathymetry/arctic/arctic.html).
28 Arctic Climate Impact Assessment
Archipelago, and Fram Strait (Melling, 2000).The flow isdriven by higher sea level (~0.5 m) in the North Pacific(Stigebrandt, 1984).The difference in elevation reflectsthe lower average salinity of the North Pacific, main-tained by an excess of precipitation over evaporationrelative to the North Atlantic (Wijffels et al., 1992).By returning excess precipitation to the Atlantic, the flowthrough the Arctic redresses a global-scale hydrologicimbalance created by present-day climate conditions.By transporting heat into the Arctic Ocean at depths lessthan 100 m, the flow influences the thickness of sea ice inthe Canada Basin (Macdonald R. et al., 2002).
Much of the elevation change between the Pacific and theAtlantic occurs in Bering Strait. Operating like a weir ina stream, at its present depth and width the straithydraulically limits flow to about 1 Sv (Overland and
Roach, 1987). Bering Strait is therefore a control point inthe global hydrological cycle, which will allow morethrough-flow only with an increase in sea level. Similarhydraulic controls may operate with about 0.2 m ofhydraulic head at flow constrictions within the CanadianArchipelago.The present “freshwater” flux throughBering Strait is about 0.07 Sv (Aagaard and Carmack,1989; Fedorova and Yankina, 1964).
The Bering inflow of “freshwater” destined for theAtlantic is augmented from other sources, namely riversdraining into the Arctic Ocean, precipitation over oceanareas, and sea ice.The total influx to the marine Arcticfrom rivers is 0.18 Sv (Shiklomanov et al., 2000), about2.5 times the “freshwater” flux of the Pacific inflowthrough Bering Strait.This estimate includes runoff fromGreenland, the Canadian Archipelago, and the water-
Fig. 2.5. Surface currents in the Arctic Ocean (based on AMAP, 1998).
Chapter 2 • Arctic Climate: Past and Present 29
sheds of the Yukon River (carried through Bering Straitby the Alaskan Coastal Current), Hudson Bay, and JamesBay.The average annual precipitation minus evaporationnorth of 60º N is 0.16 m/yr (Barry and Serreze, 2000),corresponding to a freshwater flux of 0.049 Sv overmarine areas.The combined rate of freshwater supply tothe marine Arctic is 0.3 Sv.
Sea ice has a high “freshwater” content, since it loses80% of its salt upon freezing and all but about 3%through subsequent thermal weathering. Although about10% of sea-ice area is exported annually from the ArcticOcean through Fram Strait, this is not a “freshwater”export from the marine Arctic, since the boundary isdefined as the edge of sea ice at its maximum extent.
Freezing segregates the upper ocean into brackish sur-face (ice) and salty deeper components that circulatedifferently within the marine Arctic.The melting of seaice delivers freshwater to the surface of the ocean nearthe boundary of the marine Arctic.The flux of sea icesouthward through Fram Strait is known to be about0.09 Sv (Vinje, 2001), but the southward flux of sea-sonal sea ice formed outside the Arctic Ocean in theBarents, Bering, and Labrador Seas; the CanadianArchipelago; Hudson and Baffin Bays; and East Green-land is not known.
The inflows to the marine Arctic maintain a large reser-voir of “freshwater” (i.e., diluted seawater and brackishsea ice). Aagaard and Carmack (1989) estimated thevolume of “freshwater” stored within the Arctic Oceanto be 80000 km3. A rough estimate suggests that thereis an additional reservoir of approximately 50000 km3
in the marginal seas described in the previous para-graph.The total reservoir of “freshwater” equals theaccumulation of inflow over about 15 years.
The “freshwater” reservoir feeds two boundary currentsthat flow into the western North Atlantic – the EastGreenland Current and the Labrador Current (Aagaardand Coachman, 1968a,b).The former enters the Green-land Sea via Fram Strait and the latter enters the Labra-dor Sea via Davis Strait, gathering a contribution fromHudson Bay via Hudson Strait.
Northbound streams of warm saline water, the Norwe-gian Atlantic Current and the West Greenland Current,counter the flow of low-salinity water toward theAtlantic.The Norwegian Atlantic Current branches intothe West Spitzbergen Current and the Barents Seathrough-flow.The former passes through Fram Straitwith a temperature near 3 ºC and follows the continen-tal slope eastward at depths of 200 to 800 m as theFram Strait Branch (Gorshkov, 1980).The latter, cooledto less than 0 ºC and freshened by arctic surface waters,enters the Arctic Ocean at depths of 800 to 1500 m inthe eastern Barents Sea (Schauer et al., 2002).The WestGreenland Current carries 3 ºC seawater to northernBaffin Bay, where it mixes with arctic outflow and joinsthe south-flowing Baffin Current (Melling et al., 2001).
The inflows via the West Spitzbergen Current andBarents Sea through-flow are each about 1 to 2 Sv.The West Greenland Current transports less than0.5 Sv.The associated fluxes of “freshwater” are smallbecause salinity is close to 35. All fluxes vary apprecia-bly from year to year.
The Fram Strait and Barents Sea branches are importantmarine sources of heat and the most significant sourcesof salt for arctic waters subjected to continuous dilu-tion.The heat loss to the atmosphere in the ice-freenortheastern Greenland Sea averages 200 W/m2 (Khrol,1992).The average heat loss from the Arctic Ocean is6 W/m2 of which 2 W/m2 comes from the Atlantic-derived water.The impact of the incoming oceanic heaton sea ice is spatially non-uniform because the upper-ocean stability varies with the distribution of freshwaterstorage and ice cover.
2.3.3. Arctic Ocean
The two branches of Atlantic inflow interleave atdepths of 200 to 2000 m in the Arctic Ocean becauseof their high salinity, which makes them denser thansurface waters despite their higher temperature.They circulate counter-clockwise around the basin innarrow (50 km) streams confined to the continentalslope by the Coriolis Effect.The streams split wherethe slope meets mid-ocean ridges, creating branchesthat circulate counter-clockwise around the sub-basins(Rudels et al., 1994).The delivery of new Atlanticwater to the interior of basins is slow (i.e., decades).
The boundary currents eventually return cooler, fresh-er, denser water to the North Atlantic via Fram Strait(Greenland side) and the Nordic Seas.The circuit timevaries with routing.The role of arctic outflow in deepconvection within the Greenland Sea and in the globalthermohaline circulation is discussed in section 9.2.3.In the present climate, Atlantic-derived waters in theArctic Ocean occur at depths too great to pass throughthe Canadian Archipelago.
Inflow from the North Pacific is less saline and circu-lates at a shallower depth than Atlantic inflow. It spreadsnorth from Bering Strait to dominate the upper oceanof the western Arctic – the Chukchi and Beaufort Seas,Canada Basin, and the Canadian Archipelago. An oceanicfront presently located over the Alpha-MendeleyevRidge in Canada Basin separates the region of Pacificdominance from an “Atlantic domain” in the easternhemisphere. A dramatic shift of this front from theLomonosov Ridge in the early 1990s flooded a widearea of former Pacific dominance with warmer and lessstratified Atlantic water (Carmack et al., 1995).
The interplay of Atlantic and Pacific influence in theArctic Ocean, the inflows of freshwater, and the seasonalcycle of freezing and melting create a layered structurein the Arctic Ocean (Treshnikov, 1959).These layers,from top to bottom, include snow; sea ice; surface sea-

30 Arctic Climate Impact Assessment
water strongly diluted by precipitation, river discharge,and ice melt; warm summer intrusions from ice-freeseas (principally the Bering Sea); cold winter intrusionsfrom freezing seas; cool winter intrusions from ice-freeseas (principally the Barents Sea); warm intrusions of theFram Strait Branch; cool intrusions of the Barents SeaBranch; recently-formed deep waters; and relict deepwaters.The presence and properties of each layer varywith location across the Arctic Ocean.
The cold and cool winter intrusions form the arctic coldhalocline, an approximately isothermal zone whereinsalinity increases with depth.The halocline isolates seaice from warm deeper water because its density gradientinhibits mixing, and its weak temperature gradient mini-mizes the upward flux of heat.The cold halocline is adetermining factor in the existence of year-round sea icein the present climate. Areas of seasonal sea ice eitherlack a cold halocline (e.g., Baffin Bay, Labrador Shelf,Hudson Bay) or experience an intrusion of warm waterin summer that overrides it (e.g., Chukchi Sea, coastalBeaufort Sea, eastern Canadian Archipelago).The stabili-ty of the cold halocline is determined by freshwaterdynamics in the Arctic and its low temperature is main-tained by cooling and ice formation in recurrent coastalpolynyas (Cavalieri and Martin, 1994; Melling, 1993;Melling and Lewis, 1982; Rudels et al., 1996). Polynyasare regions within heavy winter sea ice where the ice isthinner because the oceanic heat flux is locally intense orbecause existing ice is carried away by wind or currents.The locations and effectiveness of these “ice factories”are functions of present-day wind patterns (Winsor andBjörk, 2000).
2.3.4. Sea ice
Sea ice is the defining characteristic of the marine Arctic.It is the primary method through which the Arctic exertsleverage on global climate, by mediating the exchange ofradiation, sensible heat, and momentum between theatmosphere and the ocean (see section 2.5). Changes tosea ice as a unique biological habitat are in the forefrontof climate change impacts in the marine Arctic.
The two primary forms of sea ice are seasonal (or first-year) ice and perennial (or multi-year) ice. Seasonal orfirst-year ice is in its first winter of growth or first sum-mer of melt. Its thickness in level floes ranges from afew tenths of a meter near the southern margin of themarine cryosphere to 2.5 m in the high Arctic at the endof winter. Some first-year ice survives the summer andbecomes multi-year ice.This ice develops its distinctivehummocky appearance through thermal weathering,becoming harder and almost salt-free over several years.In the present climate, old multi-year ice floes withoutridges are about 3 m thick at the end of winter.
The area of sea ice decreases from roughly 15 millionkm2 in March to 7 million km2 in September, as much ofthe first-year ice melts during the summer (Cavalieri etal., 1997).The area of multi-year sea ice, mostly over the
Arctic Ocean basins, the East Siberian Sea, and theCanadian polar shelf, is about 5 million km2 (Johannessenet al., 1999). A transpolar drift carries sea ice from theSiberian shelves to the Barents Sea and Fram Strait.It merges on its eastern side with clockwise circulationof sea ice within Canada Basin. On average, 10% of arcticsea ice exits through Fram Strait each year. Section 6.3provides a full discussion of sea ice in the Arctic Ocean.
Sea ice also leaves the Arctic via the CanadianArchipelago. Joined by seasonal sea ice in Baffin Bay,it drifts south along the Labrador coast to reach New-foundland in March. An ice edge is established in thislocation where the supply of sea ice from the north bal-ances the loss by melt in warm ocean waters. Sea-iceproduction in the source region in winter is enhancedwithin a polynya (the North Water) formed by the per-sistent southward drift of ice. Similar “conveyor belt”sea-ice regimes also exist in the Barents and BeringSeas, where northern regions of growth export ice totemperate waters.
First-year floes fracture easily under the forces gener-ated by storm winds. Leads form where ice floes sepa-rate under tension, exposing new ocean surface torapid freezing.Where the pack is compressed, the floesbuckle and break into blocks that pile into ridges up to30 m thick. Near open water, notably in the Labrador,Greenland, and Barents Seas, waves are an additionalcause of ridging. Because of ridging and rafting, theaverage thickness of first-year sea ice is typically twicethat achievable by freezing processes alone (Mellingand Riedel, 1996). Heavily deformed multi-year floesnear the Canadian Archipelago can average more than10 m thick.
Information on the thickness of northern sea ice isscarce.Weekly records of land-fast ice thicknessobtained from drilling are available for coastal locationsaround the Arctic (Canada and Russia) for the 1940sthrough the present (Melling, 2002; Polyakov et al.,2003a).Within the Arctic Ocean, there have been occa-sional surveys of sea ice since 1958, measured withsonar on nuclear submarines (Rothrock et al., 1999;Wadhams, 1997;Winsor, 2001). In Fram Strait and theBeaufort Sea, data have been acquired continuouslysince 1990 from sonar operated from moorings(Melling, 1993; Melling and Moore, 1995; Melling andRiedel, 1996;Vinje et al., 1998).The average thicknessof sea ice in the Arctic Ocean is about 3 m, and thethickest ice (about 6 m) is found along the shores ofnorthern Canada and Greenland (Bourke and Garrett,1987).There is little information about the thickness ofthe seasonal sea ice that covers more than half themarine Arctic.
Land-fast ice (or fast ice) is immobilized for up to 10months each year by coastal geometry or by groundedice ridges (stamukhi).There are a few hundred meters ofland-fast ice along all arctic coastlines in winter. In thepresent climate, ice ridges ground to form stamukhi in
Chapter 2 • Arctic Climate: Past and Present 31
depths of up to 30 m, as the pack ice is repeatedlycrushed against the fast ice by storm winds. In manyareas, stamukhi stabilize sea ice for tens of kilometersfrom shore.Within the Canadian Archipelago in latewinter, land-fast ice bridges channels up to 200 km wideand covers an area of 1 million km2. Some of this ice istrapped for decades as multi-year land-fast ice (Reimnitzet al., 1995).The remobilization of land-fast ice in sum-mer is poorly understood. Deterioration through melt-ing, flooding by runoff at the coast, winds, and tides arecontributing factors.
Many potential impacts of climate change will be medi-ated through land-fast ice. It protects unstable coastlinesand coastal communities from wave damage, floodingby surges, and ice ride-up. It offers safe, fast routes fortravel and hunting. It creates unique and necessary habi-tat for northern species (e.g., ringed seal (Phoca hispida)birth lairs) and brackish under-ice migration corridorsfor fish. It blocks channels, facilitating the formation ofpolynyas important to northern ecosystems in someareas, and impeding navigation in others (e.g., theNorthwest Passage).
2.4. Terrestrial water balance
The terrestrial water balance and hydrologic processesin the Arctic have received increasing attention, as it hasbeen realized that changes in these processes will haveimplications for global climate.There are large uncer-tainties concerning the water balance of tundra owing toa combination of:
• the sparse network of in situ measurements of pre-cipitation and the virtual absence of measurementsof evapotranspiration in the Arctic;
• the difficulty of obtaining accurate measurementsof solid precipitation in cold windy environments,even at manned weather stations;
• the compounding effects of elevation on precipita-tion and evapotranspiration in topographicallycomplex regions of the Arctic, where the distribu-tion of observing stations is biased toward lowelevations and coastal regions; and
• slow progress in exploiting remote sensing tech-niques for measuring high-latitude precipitationand evapotranspiration.
Uncertainties concerning the present-day distributionsof precipitation and evapotranspiration are sufficientlylarge that evaluations of recent variations and trends areproblematic.The water budgets of arctic watershedsreflect the extreme environment. Summer precipitationplays a minor role in the water balance compared towinter snow, since in summer heavy rains cannot beabsorbed by soils that are near saturation. In arcticwatersheds, precipitation exceeds evapotranspiration,and snowmelt is the dominant hydrologic event despiteits short duration. In the boreal forest, water balancedynamics are dominated by spring snowmelt; water isstored in wetlands, and evapotranspiration is also a
major component in the water balance (Metcalfe andButtle, 1999). Xu and Halldin (1997) suggested that theeffects of climate variability and change on streamflowwill depend on the ratio of annual runoff to annual pre-cipitation, with the greatest sensitivity in watershedswith the lowest ratios.
2.4.1. Permanent storage of water on land
The great ice caps and ice sheets of the world hold 75%of the global supply of freshwater; of these, the Green-land Ice Sheet contains 2.85 million km3 of freshwater(IPCC, 2001c).The northern portions of mid-latitudecyclones carry most of the water that reaches arctic icecaps, with the result that precipitation generally decreas-es from south to north. Runoff often exceeds precipita-tion when ice caps retreat.The behavior of glaciersdepends upon climate (see section 6.5).
Temperature and precipitation variations influence thearctic ice caps; for example, temperature increases cou-pled with decreased precipitation move the equilibriumline (boundary between accumulation and ablation)higher, but with increased precipitation, the line moveslower (Woo and Ohmura, 1997). Small shifts in precipi-tation could offset or enhance the effect of increasingtemperatures (Rouse et al., 1997).Water is also storedin permanent snowfields and firn (compact, granularsnow that is over one year old) fields, perched lakes(lakes that are raised above the local water table bypermafrost), and as permafrost itself.Whitfield andCannon (2000) implicated shifts between these types ofstorage as the source of increases in arctic streamflowduring recent warmer periods.The IPCC (2001b) stat-ed: “Satellite data show that there are very likely to havebeen decreases of about 10% in the extent of snowcover since the late 1960s, and ground-based observa-tions show that there is very likely to have been areduction of about two weeks in the annual duration oflake and river ice cover in the mid- and high latitudes ofthe Northern Hemisphere, over the 20th century”.
2.4.2. Hydrology of freshwater in the Arctic
The Arctic has four hydrologic periods: snowmelt; out-flow breakup period (several days in length but account-ing for 75% of total annual flow); a summer period withno ice cover and high evaporation; and a winter periodwhere ice cover thicker than 2 m exists on lakes. Fourtypes of arctic rivers show different sensitivity to climat-ic variations:
• Arctic–nival: continuous permafrost where deepinfiltration is impeded by perennially frozen strata,base flow and winter flow are low, and snowmelt isthe major hydrologic event.
• Subarctic–nival: dominated by spring snowmeltevents, with peak water levels often the product ofbackwater from ice jams. Groundwater contribu-tions are larger than those in arctic–nival systems.In some areas, complete winter freezing occurs.
32 Arctic Climate Impact Assessment
• Proglacial: snowmelt produces a spring peak, butflows continue throughout the summer as areas atprogressively higher elevations melt. Ice-dammedlakes are possible.
• Muskeg: large areas of low relief characterized bypoor drainage. Runoff attenuation is high becauseof large water-holding capacity and flow resistance.
Fens (peatlands) are wetlands that depend upon annualsnowmelt to restore their water table, and summer pre-cipitation is the most important single factor in the waterbalance (Rouse, 1998). Actual evapotranspiration is a lin-ear function of rainfall. If summer rainfall decreases,there would be an increase in the severity and length ofthe water deficit.Water balance has a significant effect onthe carbon budget and peat accumulation; under drierconditions, peatlands would lose biomass, and stream-flows would decrease. Krasovskaia and Saelthun (1997)found that monthly flow regimes in Scandinavia have sta-ble average patterns that are similar from year to year.They demonstrated that most rivers are very sensitive totemperature rises on the order of 1 to 3 ºC, and thatnival (snow-dominated) rivers become less stable whilepluvial (rain-dominated) rivers become more stable.Land storage of snow is important in the formation of thehydrograph in that the distributed nature of the snowacross the land “converts” the daily melt into a singlepeak. Kuchment et al. (2000) modeled snowmelt andrainfall runoff generation for permafrost areas, takinginto account the influence of the depth of thawed groundon water input, water storage, and redistribution.
Where they exist, perennial snow banks are the majorsource of runoff, and as little as 5% of watershed areaoccupied by such snow banks will enhance runoff com-pared to watersheds without them.The resulting streamdischarge is termed “proglacial”, and stored water con-tributes about 50% of the annual runoff. During winter,when biological processes are dormant, the active layerfreezes and thaws. Spring snowmelt guarantees wateravailability about the same time each year, at a timewhen rainfall is minimal but solar radiation is near itsmaximum. Summer hydrology varies from year to yearand depends upon summer precipitation patterns andmagnitudes. Surface organic soils, which remain saturat-ed throughout the year (although the phase changes),are more important hydrologically than deeper mineralsoils. During dry periods, runoff is minimal or ceases.During five years of observations at Imnavait Creek,Alaska, an average of 50 to 66% of the snowpack mois-ture became runoff, 20 to 34% evaporated, and 10 to19% added to soil moisture storage (Kane et al., 1989).All biological activity takes place in the active layerabove the permafrost. Hydraulic conductivity of theorganic soils is 10 to 1000 times greater than silt.Unlike the organic layer, the mineral layer remainssaturated and does not respond to precipitation events.Soil properties vary dramatically over short verticaldistances.The snowmelt period is brief, lasting on theorder of 10 days, and peak flow happens within 36hours of the onset of flow.
Evapotranspiration is similar in magnitude to runoff as aprincipal mechanism of water loss from a watershedunderlain by permafrost.Water balance studies indicatethat cumulative potential evaporation is greater thancumulative summer precipitation.
Snowmelt on south-facing slopes occurred one monthearlier than on north-facing slopes in subarctic water-sheds (Carey and Woo, 1999). On south-facing slopes,the meltwater infiltrated and recharged the soil moisturebut there was neither subsurface flow nor actual runoff.The north-facing slopes had infiltration barriers, thusmeltwater was impounded in the organic layer and pro-duced surface and subsurface flows. Permafrost slopesand organic horizons are the principal controls onstreamflow generation in subarctic catchments. Seppälä(1997) showed that permafrost is confining but notimpermeable. Quinton et al. (2000) found that in tun-dra, subsurface flow occurs predominantly through thesaturated zone within the layer of peat that mantles hillslopes, and that water flow through peat is laminar.
Beltaos (2002) showed that temperature increases overthe past 80 years have increased the frequency of mildwinter days, which has augmented flows to the extentthat they can affect breakup processes.There are severalimplications of this change, including increases in thefrequency of mid-winter breakup events; increasedflooding and ice-jam damages; delayed freeze-up dates;and advanced breakup dates. Prowse and Beltaos (2002)suggested that climate change may alter the frequencyand severity of extreme ice jams, floods, and low flows.These climate-driven changes are projected to have sec-ondary effects on fluvial geomorphology; river modify-ing processes; aquatic ecology; ice-induced flooding thatsupplies water and nutrients to wetlands; biological tem-plates; dissolved oxygen depletion patterns; transporta-tion and hydroelectric generation; and ice-jam damage.
The hydrology and the climate of the Arctic are intricate-ly linked. Changes in temperature and precipitationdirectly and indirectly affect all forms of water on and inthe landscape. If the storage and flux of surface waterchanges, a variety of feedback mechanisms will be affect-ed, but the end result is difficult to project. Snow, ice,and rivers are considered further in Chapters 6 and 8.
2.5. Influence of the Arctic on globalclimate
2.5.1. Marine connections
Although the marine Arctic covers a small fraction of theglobe, positive feedback between the Arctic Ocean andthe climate system has the potential to cause globaleffects.The thermohaline circulation is the global-scaleoverturning in the ocean that transports significant heatvia a poleward flow of warm surface water and an equa-torward return of cold, less saline water at depth.Theoverturning crucial to this transport in the NorthernHemisphere occurs in the Greenland, Irminger, and
Chapter 2 • Arctic Climate: Past and Present 33
Labrador Seas (Broecker et al., 1990).The occurrenceand intensity of overturning is sensitive to the density ofwater at the surface in these convective gyres, which is inturn sensitive to the outflow of low-salinity water fromthe Arctic. An increase in arctic outflow is very likely toreduce the overturning and therefore the oceanic flux ofheat to northern high latitudes.The overturning alsomoderates anthropogenic impacts on climate because itremoves atmospheric CO2 to the deep ocean. A compre-hensive description of the dynamics and consequences ofthe marine connections is given in section 9.2.3.
2.5.1.1. Ice-albedo feedback to warming andcooling
Sea ice is an influential feature of the marine Arctic.It reflects a large fraction of incoming solar radiationand insulates the ocean waters against loss of heat andmoisture during winter. Sea ice also inhibits the move-ment and mixing of the upper ocean in response towind. By stabilizing the upper ocean through melting,it may control the global heat sink at high northern lati-tudes (Manabe et al., 1991; Rind et al., 1995).
The global impact of ice-albedo feedback is predicatedon the existence of a strong relationship between atmo-spheric temperature increases and sea-ice extent.Theseasonal analogue of climate change effects on the marinecryosphere is the dramatic expansion of sea-ice extent inwinter and its retreat in summer, in tune with (at a lag ofseveral months) the seasonal variation in air temperature.Another relevant analogue is the seasonal progressionfrom frequently clear skies over the marine cryosphere inwinter to dominance by fog and stratiform cloud in sum-mer.The increased moisture supply at the melting surfaceof the ice pack promotes the formation of low cloudsthat reflect most of the incoming solar radiation in sum-mer, replacing the weakened reflecting capability ofmelting sea ice.Thus, cloud cover is an important part-ner to sea ice in the albedo feedback mechanism.
2.5.1.2. Freshwater feedback to polewardtransport of heat and freshwater
Deep convection in the northwest Atlantic Ocean is acrucial part of the global thermohaline circulation.Water freshened by arctic outflow is cooled, causing itto sink deep into the ocean, from where it flows eithersouth to the North Atlantic or north into the ArcticBasin (Aagaard and Greisman, 1975; Nikiforov andShpaikher, 1980). Deep convection has considerableinterannual variability controlled by atmospheric circula-tion. It operates to link the stochastic effects of atmo-spheric variability to slow oscillations in the ocean–atmosphere system via the oceanic transports of heatand “freshwater” in the global thermohaline circulation(Broecker, 1997, 2000).
The Greenland Sea is one region where new deep waterforms (Swift and Aagaard, 1981). Here, warm andsaline water of Atlantic origin meets cold arctic water
of lower salinity. Extremely low temperatures causerapid cooling of the sea surface, which may triggereither deep convective mixing or intensified ice forma-tion, depending on the density of waters at the sea sur-face. Convection can reach depths of about 2000 m(Visbeck et al., 1995) and the temperature change inthe water at that depth is an indicator of the intensity ofdeep-water formation, with warmer temperatures indi-cating less deep-water formation. Observations showperiods of deep-water temperature increases in theGreenland Sea in the late 1950s and between 1980 and1990, and temperature decreases in the early 1950s andin the late 1960s. A large increase (0.25 ºC) in deep-water temperature occurred in the 1990s (Alekseev etal., 2001).The decrease in deep-water formationimplied by increasing deep-water temperatures hasweakened the thermohaline circulation, leading to adecreased overflow of deep water through the Faroe-Shetland channel (Hansen et al., 2001).
A reduction in the vertical flux of salt and reduceddeep-water formation is likely to trigger a prolongedweakening of the global thermohaline circulation.With less bottom-water formation, there is likely to bea reduction in upwelling at temperate and subtropicallatitudes. Paleoclimatic shifts in the thermohaline cir-culation have caused large and sometimes abruptchanges in regional climate (section 2.7). Dickson etal. (2002) demonstrated that the flows of dense coldwater over sills in the Faroe–Shetland Channel and inDenmark Strait are the principal means of ventilatingthe deep waters of the North Atlantic. Both the fluxand density structure of “freshwater” outflow to theNorth Atlantic are critical to the arctic influence onglobal climate via the thermohaline circulation(Aagaard and Carmack, 1989).
2.5.2. Sea level
Global average sea level rose between 0.1 and 0.2 mduring the 20th century (IPCC, 2001b), primarilybecause of thermal expansion of warming oceanwaters. Although the thermal expansion coefficient forseawater is small, integrated over the 6000 m depth ofthe ocean the resulting change in sea level can generatechanges of significance to ecosystems and communitiesnear coastlines.The warming of arctic seawater willhave a negligible impact on local sea level because cold(<0 ºC) seawater expands very little with an increasein temperature. However, arctic sea level will respondto changes in the levels of the Atlantic and PacificOceans via dynamic links through Bering Strait, FramStrait, and the Canadian Archipelago. In many areas ofthe Arctic, sea level is also changing very rapidly as aresult of postglacial rebound of the earth’s crust.For example, the land at Churchill, Canada (on thewestern shore of Hudson Bay), rose one meter duringthe 20th century. In many parts of the Arctic, changesin the elevation of the shoreline due to crustal reboundare likely to exceed the rise in sea level resulting fromoceanic warming.
34 Arctic Climate Impact Assessment
The Arctic Ocean stores a large volume of “freshwater”.Arctic sea level is sensitive to “freshwater” storage andwill rise if this inventory increases, or fall if “freshwater”storage declines. Changes in northern hydrology aretherefore likely to have an important effect on arctic sealevel by changing “freshwater” storage in the Arctic.
On a timescale of centuries, and with a sufficientincrease in temperature, accumulation or ablation of ter-restrial ice caps in Greenland and Antarctica are verylikely to be the dominant causes of global changes in sealevel.There is an interesting aspect to sea-level change inthe vicinity of these ice caps: a sea-level increase causedby the ice cap melting, distributed globally, may be offsetby changes in the local gravitational anomaly of the ice,which pulls the sea level up towards it. As a result, it ispossible that sea level could actually drop at locationswithin a few hundred kilometers of Greenland, despitean average increase in sea level worldwide. Sections 6.5and 6.9 provide further details related to ice caps, gla-ciers, and sea-level rise.
2.5.3. Greenhouse gases
Arctic ecosystems are characterized by low levels of pri-mary productivity, low element inputs, and slow ele-ment cycling due to inhibition of these processes by verycold climatic conditions. However, arctic ecosystems stilltend to accumulate organic matter, carbon (C), andother elements because decomposition and mineraliza-tion processes are equally inhibited by the cold, wet soilenvironment (Jonasson et al., 2001). Owing to this slowdecomposition, the total C and element stocks of wetand moist arctic tundra frequently equal or exceedstocks of the same elements in much more productiveecosystems in temperate and tropical latitudes. Methane(CH4) production, for example, is related to the positionof the water table in the active layer, which will beaffected by changes in active-layer depth and/or perma-frost degradation. Natural gas hydrates are also found inthe terrestrial Arctic, although only at depths of severalhundred meters. Currently, arctic and alpine tundra isestimated to contain 96 x 1012 kg of C in its soil andpermafrost.This is roughly 5% of the world’s soil C pool(IPCC, 2001c). An additional 5.7 x 10¹² kg of C isstored in arctic wetland, boreal, and tundra vegetation,for a total of 102 x 1012 kg of terrestrial C (Jonasson etal., 2001).This is fully discussed in section 7.4.2.1.Thawing of permafrost has the potential to release largestores of CO2 and CH4 that are presently contained infrozen arctic soils, both as a direct consequence ofthawing and as an indirect consequence of changes insoil wetness (Anisimov et al., 1997; Fukuda, 1994).Although it is not clear whether the Arctic will be a netsource or sink of C in the future, the large amounts ofC that could be taken up or released make improvedunderstanding of arctic processes important.
The Arctic Ocean was not initially believed to be a sig-nificant sink of C because its sizeable ice cover preventsatmosphere–ocean exchange and biological production
in the central ocean was believed to be small. Underwarmer climate conditions, however, the amount of Cthat the Arctic Ocean can sequester is likely to increasesignificantly. In the northern seas, hydrated CH4 istrapped in solid form at shallow depths in cold sedi-ments. Gas hydrates are likely to decompose and releaseCH4 to the atmosphere if the temperature of water atthe seabed rises by a few degrees (Kennett et al., 2000)over centuries to a millennium.This is discussed furtherin section 9.5.5.
2.6. Arctic climate variability in thetwentieth century
2.6.1. Observing systems and data sources
All arctic countries maintain programs of synopticobservations to support their economic activity and thesustainability of communities in the Arctic. Due to theharsh environment and the sparseness of the observationnetwork, the need for meteorological observations isoften a major (or even the only) reason for the existenceof many arctic settlements. Systematic in situ arcticmeteorological observations started in the late 18th cen-tury in the Atlantic sector (Tabony, 1981). In Fenno-scandia, the oldest systematic climatic observationsnorth of 65º N were made in Tornio, Finland, between1737 and 1749, and regular weather stations were estab-lished around 1850. At Svalbard, the first permanentweather station was established in 1911.The first stationin the Russian north was established at Arkhangelsk in1813. Most of the meteorological network in centraland northern Alaska was established in the 1920s, withthe first station, Kotzebue, opening in 1897.The firstmeteorological observations in southern Alaska (Sitka at57º N) were made in 1828. In northern Canada, system-atic meteorological observations started in the 1940s.
Meteorological observations in the Arctic Ocean beganwith the first research voyage of Fridtjof Nansenonboard Fram (1894–1896). Additional observationswere made during the 1920s and 1930s by shipstrapped in the pack ice. A new phase of Arctic Oceanobservations began in the mid-1930s with the estab-lishment of North Pole ice stations (Arctic ClimatologyProject, 2000).
Economic issues led to a significant reduction in theexisting meteorological network in northern Russiaand Canada in the 1990s.Thus, during the past decade,the number of arctic meteorological stations hasnoticeably decreased, and the number of the stationsconducting atmospheric measurements using balloonshas decreased sharply.
The national meteorological services of the Nordiccountries, Canada, Russia, and the United States main-tain extensive archives of in situ observations fromtheir national networks.The station density in thesenetworks varies substantially, from 2 per 1000 km2 inFennoscandia to 1 per 100000 km2 in Canada north of
Chapter 2 • Arctic Climate: Past and Present 35
60º N, northern Alaska, and (since the 1990s) in north-ern regions of Siberia.
In seeking to assemble a high-quality record, differentlevels of quality assurance, data infilling, and homoge-nization adjustments are required.The Global HistoricalClimatology Network (GHCN) dataset includes selectedquality controlled long-term stations suitable for climatechange studies, while the Global Daily ClimatologyNetwork dataset goes through a more limited screening.The Integrated Surface Hourly Dataset incorporates allsynoptic observations distributed through the GlobalTelecommunication System during the past 30 years.All rawindsonde observations in the Arctic (300 stationsnorth of 50º N and 135 stations north of 60º N) are cur-rently collected in the Comprehensive AerologicalReference Data Set.
The sea-ice boundaries in the Atlantic sector of theArctic Ocean have been documented since the begin-ning of the 20th century. Since the late 1950s, sea-iceobservations have been conducted throughout the year.The development of shipping along the coast of Siberiain the mid-1920s led to sea-ice monitoring in SiberianArctic waters. By the late 1930s, aviation had becomethe main observation tool; since the 1970s, satelliteremote sensing has been used.The notes of seamen andthe logs of fishing, whaling, and sealer vessels operatingin arctic waters serve as an important source of infor-mation about changes in the state of arctic sea icethroughout the 19th and 20th centuries (Vinje, 2001).A significant amount of historical data on sea ice nearthe shores of Iceland was preserved and generalized inmany studies (Ogilvie and Jónsdóttir, 2000). Informa-tion on sea-ice thickness is scarce; observations of icedraft using upward-looking sonar from submarines andstationary systems are the primary source of this infor-mation (see section 2.3.4).
Sea-ice data are concentrated at two World DataCenters. Datasets of satellite observations of sea-ice andsnow-cover extent (Ramsay, 1998), snow water equiva-lent from the Special Sensor Microwave Imager(Armstrong and Brodzik, 2001; Grody and Basist,1996), cloudiness (Rossow and Schiffer, 1999), and theradiation budget (Wielicki et al., 1995) are availablefrom the National Aeronautics and Space Administration(Goddard Institute for Space Studies, Langley Atmo-spheric Sciences Data Center) and the National Oceanicand Atmospheric Administration (National Climatic DataCenter, National Snow and Ice Data Center – NSIDC).A suite of arctic-related datasets is available from theNSIDC (http://nsidc.org/index.html).
Oceanographic measurements in the central Arctic wereinitiated in 1894 by Nansen (1906).They were restartedin the 1930s, interrupted during the Second World War,and resumed in the late 1940s with the help of aviationand drifting stations. Since 1987, icebreakers with con-ductivity, temperature, and depth sondes have been usedto make observations.
The hydrologic network in the Arctic is probably theweakest of the arctic observation networks, which makesinformation about the arctic water budget quite uncer-tain (Vörösmarty et al., 2001). A circumpolar river dis-charge dataset is available online (R-ArcticNET, 2003).
2.6.2. Atmospheric changes
2.6.2.1. Land-surface air temperature
Although several analyses (e.g., Comiso, 2003; Polyakovet al., 2003b) have examined large-scale temperaturevariations in the Arctic, no study has evaluated the spatialand temporal variations in temperature over all landareas in the zone from 60º to 90º N for the entire 20thcentury. Consequently, temperature trends are illustrat-ed for this latitude band using the Climatic ResearchUnit (CRU) database (Jones and Moberg, 2003) and theGHCN database (updated from Peterson and Vose,1997). Both databases were used in the IPCC ThirdAssessment Report (IPCC, 2001c) to summarize thepatterns of temperature change over global land areassince the late 19th century.While the impact of urban-ization on large-scale temperature trends in the Arctichas not been assessed, the results of Jones et al. (1990),Easterling et al. (1997), Peterson et al. (1999), andPeterson (2003) indicate that urbanization effects at theglobal, hemispheric, and even regional scale are small(<0.05 ºC over the period 1900 to 1990).
Figure 2.6 depicts annual land-surface air temperaturevariations in the Arctic (north of 60º N) from 1900 to2003 using the GHCN dataset.The CRU time series isvirtually identical to the GHCN series, and both docu-ment a statistically significant warming trend of0.09 ºC/decade during the period shown (Table 2.1).The arctic trend is greater than the overall NorthernHemisphere trend of 0.06 ºC/decade over the sameperiod (IPCC, 2001b). In general, temperatureincreased from 1900 to the mid-1940s, then decreased
Fig. 2.6. Annual anomalies of land-surface air temperature inthe Arctic (60º to 90º N) for the period 1900 to 2003 using the GHCN dataset (updated from Peterson and Vose, 1997).Anomalies are calculated relative to the 1961–1990 average.The smoothed curve was created using a 21-point binomial filter, which approximates a 10-year running mean.
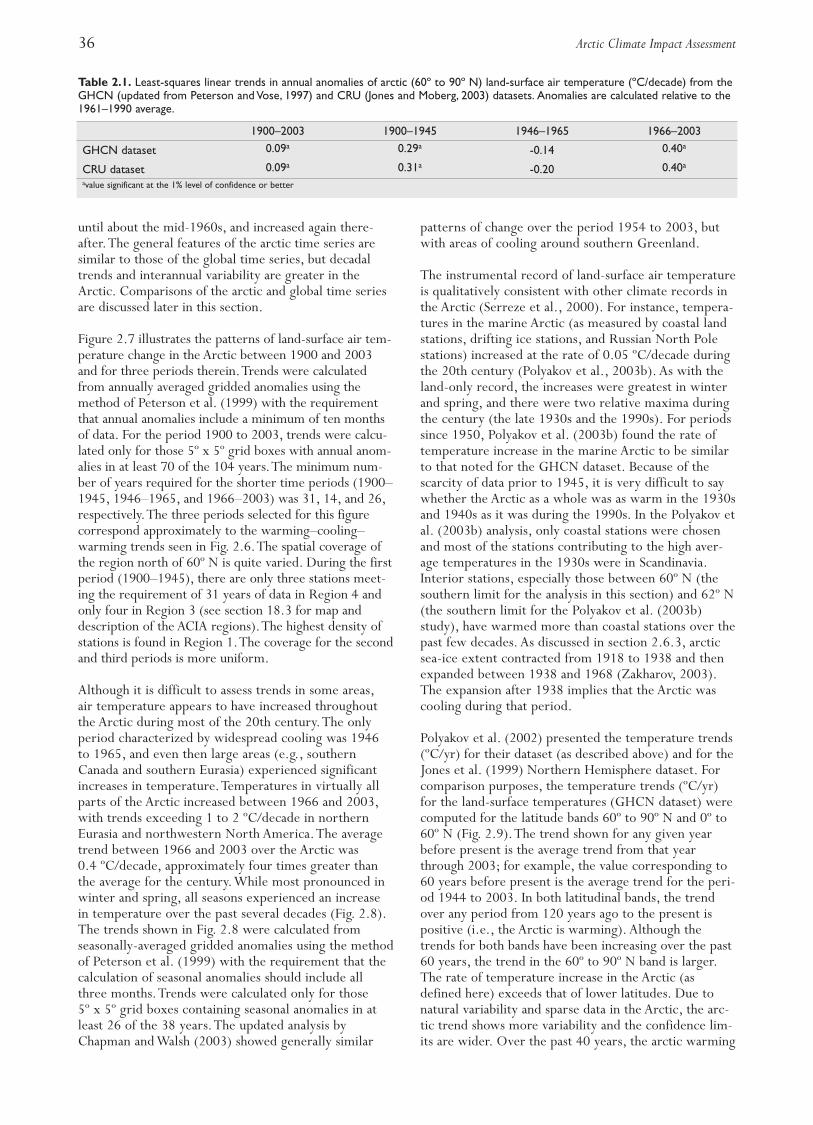
36 Arctic Climate Impact Assessment
until about the mid-1960s, and increased again there-after.The general features of the arctic time series aresimilar to those of the global time series, but decadaltrends and interannual variability are greater in theArctic. Comparisons of the arctic and global time seriesare discussed later in this section.
Figure 2.7 illustrates the patterns of land-surface air tem-perature change in the Arctic between 1900 and 2003and for three periods therein.Trends were calculatedfrom annually averaged gridded anomalies using themethod of Peterson et al. (1999) with the requirementthat annual anomalies include a minimum of ten monthsof data. For the period 1900 to 2003, trends were calcu-lated only for those 5º x 5º grid boxes with annual anom-alies in at least 70 of the 104 years.The minimum num-ber of years required for the shorter time periods (1900–1945, 1946–1965, and 1966–2003) was 31, 14, and 26,respectively.The three periods selected for this figurecorrespond approximately to the warming–cooling–warming trends seen in Fig. 2.6.The spatial coverage ofthe region north of 60º N is quite varied. During the firstperiod (1900–1945), there are only three stations meet-ing the requirement of 31 years of data in Region 4 andonly four in Region 3 (see section 18.3 for map anddescription of the ACIA regions).The highest density ofstations is found in Region 1.The coverage for the secondand third periods is more uniform.
Although it is difficult to assess trends in some areas,air temperature appears to have increased throughoutthe Arctic during most of the 20th century.The onlyperiod characterized by widespread cooling was 1946to 1965, and even then large areas (e.g., southernCanada and southern Eurasia) experienced significantincreases in temperature.Temperatures in virtually allparts of the Arctic increased between 1966 and 2003,with trends exceeding 1 to 2 ºC/decade in northernEurasia and northwestern North America.The averagetrend between 1966 and 2003 over the Arctic was0.4 ºC/decade, approximately four times greater thanthe average for the century.While most pronounced inwinter and spring, all seasons experienced an increasein temperature over the past several decades (Fig. 2.8).The trends shown in Fig. 2.8 were calculated fromseasonally-averaged gridded anomalies using the methodof Peterson et al. (1999) with the requirement that thecalculation of seasonal anomalies should include allthree months.Trends were calculated only for those5º x 5º grid boxes containing seasonal anomalies in atleast 26 of the 38 years.The updated analysis byChapman and Walsh (2003) showed generally similar
patterns of change over the period 1954 to 2003, butwith areas of cooling around southern Greenland.
The instrumental record of land-surface air temperatureis qualitatively consistent with other climate records inthe Arctic (Serreze et al., 2000). For instance, tempera-tures in the marine Arctic (as measured by coastal landstations, drifting ice stations, and Russian North Polestations) increased at the rate of 0.05 ºC/decade duringthe 20th century (Polyakov et al., 2003b). As with theland-only record, the increases were greatest in winterand spring, and there were two relative maxima duringthe century (the late 1930s and the 1990s). For periodssince 1950, Polyakov et al. (2003b) found the rate oftemperature increase in the marine Arctic to be similarto that noted for the GHCN dataset. Because of thescarcity of data prior to 1945, it is very difficult to saywhether the Arctic as a whole was as warm in the 1930sand 1940s as it was during the 1990s. In the Polyakov etal. (2003b) analysis, only coastal stations were chosenand most of the stations contributing to the high aver-age temperatures in the 1930s were in Scandinavia.Interior stations, especially those between 60º N (thesouthern limit for the analysis in this section) and 62º N(the southern limit for the Polyakov et al. (2003b)study), have warmed more than coastal stations over thepast few decades. As discussed in section 2.6.3, arcticsea-ice extent contracted from 1918 to 1938 and thenexpanded between 1938 and 1968 (Zakharov, 2003).The expansion after 1938 implies that the Arctic wascooling during that period.
Polyakov et al. (2002) presented the temperature trends(ºC/yr) for their dataset (as described above) and for theJones et al. (1999) Northern Hemisphere dataset. Forcomparison purposes, the temperature trends (ºC/yr)for the land-surface temperatures (GHCN dataset) werecomputed for the latitude bands 60º to 90º N and 0º to60º N (Fig. 2.9).The trend shown for any given yearbefore present is the average trend from that yearthrough 2003; for example, the value corresponding to60 years before present is the average trend for the peri-od 1944 to 2003. In both latitudinal bands, the trendover any period from 120 years ago to the present ispositive (i.e., the Arctic is warming). Although thetrends for both bands have been increasing over the past60 years, the trend in the 60º to 90º N band is larger.The rate of temperature increase in the Arctic (asdefined here) exceeds that of lower latitudes. Due tonatural variability and sparse data in the Arctic, the arc-tic trend shows more variability and the confidence lim-its are wider. Over the past 40 years, the arctic warming
Table 2.1. Least-squares linear trends in annual anomalies of arctic (60º to 90º N) land-surface air temperature (ºC/decade) from theGHCN (updated from Peterson and Vose, 1997) and CRU (Jones and Moberg, 2003) datasets. Anomalies are calculated relative to the1961–1990 average.
1900–2003 1900–1945 1946–1965 1966–2003
GHCN dataset 0.09a 0.29a -0.14 0.40a
CRU dataset 0.09a 0.31a -0.20 0.40a
avalue significant at the 1% level of confidence or better
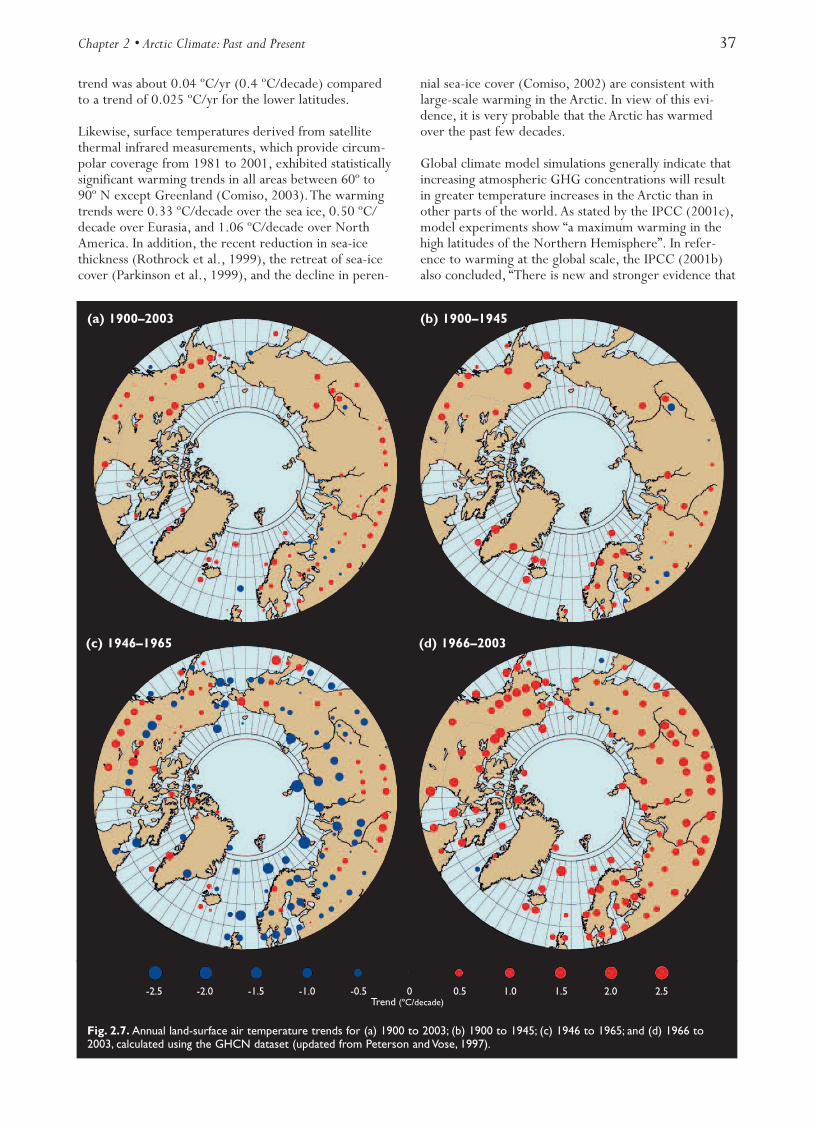
Chapter 2 • Arctic Climate: Past and Present 37
trend was about 0.04 ºC/yr (0.4 ºC/decade) comparedto a trend of 0.025 ºC/yr for the lower latitudes.
Likewise, surface temperatures derived from satellitethermal infrared measurements, which provide circum-polar coverage from 1981 to 2001, exhibited statisticallysignificant warming trends in all areas between 60º to90º N except Greenland (Comiso, 2003).The warmingtrends were 0.33 ºC/decade over the sea ice, 0.50 ºC/decade over Eurasia, and 1.06 ºC/decade over NorthAmerica. In addition, the recent reduction in sea-icethickness (Rothrock et al., 1999), the retreat of sea-icecover (Parkinson et al., 1999), and the decline in peren-
nial sea-ice cover (Comiso, 2002) are consistent withlarge-scale warming in the Arctic. In view of this evi-dence, it is very probable that the Arctic has warmedover the past few decades.
Global climate model simulations generally indicate thatincreasing atmospheric GHG concentrations will resultin greater temperature increases in the Arctic than inother parts of the world. As stated by the IPCC (2001c),model experiments show “a maximum warming in thehigh latitudes of the Northern Hemisphere”. In refer-ence to warming at the global scale, the IPCC (2001b)also concluded, “There is new and stronger evidence that
Fig. 2.7. Annual land-surface air temperature trends for (a) 1900 to 2003; (b) 1900 to 1945; (c) 1946 to 1965; and (d) 1966 to2003, calculated using the GHCN dataset (updated from Peterson and Vose, 1997).
(a) 1900–2003 (b) 1900–1945
(c) 1946–1965 (d) 1966–2003
-2.5 -2.0 -1.5 -1.0 -0.5 0 0.5 1.0 1.5 2.0 2.5Trend (ºC/decade)
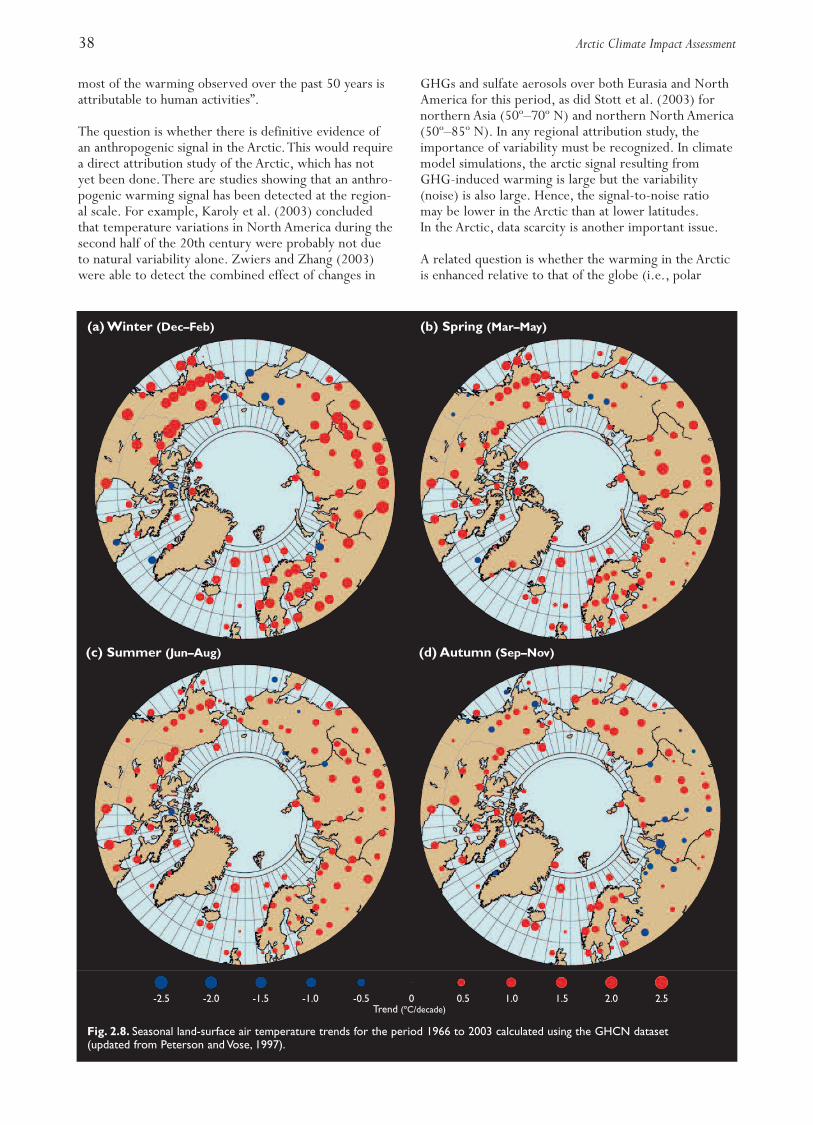
38 Arctic Climate Impact Assessment
most of the warming observed over the past 50 years isattributable to human activities”.
The question is whether there is definitive evidence ofan anthropogenic signal in the Arctic.This would requirea direct attribution study of the Arctic, which has notyet been done.There are studies showing that an anthro-pogenic warming signal has been detected at the region-al scale. For example, Karoly et al. (2003) concludedthat temperature variations in North America during thesecond half of the 20th century were probably not dueto natural variability alone. Zwiers and Zhang (2003)were able to detect the combined effect of changes in
GHGs and sulfate aerosols over both Eurasia and NorthAmerica for this period, as did Stott et al. (2003) fornorthern Asia (50º–70º N) and northern North America(50º–85º N). In any regional attribution study, theimportance of variability must be recognized. In climatemodel simulations, the arctic signal resulting fromGHG-induced warming is large but the variability(noise) is also large. Hence, the signal-to-noise ratiomay be lower in the Arctic than at lower latitudes.In the Arctic, data scarcity is another important issue.
A related question is whether the warming in the Arcticis enhanced relative to that of the globe (i.e., polar
Fig. 2.8. Seasonal land-surface air temperature trends for the period 1966 to 2003 calculated using the GHCN dataset (updated from Peterson and Vose, 1997).
(a) Winter (Dec–Feb) (b) Spring (Mar–May)
(c) Summer (Jun–Aug)
-2.5 -2.0 -1.5 -1.0 -0.5 0 0.5 1.0 1.5 2.0 2.5Trend (ºC/decade)
(d) Autumn (Sep–Nov)
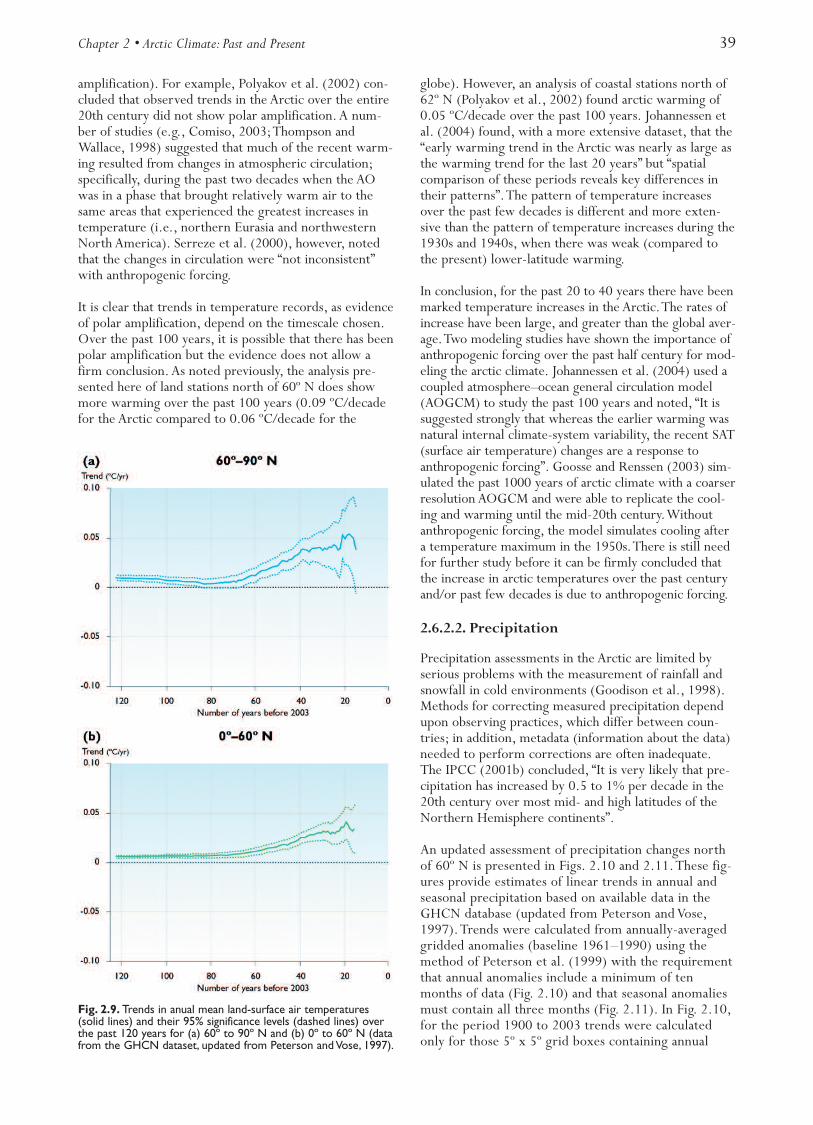
Chapter 2 • Arctic Climate: Past and Present 39
amplification). For example, Polyakov et al. (2002) con-cluded that observed trends in the Arctic over the entire20th century did not show polar amplification. A num-ber of studies (e.g., Comiso, 2003;Thompson andWallace, 1998) suggested that much of the recent warm-ing resulted from changes in atmospheric circulation;specifically, during the past two decades when the AOwas in a phase that brought relatively warm air to thesame areas that experienced the greatest increases intemperature (i.e., northern Eurasia and northwesternNorth America). Serreze et al. (2000), however, notedthat the changes in circulation were “not inconsistent”with anthropogenic forcing.
It is clear that trends in temperature records, as evidenceof polar amplification, depend on the timescale chosen.Over the past 100 years, it is possible that there has beenpolar amplification but the evidence does not allow afirm conclusion. As noted previously, the analysis pre-sented here of land stations north of 60º N does showmore warming over the past 100 years (0.09 ºC/decadefor the Arctic compared to 0.06 ºC/decade for the
globe). However, an analysis of coastal stations north of62º N (Polyakov et al., 2002) found arctic warming of0.05 ºC/decade over the past 100 years. Johannessen etal. (2004) found, with a more extensive dataset, that the“early warming trend in the Arctic was nearly as large asthe warming trend for the last 20 years” but “spatialcomparison of these periods reveals key differences intheir patterns”.The pattern of temperature increasesover the past few decades is different and more exten-sive than the pattern of temperature increases during the1930s and 1940s, when there was weak (compared tothe present) lower-latitude warming.
In conclusion, for the past 20 to 40 years there have beenmarked temperature increases in the Arctic.The rates ofincrease have been large, and greater than the global aver-age.Two modeling studies have shown the importance ofanthropogenic forcing over the past half century for mod-eling the arctic climate. Johannessen et al. (2004) used acoupled atmosphere–ocean general circulation model(AOGCM) to study the past 100 years and noted, “It issuggested strongly that whereas the earlier warming wasnatural internal climate-system variability, the recent SAT(surface air temperature) changes are a response toanthropogenic forcing”. Goosse and Renssen (2003) sim-ulated the past 1000 years of arctic climate with a coarserresolution AOGCM and were able to replicate the cool-ing and warming until the mid-20th century.Withoutanthropogenic forcing, the model simulates cooling aftera temperature maximum in the 1950s.There is still needfor further study before it can be firmly concluded thatthe increase in arctic temperatures over the past centuryand/or past few decades is due to anthropogenic forcing.
2.6.2.2. Precipitation
Precipitation assessments in the Arctic are limited byserious problems with the measurement of rainfall andsnowfall in cold environments (Goodison et al., 1998).Methods for correcting measured precipitation dependupon observing practices, which differ between coun-tries; in addition, metadata (information about the data)needed to perform corrections are often inadequate.The IPCC (2001b) concluded, “It is very likely that pre-cipitation has increased by 0.5 to 1% per decade in the20th century over most mid- and high latitudes of theNorthern Hemisphere continents”.
An updated assessment of precipitation changes northof 60º N is presented in Figs. 2.10 and 2.11.These fig-ures provide estimates of linear trends in annual andseasonal precipitation based on available data in theGHCN database (updated from Peterson and Vose,1997).Trends were calculated from annually-averagedgridded anomalies (baseline 1961–1990) using themethod of Peterson et al. (1999) with the requirementthat annual anomalies include a minimum of tenmonths of data (Fig. 2.10) and that seasonal anomaliesmust contain all three months (Fig. 2.11). In Fig. 2.10,for the period 1900 to 2003 trends were calculatedonly for those 5º x 5º grid boxes containing annual
Fig. 2.9. Trends in anual mean land-surface air temperatures(solid lines) and their 95% significance levels (dashed lines) overthe past 120 years for (a) 60º to 90º N and (b) 0º to 60º N (datafrom the GHCN dataset, updated from Peterson and Vose, 1997).
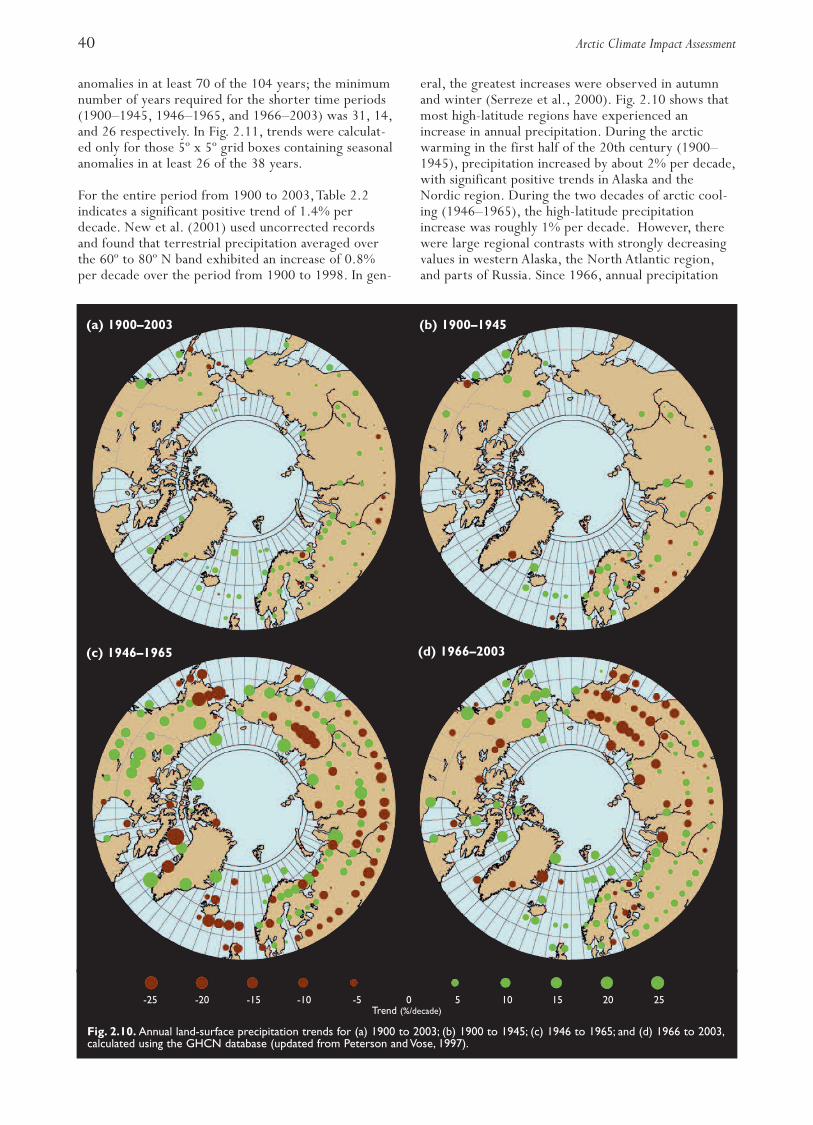
40 Arctic Climate Impact Assessment
anomalies in at least 70 of the 104 years; the minimumnumber of years required for the shorter time periods(1900–1945, 1946–1965, and 1966–2003) was 31, 14,and 26 respectively. In Fig. 2.11, trends were calculat-ed only for those 5º x 5º grid boxes containing seasonalanomalies in at least 26 of the 38 years.
For the entire period from 1900 to 2003,Table 2.2indicates a significant positive trend of 1.4% perdecade. New et al. (2001) used uncorrected recordsand found that terrestrial precipitation averaged overthe 60º to 80º N band exhibited an increase of 0.8%per decade over the period from 1900 to 1998. In gen-
eral, the greatest increases were observed in autumnand winter (Serreze et al., 2000). Fig. 2.10 shows thatmost high-latitude regions have experienced anincrease in annual precipitation. During the arcticwarming in the first half of the 20th century (1900–1945), precipitation increased by about 2% per decade,with significant positive trends in Alaska and theNordic region. During the two decades of arctic cool-ing (1946–1965), the high-latitude precipitationincrease was roughly 1% per decade. However, therewere large regional contrasts with strongly decreasingvalues in western Alaska, the North Atlantic region,and parts of Russia. Since 1966, annual precipitation
Fig. 2.10. Annual land-surface precipitation trends for (a) 1900 to 2003; (b) 1900 to 1945; (c) 1946 to 1965; and (d) 1966 to 2003,calculated using the GHCN database (updated from Peterson and Vose, 1997).
-25 -20 -15 -10 -5 0 5 10 15 20 25Trend (%/decade)
(a) 1900–2003 (b) 1900–1945
(c) 1946–1965 (d) 1966–2003
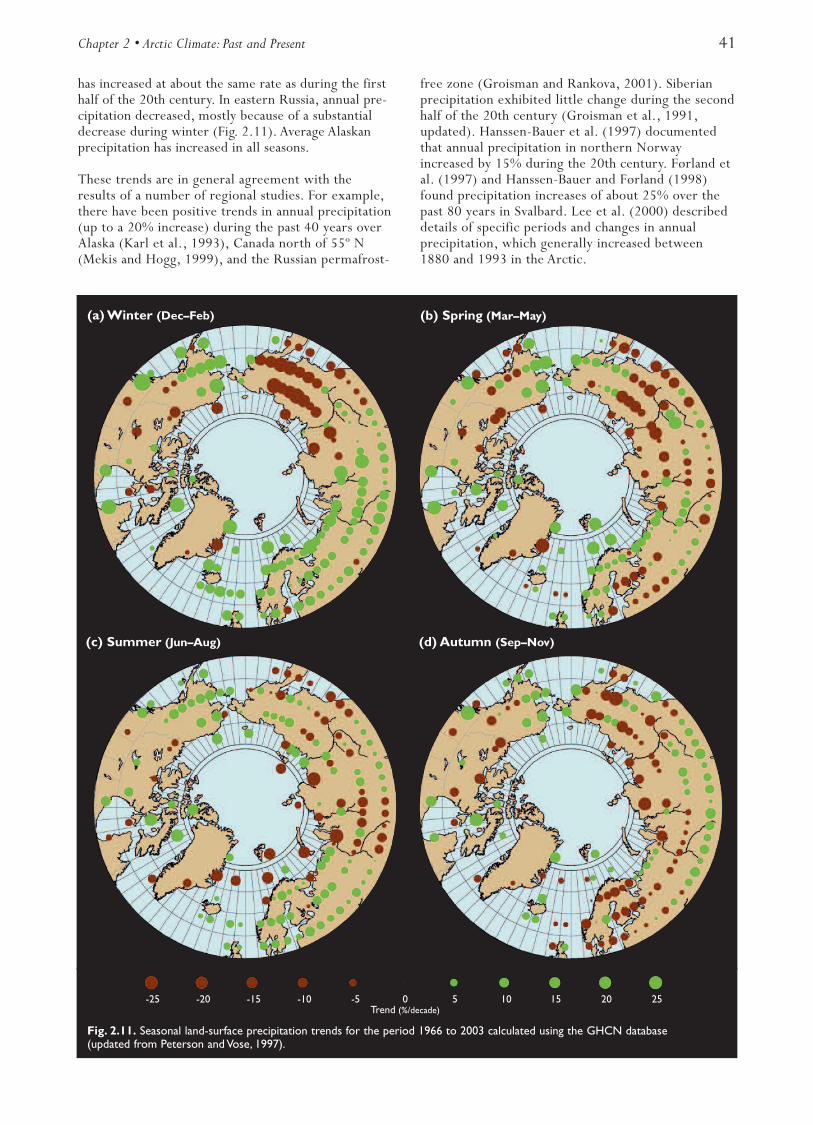
Chapter 2 • Arctic Climate: Past and Present 41
has increased at about the same rate as during the firsthalf of the 20th century. In eastern Russia, annual pre-cipitation decreased, mostly because of a substantialdecrease during winter (Fig. 2.11). Average Alaskanprecipitation has increased in all seasons.
These trends are in general agreement with theresults of a number of regional studies. For example,there have been positive trends in annual precipitation(up to a 20% increase) during the past 40 years overAlaska (Karl et al., 1993), Canada north of 55º N(Mekis and Hogg, 1999), and the Russian permafrost-
free zone (Groisman and Rankova, 2001). Siberianprecipitation exhibited little change during the secondhalf of the 20th century (Groisman et al., 1991,updated). Hanssen-Bauer et al. (1997) documentedthat annual precipitation in northern Norwayincreased by 15% during the 20th century. Førland etal. (1997) and Hanssen-Bauer and Førland (1998)found precipitation increases of about 25% over thepast 80 years in Svalbard. Lee et al. (2000) describeddetails of specific periods and changes in annualprecipitation, which generally increased between1880 and 1993 in the Arctic.
Fig. 2.11. Seasonal land-surface precipitation trends for the period 1966 to 2003 calculated using the GHCN database (updated from Peterson and Vose, 1997).
(a) Winter (Dec–Feb) (b) Spring (Mar–May)
(c) Summer (Jun–Aug) (d) Autumn (Sep–Nov)
-25 -20 -15 -10 -5 0 5 10 15 20 25Trend (%/decade)
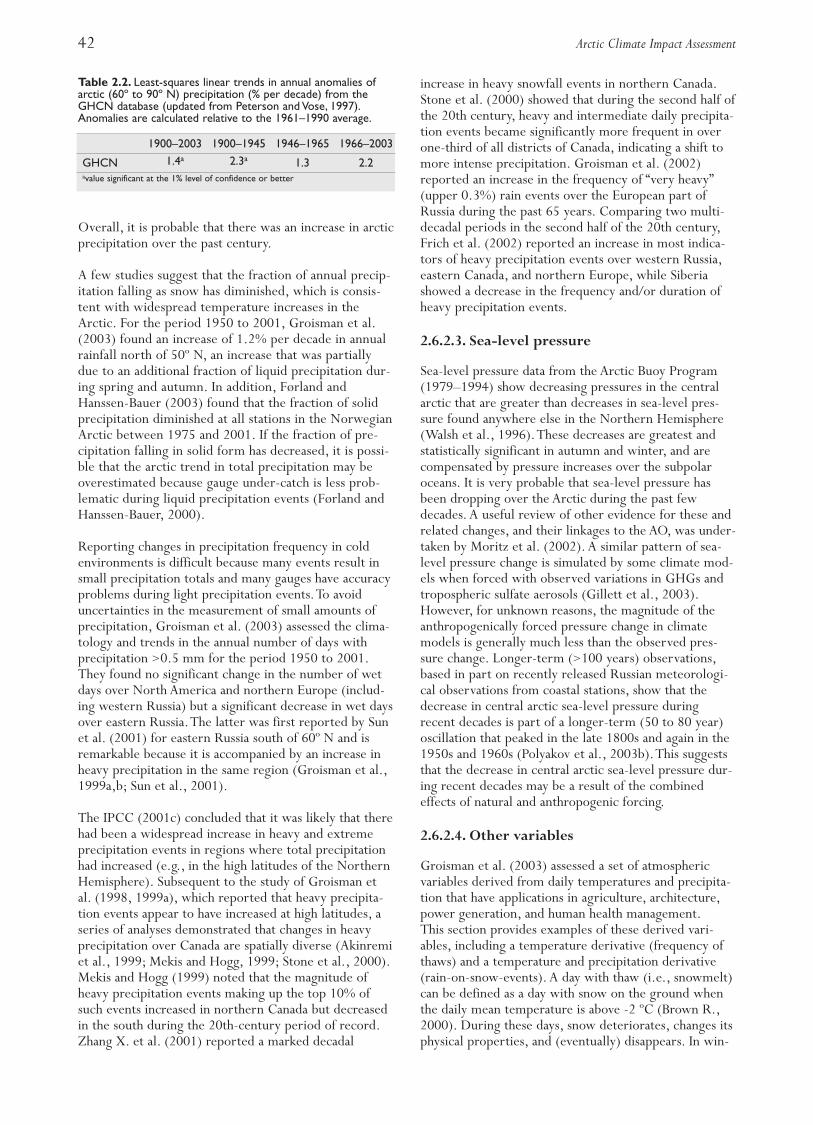
42 Arctic Climate Impact Assessment
Overall, it is probable that there was an increase in arcticprecipitation over the past century.
A few studies suggest that the fraction of annual precip-itation falling as snow has diminished, which is consis-tent with widespread temperature increases in theArctic. For the period 1950 to 2001, Groisman et al.(2003) found an increase of 1.2% per decade in annualrainfall north of 50º N, an increase that was partiallydue to an additional fraction of liquid precipitation dur-ing spring and autumn. In addition, Førland andHanssen-Bauer (2003) found that the fraction of solidprecipitation diminished at all stations in the NorwegianArctic between 1975 and 2001. If the fraction of pre-cipitation falling in solid form has decreased, it is possi-ble that the arctic trend in total precipitation may beoverestimated because gauge under-catch is less prob-lematic during liquid precipitation events (Førland andHanssen-Bauer, 2000).
Reporting changes in precipitation frequency in coldenvironments is difficult because many events result insmall precipitation totals and many gauges have accuracyproblems during light precipitation events.To avoiduncertainties in the measurement of small amounts ofprecipitation, Groisman et al. (2003) assessed the clima-tology and trends in the annual number of days withprecipitation >0.5 mm for the period 1950 to 2001.They found no significant change in the number of wetdays over North America and northern Europe (includ-ing western Russia) but a significant decrease in wet daysover eastern Russia.The latter was first reported by Sunet al. (2001) for eastern Russia south of 60º N and isremarkable because it is accompanied by an increase inheavy precipitation in the same region (Groisman et al.,1999a,b; Sun et al., 2001).
The IPCC (2001c) concluded that it was likely that therehad been a widespread increase in heavy and extremeprecipitation events in regions where total precipitationhad increased (e.g., in the high latitudes of the NorthernHemisphere). Subsequent to the study of Groisman etal. (1998, 1999a), which reported that heavy precipita-tion events appear to have increased at high latitudes, aseries of analyses demonstrated that changes in heavyprecipitation over Canada are spatially diverse (Akinremiet al., 1999; Mekis and Hogg, 1999; Stone et al., 2000).Mekis and Hogg (1999) noted that the magnitude ofheavy precipitation events making up the top 10% ofsuch events increased in northern Canada but decreasedin the south during the 20th-century period of record.Zhang X. et al. (2001) reported a marked decadal
increase in heavy snowfall events in northern Canada.Stone et al. (2000) showed that during the second half ofthe 20th century, heavy and intermediate daily precipita-tion events became significantly more frequent in overone-third of all districts of Canada, indicating a shift tomore intense precipitation. Groisman et al. (2002)reported an increase in the frequency of “very heavy”(upper 0.3%) rain events over the European part ofRussia during the past 65 years. Comparing two multi-decadal periods in the second half of the 20th century,Frich et al. (2002) reported an increase in most indica-tors of heavy precipitation events over western Russia,eastern Canada, and northern Europe, while Siberiashowed a decrease in the frequency and/or duration ofheavy precipitation events.
2.6.2.3. Sea-level pressure
Sea-level pressure data from the Arctic Buoy Program(1979–1994) show decreasing pressures in the centralarctic that are greater than decreases in sea-level pres-sure found anywhere else in the Northern Hemisphere(Walsh et al., 1996).These decreases are greatest andstatistically significant in autumn and winter, and arecompensated by pressure increases over the subpolaroceans. It is very probable that sea-level pressure hasbeen dropping over the Arctic during the past fewdecades. A useful review of other evidence for these andrelated changes, and their linkages to the AO, was under-taken by Moritz et al. (2002). A similar pattern of sea-level pressure change is simulated by some climate mod-els when forced with observed variations in GHGs andtropospheric sulfate aerosols (Gillett et al., 2003).However, for unknown reasons, the magnitude of theanthropogenically forced pressure change in climatemodels is generally much less than the observed pres-sure change. Longer-term (>100 years) observations,based in part on recently released Russian meteorologi-cal observations from coastal stations, show that thedecrease in central arctic sea-level pressure duringrecent decades is part of a longer-term (50 to 80 year)oscillation that peaked in the late 1800s and again in the1950s and 1960s (Polyakov et al., 2003b).This suggeststhat the decrease in central arctic sea-level pressure dur-ing recent decades may be a result of the combinedeffects of natural and anthropogenic forcing.
2.6.2.4. Other variables
Groisman et al. (2003) assessed a set of atmosphericvariables derived from daily temperatures and precipita-tion that have applications in agriculture, architecture,power generation, and human health management.This section provides examples of these derived vari-ables, including a temperature derivative (frequency ofthaws) and a temperature and precipitation derivative(rain-on-snow-events). A day with thaw (i.e., snowmelt)can be defined as a day with snow on the ground whenthe daily mean temperature is above -2 ºC (Brown R.,2000). During these days, snow deteriorates, changes itsphysical properties, and (eventually) disappears. In win-
Table 2.2. Least-squares linear trends in annual anomalies ofarctic (60º to 90º N) precipitation (% per decade) from theGHCN database (updated from Peterson and Vose, 1997).Anomalies are calculated relative to the 1961–1990 average.
1900–2003 1900–1945 1946–1965 1966–2003
GHCN 1.4a 2.3a 1.3 2.2avalue significant at the 1% level of confidence or better
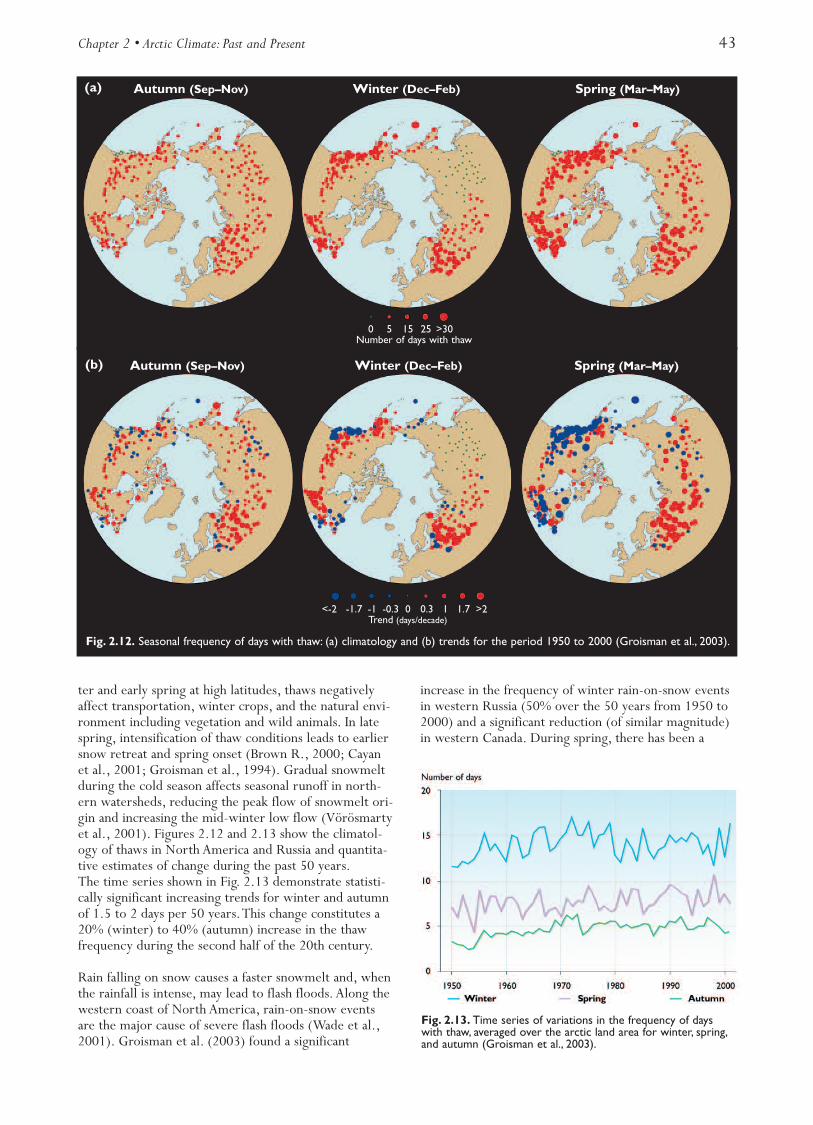
ter and early spring at high latitudes, thaws negativelyaffect transportation, winter crops, and the natural envi-ronment including vegetation and wild animals. In latespring, intensification of thaw conditions leads to earliersnow retreat and spring onset (Brown R., 2000; Cayanet al., 2001; Groisman et al., 1994). Gradual snowmeltduring the cold season affects seasonal runoff in north-ern watersheds, reducing the peak flow of snowmelt ori-gin and increasing the mid-winter low flow (Vörösmartyet al., 2001). Figures 2.12 and 2.13 show the climatol-ogy of thaws in North America and Russia and quantita-tive estimates of change during the past 50 years.The time series shown in Fig. 2.13 demonstrate statisti-cally significant increasing trends for winter and autumnof 1.5 to 2 days per 50 years.This change constitutes a20% (winter) to 40% (autumn) increase in the thawfrequency during the second half of the 20th century.
Rain falling on snow causes a faster snowmelt and, whenthe rainfall is intense, may lead to flash floods. Along thewestern coast of North America, rain-on-snow eventsare the major cause of severe flash floods (Wade et al.,2001). Groisman et al. (2003) found a significant
increase in the frequency of winter rain-on-snow eventsin western Russia (50% over the 50 years from 1950 to2000) and a significant reduction (of similar magnitude)in western Canada. During spring, there has been a
Chapter 2 • Arctic Climate: Past and Present 43
Fig. 2.12. Seasonal frequency of days with thaw: (a) climatology and (b) trends for the period 1950 to 2000 (Groisman et al., 2003).
(a) Autumn (Sep–Nov) Winter (Dec–Feb) Spring (Mar–May)
(b) Autumn (Sep–Nov) Winter (Dec–Feb) Spring (Mar–May)
<-2 -1.7 -1 -0.3 0 0.3 1 1.7 >2Trend (days/decade)
0 5 15 25 >30 Number of days with thaw
Fig. 2.13. Time series of variations in the frequency of dayswith thaw, averaged over the arctic land area for winter, spring,and autumn (Groisman et al., 2003).
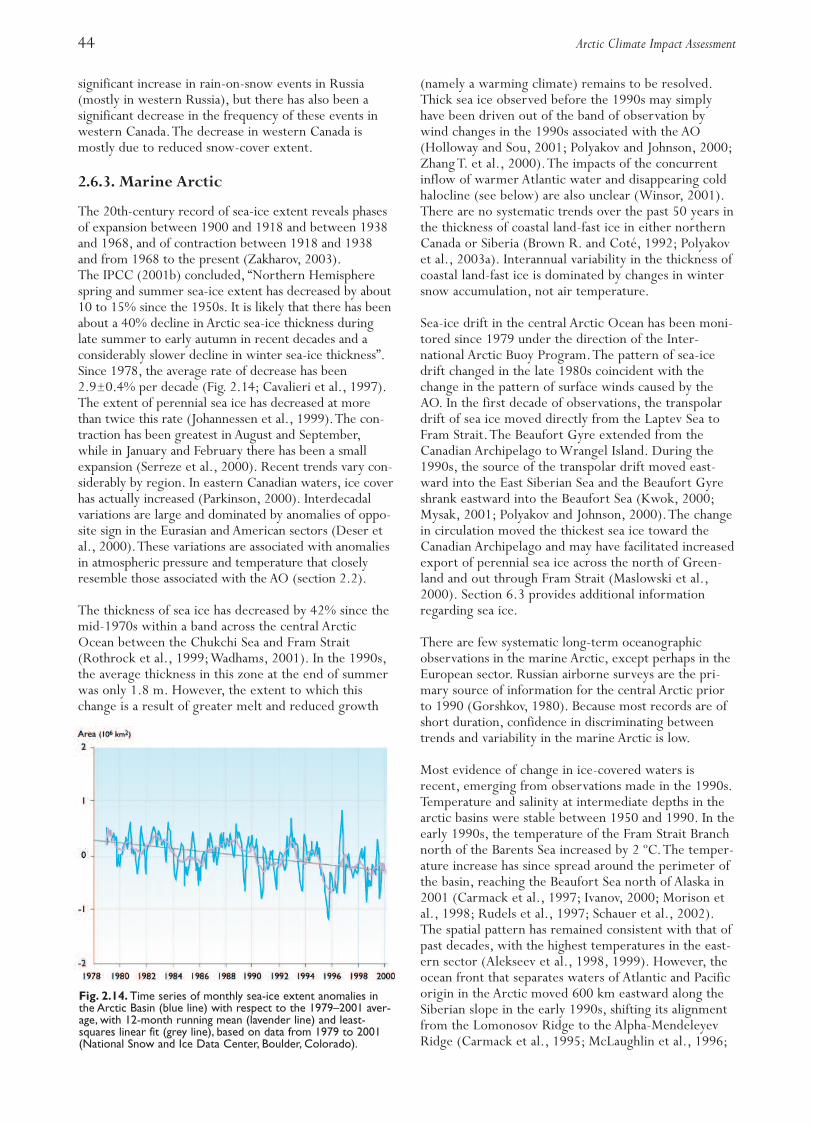
44 Arctic Climate Impact Assessment
significant increase in rain-on-snow events in Russia(mostly in western Russia), but there has also been asignificant decrease in the frequency of these events inwestern Canada.The decrease in western Canada ismostly due to reduced snow-cover extent.
2.6.3. Marine Arctic
The 20th-century record of sea-ice extent reveals phasesof expansion between 1900 and 1918 and between 1938and 1968, and of contraction between 1918 and 1938and from 1968 to the present (Zakharov, 2003).The IPCC (2001b) concluded, “Northern Hemispherespring and summer sea-ice extent has decreased by about10 to 15% since the 1950s. It is likely that there has beenabout a 40% decline in Arctic sea-ice thickness duringlate summer to early autumn in recent decades and aconsiderably slower decline in winter sea-ice thickness”.Since 1978, the average rate of decrease has been2.9±0.4% per decade (Fig. 2.14; Cavalieri et al., 1997).The extent of perennial sea ice has decreased at morethan twice this rate (Johannessen et al., 1999).The con-traction has been greatest in August and September,while in January and February there has been a smallexpansion (Serreze et al., 2000). Recent trends vary con-siderably by region. In eastern Canadian waters, ice coverhas actually increased (Parkinson, 2000). Interdecadalvariations are large and dominated by anomalies of oppo-site sign in the Eurasian and American sectors (Deser etal., 2000).These variations are associated with anomaliesin atmospheric pressure and temperature that closelyresemble those associated with the AO (section 2.2).
The thickness of sea ice has decreased by 42% since themid-1970s within a band across the central ArcticOcean between the Chukchi Sea and Fram Strait(Rothrock et al., 1999;Wadhams, 2001). In the 1990s,the average thickness in this zone at the end of summerwas only 1.8 m. However, the extent to which thischange is a result of greater melt and reduced growth
(namely a warming climate) remains to be resolved.Thick sea ice observed before the 1990s may simplyhave been driven out of the band of observation bywind changes in the 1990s associated with the AO(Holloway and Sou, 2001; Polyakov and Johnson, 2000;Zhang T. et al., 2000).The impacts of the concurrentinflow of warmer Atlantic water and disappearing coldhalocline (see below) are also unclear (Winsor, 2001).There are no systematic trends over the past 50 years inthe thickness of coastal land-fast ice in either northernCanada or Siberia (Brown R. and Coté, 1992; Polyakovet al., 2003a). Interannual variability in the thickness ofcoastal land-fast ice is dominated by changes in wintersnow accumulation, not air temperature.
Sea-ice drift in the central Arctic Ocean has been moni-tored since 1979 under the direction of the Inter-national Arctic Buoy Program.The pattern of sea-icedrift changed in the late 1980s coincident with thechange in the pattern of surface winds caused by theAO. In the first decade of observations, the transpolardrift of sea ice moved directly from the Laptev Sea toFram Strait.The Beaufort Gyre extended from theCanadian Archipelago to Wrangel Island. During the1990s, the source of the transpolar drift moved east-ward into the East Siberian Sea and the Beaufort Gyreshrank eastward into the Beaufort Sea (Kwok, 2000;Mysak, 2001; Polyakov and Johnson, 2000).The changein circulation moved the thickest sea ice toward theCanadian Archipelago and may have facilitated increasedexport of perennial sea ice across the north of Green-land and out through Fram Strait (Maslowski et al.,2000). Section 6.3 provides additional informationregarding sea ice.
There are few systematic long-term oceanographicobservations in the marine Arctic, except perhaps in theEuropean sector. Russian airborne surveys are the pri-mary source of information for the central Arctic priorto 1990 (Gorshkov, 1980). Because most records are ofshort duration, confidence in discriminating betweentrends and variability in the marine Arctic is low.
Most evidence of change in ice-covered waters isrecent, emerging from observations made in the 1990s.Temperature and salinity at intermediate depths in thearctic basins were stable between 1950 and 1990. In theearly 1990s, the temperature of the Fram Strait Branchnorth of the Barents Sea increased by 2 ºC.The temper-ature increase has since spread around the perimeter ofthe basin, reaching the Beaufort Sea north of Alaska in2001 (Carmack et al., 1997; Ivanov, 2000; Morison etal., 1998; Rudels et al., 1997; Schauer et al., 2002).The spatial pattern has remained consistent with that ofpast decades, with the highest temperatures in the east-ern sector (Alekseev et al., 1998, 1999). However, theocean front that separates waters of Atlantic and Pacificorigin in the Arctic moved 600 km eastward along theSiberian slope in the early 1990s, shifting its alignmentfrom the Lomonosov Ridge to the Alpha-MendeleyevRidge (Carmack et al., 1995; McLaughlin et al., 1996;
Fig. 2.14. Time series of monthly sea-ice extent anomalies inthe Arctic Basin (blue line) with respect to the 1979–2001 aver-age, with 12-month running mean (lavender line) and least-squares linear fit (grey line), based on data from 1979 to 2001(National Snow and Ice Data Center, Boulder, Colorado).
Chapter 2 • Arctic Climate: Past and Present 45
Morison et al., 1998).This shift reflects a 20% increasein the volume of Atlantic water within the ArcticOcean.The cold halocline separating sea ice from warmAtlantic water in the Eurasian Basin virtually disap-peared in the 1990s (Steele and Boyd, 1998). In gener-al, the pattern of spreading and the greater thickness ofthe Atlantic layer are consistent with increases in therate of inflow and temperature of Atlantic water enter-ing the Arctic via Fram Strait (Dickson et al., 2000;Grotefendt et al., 1998).
The magnitude and temperature of inflow to the Arcticvia the Barents Sea is highly variable, in response to windchanges associated with the AO (Dickson et al., 2000).Both the inflow and its temperature have increased since1970, mirroring trends observed during the arcticwarming of 1910 to 1930 (Loeng et al., 1997).
The properties of the surface layer of the Arctic Oceanvary greatly by season and from year to year. Russiandata reveal an average 1.3 m decrease in surface (upper50 m) “freshwater” storage in the Arctic Ocean in win-ter between 1974 and 1977 (Alekseev et al., 2000).Surface-layer variability is greatest in the area of season-al sea ice because varying ice conditions strongly modu-late the temperature and salinity of the upper ocean(e.g., Fissel and Melling, 1990). Possible temporaltrends in most peripheral seas of the marine Arcticremain obscured by high variability.
In the decade following 1963 there was an obviousfreshening of the upper waters of the North Atlantic(the Great Salinity Anomaly: Dickson et al., 1988)which is thought to have originated in the Arctic Ocean(e.g., Hakkinen, 1993; Mysak et al., 1990). Unusuallywarm summers from 1957 to 1962 in Baffin Bay andthe Canadian Archipelago may have promoted meltingof land ice and an enhanced freshwater outflow(Alekseev et al., 2000).The Great Salinity Anomaly,first evident north of Iceland (Steffansson, 1969),peaked in the North Atlantic in 1969 (Malmberg andBlindheim, 1994), at the same time that unusually freshand cold water was observed on the other side ofGreenland (Drinkwater, 1994).The simultaneous devel-opment of freshening in both areas indicates paths for“freshwater” transport via both Fram Strait and theCanadian Archipelago. A new freshwater pulse mayappear in the North Atlantic in response to lengtheningof the arctic summer melt period in the 1990s (Belkinet al., 1998). For further discussion of change in theAtlantic sector, refer to section 9.2.4.2.
In the central Greenland Sea, change in the temperatureof water at the 2000 m depth is an indicator of varyingdeep-water formation (Alekseev et al., 2001; Boenischet al., 1997).The observation of a large temperatureincrease (0.25 ºC) in the central Greenland Sea in the1990s is consistent with the weakening of the thermo-haline circulation implied by decreasing deep-waterflow toward the Arctic through the Faroe-ShetlandStrait (Hansen et al., 2001).
2.6.4.Terrestrial system
About 24.5% of the exposed land surface in the North-ern Hemisphere is underlain by permafrost (Zhang T. etal., 2000), and any increase in temperature is very like-ly to cause this area to shrink, in turn affecting arcticgroundwater supply. Section 6.6.1.2 provides a moredetailed description of recent changes in permafrost.Permafrost is very sensitive to climate change, and isdependent upon ambient temperatures for its existenceand distinctive properties (Lunardini, 1996). Brown J.et al. (2000) indicated that only the thin active (season-ally thawed) layer of permafrost responds immediatelyto temperature changes, making it both an indicator anda product of climate change, as its depth is dependenton temperature.Vourlitis and Oechel (1996) reportedan annual increase of 10 to 22 cm in the depth of theactive layer between June and August in some perma-frost areas. Climate change is very likely to acceleratethis depth increase, due to both higher temperaturesand increased evapotranspiration, which makes the soildrier throughout the active layer and causes a descent ofthe permafrost table (Vourlitis and Oechel, 1996).
Along the land-sea margin of the Arctic, over the pastfew decades there has been an increase in the magni-tude of oscillations of the permafrost bottom (deepestextent of permafrost), and a greater variability in thick-ness during the warmer part of longer-term cycles,indicating an overall degradation of coastal permafrost(Romanovskii and Hubberten, 2001). Along a north–south transect in Alaska, permafrost temperatures at 15to 20 m depths have increased between 0.6 and 1.5 ºCover the past 20 years, mean annual ground surfacetemperatures have increased by 2.5 ºC since the 1960s,and discontinuous permafrost has begun thawing down-ward at a rate of about 0.1 m/yr at some locations(Osterkamp, 2003; Osterkamp and Romanovsky, 1999;Romanovsky and Osterkamp, 2000; Romanovsky et al.,2003).The effects of increased permafrost temperatureson groundwater could possibly include the developmentof large, unfrozen near-surface aquifers with ground-water flow throughout the year; more active rechargeand discharge of aquifers and increased groundwaterflow would affect the base flow volumes and chemistryof many rivers.
Romanovsky and Osterkamp (2000) took a series ofprecise permafrost temperature measurements fromfour observation sites in Alaska, and found thatunfrozen water has the greatest effect on the groundthermal regime immediately after freeze-up and duringthe cooling of the active layer, but is less important dur-ing the warming and thawing of the active layer.Jorgenson et al. (2001) showed widespread permafrostdegradation in the Tanana Valley due to increases in airand permafrost temperatures. Permafrost temperatureshave increased in Alaska, and decreased in easternCanada (Serreze et al., 2000). Increased permafrosttemperatures have also been observed in Siberia(Isaksen et al., 2001). Climate change is likely to drasti-
46 Arctic Climate Impact Assessment
cally affect wildlife habitat, as permafrost is essential tothe existence and functioning of arctic wetlands.
2.7. Arctic climate variability prior to100 years BPThis section examines the record of past climatechange in the Arctic with the objective of providing acontext for evaluating evidence of more recent climatechange and the possible impacts of future climatechange. This review focuses on the past two millionyears (approximately), and particularly the past20 000 years. Over geological time periods, the earth’snatural climate system has been forced or driven by arelatively small number of external factors. Tectonicprocesses acting very slowly over millions of yearshave affected the location and topography of thecontinents through plate tectonics and ocean spread-ing. Changes in the orbit of the earth occur over tensto hundreds of thousands of years and alter theamount of solar radiation received at the surface byseason and by latitude. These orbital changes driveclimate responses, including the growth and decay ofice sheets at high latitudes. Finally, changes in theemissivity of the sun have taken place over billions ofyears, but there have been shorter-term variations thatoccurred over decades, centuries, and millennia.As a consequence of changes in these external forces,global climate has experienced variability and changeover a variety of timescales, ranging from decades tomillions of years.
The sparseness of instrumental climate records prior tothe 20th century (especially prior to the mid-19th cen-tury) means that estimates of climate variability in theArctic during past centuries must rely upon indirect“proxy” paleoclimate indicators, which have the poten-tial to provide evidence for prior large-scale climaticchanges.Typically, the interpretation of proxy climaterecords is complicated by the presence of “noise” inwhich climate information is immersed and by a varietyof possible distortions of the underlying climate infor-mation (see Bradley, 1999 for a comprehensive review;IPCC, 2001). Careful calibration and cross-validationprocedures are necessary to establish a reliable relation-ship between a proxy indicator and the climatic variableor variables of interest, providing a “transfer” functionthat allows past climatic conditions to be estimated.Of crucial importance is the ability to date differentproxy records accurately in order to determine whetherevents occurred simultaneously, or whether someevents lagged behind others.
Sources of paleoclimatic information in the Arctic arelimited to a few, often equivocal types of records, mostof which are interpreted as proxies for summer temper-ature. Little can be said about winter paleoclimate(Bradley, 1990). Only ice cores, tree rings, and lakesediments provide continuous high-resolution records.Coarsely resolved climate trends over several centuriesare evident in many parts of the Arctic, including:
• the presence or absence of ice shelves deducedfrom driftwood frequency and peat growthepisodes and pollen content;
• the timing of deglaciation and maximum uplift ratesdeduced from glacio-isostatic evidence as well asglacial deposits and organic materials over-riddenby glacial advances or exposed by ice recession;
• changes in the range of plant and animal species tolocations beyond those of today (Bradley, 1990);and
• past temperature changes deduced from the geo-thermal information provided by boreholes.
In contrast, large-scale continuous records of decadal,annual, or seasonal climate variations in past centuriesmust rely upon sources that resolve annual or seasonalclimatic variations. Such proxy information includestree-ring width and density measurements; pollen,diatom, and sediment changes from laminated sedimentcores; isotopes, chemistry, melt-layer stratigraphy, acid-ity, pollen content, and ice accumulation from annuallyresolved ice cores; and the sparse historical documen-tary evidence available for the past few centuries.Information from individual paleoclimate proxies isoften difficult to interpret and multi-proxy analysis isbeing used increasingly in climate reconstructions.Taken as a whole, proxy climate data can provide glob-al-scale sampling of climate variations several centuriesinto the past, and have the potential to resolve bothlarge-scale and regional patterns of climate change priorto the instrumental period.
2.7.1. Pre-Quaternary Period
Over the course of millions of years, the Arctic has expe-rienced climatic conditions that have ranged from oneextreme to the other. Based on the fossil record, 120 to90 million years before present (My BP) during the mid-Cretaceous Period, the Arctic was significantly warmerthan at present, such that arctic geography, atmosphericcomposition, ocean currents, and other factors werequite different from at present. In contrast, as recently as20 ky BP, the Arctic was in the grip of intense cold andcontinental-scale glaciation was at its height.This was thelatest of a series of major glacial events, which, togetherwith intervening warm periods, have characterized thepast two million years of arctic environmental history.
The most recent large-scale development and build-upof ice sheets in the Arctic probably commenced duringthe Late Tertiary Period (38 to 1.6 My BP). Ice accumu-lation at that time may have been facilitated initially byplate tectonics (Ruddiman et al., 1989). According toMaslin et al. (1998), the onset of Northern Hemisphereglaciation began with a significant build-up of ice insouthern Greenland. However, progressive intensifica-tion of glaciation does not seem to have begun until 3.5to 3 My BP, when the Greenland Ice Sheet expanded toinclude northern Greenland. Maslin et al. (1998) sug-gested that the Eurasian Arctic, northeast Asia, andAlaska were glaciated by about 2.7 My BP and northeast
Chapter 2 • Arctic Climate: Past and Present 47
America by 2.5 My BP. Maslin et al. (1998) suggestedthat tectonic changes, including the deepening of theBering Strait, were too gradual to be responsible for thespeed of Northern Hemisphere glaciation, but suggestedthat tectonic changes brought the global climate to acritical threshold while relatively rapid variations in theorbital parameters of the earth triggered the glaciation.
2.7.2. Quaternary Period
The Quaternary Period (the last 1.6 My) has been char-acterized by periodic climatic variations during whichthe global climate system has switched between inter-glacial and glacial stages, with further subdivision intostadials (shorter cold periods) and interstadials (shortermild episodes). Glacial stages are normally defined ascold phases with major glacier and ice sheet expansion.Interglacials are defined as warm periods when tempera-tures were at least as high as during the presentHolocene interglacial.
This interglacial–glacial–interglacial climate oscillationhas been recurring with a similar periodicity for mostof the Quaternary Period, although each individualcycle appears to have had its own idiosyncrasies interms of the timing and magnitude of specific events.It has been estimated that there have been between 30and 50 glacial/interglacial cycles during the QuaternaryPeriod (Ruddiman et al., 1989; Ruddiman andKutzbach, 1990), primarily driven by changes in theorbit of the earth (Imbrie and Imbrie, 1979).
One of the earliest (and certainly the most well known)hypotheses concerning the effects of orbital configura-tion on glacial cycles is described by Milankovitch(1941), who presents the argument that a decrease insummer insolation is critical for glacial initiation.Low summer insolation occurs when the tilt of the axisof rotation of the earth is small; the poles are pointingless directly at the sun; the Northern Hemisphere sum-mer solstice is farthest from the sun; and the earth’sorbit is highly eccentric.The key orbital parametersinvolved include changes in the eccentricity of the orbitof the earth with a period of 100 ky; the tilt of the axisof rotation of the earth, which oscillates between 22.2ºand 24.5º with a period of 41 ky; and the position of theearth within its elliptical orbit during the NorthernHemisphere summer, which changes over a period of23 ky. Bradley (1990) pointed out that such orbitallyinduced radiation anomalies are especially significant athigh latitudes in summer when daylight persists for24 hours.The latitude most sensitive to low insolationvalues is 65º N, the latitude at which most ice sheets firstformed and lasted longest during the last glaciation.The amount of summer insolation reaching the top ofthe atmosphere at 65º N and nearby latitudes can vary byas much as ±12% around the long-term mean value.Changes in winter insolation also occur with exactly theopposite timing, but they are not considered importantto ice-sheet survival.When summer insolation is weak,less radiation is delivered to the surface at high latitudes,
resulting in lower regional temperatures. Lower temper-atures reduce the summer ablation of the ice sheets andallow snow to accumulate and ice sheets to grow.Once ice sheets are created, they contribute to theirown positive mass balance by growing in elevation,reaching altitudes of several kilometers where prevailingtemperatures favor the accumulation of snow and ice.
Other hypotheses concerning the causes of glacial initia-tion include that of Young and Bradley (1984), whoargued that the meridional insolation gradient is a criti-cal factor for the growth and decay of ice sheets throughits control over poleward moisture fluxes during sum-mer and resultant snowfall. Snowfall could increase in acooler high-latitude climate through enhanced stormactivity forced by a greater latitudinal temperature gra-dient. Ruddiman and McIntyre (1981) and Miller and deVernal (1992) suggested that the North Atlantic Oceancirculation is important for modulating ice volume.There is evidence that the North Atlantic remainedwarm during periods of ice growth and they proposedthat enhanced meridional temperature gradients andevaporation rates during the winter enhanced snowdelivery to the nascent ice sheets of northeasternCanada. An active thermohaline circulation in the NorthAtlantic could increase the moisture supply to sites ofglacial initiation through its ability to maintain warmersea surface temperatures, limit sea-ice growth, and allowfor greater evaporation from the ocean surface.
These external forcing mechanisms in turn causeresponses and chain reactions in the internal elements ofthe earth’s system (e.g., Bradley, 1985). Changes in oneinternal element of the system can cause responses inother elements.These can lead to feedback effects thatcan amplify or attenuate the original signal.Thus, icesheets, ice caps, and glaciers play an important role inthe global climate system. Glacial advance and retreatmay therefore be both a consequence and a cause of cli-mate change (Imbrie et al., 1993a,b).
Given the inherent errors in dating techniques, gaps inthe stratigraphic record, and the varying rates ofresponse of different biological proxy indicators, thereis considerable uncertainty about the timing of specificevents and whether climate changes were truly synchro-nous in different regions.The errors and uncertaintiestend to be amplified farther back in the paleoclimaticrecord, particularly in the Arctic, where much of thepaleoclimatic evidence from earlier parts of the Quater-nary Period has been removed or obfuscated as a resultof later glaciations. Consequently, this review of climatevariability in the Arctic during the Quaternary Periodfocuses first on the more complete and reliable evi-dence of climate conditions immediately prior to theonset of the most recent glacial–interglacial oscillation(~130 ky BP).This is followed by a brief review of con-ditions during the Last Glacial Maximum (~20 ky BP)and the subsequent period of deglaciation, and culmi-nates in a review of the evidence of climatic variabilityduring the present interglacial, the Holocene.
48 Arctic Climate Impact Assessment
2.7.3. Last interglacial and glaciation
2.7.3.1. Last interglacial:The Eemian
Climatic conditions during interglacial periods aregenerally considered to be broadly comparable topresent-day conditions. The most recent interglacial,the Eemian, extended from the end of the penulti-mate glaciation about 130 ky BP until about 107 kyBP when the last glacial period began (see IPCC,2001c for further discussion of the Eemian). TheEemian is often regarded as a typical interglacial eventwith characteristics including relatively high sea level,a retreat to minimum size of global ice sheets, and theestablishment of biotic assemblages that closely paral-lel those at present. According to most proxy data,the last interglacial was slightly warmer everywherethan at present (IPCC, 2001c). Brigham-Grette andHopkins (1995) reported that during the Eemian thewinter sea-ice limit in Bering Strait was at least800 km farther north than today, and that duringsome summers the Arctic Ocean may have been ice-free. The northern treeline was more than 600 kmfarther north, displacing tundra across all of Chukotka(Lozhkin and Anderson, 1995). Western Europeanlake pollen records show deciduous forests (character-istic of warmer conditions) across much of WesternEurope that were abruptly replaced by steppic taxacharacteristic of colder conditions; this shift isassociated with a cold event at 107 ky BP. This rela-tively prolonged warm period is also detected innortheast Atlantic marine sediments, but is notevident throughout the North Atlantic. Faunal andlithic records from the polar North Atlantic (Fronvaland Jansen, 1997) indicate that the first abrupt cool-ing occurred around 118 to 117 ky BP (Adkins et al.,1997; Keigwin et al., 1994).
Evidence of warmer conditions in the Arctic thanexist at present is provided by a re-evaluation of theoxygen isotope ratio (δ18O) record obtained fromGreenland ice core samples (Cuffey and Marshall,2000). These authors suggest that the Greenland IceSheet was considerably smaller and steeper during theEemian than at present and probably contributed 4to 5.5 m to global sea level during that period.This implies that the climate of Greenland during theEemian was more stable and warmer than previouslythought, and the consequent melting of the GreenlandIce Sheet more significant.
Some researchers suggest that a paleoclimatic recon-struction of the Eemian provides a means of establish-ing the mode and tempo of natural climate variabilitywith no anthropogenic influence. However, a generallack of precise absolute timescales and regionally-to-globally synchronous stratigraphic markers makeslong-distance correlation between sites problematic,and inferred terrestrial changes are difficult to placewithin the temporal framework of changes in ice vol-ume and sea level (Tzedakis, 2003).
2.7.3.2. Last glaciation:Wisconsinan/Weichselian
Although the timing of the end of the Eemian inter-glacial is subject to some uncertainty, high-resolutionNorth Atlantic marine sediment records indicate that theEemian ended with abrupt changes in deep-water flowoccurring over a period of less than 400 years (Adkins etal., 1997; IPCC, 2001c). Evidence in marine sedimentsof an invasion of cold, low salinity water in the Norweg-ian Sea at this time has been linked by Cortijo et al.(1994) to a reduction in warm-water transport by theNorth Atlantic Drift and the thermohaline circulation.It seems likely that this contributed to the onset of wide-spread arctic glaciation in sensitive areas.
Following the initial cooling event (~107 ky BP), climat-ic conditions often changed suddenly, followed by sever-al thousand years of relatively stable climate or even atemporary reversal to warmth. Overall, however, therewas a decline in global temperatures.The boundaries ofthe boreal forests retreated southward and fragmented asconditions grew colder. Large ice sheets began to devel-op on all the continents surrounding the Arctic Ocean.The point at which the global ice extent was at its great-est (~24 to 21 ky BP) is known as the Last GlacialMaximum (LGM – Clark and Mix, 2000).
At its maximum extent, the Laurentide Ice Sheetextended from the Arctic Ocean in the CanadianArchipelago to the midwestern United States in thesouth, and from the Canadian Cordillera to the easternedge of the continent. Local ice sheets also covered theAlaska and Brooks Ranges in Alaska.The Eurasian andLaurentide Ice Sheets were responsible for most of theglacio-eustatic decrease in sea level (about 120 m) dur-ing the LGM.The pattern of postglacial isostaticrebound suggests that the ice was thickest over HudsonBay.The different parts of the Laurentide Ice Sheetreached their maximum extent between 24 and 21 kyBP (Dyke et al., 2002).The Innuitian ice buildupappears to have culminated in the east after 20.5 ky BP.Dyke et al. (2002) suggested that the entire ice sheetsystem east of the Canadian Cordillera responded uni-formly to changes in climate. In contrast, the Cordil-leran Ice Sheet did not reach its maximum extent until15.2 to 14.7 ky BP, well after the LGM and the insola-tion minimum at approximately 21 ky BP (Dyke et al.,2002).This out-of-phase response may be attributable tothe effects of growth of the Cordilleran Ice Sheet, whichwould have intercepted moisture transport to the interi-or plains at the expense of the Laurentide Ice Sheet.During its maximum extent, the Laurentide Ice Sheetwas more than twice the size of the Eurasian Ice Sheet.Changes in climate during the LGM are discussed by theIPCC (2001c).
The Eurasian Ice Sheet initiation began 28 ky BP as aresult of temperature changes that lowered equilibriumline altitudes across the Scandinavian mountains,Svalbard, Franz Josef Land, and Novaya Zemlya. Ice flow
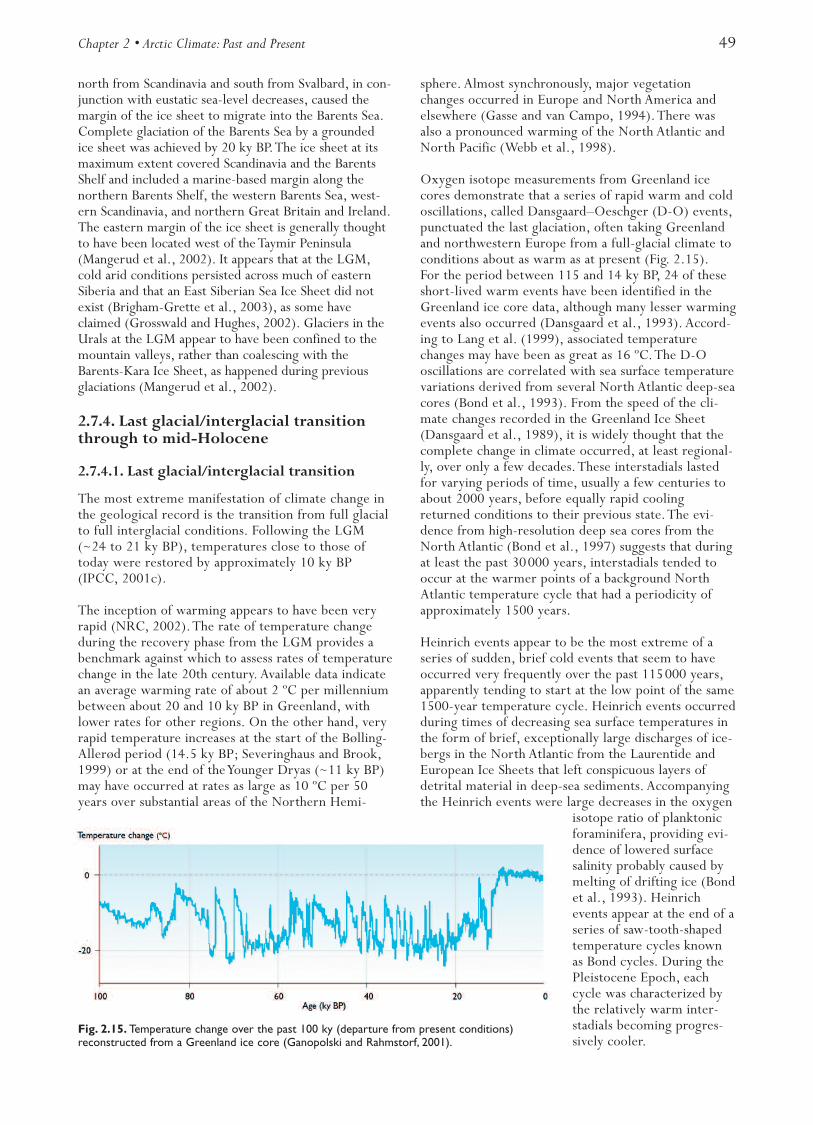
Chapter 2 • Arctic Climate: Past and Present 49
north from Scandinavia and south from Svalbard, in con-junction with eustatic sea-level decreases, caused themargin of the ice sheet to migrate into the Barents Sea.Complete glaciation of the Barents Sea by a groundedice sheet was achieved by 20 ky BP.The ice sheet at itsmaximum extent covered Scandinavia and the BarentsShelf and included a marine-based margin along thenorthern Barents Shelf, the western Barents Sea, west-ern Scandinavia, and northern Great Britain and Ireland.The eastern margin of the ice sheet is generally thoughtto have been located west of the Taymir Peninsula(Mangerud et al., 2002). It appears that at the LGM,cold arid conditions persisted across much of easternSiberia and that an East Siberian Sea Ice Sheet did notexist (Brigham-Grette et al., 2003), as some haveclaimed (Grosswald and Hughes, 2002). Glaciers in theUrals at the LGM appear to have been confined to themountain valleys, rather than coalescing with theBarents-Kara Ice Sheet, as happened during previousglaciations (Mangerud et al., 2002).
2.7.4. Last glacial/interglacial transitionthrough to mid-Holocene
2.7.4.1. Last glacial/interglacial transition
The most extreme manifestation of climate change inthe geological record is the transition from full glacialto full interglacial conditions. Following the LGM(~24 to 21 ky BP), temperatures close to those oftoday were restored by approximately 10 ky BP(IPCC, 2001c).
The inception of warming appears to have been veryrapid (NRC, 2002).The rate of temperature changeduring the recovery phase from the LGM provides abenchmark against which to assess rates of temperaturechange in the late 20th century. Available data indicatean average warming rate of about 2 ºC per millenniumbetween about 20 and 10 ky BP in Greenland, withlower rates for other regions. On the other hand, veryrapid temperature increases at the start of the Bølling-Allerød period (14.5 ky BP; Severinghaus and Brook,1999) or at the end of the Younger Dryas (~11 ky BP)may have occurred at rates as large as 10 ºC per 50years over substantial areas of the Northern Hemi-
sphere. Almost synchronously, major vegetationchanges occurred in Europe and North America andelsewhere (Gasse and van Campo, 1994).There wasalso a pronounced warming of the North Atlantic andNorth Pacific (Webb et al., 1998).
Oxygen isotope measurements from Greenland icecores demonstrate that a series of rapid warm and coldoscillations, called Dansgaard–Oeschger (D-O) events,punctuated the last glaciation, often taking Greenlandand northwestern Europe from a full-glacial climate toconditions about as warm as at present (Fig. 2.15).For the period between 115 and 14 ky BP, 24 of theseshort-lived warm events have been identified in theGreenland ice core data, although many lesser warmingevents also occurred (Dansgaard et al., 1993). Accord-ing to Lang et al. (1999), associated temperaturechanges may have been as great as 16 ºC.The D-Ooscillations are correlated with sea surface temperaturevariations derived from several North Atlantic deep-seacores (Bond et al., 1993). From the speed of the cli-mate changes recorded in the Greenland Ice Sheet(Dansgaard et al., 1989), it is widely thought that thecomplete change in climate occurred, at least regional-ly, over only a few decades.These interstadials lastedfor varying periods of time, usually a few centuries toabout 2000 years, before equally rapid coolingreturned conditions to their previous state.The evi-dence from high-resolution deep sea cores from theNorth Atlantic (Bond et al., 1997) suggests that duringat least the past 30000 years, interstadials tended tooccur at the warmer points of a background NorthAtlantic temperature cycle that had a periodicity ofapproximately 1500 years.
Heinrich events appear to be the most extreme of aseries of sudden, brief cold events that seem to haveoccurred very frequently over the past 115000 years,apparently tending to start at the low point of the same1500-year temperature cycle. Heinrich events occurredduring times of decreasing sea surface temperatures inthe form of brief, exceptionally large discharges of ice-bergs in the North Atlantic from the Laurentide andEuropean Ice Sheets that left conspicuous layers ofdetrital material in deep-sea sediments. Accompanyingthe Heinrich events were large decreases in the oxygen
isotope ratio of planktonicforaminifera, providing evi-dence of lowered surfacesalinity probably caused bymelting of drifting ice (Bondet al., 1993). Heinrichevents appear at the end of aseries of saw-tooth-shapedtemperature cycles knownas Bond cycles. During thePleistocene Epoch, eachcycle was characterized bythe relatively warm inter-stadials becoming progres-sively cooler.
Fig. 2.15. Temperature change over the past 100 ky (departure from present conditions)reconstructed from a Greenland ice core (Ganopolski and Rahmstorf, 2001).
50 Arctic Climate Impact Assessment
Deep-sea cores also show the presence of ice-raftingcycles in the intervals between Heinrich events (Bondand Lotti, 1995).The duration of these ice-rafting cyclesvaries between 2000 and 3000 years and they closelycoincide with the D-O events. A study of the ice-raftedmaterial suggests that, coincident with the D-O cooling,ice within the Icelandic ice caps and within or near theGulf of Saint Lawrence underwent nearly synchronousincreases in rates of calving.The Heinrich events reflectthe slower rhythm of iceberg discharges into the NorthAtlantic, probably from Hudson Strait.
Air temperature, sea surface temperature, and salinityvariations in the North Atlantic are associated withmajor changes in the thermohaline circulation. A corefrom the margin of the Faroe-Shetland Channel cover-ing the last glacial period reveals numerous oscillationsin benthic and planktonic foraminifera, oxygen iso-topes, and ice-rafted detritus (Rasmussen et al., 1996).These oscillations correlate with the D-O cycles, show-ing a close relationship between the deep-ocean circula-tion and the abrupt climatic changes during the lastglaciation. It is increasingly apparent that large, globallylinked environmental feedbacks were involved in thegeneration of the large, rapid temperature increases thatoccurred during glacial termination and the onset ofD-O events.
During the last glacial–interglacial transition, the move-ments of the North Atlantic Polar Front have beendescribed as pivoting around locations in the westernNorth Atlantic. Iceland, situated in the middle of theNorth Atlantic, has glaciers sensitive to changes inoceanic and atmospheric frontal systems (Ingolfsson etal., 1997).The late-glacial (subsequent to the LGM)records from Iceland indicate that relatively warmAtlantic water reached Iceland during the Bølling–Allerød Interstadial, with a short cooling period corre-sponding with the Older Dryas. Karpuz et al. (1993)suggested that the marine polar front was located closeto Iceland during the Bølling–Allerød, and Sarnthein etal. (1995) concluded that sea-surface circulation wasmainly in Holocene interglacial mode after 12.8 ky BP.
Warm episodes were also associated with higher sea-surface temperatures and the presence of oceanic con-vection in the Norwegian Greenland Sea. Cold episodeswere associated with low sea surface temperatures, lowsalinity, and no convection (Rasmussen et al., 1996).Subsequent to the initial phase of deglaciation onSpitsbergen (~13 to 12.5 ky BP), most of the easternand northern Barents Sea was deglaciated during theBølling–Allerød Interstadial (Vorren and Laberg, 1996).Vorren and Laberg (1996) speculate on the existence ofa close correlation between summer air temperaturesand the waxing and waning phases of the northernFennoscandian and southern Barents Sea Ice Sheets.Most of the ice-sheet decay is attributed by these authorsto increases in air temperature, which caused thinning ofthe ice sheets, making them susceptible to decouplingfrom the seabed and increased calving.
After a few thousand years of recovery, the Arctic wassuddenly plunged back into a new and very short-livedcold event known as the Younger Dryas (see NRC, 2002,for a detailed discussion) leading to a brief advance of theice sheets.The central Greenland ice core record (fromthe Greenland Ice Core Project and the Greenland IceSheet Project 2) indicates that the return to the cold con-ditions of the Younger Dryas from the incipient inter-glacial warming 13 ky BP took place in less than 100years.The warming phase at the end of the YoungerDryas, which took place about 11 ky BP and lasted about1300 years, was very abrupt and central Greenland tem-peratures increased by 7 ºC or more in a few decades.
2.7.4.2. Early to mid-Holocene
Following the sudden end of the Younger Dryas, theArctic entered several thousand years of conditions thatwere warmer and probably moister than today. Peakhigh-latitude summer insolation (Milankovitch orbitalforcing) occurred during the earliest Holocene, with amaximum radiation anomaly (approximately 8% greaterthan at present) attained between 10 and 9 ky BP(Berger and Loutre, 1991). Although most of the Arcticexperienced summers that were warmer (1–2 ºC) thanat present during the early to middle Holocene, therewere significant spatial differences in the timing of thiswarm period.This was probably due to the effects oflocal residual land-ice cover and local sea surface tem-peratures (Overpeck et al., 1997). In most of the icecores from high latitudes, the warm period is seen atthe beginning of the Holocene (about 11 to 10 ky BP).In contrast, central Greenland (Dahl-Jensen et al.,1998) and regions downwind of the Laurentide IceSheet, including Europe (COHMAP Members, 1988)and eastern North America (Webb et al., 1998), did notwarm up until after 8 ky BP.The rapid climatic eventsof the last glacial period and early Holocene are bestdocumented in Greenland and the North Atlantic andmay not have occurred throughout the Arctic.This earlyHolocene warm period appears to have been punctuat-ed by a severe cold and dry phase about 8200 years ago,which lasted for less than a century, as recorded in thecentral Greenland ice cores (Alley et al., 1997).
Glacio-isostatic evidence indicates deglaciation wasunderway by the beginning of the Holocene and maxi-mum uplift occurred between 8 and 7 ky BP and evenearlier in many areas. By 9 ky BP, Spitsbergen glaciershad retreated to or beyond their present day positions(Sexton et al., 1992) and the marine faunal evidencesuggest that this period was as warm if not warmer thanat present along the west and north coasts of Svalbard(Salvigsen et al., 1992).The retreat of the largest of theglaciers along the Gulf of Alaska began as early as 16 to14 ky BP (Mann D. and Hamilton, 1995). Althoughmuch of the high and mid-Canadian Arctic remainedglaciated, warm summers are clearly registered byenhanced summer melting of the Agassiz Ice Cap(Koerner and Fisher, 1990). Following the large, abruptchange in stable-isotope ratios marking the end of the
Chapter 2 • Arctic Climate: Past and Present 51
last glaciation, δ18O profiles from Agassiz Ice Cap coresshow a rapid warming trend that reached a maximumbetween approximately 9 and 8 ky BP.
Deglacial marine sediments in Clements Markham Inleton the north coast of Ellesmere Island resemble thosecharacteristic of temperate (as opposed to polar) tide-water glaciers, suggesting that climatic conditions in theearly Holocene were significantly warmer there thantoday (Stewart, 1988). Glaciers had retreated pastpresent-day termini in some areas by 7.5 ky BP. Increas-ing sea surface temperatures in Baffin Bay enhanced pre-cipitation on Baffin Island (Miller and de Vernal, 1992),leading to a widespread early Holocene glacial advancealong the east coast. Marine mammals and boreal mol-lusks were present far north of their present-day rangeby 7.5 to 6.5 ky BP, as were many species of plantsbetween 9.2 and 6.7 ky BP (Dyke et al., 1996, 1999).Caribou were able to survive in the northernmost val-leys of Ellesmere Island and Peary Land by 8.5 ky BP orearlier. Such evidence indicates very warm conditionsearly in the Holocene (before 8 ky BP).
Early Holocene summer temperatures similar to those atpresent have been reconstructed in Arctic Fennoscandiaby numerous studies using a range of proxies and multi-proxy analyses (Rosén et al., 2001). However, abruptclimatic variations were characteristic of the earlyHolocene, with distinct cool episodes around 9.2, 8.6,and 8.2 ky BP (Korhola et al., 2002).The most recent ofthese events might be connected to the widely known“8.2 ky event”, which affected terrestrial and aquatic sys-tems in northern Fennoscandia (Korhola et al., 2002;Nesje et al., 2000; Snowball et. al., 1999). Hantemirovand Shiyatov (2002) report that open larch forests werealready growing in the Yamal Peninsula of northwesternSiberia 10.5 to 9 ky BP and that the most favorable peri-od for tree growth lasted from 9.2 to 8 ky BP. Duringthe early Holocene, reconstructed mean temperatureanomalies for the warmest month, based on pollen dataacross Northern Europe, show temperatures comparableto those at present (Davis et al., 2003).Temperaturesthen increased around 6 ky BP, with the onset of thisincrease delayed to around 9 ky BP in the east.
Boreal forest development across northern Russia(including Siberia) commenced by 10 ky BP (MacDonaldG. et al., 2000). Over most of Russia, forests advancedto or near the current arctic coastline between 9 and7 ky BP, and retreated to their present position bybetween 4 and 3 ky BP. Forest establishment and retreatwere roughly synchronous across most of northernRussia, with the exception of the Kola Peninsula, whereboth appear to have occurred later. During the period ofmaximum forest extension, the mean July temperaturealong the northern coastline of Russia may have been2.5 to 7.0 ºC warmer than present.
The Arctic appears to have been relatively warm duringthe mid-Holocene, although records differ spatially, tem-porally, and by how much summer warmth they suggest
(relative to the early Holocene insolation maximum;Bradley, 1990; Hardy and Bradley, 1996).
A review of the Holocene glaciation record in coastalAlaska (Calkin, 1988) suggests that glacier fluctuationsin arctic, central interior, and southern maritime Alaskawere mostly synchronous. Ager (1983) and Heusser(1995) report that pollen records indicate a dramaticcooling about 3.5 ky BP and suggest an increase in pre-cipitation and storminess in the Gulf of Alaska accompa-nied by a rejuvenation of glacial activity. In northernIceland, the Holocene record of glacier fluctuations indi-cates two glacial advances between 6 and 4.8 ky BP(Stötter, 1991).
In the Canadian Arctic, interior regions of EllesmereIsland appear to have retained extensive Innuitian and/orplateau ice cover until the mid-Holocene (Bell, 1996;Smith, 1999), after which ice margins retreated to posi-tions at or behind those at present. Restricted marine-mammal distributions imply more extensive summer seaice between 8 and 5 ky BP, and hence cooler conditions(Dyke et al., 1996, 1999). However, marine conditionsat 6 ky BP warmer than those at present are suggestedby analyses of marine microfossils (Gajewski et al.,2000) performed over a broad area from the high Arcticto the Labrador Sea via Baffin Bay. A multi-proxy sum-mary of marine and terrestrial evidence from the Baffinsector (Williams et al., 1995) suggests that warmingbegan around 8 ky BP, intensified at 6 ky BP, and thatconditions had cooled markedly by 3 ky BP.
Dugmore (1989) demonstrated that, in Iceland, theSólheimajökull glacier extended up to 5 km beyond itspresent limits between 7 and 4.5 ky BP. Major ice sheetadvances also occurred before 3.1 ky BP and between 1.4and 1.2 ky BP. In the 10th century (1 ky BP), this glacierwas also larger than during the period from AD 1600 to1900, when some other glaciers reached their maximumHolocene extent. Stötter et al. (1999) suggested thatmajor glacier advances in northern Iceland occurred ataround 4.7, 4.2, 3.2–3.0, 2.0, 1.5, and 1.0 ky BP.
Evidence for a mid-Holocene thermal maximum inScandinavia is considerable, and based on a wide range ofproxies (Davis et al., 2003).Treelines reached theirmaximum altitude (up to 300 m higher than at present;Barnekow and Sandgren, 2001), and glaciers were great-ly reduced or absent (Seierstad et al., 2002). Pollen andmacrofossil records from the Torneträsk area in northernSwedish Lapland indicate optimal conditions for Scotspine (Pinus sylvestris) from 6.3 to 4.5 ky BP (Barnekowand Sandgren, 2001) and records of treeline change innorthern Sweden show high-elevation treelines around6 ky BP (Karlén and Kuylenstierna, 1996).These dataindicate an extended period in the early to mid-Holocene when Scandinavian summer temperatureswere 1.5 to 2 ºC higher than at present.
Tree-ring data from the Torneträsk area indicate particu-larly severe climatic conditions between 2.6 and 2 ky BP
52 Arctic Climate Impact Assessment
(600–1 BC).This period includes the greatest range inring-width variability of the past 7400 years in this area,indicating a highly variable but generally cold climate(Grudd et al., 2002).This period is contemporary witha major glacial expansion in Scandinavia when manyglaciers advanced to their Holocene maximum position(Karlén, 1988) with major effects on human societies(Burenhult, 1999; van Geel et al., 1996).
Especially severe conditions in northern SwedishLapland occurred 2.3 ky BP (330 BC), with tree-ringdata indicating a short-term decrease in mean summertemperature of about 3 to 4 ºC. A catastrophic drop inpine growth at that time is also reported by Eronen etal. (2002), who state that this was the most unfavorableyear for the growth of treeline pines in Finnish Laplandin the past 7500 years. Reconstructed Holocene sum-mer temperature changes in Finnish Lapland, based onproxy climate indicators in sediments from LakeTsuolbmajavri, show an unstable early Holocenebetween 10 and 8 ky BP in which inferred July air tem-peratures were about the same as at present most of thetime, but with three successive cold periods at approxi-mately 9.2, 8.6, and 8.2 ky BP, and a “thermal maxi-mum” between approximately 8 and 5.8 ky BP, followedby an abrupt cooling (Korhola et al., 2002). Dated sub-fossils (partially fossilized organisms) show that the pinetreeline in northwestern Finnish Lapland retreated adistance of at most 70 km during this cooling, but thatthe shift was less pronounced in more easterly parts ofLapland (Eronen et al., 2002).
Hantemirov and Shiyatov (2002) reported that the mostfavorable period for tree growth in the Yamal Peninsulaof northwestern Siberia lasted from 9.2 to 8 ky BP.At that time, the treeline was located at 70º N.Then,until 7.6 ky BP, temperatures decreased but this did notresult in any significant shift in the treeline.The treelinethen moved south until, by 7.4 ky BP, it was located atapproximately 69º N. It remained here until 3.7 ky BPwhen it rapidly retreated (~20 km) to within 2 to 3 kmnorth of its present position south of the Yamal Penin-sula.This retreat in the space of only 50 years coincideswith an abrupt and large cooling as indicated in thetree-ring data.This cooling event may have been associ-ated with the eruption of the Thera (Santorini) volcanoin the southern Aegean around 3.6 ky BP.
Tree-ring data from the Kheta-Khatanga plain regionand the Moyero-Kotui plateau in the eastern part ofthe Taymir Peninsula indicate climatic conditions morefavorable for tree growth around 6 ky BP, as confirmedby increased concentrations of the stable carbon iso-tope 13C in the annual tree rings (Naurzbaev et al.,2002).The growth of larch trees at that time was 1.5to 1.6 times greater than the average radial growth oftrees during the last 2000 years, and the northern tree-line is thought to have been situated at least 150 kmfarther north than at present, as indicated by the pres-ence of subfossil wood of that age in alluvial deposits ofthe Balakhnya River. During the past 6000 years, the
eastern Taymir tree-ring chronologies show a signifi-cant and progressive decrease in tree growth and thustemperature.
2.7.5. Last millennium
Over the last millennium, variations in climate acrossthe Arctic and globally have continued.The term“Medieval Warm Period”, corresponding roughly tothe 9th to the mid-15th centuries, is frequently usedbut evidence suggests that the timing and magnitudeof this warm period varies considerably worldwide(Bradley and Jones, 1993; Crowley and Lowery, 2000;IPCC 2001c). Current evidence does not support aglobally synchronous period of anomalous warmthduring that time frame, and the conventional term of“Medieval Warm Period” appears to have limited utilityin describing trends in hemispheric or global meantemperature changes.
The Northern Hemisphere mean temperature estimatesof Mann M. et al. (1999), and Crowley and Lowery(2000), show that temperatures during the 11th to the14th centuries were about 0.2 ºC higher than those dur-ing the 15th to the 19th centuries, but somewhat belowthe temperatures of the mid-20th century.The long-term hemispheric trend is best described as a modestand irregular cooling from AD 1000 to around 1850 to1900, followed by an abrupt 20th-century warming.
Regional evidence is, however, quite variable. Crowleyand Lowery (2000) show that western Greenland exhib-ited local anomalous warmth only around AD 1000(and to a lesser extent, around AD 1400), and experi-enced quite cold conditions during the latter part of the11th century. In general, the few proxy temperaturerecords spanning the last millennium suggest that theArctic was not anomalously warm throughout the 9thto 14th centuries (Hughes and Diaz, 1994).
In northern Swedish Lapland, Scots pine tree-ring dataindicate a warm period around AD 1000 that endedabout AD 1100 when a shift to a colder climateoccurred (Grudd et al., 2002). In Finnish Lapland,based on a 7500-year Scots pine tree-ring record,Helama et al. (2002) reported that the warmest non-overlapping 100-year period in the record is AD 1501to 1600, but AD 1601 was unusually cold. Other loca-tions in Fennoscandia and Siberia were also cold in AD1601, and Briffa et al. (1992, 1995) linked the coldconditions to the AD 1600 eruption of theHuaynaputina volcano in Peru. In northern Siberia, andparticularly east of Taymir where the most northerlylarch forests occur, long-term temperature trendsderived from tree rings indicate the occurrence of coolperiods during the 13th, 16th to 17th, and early 19thcenturies.The warmest periods over the last millenni-um in this region were between AD 950 and 1049, AD1058 and 1157, and AD 1870 and 1979. A long periodof cooling began in the 15th century and conditions
Chapter 2 • Arctic Climate: Past and Present 53
remained cool until the middle of the 18th century(Naurzbaev et al., 2002).
For the most part, “medieval warmth” appears to havebeen restricted to areas in and around the NorthAtlantic, suggesting that variability in ocean circula-tion may have played a role. Keigwin and Pickart(1999) suggested that the temperature contrastsbetween the North Atlantic and other areas were asso-ciated with changes in ocean currents in the NorthAtlantic and may to a large extent reflect century-scale changes in the NAO.
By the middle of the 19th century, the climate of theglobe and the Arctic was cooling. Overall, the periodfrom 1550 to 1900 may have been the coldest period inthe entire Holocene (Bradley, 1990).This period is usu-ally called the “Little Ice Age” (LIA), during which gla-ciers advanced on all continents.The LIA appears tohave been most clearly expressed in the North Atlanticregion as altered patterns of atmospheric circulation(O’Brien et al., 1995). Unusually cold, dry winters incentral Europe (e.g., 1 to 2 ºC below normal during thelate 17th century) were very probably associated withmore frequent flows of continental air from the north-east (Pfister, 1999;Wanner et al., 1995). Such condi-tions are consistent with the negative or enhanced east-erly wind phase of the NAO, which implies both warmand cold anomalies over different regions of the NorthAtlantic sector. Although the term LIA is used for thisperiod, there was considerable temporal and spatialvariability across the Arctic during this period.
Ice shelves in northwestern Ellesmere Island probablyreached their greatest extent in the Holocene duringthis interval. On the Devon Island Ice Cap, 1550 to1620 is considered to have been a period of net summeraccumulation, with very extensive summer sea ice inthe region.There is widespread evidence of glaciersreaching their maximum post-Wisconsinan positionsduring the LIA, and the lowest δ18O values and meltpercentages for at least 1000 years are recorded in icecores for this interval. Mann M. et al. (1999) and Joneset al. (1998) supported the theory that the 15th to 19thcenturies were the coldest of the millennium for theNorthern Hemisphere overall. However, averaged overthe Northern Hemisphere, the temperature decreaseduring the LIA was less than 1 ºC relative to late 20th-century levels (Crowley and Lowery, 2000; Jones et al.,1998; Mann M. et al., 1999). Cold conditions appear,however, to have been considerably more pronouncedin particular regions during the LIA. Such regional vari-ability may in part reflect accompanying changes inatmospheric circulation. Overpeck et al. (1997) sum-marized arctic climate change over the past 400 years.
There is an abundance of evidence from the Arctic thatsummer temperatures have decreased over approxi-mately the past 3500 years. In the Canadian Arctic, themelt record from the Agassiz ice core indicates adecline in summer temperatures since approximately
5.5 ky BP, especially after 2 ky BP. In Alaska, wide-spread glacier advances were initiated at approximately700 ky BP and continued through the 19th century(Calkin et al., 2001). During this interval, the majorityof Alaskan glaciers reached their Holocene maximumextensions.The pattern of LIA glacier advances alongthe Gulf of Alaska is similar on decadal timescales tothat of the well-dated glacier fluctuations throughoutthe rest of Alaska.
There is a general consensus that throughout theCanadian Archipelago, the late Holocene has been aninterval of progressive cooling (the “Neoglacial”, culmi-nating in the LIA), followed by pronounced warmingstarting about 1840 (Overpeck et al., 1997). Accordingto Bourgeois et al. (2000), the coldest temperatures ofthe entire Holocene were reached approximately 100 to300 years ago in this region. Others, working with dif-ferent indicators, have suggested that Neoglacial coolingwas even greater in areas to the south of the CanadianArchipelago (Johnsen et al., 2001).Therefore, even ifthe broad pattern of Holocene climatic evolution isassumed to be coherent across the Canadian Archipel-ago, the available data suggest regional variation in theamplitude of temperature shifts.
The most extensive data on the behavior of Greenlandglaciers apart from the Greenland Ice Sheet come fromManiitsoq (Sukkertoppen) and Disko Island. Similar tothe inland ice-sheet lobes, the majority of the local gla-ciers reached their maximum Neoglacial extent duringthe 18th century, possibly as early as 1750. Glaciersstarted to retreat around 1850, but between 1880 and1890 there were glacier advances. In the early 20th cen-tury, glacier recession continued, with interruptions bysome periods of advance.The most rapid glacial retreattook place between the 1920s and 1940s.
In Iceland, historical records indicate that Fjallsjökulland Breidamerkurjökull reached their maximumHolocene extent during the latter half of the 19th cen-tury (Kugelmann, 1991). Between 1690 and 1710,the Vatnajökull outlet glaciers advanced rapidly andthen were stationary or fluctuated slightly. Around1750 to 1760 a significant re-advance occurred, andmost of the glaciers are considered to have reachedtheir maximum LIA extent at that time (e.g., Grove,1988). During the 20th century, glaciers retreated rap-idly. During the LIA, Myrdalsjökul and Eyjafjallsjökullformed one ice cap, which separated in the middle ofthe 20th century into two ice caps (Grove, 1988).Drangajökull, a small ice cap in northwest Iceland,advanced across farmland by the end of the 17th centu-ry, and during the mid-18th century the outlet glacierswere the most extensive known since settlement of thesurrounding valleys. After the mid-19th centuryadvance, glaciers retreated significantly. On the islandof Jan Mayen, some glaciers reached their maximumextent around 1850.The glaciers subsequently experi-enced an oscillating retreat, but with a significantexpansion around 1960 (Anda et al., 1985).
54 Arctic Climate Impact Assessment
In northeastern Eurasia, long-term temperature trendsderived from tree rings close to the northern treeline ineast Taymir and northeast Yakutia indicate decreasingtemperatures during the LIA (Vaganov et al., 2000).
Variations in arctic climate over the past 1000 yearsmay have been the result of several forcing mechanisms.Bond et al. (2001) suggested variations in solar insola-tion. Changes in the thermohaline circulation or modesof atmospheric variability, such as the AO, may also havebeen primary forcing mechanisms of century- ormillennial-scale changes in the Holocene climate of theNorth Atlantic. It is possible that solar forcing mayexcite modes of atmospheric variability that, in turn,may amplify climate changes.The Arctic, through itslinkage with the Nordic Seas, may be a key regionwhere solar-induced atmospheric changes are amplifiedand transmitted globally through their effect on thethermohaline circulation.The resulting reduction innorthward heat transport may have further alteredlatitudinal temperature and moisture gradients.
2.7.6. Concluding remarks
Natural climate variability in the Arctic over the pasttwo million years has been large. In particular, the past20000-year period is now known to have been highlyunstable and prone to rapid changes, especially temper-ature increases that occurred rapidly (within a fewdecades or less).These temperature increases occurredduring glacial terminations and at the onset of D-Ointerstadials.This instability implies rapid, closely linkedchanges within the earth’s environmental system,including the hydrosphere, atmosphere, cryosphere,and biosphere. Not only has the climate of the Arcticchanged significantly over the past two million years,there have also been pronounced regional variationsassociated with each change.
The Arctic is not homogeneous and neither is its cli-mate, and past climate changes have not been uniformin their characteristics or their effects. Many of thesechanges have not been synchronous nor have they hadequal magnitudes and rates of change. Climate changesin one part of the Arctic may trigger a delayed responseelsewhere, adding to the complexity.The paleoenviron-mental evidence for the Arctic suggests that at certaintimes, critical thresholds have been passed and unpre-dictable responses have followed.The role that anthro-pogenic changes to the climate system might play inexceeding such thresholds and the subsequent responseremains unclear.
It is clear that between 400 and 100 years BP, theclimate in the Arctic was exceptionally cold.There iswidespread evidence of glaciers reaching their maxi-mum post-Wisconsinan positions during this period,and the lowest δ18O values and melt percentages for atleast 1000 years are recorded in ice cores for thisinterval.The observed warming in the Arctic in thelatter half of the 20th century appears to be without
precedent since the early Holocene (Mann M. andJones, 2003).
2.8. Summary and key findings
This chapter has described the arctic climate system; theregion’s impact on the global climate system; recent cli-matic change depicted by the instrumental record; andthe historical/paleoclimatic perspective on arctic climaticvariability. Features of the arctic climate system that areunique to the region include the cryosphere, theextremes of solar radiation, and the role of salinity inocean dynamics.
The climate of the Arctic is changing.Trends in instru-mental records over the past 50 years indicate a reason-ably coherent picture of recent environmental change innorthern high latitudes.The average surface temperaturein the Arctic increased by approximately 0.09 ºC perdecade over the past century, and the pattern of changeis similar to the global trend (i.e., an increase up to themid-1940s, a decrease from then until the mid-1960s,and a steep increase thereafter with a warming rate of0.4 ºC per decade). It is very probable that the Arctichas warmed over the past century, at a rate greater thanthe average over the Northern Hemisphere. It is proba-ble that polar amplification has occurred over the past50 years. Because of the scarcity of observations acrossthe Arctic before about 1950, it is not possible to be cer-tain of the variation in mean land-station temperatureover the first half of the 20th century. However, it isprobable that the past decade was warmer than anyother in the period of the instrumental record.Theobserved warming in the Arctic appears to be withoutprecedent since the early Holocene.
It is very probable that atmospheric pressure over theArctic Basin has been dropping and it is probable thatthere has been an increase in total precipitation at therate of about 1% per decade over the past century.It is very probable that snow-cover extent around theperiphery of the Arctic, sea-ice extent averaged over theArctic (during at least the past 40 years), and multi-yearsea-ice extent in the central Arctic have all decreased.
These climate changes are consistent with projections ofclimate change by global climate models forced withincreasing atmospheric GHG concentrations, but defini-tive attribution is not yet possible.
Natural climate variability in the Arctic over the pasttwo million years has been substantial. In particular,the past 20000-year period is now known to havebeen highly unstable and prone to large rapid changes,especially temperature increases that occurred quickly(within a few decades or less). It is clear that between400 and 100 years BP the climate in the Arctic wasexceptionally cold, and there is widespread evidence ofglaciers reaching their maximum post-Wisconsinanpositions during this period.
Chapter 2 • Arctic Climate: Past and Present 55
Changes in the Arctic are very likely to have significantimpacts on the global climate system. For example,a reduction in snow-cover extent and a shrinking of themarine cryosphere would increase heating of the surface,which is very likely to accelerate warming of the Arcticand reduce the equator-to-pole temperature gradient.Freshening of the Arctic Ocean by increased precipita-tion and runoff is likely to reduce the formation of colddeep water, thereby slowing the global thermohaline cir-culation. It is likely that a slowdown of the thermohalinecirculation would lead to a more rapid rate of rise ofglobal sea level, reduce upwelling of nutrients, and exerta chilling influence on the North Atlantic region as GulfStream heat transport is reduced. It would also decreasethe rate at which CO2 is transported to the deep ocean.Finally, temperature increases over permafrost areascould possibly lead to the release of additional CH4 intothe atmosphere; if seabed temperatures rise by a fewdegrees, hydrated CH4 trapped in solid form could alsoescape into the atmosphere.
Although it is possible to draw many conclusions aboutpast arctic climate change, it is evident that furtherresearch is still needed.The complex processes of theatmosphere, sea-ice, ocean, and terrestrial systemsshould be further explored in order to improve projec-tions of future climate and to assist in interpreting pastclimate. Reconstructions of the past have been limitedby available information, both proxy and instrumentalrecords.The Arctic is a region of large natural variabili-ty and regional differences and it is important that moreuniform coverage be obtained to clarify past changes.In order for the quantitative detection of change to bemore specific in the future, it is essential that steps betaken now to fill in observational gaps across the Arctic,including the oceans, land, ice, and atmosphere.
AcknowledgementsI would like to offer a special acknowledgement for David Wuertz,NOAA National Climate Data Center. I would also like to thank MarkSerreze, Inger Hanssen-Bauer, and Thorstein Thorsteinsson who helpedby participating in meetings and providing comments on the text.Supporting me in my work have been Jaime Dawson and Anna Ziolecki.
ReferencesAagaard, K. and E.C. Carmack, 1989.The role of sea ice and other fresh
water in the Arctic circulation. Journal of Geophysical Research,94(C10):14485–14498.
Aagaard, K. and L.K. Coachman, 1968a.The East Greenland Currentnorth of Denmark Strait, I.Arctic, 21:181–200.
Aagaard, K. and L.K. Coachman, 1968b.The East Greenland Currentnorth of Denmark Strait, II.Arctic, 21:267–290.
Aagaard, K. and P. Greisman, 1975.Toward new mass and heat budgetsfor the Arctic Ocean. Journal of Geophysical Research, 80:3821–3827.
Adkins, J.F., E.A. Boyle, L. Keigwin and E. Cortijo, 1997.Variability ofthe North Atlantic thermohaline circulation during the last interglacialperiod. Nature, 390:154–156.
Ager,T.A., 1983. Holocene vegetation history of Alaska. In: H.E.WrightJr. (ed). Late Quaternary Environments of the United States.Vol. 2,The Holocene, pp. 128–140. University of Minnesota Press.
Akinremi, O.O., S.M. McGinn and H.W. Cutforth, 1999. Precipitationtrends on the Canadian Prairies. Journal of Climate, 12:2996–3003.
Alekseev, G.V., L.V. Bulatov,V.F. Zakharov and V.V. Ivanov, 1998.Heat expansion of Atlantic waters in the Arctic Basin. Meteorologiyai Gidrologiya, 7:69–78.
Alekseev, G.V.,Ye.I.Aleksandrov, R.V. Bekryaev, P.N. Svyaschennikov andN.Ya. Harlanienkova, 1999. Surface air temperature from meteorologi-cal data. In: Detection and Modelling of Greenhouse Warming in theArctic and sub-Arctic, INTAS Project 97-1277,Technical Report onTask 1. Arctic and Antarctic Research Institute, St. Petersburg, Russia.
Alekseev, G.V., L.V. Bulatov and V.F. Zakharov, 2000. Freshwatermelting/freezing cycle in the Arctic Ocean. In: E.L. Lewis, E.P. Jones,P. Lemke,T.D. Prowse and P.Wadhams (eds.).The Freshwater Budgetof the Arctic Ocean, pp. 589–608. NATO Science Series, KluwerAcademic Publishers.
Alekseev, G.V., O.M. Johannessen, A.A. Korablev,V.V. Ivanov and D.V.Kovalevsky, 2001. Interannual variability in water masses in theGreenland Sea and adjacent areas. Polar Research, 20(2):201–208.
Alley, R.B., P.A. Mayewski,T. Sowers, M. Stuiver, K.C.Taylor and P.U.Clark, 1997. Holocene climatic instability: a prominent, widespreadevent 8200 years ago. Geology, 25:483–486.
AMAP, 1998.AMAP Assessment Report: Arctic Pollution Issues.ArcticMonitoring and Assessment Programme, Oslo, Norway, xii+859 pp.
Ambaum, M.H., B.J. Hoskins and D.B. Stephenson, 2001.ArcticOscillation or North Atlantic Oscillation? Journal of Climate,14:3495–3507.
Anda, E., O. Orheim and J. Mangerud, 1985. Late Holocene glaciervariations and climate at Jan Mayen. Polar Research, 3:129–140.
Anisimov, O.A., N.I. Shiklomanov and F.E. Nelson, 1997. Effects ofglobal warming on permafrost and active layer thickness: resultsfrom transient general circulation models. Global and PlanetaryChange, 61:61–77.
Arctic Climatology Project, 2000. Environmental Working Group ArcticMeteorology and Climate Atlas. F. Fetterer and V. Radionov (eds.).National Snow and Ice Data Center, Boulder, Colorado. CD-ROM.
Armstrong, R.L. and M.J. Brodzik, 2001. Recent northern hemispheresnow extent: A comparison of data derived from visible andmicrowave satellite sensors. Geophysical Research Letters,28:3673–3676.
Barnekow, L. and P. Sandgren, 2001. Palaeoclimate and tree-line changesduring the Holocene based on pollen and plant macrofossil recordsfrom six lakes at different altitudes in northern Sweden. Review ofPalaeobotany and Palynology, 117:109–118.
Barry, R.G. and M.C. Serreze, 2000.Atmospheric components of theArctic Ocean freshwater balance and their interannual variability.In: E.L. Lewis, E.P. Jones, P. Lemke,T.D. Prowse and P.Wadhams(eds.).The Freshwater Budget of the Arctic Ocean, pp. 345–351.NATO Science Series, Kluwer Academic Publishers.
Belkin, I.M., S. Levitus, J. Antonov and S.-A. Malmberg, 1998. Greatsalinity anomalies in the North Atlantic. Progress in Oceanography,41:1–68.
Bell,T., 1996.The last glaciation and sea level history of FosheimPeninsula, Ellesmere Island, Canadian High Arctic. Canadian Journal ofEarth Sciences, 33:1075–1086.
Beltaos, S., 2002. Effects of climate on mid-winter ice jams. HydrologicalProcesses, 16:789–804.
Berger, A. and M.F. Loutre, 1991. Insolation values for the climate of thelast 10 million years. Quaternary Science Reviews, 10:297–317.
Boenisch, G., J. Blindheim, J.L. Bullister, P. Schlosser and D.W.R.Wallace,1997. Long term trends of temperature, salinity, density and transienttracers in the central Greenland Sea. Journal of Geophysical Research,102(C8):18553–18571.
Bond, G.C. and R. Lotti, 1995. Iceberg discharges into the North Atlanticon millennial timescales during the last glaciation. Science,267:1005–1010.
Bond, G.C.,W. Broecker, S. Johnsen, J. McManus, L. Labeyrie, J. Jouzeland G. Bonani, 1993. Correlations between climate records fromNorth Atlantic sediments and Greenland ice. Nature, 365:143–147.
Bond, G.C.,W. Showers, M. Cheseby, R. Lotti, P. Almasi, P. deMenocal,P. Priore, H. Cullen, I. Hajdas and G. Bonani, 1997. A pervasivemillennial-scale cycle in North Atlantic Holocene and glacial cli-mates. Science, 278:1257–1266.
Bond, G., B. Kromer, J. Beer, R. Muscheler, M.N. Evans,W. Showers,S. Hoffmann, R. Lotti-Bond, I. Hajdas and G. Bonani, 2001. Persistentsolar influence on North Atlantic climate during the Holocene.Science, 294:2130–2136.
Bourgeois, J.C., R.M. Koerner, K. Gajewski and D.A. Fisher, 2000.A Holocene ice-core pollen record from Ellesmere Island, Nunavut,Canada. Quaternary Research, 54:275–283.
Bourke, R.H. and R.P. Garrett, 1987. Sea ice thickness distribution in theArctic Ocean. Cold Regions Science and Technology, 13:259–280.
Bradley, R.S., 1985. Quaternary Paleoclimatology: Methods ofPaleoclimatic Reconstruction. Allen & Unwin, 490pp.
Bradley, R.S., 1990. Holocene paleoclimatology of the Queen ElizabethIslands, Canadian high Arctic. Quaternary Science Reviews,9:365–384.
56 Arctic Climate Impact Assessment
Bradley, R.S., 1999. Paleoclimatology: Reconstructing Climates of theQuaternary. Academic Press, 610pp.
Bradley, R.S. and P.D. Jones, 1993.‘Little Ice Age’ summer temperaturevariations: their nature and relevance to recent global warming trends.The Holocene, 3:367–376.
Briffa, K.R., P.D. Jones,T.S. Bartholin, D. Eckstein, F.H. Schweingruber,W. Karlén, P. Zetterberg and M. Eronen, 1992. Fennoscandian sum-mers from AD 500: temperature changes on short and long timescales.Climate Dynamics, 7:111–119.
Briffa, K.R., P.D. Jones, F.H. Schweingruber, S.G. Shiyatov and E.R.Cook, 1995. Unusual twentieth-century summer warmth in a 1,000-year temperature record from Siberia. Nature, 376:156–159.
Brigham-Grette, J. and D.M. Hopkins, 1995. Emergent marine record andpaleoclimate of the last interglaciation along the Northwest AlaskanCoast. Quaternary Research, 43:159–173.
Brigham-Grette, J., L.M. Gualtieri, O.Y. Glushkova,T.D. Hamilton, D.Mostoller and A. Kotov, 2003. Chlorine-36 and 14C chronology supporta limited last glacial maximum across central Chukotka, northeasternSiberia, and no Beringian ice sheet. Quaternary Research, 59:386–398.
Broecker,W.S., 1997.Thermohaline circulation, the Achilles heel of ourclimate system:Will man-made CO2 upset the current balance?Science, 278:1582–1588.
Broecker,W.S., 2000.Was a change in thermohaline circulation responsi-ble for the Little Ice Age? Proceedings of the National Academy ofSciences, 97:1339–1342.
Broecker,W.S., G. Bond and M.A. Klas, 1990. A salt oscillator in the gla-cial Atlantic? 1: the concept. Paleoceanography, 5:469–477.
Brown, J., K.M. Hinkel and F.E. Nelson, 2000.The Circumpolar ActiveLayer Monitoring (CALM) program: Research designs and initialresults. Polar Geography, 24(3):165–258.
Brown, R.D., 2000. Northern Hemisphere snow cover variability andchange, 1915–97. Journal of Climate, 13:2339–2355.
Brown, R.D. and P. Coté, 1992. Interannual variability of landfast ice thick-ness in the Canadian High Arctic, 1950–89.Arctic, 45(3):273–284.
Burenhult, G. (ed.), 1999. Arkeologi i Norden,Volume 1. Natur ochKultur, Stockholm, 540pp.
Calkin, P.E., 1988. Holocene glaciation of Alaska (and adjoining YukonTerritory, Canada). Quaternary Science Reviews, 7:159–184.
Calkin, P.E., G.C.Wiles and D.J. Barclay, 2001. Holocene coastal glacia-tion of Alaska. Quaternary Science Reviews, 20:449–461.
Carey, S.K. and M.-K.Woo, 1999. Hydrology of two slopes in subarcticYukon, Canada. Hydrological Processes, 13:2549–2562.
Carmack, E.C., R.W. Macdonald, R.G. Perkin, F.A. McLaughlin and R.J.Pearson, 1995. Evidence for warming of Atlantic water in the southernCanadian Basin of the Arctic Ocean: results from the Larsen-93 expe-dition. Geophysical Research Letters, 22(9):1061–1064.
Carmack, E.C., K. Aagaard, J.H. Swift, R.W. Macdonald, F.A.McLaughlin, E.P. Jones, R.G. Perkin, J.N. Smith, K.M. Ellis and L.R.Killius, 1997. Changes in temperature and tracer distributions withinthe Arctic Ocean: Results from the 1994 Arctic Ocean section. Deep-Sea Research II, 44:1487–1502.
Cavalieri, D.J. and S. Martin, 1994.The contribution of Alaskan, Siberianand Canadian coastal polynyas to the cold halocline layer of the ArcticOcean. Journal of Geophysical Research, 99(C9):18343–18362.
Cavalieri, D.J., P. Gloersen, C.L. Parkinson, J.C. Comiso and H.J. Zwally,1997. Observed hemispheric asymmetry in global sea ice changes.Science, 278:1104–1106.
Cayan, D.R., S. Kammerdiener, M.D. Dettinger, J.M. Caprio and D.H.Peterson, 2001. Changes in the onset of spring in the western UnitedStates. Bulletin of the American Meteorological Society, 82:399–416.
Chapman,W.L. and J.E.Walsh, 2003. Observed climate change in theArctic, updated from Chapman and Walsh, 1993. Recent variations ofsea ice and air temperatures in high latitudes. Bulletin of the AmericanMeteorological Society, 74(1):33–47. http://arctic.atmos.uiuc.edu/CLIMATESUMMARY/2003/
Clark, P.U. and A.C. Mix, 2000. Global change: Ice sheets by volume.Nature, 406:689–690.
COHMAP Members, 1988. Climatic changes of the last 18,000 years:observations and model simulations. Science, 241:1043–1052.
Comiso, J.C., 2002.A rapidly declining perennial sea ice cover in theArctic. Geophysical Research Letters, 29(20):1956, doi:10.1029/2002GL015650.
Comiso, J., 2003.Warming trends in the Arctic from clear sky satelliteobservations. Journal of Climate, 16:3498–3510.
Cortijo, E., J. Duplessy, L. Labeyrie, H. Leclaire, J. Duprat and T. vanWeering, 1994. Eemian cooling in the Norwegian Sea and NorthAtlantic ocean preceding ice-sheet growth. Nature, 372:446–449.
Crowley,T.J. and T. Lowery, 2000. How warm was the Medieval warmperiod? Ambio, 29:51–54.
Cuffey, K.M. and S.J. Marshall, 2000. Substantial contribution to sea-level rise during the last interglacial from the Greenland ice sheet.Nature, 404:591–594.
Dahl-Jensen, D., K. Mosegaard, N. Gunderstrup, G.D. Clow, S.J. Johnsen,A.W. Hansen and N. Balling, 1998. Past temperatures directly from theGreenland ice sheet. Science, 282:268–271.
Dansgaard,W., J.W.White and S.J. Johnsen, 1989.The abrupt terminationof the Younger Dryas climate event. Nature, 339:532–534.
Dansgaard,W., S.J. Johnsen, H.B. Clausen, D. Dahl-Jensen, N.S.Gundestrup, C.U. Hammer, C.S. Hvidberg, J.P. Steffensen, A.E.Sveinbjörnsdottir, J. Jouzel and G. Bond, 1993. Evidence for generalinstability of past climate from a 250-kyr ice-core record. Nature,364:218–220.
Davis, B.A.S., S. Brewer,A.C. Stevenson, J. Guiot and Data Contributors,2003.The temperature of Europe during the Holocene reconstructedfrom pollen data, Quaternary Science Reviews, 22:1701–1716.
Deser, C., 2000. On the teleconnectivity of the ‘Arctic Oscillation’.Geophysical Research Letters, 27:779–782.
Deser, C., J.E.Walsh and M.S.Timlin, 2000. Arctic sea ice variability inthe context of recent atmospheric circulation trends. Journal ofClimate, 13:617–633.
Dickson, R.R., J. Meincke, S.-A. Malmberg and A.J. Lee, 1988.The‘Great Salinity Anomaly’ in the Northern North Atlantic 1968–1982.Progress in Oceanography, 20:103–151.
Dickson, R.R.,T.J. Osborn, J.W. Hurrell, J. Meincke, J. Blindheim,B. Adlandsvik,T.Vinje, G. Alekseev and W. Maslowski, 2000.The Arctic Ocean response to the North Atlantic Oscillation.Journal of Climate, 13:2671–2696.
Dickson, R.R., I.Yashayaev, J. Meincke, B.Turrell, S. Dye and J. Holfort,2002. Rapid freshening of the deep North Atlantic Ocean over the pastfour decades. Nature, 416:832–837.
Drinkwater, K.F., 1994. Climate and oceanographic variability in theNorthwest Atlantic during 1980s and early 1990s, NAFO ScientificCouncil Research Document 94/71. Northwest Atlantic FisheriesOrganization, Dartmouth, Nova Scotia, Canada, 39pp.
Dugmore, A.J., 1989.Tephrachronological studies of Holocene glacierfluctuations in south Iceland. In: J. Oerlemans (ed.). GlacierFluctuations and Climatic Change, pp. 37–55. Kluwer AcademicPublishers.
Dyke, A.S., J. Hooper and J.M. Savelle, 1996. A history of sea ice in theCanadian Arctic Archipelago based on postglacial remains of the bow-head whale (Balaena mysticetus). Arctic, 49(3):235–255.
Dyke, A.S., J. Hooper, C.R. Harington and J.M. Savelle, 1999.The LateWisconsinan and Holocene record of walrus (Odobenus rosmarus) fromNorth America: a review with new data from Arctic and AtlanticCanada.Arctic, 52(2):160–181.
Dyke, A.S., J.T. Andrews, P.U. Clark, J.H. England, G.H. Miller, J. Shawand J.J.Veillette, 2002.The Laurentide and Innuitian ice sheets duringthe Last Glacial Maximum. Quaternary Science Reviews, 21:9–31.
Easterling, D.R., B. Horton, P.D. Jones,T.C. Peterson,T.R. Karl, D.E.Parker, M.J. Salinger,V. Razuvayev, N. Plummer, P. Jamason and C.K.Folland, 1997. Maximum and minimum temperature trends for theglobe. Science, 277:364–367.
Eronen, M., P. Zetterberg, K.R. Briffa, M. Lindholm, J. Meriläinen andM.Timonen, 2002.The supra-long Scots pine tree-ring record forFinnish Lapland: Part 1, chronology construction and initial inferences.The Holocene, 12(6):673–680.
Fedorova, Z.P. and Z.S.Yankina, 1964.The passage of Pacific Ocean waterthrough the Bering Strait into the Chukchi Sea. Deep-Sea Research andOceanographic Abstracts, 11:427–434.
Fissel, D.B. and H. Melling, 1990. Interannual variability of oceanographicconditions in the southeastern Beaufort Sea. Canadian ContractorReport of Hydrography and Ocean Sciences No 35. Institute of OceanSciences, Sidney, British Columbia, Canada, 102pp.
Førland, E.J. and I. Hanssen-Bauer, 2000. Increased precipitation in theNorwegian Arctic:True or False? Climatic Change, 46:485–509.
Førland, E.J and I. Hanssen-Bauer, 2003. Past and future climate variationsin the Norwegian Arctic: overview and novel analyses. Polar Research,22(2):113–124.
Førland, E.J., I. Hanssen-Bauer and P. Nordli, 1997. Climate Statistics andLong-termTime Series of Temperature and Precipitation at Svalbard andJan Mayen. Norwegian Meteorological Institute Report 21/97, 72pp.
Frich, P., L.V. Alexander, P. Della-Marta, B. Gleason, M. Haylock,A.M.G.Klein Tank and T. Peterson, 2002. Observed coherent changes in cli-matic extremes during the second half of the twentieth century.Climate Research, 19:193–212.
Fronval,T. and E. Jansen, 1997. Eemian and early Weichselian (140–60 ka)paleoceanography and paleoclimate in the Nordic seas with compar-isons to Holocene conditions. Paleoceanography, 12(3):443–462.
Fukuda, M., 1994. Methane flux from thawing Siberian permafrost(ice complexes) results from field observations. EOS,Transactions ofthe American Geophysical Union, 75:86.
Fyfe, J.C., 2003. Separating extratropical zonal wind variability and meanchange. Journal of Climate, 16:863–874.
Chapter 2 • Arctic Climate: Past and Present 57
Fyfe, J.C., G.J. Boer and G.M. Flato, 1999.The Arctic and Antarctic oscil-lations and their projected changes under global warming. GeophysicalResearch Letters, 26:1601–1604.
Gajewski, K., R.Vance, M. Sawada, I. Fung, L.D. Gignac, L. Halsey, J.Johm, P. Maisongrande, P. Mandell, P.J. Mudie, P.J.H. Richard, A.G.Sherin, J. Soroko and D.H.Vitt, 2000.The climate of North Americaand adjacent ocean waters ca. 6 ka. Canadian Journal of EarthSciences, 37:661–681.
Ganopolski, A. and S. Rahmstorf, 2001. Rapid changes of glacial climatesimulated in a coupled climate model. Nature, 409:153–158.
Gasse, F. and E. van Campo, 1994. Abrupt post-glacial events in west Asiaand North Africa monsoon domains. Earth and Planetary ScienceLetters, 126:453–456.
Gillett, N.P., F.W. Zwiers,A.J.Weaver and P.A. Stott, 2003. Detection ofhuman influence on sea-level pressure. Nature, 422:292–294.
Goodison, B.E., P.Y.T. Louie and D.Yang, 1998.WMO Solid PrecipitationIntercomparison, Final Report. Instruments and Observing MethodsReport 67,WMO/TD 872.World Meteorological Organization,Geneva, 87pp. + Annexes.
Goosse, H. and H. Renssen, 2003. Simulating the evolution of the Arcticclimate during the last millennium. In: Proceedings of the SeventhConference on Polar Meteorology and Oceanography and JointSymposium on High-Latitude Climate Variations, May 12–16, 2003,Hyannis, Massachusetts,Abstract 1.5.American Meteorological Society.
Gorshkov, S.G. (ed.), 1980. Atlas of the Oceans. Arctic Ocean. USSRMinistry of Defense,Voenno-Morskoy Flot., Moscow, 199pp.
Grody, N.C. and A.N. Basist, 1996. Global identification of snowcoverusing SSM/I measurements. IEEE Transactions on Geoscience andRemote Sensing, 34:237–249.
Groisman, P.Ya. and E.Ya. Rankova, 2001. Precipitation trends over theRussian permafrost-free zone: removing the artifacts of pre-processing.International Journal of Climatology, 21:657–678.
Groisman, P.Ya.,V.V Koknaeva,T.A. Belokrylova and T.R. Karl, 1991.Overcoming biases of precipitation: a history of the USSR experience.Bulletin of the American Meteorological Society, 72:1725–1733.
Groisman, P.Ya.,T.R. Karl and T.W. Knight, 1994. Observed impact ofsnow cover on the heat balance and the rise of continental spring tem-peratures. Science, 263:198–200.
Groisman, P.Ya.,T.R. Karl, D.R. Easterling, R.W. Knight, P.B. Jamason,K.J. Hennessy, R. Suppiah, C.M. Page, J.Wibig, K. Fortuniak,V.N.Razuvaev, A. Douglas, E. Førland and P.-M. Zhai, 1998. Heavy rainfallin a changing climate. In: Proceedings of the Ninth Symposium onGlobal Change Studies, 11–16 January, 1998, Phoenix,Arizona, pp.j5–j10.American Meteorological Society.
Groisman, P.Ya.,T.R. Karl, D.R. Easterling, R.W. Knight, P.B. Jamason,K.J. Hennessy, R. Suppiah, Ch.M. Page, J.Wibig, K. Fortuniak,V.N.Razuvaev,A. Douglas, E. Førland and P.-M. Zhai, 1999a. Changes inthe probability of heavy precipitation: Important indicators of climaticchange. Climatic Change, 42(1):243–283.
Groisman, P.Ya., E.L. Genikhovich, R.S. Bradley and B.-M. Sun, 1999b.Trends in turbulent heat fluxes over Northern Eurasia. In: M.Tranter,R. Armstrong, E. Brun, G. Jones, M. Sharp and M.Williams (eds.).Interactions Between the Cryosphere, Climate and Greenhouse Gases,pp. 19–25. Proceedings of the International Union of Geodesy andGeophysics 1999 Symposium HS2, Birmingham, UK, July 1999.International Association of Hydrological Sciences Publication No.256. IAHS Press.
Groisman, P.Ya., R.W. Knight and T.R. Karl, 2002.Very heavy precipita-tion over land: estimates based on a new global daily precipitation dataset. In: Proceedings of the 13th Symposium on Global Change Studies,Orlando, Florida, 13–17 January, 2002, pp. 88–90.AmericanMeteorological Society.
Groisman, P.Ya., B. Sun, R.S.Vose, J.H. Lawrimore, P.H.Whitfield, E.Førland, I. Hanssen-Bauer, M.C. Serreze,V.N. Razuvaev and G.V.Alekseev, 2003. Contemporary climate changes in high latitudes of thenorthern hemisphere: daily time resolution. In: Proceedings of the14th AMS Symposium on Global Change and Climate Variations.CD-ROM with Proceedings of the Annual Meeting of the AmericanMeteorological Society, Long Beach, California, 9–13 February, 2003.American Meteorological Society, 10pp.
Grosswald, M.G. and T.J. Hughes, 2002.The Russian component of anArctic ice sheet during the Last Glacial Maximum. Quaternary ScienceReviews, 21:121–146.
Grotefendt, K., K. Logemann, D. Quadfasel and S. Ronski, 1998. Is theArctic Ocean warming? Journal of Geophysical Research,103(C12):27679–27687.
Grove, J.M., 1988.The Little Ice Age. Methuen, London, 498pp.Grudd, H., K.R. Briffa,W. Karlén,T.S. Bartholin, P.D. Jones and B.
Kromer, 2002. A 7400-year tree-ring chronology in northern SwedishLapland: natural climatic variability expressed on annual to millennialtimescales.The Holocene, 12(6):657–666.
Hakkinen, S., 1993. An Arctic source for the Great Salinity Anomaly: asimulation of the Arctic ice-ocean system for 1955–1975. Journal ofGeophysical Research, 98(C9):16397–16410.
Hansen, B.,W.R.Turrell and S. Østerhus, 2001. Decreasing overflow fromthe Nordic Seas into the Atlantic Ocean through the Faroe BankChannel since 1950. Nature, 411:927–930.
Hanssen-Bauer, I. and E.J. Førland, 1998. Long-term trends in precipita-tion and temperature in the Norwegian Arctic: can they be explainedby changes in atmospheric circulation patterns? Climate Research,19:143–153.
Hanssen-Bauer, I., E.J. Førland, O.E.Tveito and P.O. Nordli, 1997.Estimating regional trends – comparisons of two methods. NordicHydrology, 28:21–36.
Hantemirov, R.M. and S.G. Shiyatov, 2002. A continuous multimillennialring-width chronology in Yamal, northwestern Siberia.The Holocene,12(6):717–726.
Hardy, D.R. and R.S. Bradley, 1996. Climatic change in Nunavut.Geoscience Canada, 23:217–224.
Helama, S., M. Lindholm, M.Timonen, J. Meriläinen and M. Eronen,2002.The supra-long Scots pine tree-ring record for Finnish Lapland:Part 2, interannual to centennial variability in summer temperaturesfor 7500 years.The Holocene, 12(6):681–687.
Heusser, C.J., 1995. Late Quaternary vegetation response to climatic-glacial forcing in North Pacific America. Physical Geography,16:118–149.
Hoerling, M.P., J.W. Hurrell and T. Xu, 2001.Tropical origins for recentNorth Atlantic climate change. Science, 292:90–92.
Holloway, G. and T. Sou, 2001. Has Arctic sea ice rapidly thinned? Journalof Climate, 15:1692–1701.
Hughes, M.K. and H.F. Diaz, 1994.Was there a ‘Medieval Warm Period’and if so, where and when? Climatic Change, 265:109–142.
Imbrie, J. and K.P. Imbrie, 1979. Ice Ages: Solving the Mystery. HarvardUniversity Press, 224pp.
Imbrie, J., A. Berger, E.A. Boyle, S.C. Clemens, A. Duffy,W.R. Howard,G. Kukla, J. Kutzbach, D.G. Martinson, A. McIntyre, A.C. Mix, B.Molfino, J.J. Morley, L.C. Peterson, N.G. Pisias,W.L. Prell, M.E.Raymo, N.J. Shackleton and J.R.Toggweiler, 1993a. On the structureand origin of major glaciation cycles. 2:The 100,000 year cycle.Paleoceanography, 8:699–735.
Imbrie, J., A. Berger and N.J. Shackleton, 1993b. Role of orbital forc-ing: a two-million-year perspective. In: J.A. Eddy and H. Oeschger(eds.). Global Changes in the Perspective of the Past, pp. 263–277.John Wiley.
Ingolfsson, O., S. Björck, H. Haflidason and M. Rundgren, 1997. Glacialand climatic events in Iceland reflecting regional North Atlantic climat-ic shifts during the Pleistocene-Holocene transition. QuaternaryScience Reviews, 16:1135–1144.
IPCC, 2001a. Climate Change 2001: Impacts, Adaptation, andVulnerability. Contribution of Working Group II to the ThirdAssessment Report of the Intergovernmental Panel on ClimateChange. McCarthy, J.J., O.F. Canziani, N.A. Leary, D.J. Dokken andK.S.White (eds.). Cambridge University Press, 1032 pp.
IPCC, 2001b. Climate Change 2001: Synthesis Report.A Contribution ofWorking Groups I, II, and III to the Third Assessment Report of theIntergovernmental Panel on Climate Change.Watson, R.T., and theCoreWriting Team (eds.). Cambridge University Press, 398 pp.
IPCC, 2001c. Climate Change 2001:The Scientific Basis. Contribution ofWorking Group I to the Third Assessment Report of theIntergovernmental Panel on Climate Change. Houghton, J.T.,Y. Ding,D.J. Griggs, M. Noguer, P.J. van der Linden, X. Dai, K. Maskell andC.A. Johnson (eds.) Cambridge University Press, 881 pp.
Isaksen, K., P. Holmlund, J.L. Sollid and C. Harris, 2001.Three deepalpine-permafrost boreholes in Svalbard and Scandinavia. Permafrostand Periglacial Processes, 12:13–25.
Ivanov,V.V., 2000. Akademik Fedorov Cruise. Arctic Climate SystemStudy, ACSYS Arctic Forecast, 2:2–3.Tromsø.
Johannessen, O.M., E. Shalina and M. Miles, 1999. Satellite evidence foran Arctic sea ice cover in transformation. Science, 286:1937–1939.
Johannessen, O.M., L. Bengtsson, M.W. Miles, S.I. Kuzmina,V.A.Semenov, G.V.Alekseev,A.P. Nagurnyi,V.F. Zakharov, L.P. Bobylev,L.H. Pettersson, K. Hasselmann and H.P. Cattle, 2004. Arctic climatechange: observed and modelled temperature and sea-ice variability.Tellus A, 56:328–341.
Johnsen, S.J., D. Dahl-Jensen, N. Gunderstrup, J.P. Steffensen, H.B.Clausen, H. Miller,V. Masson-Delmotte, A.E. Sveinbjornsdottir andJ.White, 2001. Oxygen isotope and palaeotemperature recordsfrom six Greenland ice-core stations: Camp Century, Dye-3, GRIP,GISP, Renland and NorthGRIP. Journal of Quaternary Science,16:299–307.
58 Arctic Climate Impact Assessment
Jonasson, S.E., G.R. Shaver and F.S. Chapin III, 2001. Biogeochemistryin the Arctic: patterns, processes and controls. In: E.D. Schulze, M.Heimann, S.P. Harrison, E.A. Holland, J.J. Lloyd, I.C. Prentice andD. Schimel (eds.). Global Biogeochemical Cycles in the ClimateSystem, pp. 139–150. Academic Press.
Jones, P.D. and A. Moberg, 2003. Hemispheric and large-scale surface airtemperature variations: an extensive revision and an update to 2001.Journal of Climate, 16:206–223.
Jones, P.D., P.Ya. Groisman, M. Coughlan, N. Plummer,W.C.Wang andT.R. Karl, 1990. Assessment of urbanization effects in time series ofsurface air temperature over land. Nature, 347:169–172.
Jones, P.D., K.R. Briffa,T.P. Barnett and S.B.Tett, 1998. High-resolutionpalaeoclimatic records for the last millennium: interpretation, integra-tion and comparison with General Circulation Model control run tem-peratures.The Holocene, 8:455–471.
Jones P.D., M. New, D.E. Parker, S. Martin and I.G. Rigor, 1999.Surface air temperature and its changes over the past 150 years.Reviews of Geophysics, 37(2):173–199.
Jorgenson, M.T., C.H. Racine, J.C.Walters and T.E. Osterkamp, 2001.Permafrost degradation and ecological changes associated with awarming climate in central Alaska. Climatic Change, 48:551–579.
Kalnay, E.M., M. Kanamitsu, R. Kistler,W. Collins, D. Deaven, L. Gandin,M. Iredell, S. Saha, G.White, J.Woollen,Y. Zhu, A. Leetmaa, B.Reynolds, M. Chelliah,W. Ebisuzaki,W. Higgins, J. Janowiak, K.C.Mo, C. Ropelewski, J.Wang, R. Jenne and D. Joseph, 1996.TheNCEP/NCAR Reanalysis Project. Bulletin of the AmericanMeteorological Society, 77:437–471.
Kane, D.L., L.D. Hinzman, C.S. Benson and K. R. Everett, 1989.Hydrology of Imnavait Creek, an arctic watershed. HolarcticEcology, 12:262–269.
Karl,T.R., R.G. Quayle and P.Ya. Groisman, 1993. Detecting climate vari-ations and change: new challenges for observing and data managementsystems. Journal of Climate, 6:1481–1494.
Karlén,W., 1988. Scandinavian glacial and climate fluctuations during theHolocene. Quaternary Science Reviews 7:199–209.
Karlén,W. and J. Kuylenstierna, 1996. On solar forcing of Holocene cli-mate: evidence from Scandinavia.The Holocene, 6:359–365.
Karoly, D.J., K. Braganza, P.A. Stott, J.M. Arblaster, G.A. Meehl, A.J.Broccoli and K.W. Dixon, 2003. Detection of a human influence onNorth American climate. Science, 302:1200–1203.
Karpuz, N., E. Jansen and H. Haflidason, 1993. Paleoceanographic recon-struction of surface ocean conditions in the Greenland, Iceland andNorwegian Seas through the last 14 ka based on diatoms. QuaternaryScience Reviews, 12:115–140.
Keigwin, L.D. and R.S. Pickart, 1999. Slope water current over theLaurentian Fan on interannual to millennial time scales. Science,286:520–523.
Keigwin, L.D.,W.B. Curry, S.J. Lehman and S. Johnson, 1994.The roleof North Atlantic climate change between 70 and 130 kyr ago.Nature, 371:323–326.
Kennett, J.P., K.G. Cannariato, I.L. Hendy and R.J. Behl, 2000. Carbonisotopic evidence for methane hydrate instability during Quaternaryinterstadials. Science, 288:128–133.
Khrol,V.P. (ed.), 1992. Atlas of the Energy Budget of the Northern PolarRegion. Gidrometeoizdat, St. Petersburg, 52pp.
Koerner, R.M. and D.A. Fisher, 1990. A record of Holocene summer cli-mate from a Canadian high-Arctic ice core. Nature, 343:630–631.
Korhola,A., K.Vasko, H.T.Toivonen and H. Olander, 2002. Holocenetemperature changes in northern Fennoscandia reconstructed fromchironomids using Bayesian modeling. Quaternary Science Reviews,21:1841–1860.
Krasovskaia, I. and N.R. Saelthun, 1997. Sensitivity of the stability ofScandinavian river flow regimes to a predicted temperature rise.Hydrological Sciences, 42:693–711.
Kuchment, L.S.,A.N. Gelfan and V.N. Demidov, 2000. A distributedmodel of runoff generation in the permafrost regions. Journal ofHydrology, 240:1–22.
Kugelmann, O., 1991. Dating recent glacier advances in the Svarfadardalur-Skidadalur area of northern Iceland by means of a new lichen curve.In: J.K. Maizels and C. Caseldine (eds.). Environmental Change inIceland: Past and Present, pp. 203–217. Kluwer Academic Publishers.
Kwok, R., 2000. Recent changes in Arctic Ocean sea ice motion associ-ated with the North Atlantic Oscillation. Geophysical ResearchLetters, 27:775–778.
Lang, C., M. Leuenberger, J. Schwander and J. Johnsen, 1999. 16 °Crapid temperature variation in central Greenland 70000 years ago.Science, 286:934–937.
Lee, S.E., M.C. Press and J.A. Lee, 2000. Observed climate variationsduring the last 100 years in Lapland, Northern Finland. InternationalJournal of Climatology, 20:329–346.
Loeng, H.,V. Ozhigin and B. Ådlandsvik, 1997.Water fluxes through theBarents Sea. ICES Journal of Marine Science, 54:310–317.
Lozhkin, A.V. and P.M. Anderson, 1995.The last interglaciation inNortheast Siberia. Quaternary Research, 43:47–158.
Lunardini,V.J., 1996. Climatic warming and the degradation of warmpermafrost. Permafrost and Periglacial Processes, 7:311–320.
MacDonald, G.M.,A.A.Velichko, C.V. Kremenetski, O.K. Borisova, A.A.Goleva, A.A. Andreev, L.C. Cwynar, R.T. Riding, S.L. Forman,T.W.D.Edwards, R. Aravena, D. Hammarlund, J.M. Szeicz and V.N. Gattaulin,2000. Holocene treeline history and climate change across northernEurasia. Quaternary Research, 53:302–311.
Macdonald, R.W., F.A. McLaughlin and E.C. Carmack, 2002. Fresh waterand its sources during the SHEBA drift in the Canada Basin of theArctic Ocean. Deep-Sea Research I, 49:1769–1785.
Malmberg, S.A. and J. Blindheim, 1994. Climate, cod and capelin innorthern waters. ICES Marine Science Symposia, 198:297–310.
Manabe, S., R.J. Stouffer, M.J. Spelman and K. Bryan, 1991.Transientresponse of a coupled ocean-atmosphere model to gradual changes ofatmospheric CO2. Part I. Annual mean response. Journal of Climate,4:785–818.
Mangerud, J.,V.Astakhov and J.-I. Svensen, 2002.The extent of theBarents-Kara ice sheet during the Last Glacial Maximum. QuaternaryScience Reviews, 21:111–119.
Mann, D.H. and T.L. Hamilton, 1995. Late Pleistocene and Holocenepaleoenvironments of the North Pacific coast. Quaternary ScienceReviews, 14:449–471.
Mann, M.E. and P.D. Jones, 2003. Global surface temperatures over thepast two millennia. Geophysical Research Letters, 30:1820–1824, doi:10.1029/2003GL017814.
Mann, M.E., R.S. Bradley and M.K. Hughes, 1999. Northern Hemispheretemperatures during the past millennium: inferences, uncertainties,and limitations. Geophysical Research Letters, 26:759–762.
Mantua, N.J., S.R. Hare,Y. Zhang, J.M.Wallace and R.C. Francis, 1997.A Pacific decadal climate oscillation with impacts on salmon. Bulletinof the American Meteorological Society, 78:1069–1079.
Maslin, M.A., X.S. Li, M.-F. Loutre and A. Berger, 1998.The contributionof orbital forcing to the progressive intensification of northern hemi-sphere glaciation. Quaternary Science Reviews, 17:411–426.
Maslowski,W., B. Newton, P. Schlosser, A. Semtner and D. Martinson,2000. Modelling recent climate variability in the Arctic Ocean.Geophysical Research Letters, 27(22):3743–3746.
McCabe, G.J., M.P. Clark and M.C. Serreze, 2001.Trends in NorthernHemisphere surface cyclone frequency and intensity. Journal ofClimate, 14:2763–2768.
McLaughlin, F.A., E.C. Carmack, R.W. Macdonald and J.K. Bishop, 1996.Physical and geochemical properties across the Atlantic/Pacific watermass front in the southern Canadian Basin. Journal of GeophysicalResearch, 101(C1):1183–1197.
Mekis, E. and W.D. Hogg, 1999. Rehabilitation and analysis of Canadiandaily precipitation time series. Atmosphere-Ocean, 37:53–85.
Melling, H., 1993.The formation of a haline shelf front in an ice-coveredarctic sea. Continental Shelf Research, 13:1123–1147.
Melling, H., 2000. Exchanges of freshwater through the shallow straits ofthe North American Arctic. In: E.L. Lewis, E.P. Jones, P. Lemke,T.D.Prowse and P.Wadhams (eds.).The Freshwater Budget of the ArcticOcean. Proceedings of a NATO Advanced Research Workshop,Tallinn,Estonia, April 1998, pp. 479–502. Kluwer Academic Publishers.
Melling, H., 2002. Sea ice of the northern Canadian Arctic Archipelago.Journal of Geophysical Research, 107(C11):3181,doi:10.1029/2001JC001102.
Melling, H. and E.L. Lewis, 1982. Shelf drainage flows in the BeaufortSea and their effect on the Arctic Ocean pycnocline. Deep-SeaResearch A, 29:967–985.
Melling, H. and R.M. Moore, 1995. Modification of halocline sourcewaters during freezing on the Beaufort Sea shelf: Evidence from oxy-gen isotopes and dissolved nutrients. Continental Shelf Research,15(1):81–113.
Melling, H. and D.A. Riedel, 1996. Development of seasonal pack ice inthe Beaufort Sea during the winter of 1991–92:A view from below.Journal of Geophysical Research, 101(C5):11975–11992.
Melling, H.,Y. Gratton and G. Ingram, 2001. Ocean circulation withinthe North Water Polynya of Baffin Bay. Atmosphere-Ocean,39(3):301–325.
Metcalfe, R.A. and J.M. Buttle, 1999. Semi-distributed water balancedynamics in a small boreal forest basin. Journal of Hydrology,226:66–87.
Milankovitch, M., 1941. Canon of insolation and the ice age problem.Special Publication 132, Koniglich Serbische Akademie, Belgrade.(English translation by the Israel Program for Scientific Translations,Jerusalem, 1969).
Miller, G.H. and A. de Vernal, 1992.Will greenhouse warming lead toNorthern Hemisphere ice-sheet growth? Nature, 355:244–246.
Minobe, S., 1997. A 50–70 year climatic oscillation over the North Pacificand North America. Geophysical Research Letters, 24:683–686.
Chapter 2 • Arctic Climate: Past and Present 59
Monahan, A.H., J.C. Fyfe, and L. Pandolfo, 2003.The vertical structure ofwintertime climate regimes of the northern hemisphere extratropicalatmosphere. Journal of Climate, 16:2005–2021.
Morison, J., M. Steele and R. Andersen, 1998. Hydrography of the upperArctic Ocean measured from the nuclear submarine U.S.S. Pargo.Deep-Sea Research I, 45:15–38.
Moritz, R.E., C.M. Bitz and E.J. Steig, 2002. Dynamics of recent climatechange in the Arctic. Science, 297:1497–1501.
Mysak, L.A., 2001. Patterns of Arctic circulation. Science, 293:1269–1270.Mysak, L.A., D.K. Manak and R.F. Marsden, 1990. Sea ice anomalies
observed in the Greenland and Labrador Seas during 1901–1984 andtheir relation to an interceded Arctic Climate cycle. ClimateDynamics, 5:111–132.
Nansen, F., 1906. Northern waters: Captain Roald Amundsen’s oceano-graphic observations in the Arctic Seas 1901.Videnskabs-SelskabetsSkrifter, I, Matematisk-Naturvidenskabelig Klasse, No. 3, 145pp.
Naurzbaev, M.M., E.A.Vaganov, O.V. Sidorova and F.H. Schweingruber,2002. Summer temperatures in eastern Taimyr inferred from a 2427-year late-Holocene tree-ring chronology and earlier floating series.The Holocene, 12:727–736.
Nesje, A., Ø. Lie and S.O. Dahl, 2000. Is the North Atlantic Oscillationreflected in Scandinavian glacier mass balance records? Journal ofQuaternary Science, 15:587–601.
New, M., M.Todd, M. Hulme and P. Jones, 2001. Precipitation measure-ments and trends in the twentieth century. International Journal ofClimatology, 21:1899–1922.
Nikiforov,Ye.G. and A.O. Shpaikher, 1980. On the regular features of for-mation of large-scale oscillations of the hydrological regime of theArctic Ocean. Gidrometeoizdat, St. Petersburg, 269pp. (In Russian)
NRC, 2002. Abrupt Climate Change: Inevitable Surprises. NationalResearch Council, National Academy Press,Washington, D.C., 230 pp.
O’Brien, S., P.A. Mayewski, L.D. Meeker, D.A. Meese, M.S.Twickler andS.I.Whitlow, 1995. Complexity of Holocene climate as reconstructedfrom a Greenland ice core. Science, 270:1962–1964.
Ogilvie, A.E.J. and I. Jónsdóttir, 2000. Sea ice, climate, and Icelandic fish-eries in the eighteenth and nineteenth centuries. Arctic,53(4):383–394.
Osterkamp,T.E., 2003. A thermal history of permafrost in Alaska. In: M.Phillips, S. Springman and L.U. Arenson (eds.). Permafrost, pp.863–868. Swets & Zeitlinger, Lisse.
Osterkamp,T.E. and V.E. Romanovsky, 1999. Evidence for warming andthawing of discontinuous permafrost in Alaska. Permafrost andPeriglacial Processes, 10:17–37.
Overland, J.E. and A.T. Roach, 1987. Northward flow in the Bering andChukchi Seas. Journal of Geophysical Research, 92:7097–7105.
Overpeck, J., K. Hughen, D. Hardy, R. Bradley, R. Case, M. Douglas, B.Finney, K. Gajewski, C. Jacoby, A. Jennings, S. Lamoureux, A. Lasca,G. MacDonald, J. Moore, M. Retelle, S. Smith,A.Wolfe and G.Zielinski, 1997.Arctic environmental change of the last four centuries.Science, 278:1251–1256.
Parkinson, C.L., 2000. Recent trend reversals in Arctic sea ice extents:Possible connections to the North Atlantic Oscillation. PolarGeography, 24:1–12.
Parkinson, C.L., D.J. Cavalieri, P. Gloersen, H.J. Zwally and J.C. Comiso,1999. Arctic sea ice extents, areas, and trends, 1978–1996. Journal ofGeophysical Research, 104(C9):20837–20856.
Peterson,T.C., 2003. Assessment of urban versus rural in situ surface tem-peratures in the contiguous United States: no difference found. Journalof Climate, 16:2941–2959.
Peterson,T.C. and R.S.Vose, 1997. An overview of the Global HistoricalClimatology Network temperature database. Bulletin of the AmericanMeteorological Society, 78:2837–2849.
Peterson,T.C., K.P. Gallo, J. Livermore,T.W. Owen, A. Huang and D.A.McKittrick, 1999. Global rural temperature trends. GeophysicalResearch Letters, 26:329–332.
Pfister, C., 1999.Wetternachersage: 500 Jahre Klimavariationen undNaturkatastrophen 1496–1995. Paul Haupt, Bern, 304pp.
Polyakov, I.V. and M.A. Johnson, 2000. Arctic decadal and interdecadalvariability. Geophysical Research Letters, 27:4097–4100.
Polyakov, I.V., G.V. Alekseev, R.V. Bekryaev, U. Bhatt, R.L. Colony, M.A.Johnson,V.P. Karklin, A.P. Makshtas, D.Walsh and A.V.Yulin, 2002.Observationally based assessment of polar amplification of globalwarming. Geophysical Research Letters, 29(18):1878,doi:10.1029/2001GL011111.
Polyakov, I.V., G.V. Alekseev, R.V. Bekryaev, U.S. Bhatt, R. Colony, M.A.Johnson,V.P. Karklin, D.Walsh and A.V.Yulin, 2003a. Long-term icevariability in Arctic marginal seas. Journal of Climate,16(12):2078–2085.
Polyakov, I.V., R.V. Bekryaev, G.V. Alekseev, U.S. Bhatt, R.L. Colony,M.A. Johnson,A.P. Makshtas and D.Walsh, 2003b.Variability andtrends of air temperature and pressure in the maritime Arctic,1875–2000. Journal of Climate, 16:2067–2077.
Prowse,T.D. and S. Beltaos, 2002. Climatic control of river-ice hydrology:a review. Hydrological Processes, 16:805–822.
Quinton,W.L., D.M. Gray and P. Marsh, 2000. Subsurface drainage fromhummock-cover hillslopes in the Arctic tundra. Journal of Hydrology,237:113–125.
R-ArcticNET, 2003. A Regional, Electronic, Hydrographic Data Networkfor the Arctic Region. www.r-arcticnet.sr.unh.edu.
Ramsay, B.H., 1998.The interactive multi-sensor snow and ice mappingsystem. Hydrological Processes, 12:1537–1546.
Rasmussen,T.L., E.Thomsen, L.D. Labeyrie and T.C.E. van Weering,1996. Circulation changes in the Faeroe-Shetland Channel correlat-ing with cold events during the last glacial period (58–10 ka).Geology, 24:937–940.
Reimnitz, E., H. Eicken and T. Martin, 1995. Multiyear fast ice along theTaymyr Peninsula, Siberia. Arctic, 48(4):359–367.
Rind, D., R. Healy, C. Parkinson and D. Martinson, 1995.The role of seaice in 2xCO2 climate model sensitivity. Part I:The total influence ofsea ice thickness and extent. Journal of Climate, 8:449–463.
Rodwell, M.J., D.P. Rowell and C.K. Folland, 1999. Oceanic forcing ofthe wintertime North Atlantic Oscillation and European climate.Nature, 398:320–323.
Romanovskii, N.N. and H.W. Hubberten, 2001. Results of permafrostmodelling of the lowlands and shelf of the Laptev Sea Region, Russia.Permafrost and Periglacial Processes, 12:191–202.
Romanovsky,V.E. and T.E. Osterkamp, 2000. Effects of unfrozen water onheat and mass transport processes in the active layer and permafrost.Permafrost and Periglacial Processes, 11:219–239.
Romanovsky,V.E., D.O. Sergueev and T.E. Osterkamp, 2003.Temporalvariations in the active layer and near-surface permafrost tempera-tures at the long-term observatories in Northern Alaska. In: M.Phillips, S. Springman and L.U. Arenson (eds.). Permafrost, pp.989–994. Swets & Zeitlinger, Lisse.
Rosén, P., U. Segerstrom, L. Eriksson, I. Renberg and H.J.B. Birks, 2001.Holocene climate change reconstructed from diatoms, chironomids,pollen and near-infrared spectroscopy at an alpine lake (Sjuodjijaure) innorthern Sweden.The Holocene, 11:551–562.
Rossow,W.B. and R.A. Schiffer, 1999.Advances in understanding clouds fromISCCP. Bulletin of the American Meteorological Society, 80:2261–2287.
Rothrock, D.A.,Y.Yu and G.A. Maykut, 1999.Thinning of the Arctic sea-ice cover. Geophysical Research Letters, 26:3469–3472.
Rouse,W.R., 1998.A water balance model for a subarctic sedge fen andits application to climatic change. Climatic Change, 38:207–234.
Rouse,W.R., M.S.V. Douglas, R.E. Hecky, A.E. Hershey, G.W. Kling, L.Lesack, P. Marsh, M. McDonald, B.J. Nicholson, N.T. Roulet and J.P.Smol, 1997. Effects of climate change on the freshwaters of Arctic andsubArctic North America. Hydrological Processes, 11:873–902.
Ruddiman,W.F. and J.E. Kutzbach, 1990. Late Cenozoic plateau uplift andclimate change.Transactions of the Royal Society of Edinburgh: EarthSciences, 81:301–314.
Ruddiman,W.F. and A. McIntyre, 1981.The North Atlantic during thelast deglaciation. Palaeogeography, Palaeoclimatology, Palaeoecology,35:145–214.
Ruddiman,W.F., M.E. Raymo, D.G. Martinson, B.M. Clement andJ. Backman, 1989. Pleistocene evolution: Northern Hemisphere icesheets and North Atlantic Ocean. Paleoceanography, 4:353–412.
Rudels, B., E.P. Jones, L.G.Anderson and G. Kattner, 1994. On the inter-mediate depth waters of the Arctic Ocean. In: O.M. Johannessen, R.D.Muench and J.E. Overland (eds.).The Polar Oceans and their Role inShaping the Global Environment. Geophysical Monograph Series,85:33–46.American Geophysical Union.
Rudels, B., L.G.Anderson and E.P. Jones, 1996. Formation and evolutionof the surface mixed layer and halocline of the Arctic Ocean. Journal ofGeophysical Research, 101(C4):8807–8821.
Rudels, B., C. Darnel, J. Gunn and E. Zakharchuck, 1997. CTD observa-tions. In: E. Rachor (ed.). Scientific Cruise report of the ArcticExpedition ARK - XI/1 of RV ‘Polarstern’ in 1995. Berichte zurPolarforschung, 226:22–25.
Salvigsen, O., S.L. Forman and G.H. Miller, 1992.The occurrence of ther-mophilous mollusks on Svalbard during the Holocene and their paleo-climatic implications. Polar Research, 11:1–10.
Sarnthein, M., E. Jansen, M.Weinelt, M. Arnold, J.C. Duplessy,T. Johannessen, S. Jung, N. Koc, L. Labeyrie, M. Maslin, U. Pfaumannand H. Schulz, 1995.Variations in Atlantic surface ocean paleocean-ography, 50º–80º N: a time-slice record of the last 30,000 years.Paleoceanography, 10:1063–1094.
Schauer, U., B. Rudels, E.P. Jones, L.G.Anderson, R.D. Muench, G.Bjork, J.H. Swift,V. Ivanov and A.-M. Larsson, 2002. Confluence andredistribution of Atlantic Water in the Nansen, Amundsen and Makarovbasins. Annales Geophysicae, 20:257–273.
60 Arctic Climate Impact Assessment
Seierstad, J.,A. Nesje, S.O. Dahl and J.R. Simonsen, 2002. Holocene gla-cier fluctuations of Grovabreen and Holocene snow-avalanche activityreconstructed from lake sediments in Groningstolsvatnet, westernNorway.The Holocene, 12:211–222.
Seppälä, M., 1997. Piping causing thermokarst in permafrost, UngavaPeninsula, Quebec, Canada. Geomorphology, 20:313–319.
Serreze, M.C., F. Carse, R.G. Barry and J.C. Rogers, 1997. Icelandic Lowcyclone activity: climatological features, linkages with the NAO, andrelationships with recent changes in the northern hemisphere circula-tion. Journal of Climate, 10:453–464.
Serreze, M.C., J.E.Walsh, F.S. Chapin III,T. Osterkamp, M. Dyurgerov,V. Romanovsky,W.C. Oechel, J. Morison,T. Zhang and R.G. Barry,2000. Observational evidence of recent change in the northern highlatitude environment. Climatic Change, 46:159–207.
Severinghaus, J.P. and E. Brook, 1999. Abrupt climate change at the endof the last glacial period inferred from trapped air in polar ice.Science, 286:930–934.
Sexton, D.J., J.A. Dowdeswell, A. Solheim and A. Elverhøi, 1992. Seismicarchitecture and sedimentation in north-west Spitsbergen fjords.Marine Geology, 103:53–68.
Shiklomanov, I.A., A.I. Shiklomanov, R.B. Lammers, B.J. Peterson andC.J.Vörösmarty, 2000.The dynamics of river water inflow to theArctic Ocean. In: E.L. Lewis, E.P. Jones, P. Lemke,T.D. Prowse andP.Wadhams (eds.).The Freshwater Budget of the Arctic Ocean, pp.281–296. Kluwer Academic Publishers.
Shindell, D.T., R.L. Miller, G.A. Schmidt and L. Pandolfo, 1999.Simulation of recent northern winter climate trends by greenhouse-gasforcing. Nature, 399:452–455.
Smith, I.R., 1999. Late Quaternary glacial history of Lake Hazen Basinand eastern Hazen Plateau, northern Ellesmere Island, Nunavut,Canada. Canadian Journal of Earth Sciences, 36:1547–1565.
Snowball, I., P. Sandgren and G. Petterson, 1999.The mineral magneticproperties of an annually laminated Holocene lake-sediment sequencein northern Sweden.The Holocene, 9:353–362.
Steele,M.and T.Boyd,1998.Retreat of the cold halocline layer in the ArcticOcean. Journal of Geophysical Research,103(C5):10419–10435.
Steffansson, U., 1969.Temperature variation in the North Icelandic coastalarea during recent decades. JoKull, 19:18–28.
Stewart,T.G., 1988. Deglacial-Marine Sediments from ClementsMarkham Inlet, Ellesmere Island, N.W.T., Canada. Ph.D.Thesis.University of Alberta, 229pp.
Stigebrandt,A., 1984.The North Pacific: a global-scale estuary. Journal ofPhysical Oceanography, 14:464–470.
Stone, D.A.,A.J.Weaver and F.W. Zwiers, 2000.Trends in Canadianprecipitation intensity.Atmosphere-Ocean, 38:321–347.
Stott, P.A., G.S. Jones and J.F.B. Mitchell, 2003. Do models underesti-mate the solar contribution to recent climate change? Journal ofClimate, 16:4079–4093.
Stötter, J., 1991. New observations on the postglacial history ofTröllaskagi, northern Iceland. In: J.K. Maizels and C. Caseldine (eds.).Environmental Change in Iceland: Past and Present, pp. 181–192,Kluwer Academic Publishers.
Stötter, J., M.Wastl, C. Caseldine and T. Häberle, 1999. Holocene palaeo-climatic reconstruction in Northern Iceland: approaches and results.Quaternary Science Reviews, 18:457–474.
Sun, B., P.Ya. Groisman and I.I. Mokhov, 2001. Recent changes in cloud-type frequency and inferred increases in convection over the UnitedStates and the former USSR. Journal of Climate, 14:1864–1880.
Swift, J.H. and K. Aagaard, 1981. Seasonal transitions and water massformation in the Iceland and Greenland seas. Deep-Sea Research A,28:1107–1129.
Tabony, R.C., 1981. A principal component and spectral analysis ofEuropean rainfall. Journal of Climatology, 1:283–294.
Thompson, D.W.J. and J.M.Wallace, 1998.The Arctic Oscillation signa-ture in the wintertime geopotential height and temperature fields.Geophysical Research Letters, 25:1297–1300.
Thompson, D.W.J., J.M.Wallace and G.C. Hegerl, 2000. Annular modesin the extratropical circulation. Part II:Trends. Journal of Climate,13:1018–1036.
Treshnikov,A.F., 1959. Surface waters in the Arctic Basin. ProblemyArktiki, 7:5–14.
Tzedakis, C., 2003.Timing and duration of Last Interglacial conditions inEurope: A chronicle of a changing chronology. Quaternary ScienceReviews, 22(8–9):763–768.
Vaganov, E.A., K.R. Briffa, M.M. Naurzbaev, F.H. Schweingruber,S.G. Shiyatov and V.V. Shishov, 2000. Long-term climatic changes inthe arctic region of the Northern Hemisphere. Doklady EarthSciences, 375:1314–1317.
van Geel, B., J. Buurman and H.T.Waterbolk, 1996. Archaeological andpalaeoecological indications of an abrupt climate change in theNetherlands and evidence for climatological teleconnections around2650 BP. Journal of Quaternary Science, 11:451–460.
Vinje,T., 2001. Fram Strait ice fluxes and atmospheric circulation:1950–2000. Journal of Climate, 14:3508–3517.
Vinje,T., N. Nordlund and Å. Kvambekk, 1998. Monitoring ice thicknessin Fram Strait. Journal of Geophysical Research, 103(C5):10437–10450.
Visbeck, M.J., J. Fischer and F. Schott, 1995. Preconditioning theGreenland Sea for deep convection. Ice formation and ice drift. Journalof Geophysical Research, 100(C9):18489–18502.
Vörösmarty, C.J., L.D. Hinzman, B.J. Peterson, D.H. Bromwich, L.C.Hamilton, J. Morison,V.E. Romanovsky, M. Sturm and R.S.Webb,2001.The Hydrologic Cycle and Its Role in Arctic and GlobalEnvironmental Change: A Rationale and Strategy for Synthesis Study.Arctic Research Consortium of the U.S., Fairbanks,Alaska, 84pp.
Vorren,T.O. and J.S. Laberg, 1996. Late glacial air temperature, oceano-graphic and ice sheet interactions in the southern Barents Sea region.In: J.T. Andrews,W.E.N.Austin, H. Bergsten and A.E. Jennings (eds.).Late Quaternary Palaeoceanography of the North Atlantic Margins.Geological Society Special Publication, 111:303–321.
Vourlitis, G.L. and W.C. Oechel, 1996.The heat and water budgets in theactive layer of the arctic tundra at Barrow, Alaska. Journal ofAgricultural Meteorology, 52:293–300.
Wade, N.L., J. Martin and P.H.Whitfield, 2001. Hydrologic and climaticzonation of Georgia Basin, British Columbia. Canadian WaterResources Journal, 26:43–70.
Wadhams, P., 1997. Ice thickness in the Arctic Ocean: the statistical relia-bility of experimental data. Journal of Geophysical Research,102(C13):27951–27959.
Wadhams, P., 2001. Sea ice thinning in the Nansen Basin and GreenlandSea. Second Wadati Conference on Global Change and the PolarClimate, March 7–9, 2001,Tsukuba, Japan. Extended Abstracts, pp.17–21.
Walsh, J.E.,W.L. Chapman and T.L. Shy, 1996. Recent decrease of sealevel pressure in the Central Arctic. Journal of Climate, 9:480–488.
Wanner, H., C. Pfister, R. Bràzdil, P. Frich, K. Fruydendahl,T. Jonsson,J. Kington, H.H. Lamb, S. Rosenorn and E.Wishman, 1995.Wintertime European circulation patterns during the Late MaunderMinimum Cooling Period (1675–1704).Theoretical and AppliedClimatology, 51:167–175.
Webb, I., D.W.J.Thompson and J.E. Kutzbach, 1998. An introduction toLate Quaternary climates: data syntheses and model experiments.Quaternary Science Reviews, 17:465–471.
Whitfield, P.H. and A.J. Cannon, 2000. Recent climate moderated shifts inYukon territory. In: D.L. Kane (ed.). Proceedings of the AmericanWater Resources Association Spring Specialty Conference,WaterResources in Extreme Environments,Anchorage,Alaska, May 1–3,2000, pp. 257–262.
Wielicki, B.A., R.D. Cess, M.D. King, D.A. Randall and E.F. Harrison,1995. Mission to planet Earth: role of clouds and radiation in climate.Bulletin of the American Meteorological Society, 76:2125–2153.
Wijffels, S.E., R.W. Schmitt, H.L. Bryden and A. Stigebrandt, 1992.Transport of freshwater by the oceans. Journal of PhysicalOceanography, 22:155–162.
Williams, K.M., S.K. Short, J.T.Andrews, A.E. Jennings,W.N. Mode andJ.P.M. Syvitski, 1995.The Eastern Canadian Arctic at ca. 6 ka BP: atime of transition. Géographie physique et Quaternaire, 49:13–27.
Winsor, P., 2001. Arctic sea ice thickness remained constant during the1990s. Geophysical Research Letters, 28(6):1039–1041.
Winsor, P. and G. Björk, 2000. Polynya activity in the Arctic Ocean from1958–1997. Journal of Geophysical Research, 105(C4):8789–8803.
Woo, M.-K. and A. Ohmura, 1997.The Arctic Islands. In:W.G. Bailey,T.R. Oke and W.R. Rouse (eds.).The Surface Climates of Canada.Canadian Association of Geographers Series in Canadian Geography4:172–197.
Xu, C.-Y. and S. Halldin, 1997.The effect of climate change on river flowand snow cover in the NOPEX area simulated by a simple water bal-ance model. Nordic Hydrology, 28:273–282.
Young, M.A. and R.S. Bradley, 1984. Insolation gradients and the paleocli-matic record. In: A.L. Berger, J. Imbrie, J. Hays, G. Kukla and B.Saltzman (eds.). Milankovitch and Climate: Understanding theResponse to Astronomical Forcing, Part 2, pp. 707–713. D. Reidel.
Zakharov,V.F., 2003. Sea ice extent changes during XX century.Meteorology and Hydrology, 5:75–86 (in Russian).
Zhang,T., J.A. Heginbottom, R.G. Barry and J. Brown, 2000. Furtherstatistics on the distribution of permafrost and ground ice in theNorthern Hemisphere. Polar Geography, 24(2):126–131.
Zhang, X., K.D. Harvey,W.D. Hogg and T.R.Yuzyk, 2001.Trends inCanadian streamflow.Water Resources Research, 37:987–998.
Zwiers, F.W. and X. Zhang, 2003.Towards regional climate changedetection. Journal of Climate, 16:793–797.